Abstract
Complex stimuli and tasks elicit particular eye movement sequences. Previous research has focused on comparing between these scanpaths, particularly in memory and imagery research where it has been proposed that observers reproduce their eye movements when recognizing or imagining a stimulus. However, it is not clear whether scanpath similarity is related to memory performance and which particular aspects of the eye movements recur. We therefore compared eye movements in a picture memory task, using a recently proposed comparison method, MultiMatch, which quantifies scanpath similarity across multiple dimensions including shape and fixation duration. Scanpaths were more similar when the same participant’s eye movements were compared from two viewings of the same image than between different images or different participants viewing the same image. In addition, fixation durations were similar within a participant and this similarity was associated with memory performance.
Introduction
When viewing a stimulus too large to be apprehended in a single glance, observers make a series of fixations and saccades which occur in a particular sequence and which are associated with a location, duration and so on. In two-dimensional stimuli such as pictures and websites the placement and characteristics of these scanpaths show a large degree of variation both between and within individuals. A good deal of progress has been made in understanding this variation in looking patterns, both in terms of the “bottom-up” visual features which make certain locations more likely to be fixated, and in terms of the contribution of “top-down” processes such as the current task demands and the expertise of the viewer (Groner & Menz, 1985; Ballard & Hayhoe, 2009; Itti & Koch, 2001; Tatler, Hayhoe, Land, & Ballard, 2011; Underwood, Foulsham, & Humphrey, 2009). There has also been increasing interest in potential individual differences in eye movements, with findings indicating that each particular observer may move their eyes similarly in different tasks (Andrews & Coppola, 1999).
In this paper, we evaluate the similarity between scanpaths from different viewings. In particular, we examine whether scanpaths are truly idiosyncratic (in the sense that they are particular to an individual); whether the similarity between scanpaths made by the same person encoding and recognizing an image correlates with memory performance; and which particular aspects of a scanpath are reproduced. To achieve these aims we apply a recently proposed method for scanpath comparison to previously reported data from a scene memory task.
Scanpaths: theoretical considerations
Interest in a distinctive scanning pattern is associated with Noton and Stark (1971), who reported a qualitative similarity in eye movements when people viewed several line drawings on multiple occasions. This observation was used to support “Scanpath Theory”, which proposed that visual features were encoded and stored alongside a motor memory of the scanpath made during perception. When a picture is seen again it is recognized by executing the stored scanpath and matching the sequential features. Importantly, this predicts that 1) participants will show a similar scanpath when recognizing an image as when initially inspecting it and 2) that this similarity will be associated with correct recognition.
The predictions that follow from scanpath theory have important implications for our understanding of eye movement control in complex images. One critical implication is that scanpaths are determined by an interaction between the observer’s previous experience with a picture and the features within the image. Thus providing evidence that people move their eyes similarly on multiple viewings is important for assessing the balance between bottom-up and top-down control in how we guide our eyes. Many researchers have been struck by the large amount of variability in fixations over an image. At one extreme, if eye movements over multiple viewings are completely unrelated then it would suggest a strong random component in the planning of fixations which is not determined by the image or the observer. At the other extreme, if exactly the same scanpath were followed on every occasion then it would imply a persistent set of rules governing an individual’s response to the stimulus.
The main theoretical question underlying this work therefore concerns the degree to which scanpaths are repeatable. As we shall see in the next section, methodological issues mean that previous attempts to investigate this have left doubts regarding this key question, which will be addressed in the present work.
A related set of questions concerns the aspects of the scanpaths that are repeatable between viewings. Do people look at the same spatial locations? Are these regions also fixated in the same temporal order, and with saccades of the same size and direction? Investigating this has clear implications for proposed mechanisms of eye movement control. For example, it can inform us about the planning processes underlying a sequence of saccades, and whether these processes are independent, determined by the salient features at each particular saccadic decision, or part of a larger motor plan associated with the image. We will also consider fixation duration, which is believed to reflect information processing at the current location. If that is the case then durations should depend on spatial position but not on previous viewings or a particular eye movement sequence.
A thorough investigation of scanpath similarity between viewings will also address theoretical questions about image memory. What is the relationship between looking in the same way at an image and consciously remembering it? Scanpath theory suggests that repeating a sequence of eye movements should facilitate recognition. This would be an important finding and would suggest that scanpath similarity could be used as an implicit measure of memory in the absence of a conscious response. Previous empirical reports are mixed, and found more commonly in imagery paradigms where there remains a debate about whether eye movements aid memory (Foulsham & Kingstone, in press; Humphrey & Underwood, 2010; Johansson, Holsanova, Dewhurst & Holmqvist, 2011).
Scanpaths: methodological considerations
Recent research has focused on deriving methods to quantify the similarity between pairs of scanpaths such as those observed by Noton and Stark (1971). Such methods are useful, both for basic research into perception and for applications such as the viewing of webpages (Drusch & Bastien, 2012; Josephson & Holmes, 2002). Foulsham & Underwood (2008) used two scanpath comparison algorithms to compare the eye movements made when trying to remember scenes (encoding) and when recognizing them later. The two algorithms were: 1) the Levenshtein string-edit distance, which converted the scanpath to a character string based on its spatial position in a grid of areas of interest (AOIs); and 2) a linear-distance algorithm which calculated the average distance between fixations in the two scanpaths (Henderson, Brockmole, Castelhano, & Mack, 2007; Mannan, Ruddock, & Wooding, 1995). These two algorithms have been used extensively elsewhere (Brandt & Stark, 1997; Humphrey & Underwood, 2010; Laeng & Teodorescu, 2002; Mannan, Kennard, & Husain, 2009), but their weaknesses have also been pointed out (Cristino, Mathot, Theeuwes, & Gilchrist, 2009; Jarodzka, Holmqvist, & Nystrom, 2010; Tatler, Baddeley, & Gilchrist, 2005; Mathot, Cristino, Gilchrist & Theeuwes, 2012). While the string-edit distance captures sequential order well, it does so at the expense of arbitrarily dividing up the scene and reducing distances to a binary classification. Linear distance methods represent spatial similarity precisely, but are overly affected by differences in the distribution of the scanpaths and unable to easily account for the sequential order in which different regions are inspected. Neither method takes into account the duration of fixations. These issues have been addressed, to some extent, by the ScanMatch algorithm proposed by Cristino et al., (2009). ScanMatch uses sequence alignment methods to compare fixations on discrete regions but weights the costs for transforming one scanpath into another according to user-defined parameters such as the distance between the AOIs.
The present research
In the present investigation, we take advantage of MultiMatch, a recently proposed multi-dimensional algorithm for comparing scanpaths (Jarodzka et al., 2010), and re-analyse the data from the scene stimuli presented in Foulsham and Underwood (2008). In that study, three types of within-subject comparison were performed between each eye-movement scanpath. The main comparison of interest was between an individual observer’s scanpath when encoding an image and the scanpath from the same observer viewing the same image during a recognition test. This comparison produced greater than chance (randomly simulated) similarity, and it also outperformed two control comparisons. The first control comparison measured the similarity between a scanpath at encoding and one from an arbitrarily paired novel image that was presented for the first time during the recognition test. The second control comparison analysed the similarity between two scanpaths during the recognition test (one from an “old” image that had been seen before and one from a “new”, unseen image). Both control comparisons contrasted scanpaths from the same observer, but viewing a different image. These comparisons were aimed at detecting uniform scanpaths within individuals, while allowing different scanpaths between individuals. If an individual uses the same scanpath when inspecting different pictures, these comparisons would have detected it, but the results suggested that viewers are sensitive to picture content because they varied their scanpaths between pictures. In each case, the comparison algorithms dictated several simplifications and assumptions including the size of the grid used to generate character strings in the string-edit distance and the decision to constrain scanpaths to a particular length. These methodological decisions may have affected the results.
Furthermore, there are several outstanding questions from this experiment. The first concerns the source of the scanpath similarity. Similar scanpaths from an individual observer viewing the same stimulus on two separate occasions (i.e. at encoding and recognition) could indicate consistency within that observer, but could equally reflect scanpaths that are strictly dependent on the stimulus. As noted above, this distinction is critical, because it speaks to the debate on top-down and bottomup factors in scene viewing. Greater consistency within an individual than between observers implies that each person is imposing their own top-down interpretation, memories or expertise (see Underwood et al., 2009) on the scanning behaviour. Bottom-up stimulus dependence, in contrast, would suggest that the scanpath is merely a consistent reaction to a repeated stimulus. Foulsham and Underwood (2008) presented evidence that the scanning sequence predicted by a model of visual saliency (e.g., Itti and Koch, 2001) could not account for sequential similarity. However, other simple or complex models of eye movement scanning, such as a tendency for participants to always look at objects in order of semantic interest, would also lead to similarity between viewings. In the present research we address this by also comparing scanpaths between different participants. If scanning is truly idiosyncratic and repetitive then the same observer looking at an image twice will show greater similarity than two different observers looking at the same image.
We also addressed the question of which aspects of scanpaths are repeatable between viewings. The Multi-Match comparison method described in Jarodzka et al., (2010) represents a scanpath as a series of vectors and then computes similarity between two scanpaths according to differences in shape, saccade direction, saccade length, fixation position and fixation duration. We therefore used MultiMatch to quantify scanpath similarity in a robust way with fewer arbitrary assumptions than other methods. The results can reveal where any similarity lies, including the previously unexplored area of consistent sequences of fixation durations.
Methods
The MultiMatch algorithm
We will begin by describing the MultiMatch algorithm for comparing scanpaths. As described in the introduction, scanpath comparison is problematic because scanpaths contain both spatial and temporal information. MultiMatch therefore simplifies the sequence of locations into a series of vectors that can be compared more easily. Figure 1 shows two example scanpaths and the process of simplifying and aligning them. The method is described in detail in Jarodzka et al., (2010) and Dewhurst et al., (in press), where it is tested with data from simulations and a dot-viewing experiment. Here, we present only a summary of the algorithm.
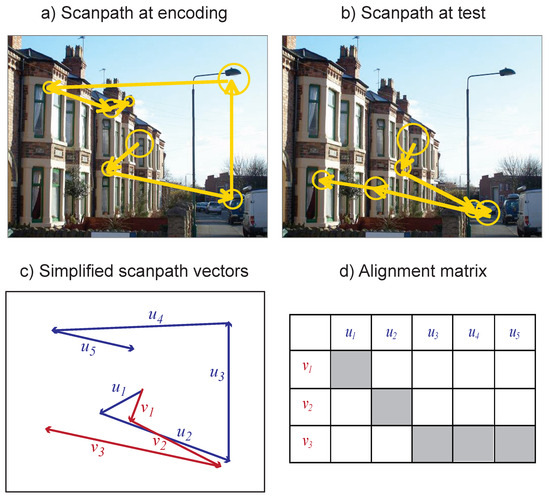
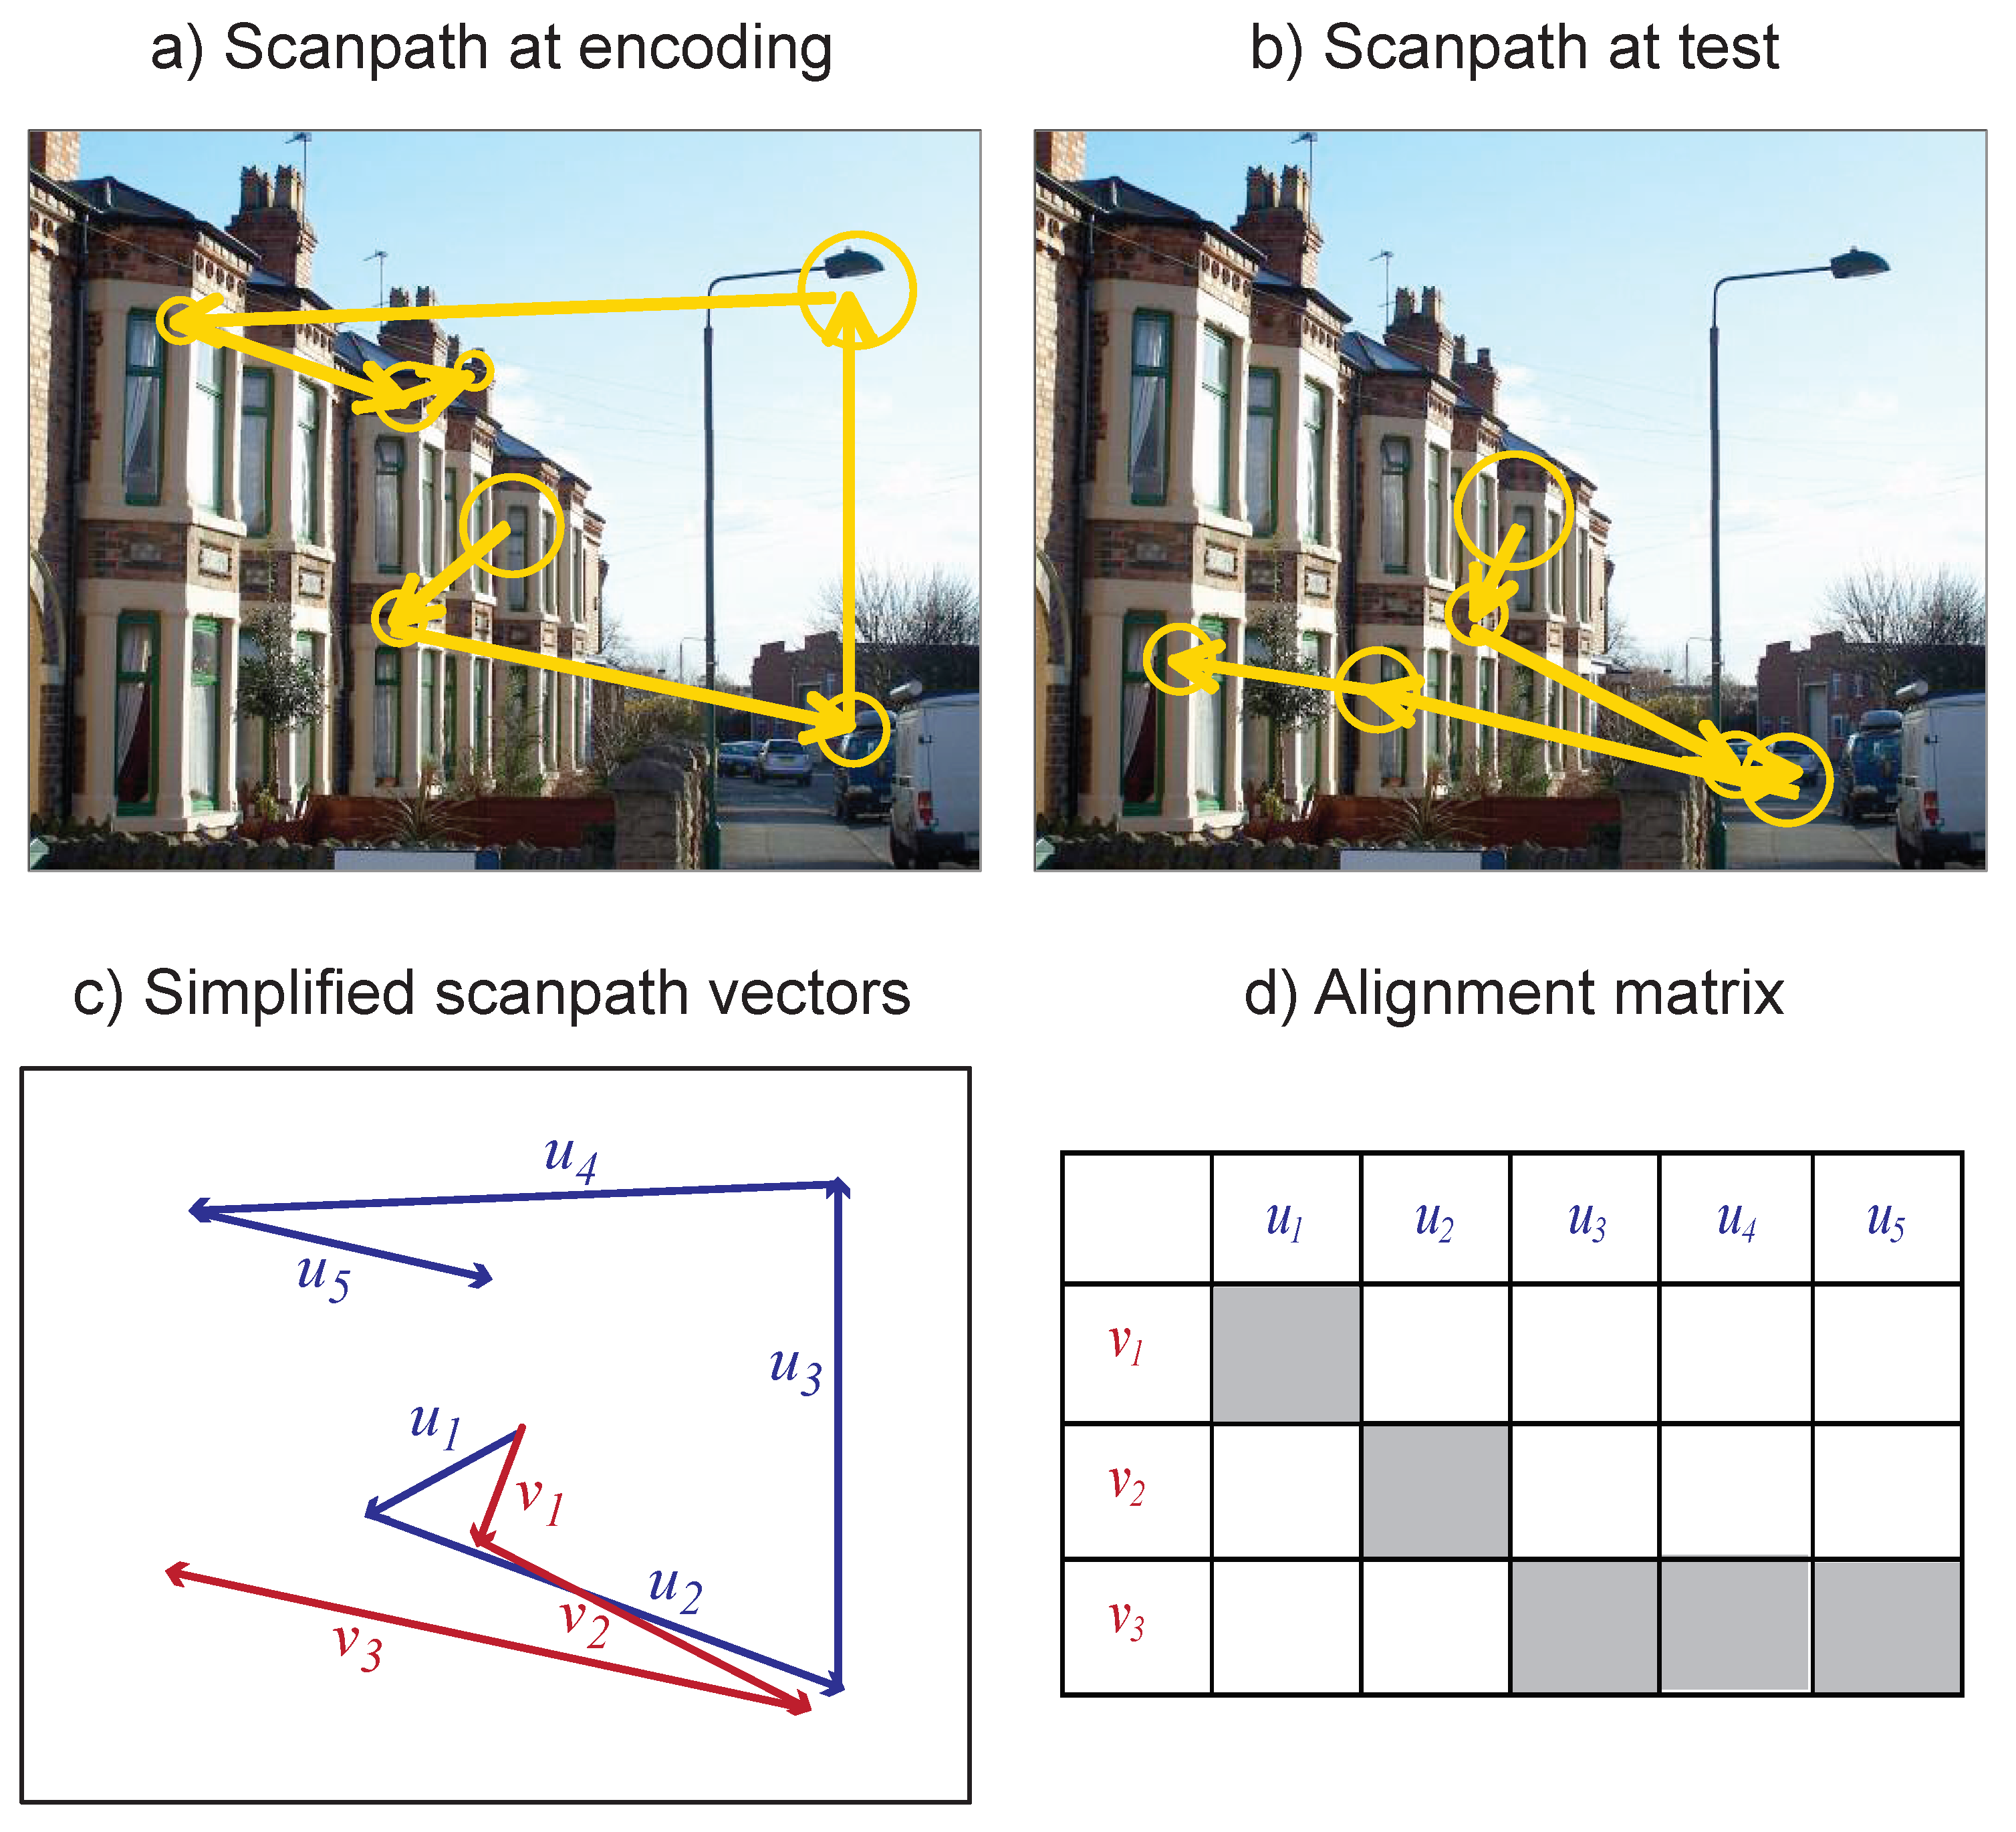
Figure 1.
Eye movement scanpaths were recorded while participants encoded scenes (a), and then while they viewed them again during recognition (b). Fixations are represented by circles, with radius proportional to duration. The MultiMatch algorithm simplified the scanpaths into two series of vectors (shown in blue and red, c). The difference between each pair of vectors was then used to align the scanpaths (d, with shaded squares indicating the best alignment).
MultiMatch represents each scanpath as a series of vectors corresponding to ideal saccades moving between a series of fixated locations, as well as the duration of these fixations. This representation preserves information about the shape of the scanpath, the length and direction of saccades and the position and duration of fixations. In the present implementation, scanpaths are simplified in order to cluster fixations and saccades that are close together or represent local scanning. Brandt and Stark (1997) and Foulsham and Underwood (2008) followed a similar simplification process when using the string-edit method, whereby consecutive fixations on an AOI were combined. Here, saccades that were smaller than an amplitude threshold (set to 10% of the screen diagonal or approximately 4˚) were combined with the following eye movement. In addition, saccades that followed an angle within 45˚ of that of the previous saccade were combined into a single vector.
In practice, the result of these thresholds is to reduce the influence of small and corrective saccades, and to make it easier to compare the overall shape of the scanpath (see Figure 1(c)). It should be noted that the angle threshold combines saccades that continue moving in the same direction. In some situations, such saccades are quite common (see Smith & Henderson, 2009), although they may also include undershoots and corrective saccades. As the main aim of our analyses is to provide quantitive comparisons for the judgements made by Noton and Stark (1971) and previous authors, we therefore chose to emphasise the overall shape of the scanpath. The selection of these thresholds is discussed in more detail in Jarodzka et al., (2010) and Dewhurst et al., (in press). Although the present report will not focus on changing these settings, to do so is straightforward and in our tests the choice of different thresholds did not change the results significantly.
The next step is to align each pair of scanpaths so that corresponding elements can be compared. While this can be done in MultiMatch in a number of ways, here scanpaths were aligned by shape, in order to produce the minimum distance between vectors. Specifically, each vector in one scanpath is compared to each vector in the other scanpath, producing a matrix of comparisons (see Figure 1(d)). The Dijkstra algorithm from graph theory (Dijkstra, 1959) is then used to find the shortest path (i.e. from the top left to the bottom right of the comparison matrix) and thus the closest sequential alignment between the scanpaths.
Once the scanpaths are aligned, the corresponding saccade vectors are compared. For the aligned scanpaths S1 = {u1,u2,…,um} and S2 = {v1,v2,…,vn}, the ith element in S1 is compared to the corresponding jth element in S2. Five separate comparisons are made between each pair:
- Vector difference, ui − vj, which represents the overall difference in the shape of the saccade vectors;
- Length, which is the difference in length/amplitude of the two vectors, ||ui − vj||.
- Direction, a−b, where a is the angle of ui and b is the angle of vi. This gives the difference in angle between saccade vectors;
- Position, the Euclidian distance between aligned fixations;
- Fixation duration, the difference in fixation duration between aligned fixations.
Differences are averaged across vectors 1…m and normalized to give a similarity score between 0 (a theoretical minimum reflecting the size of the display) and 1 (identical). All comparisons were carried out using an implementation of MultiMatch written in MATLAB.
Experimental data
The empirical data originate from Foulsham and Underwood (2008), where full methodological details are given alongside additional description of the eye movement scanpaths. The dataset and code used for analyzing it is available from the first author’s website.
The dataset contains fixations and saccades recorded from 21 student volunteers with normal or corrected-to-normal vision. Eye movements were tracked using the EyeLink II system (SR Research), which uses a headmounted camera to track pupil and corneal reflection. Samples were collected at 250 Hz. The system was calibrated using a 9-dot grid and validations confirmed that the spatial accuracy was less than 0.5˚. Participants viewed all stimuli on a colour CRT monitor at a distance of 60cm while resting on a chin rest.
The stimuli consisted of colour photographs of natural scenes showing landscapes, buildings and interiors (see Figure 1 for an example). Scenes were shown filling the screen and subtended 31˚ x 25˚. In the first part of the experiment, the encoding phase, 45 scenes were presented in a random order, one at a time for 3 seconds. Each trial began with a central fixation marker and participants were asked to look at each picture and try to remember it. In the second part of the experiment, the recognition phase, the same 45 scenes were presented, randomly intermixed with 45 new images that had not been seen previously. Participants had to respond to indicate whether they had seen each image before.
Analysis and Results
Eye movement data
Eye position samples were parsed into fixation and saccade events based on the EyeLink system’s velocity and acceleration thresholds, which were 30˚/s and 4000˚/s2, respectively. We defined each scanpath as the ordered sequence of fixations (with an x and y coordinate and a duration) made in a particular image viewing trial (see Figure 1 (a) and (b) for examples). Unlike some scanpath comparisons metrics, including those used in Foulsham and Underwood (2008), MultiMatch makes no assumptions about scanpath length and thus all the fixations in a trial were used. The resulting scanpaths contained 10.5 fixations, on average. In this paper we only consider the scanpaths made viewing stimuli which were shown both at encoding and at recognition. The novel images shown at recognition, which functioned as fillers in the memory test, were not included. This gave 90 scanpaths per participant, for a total of 1890 scanpaths.
Comparing scanpaths at encoding and recognition
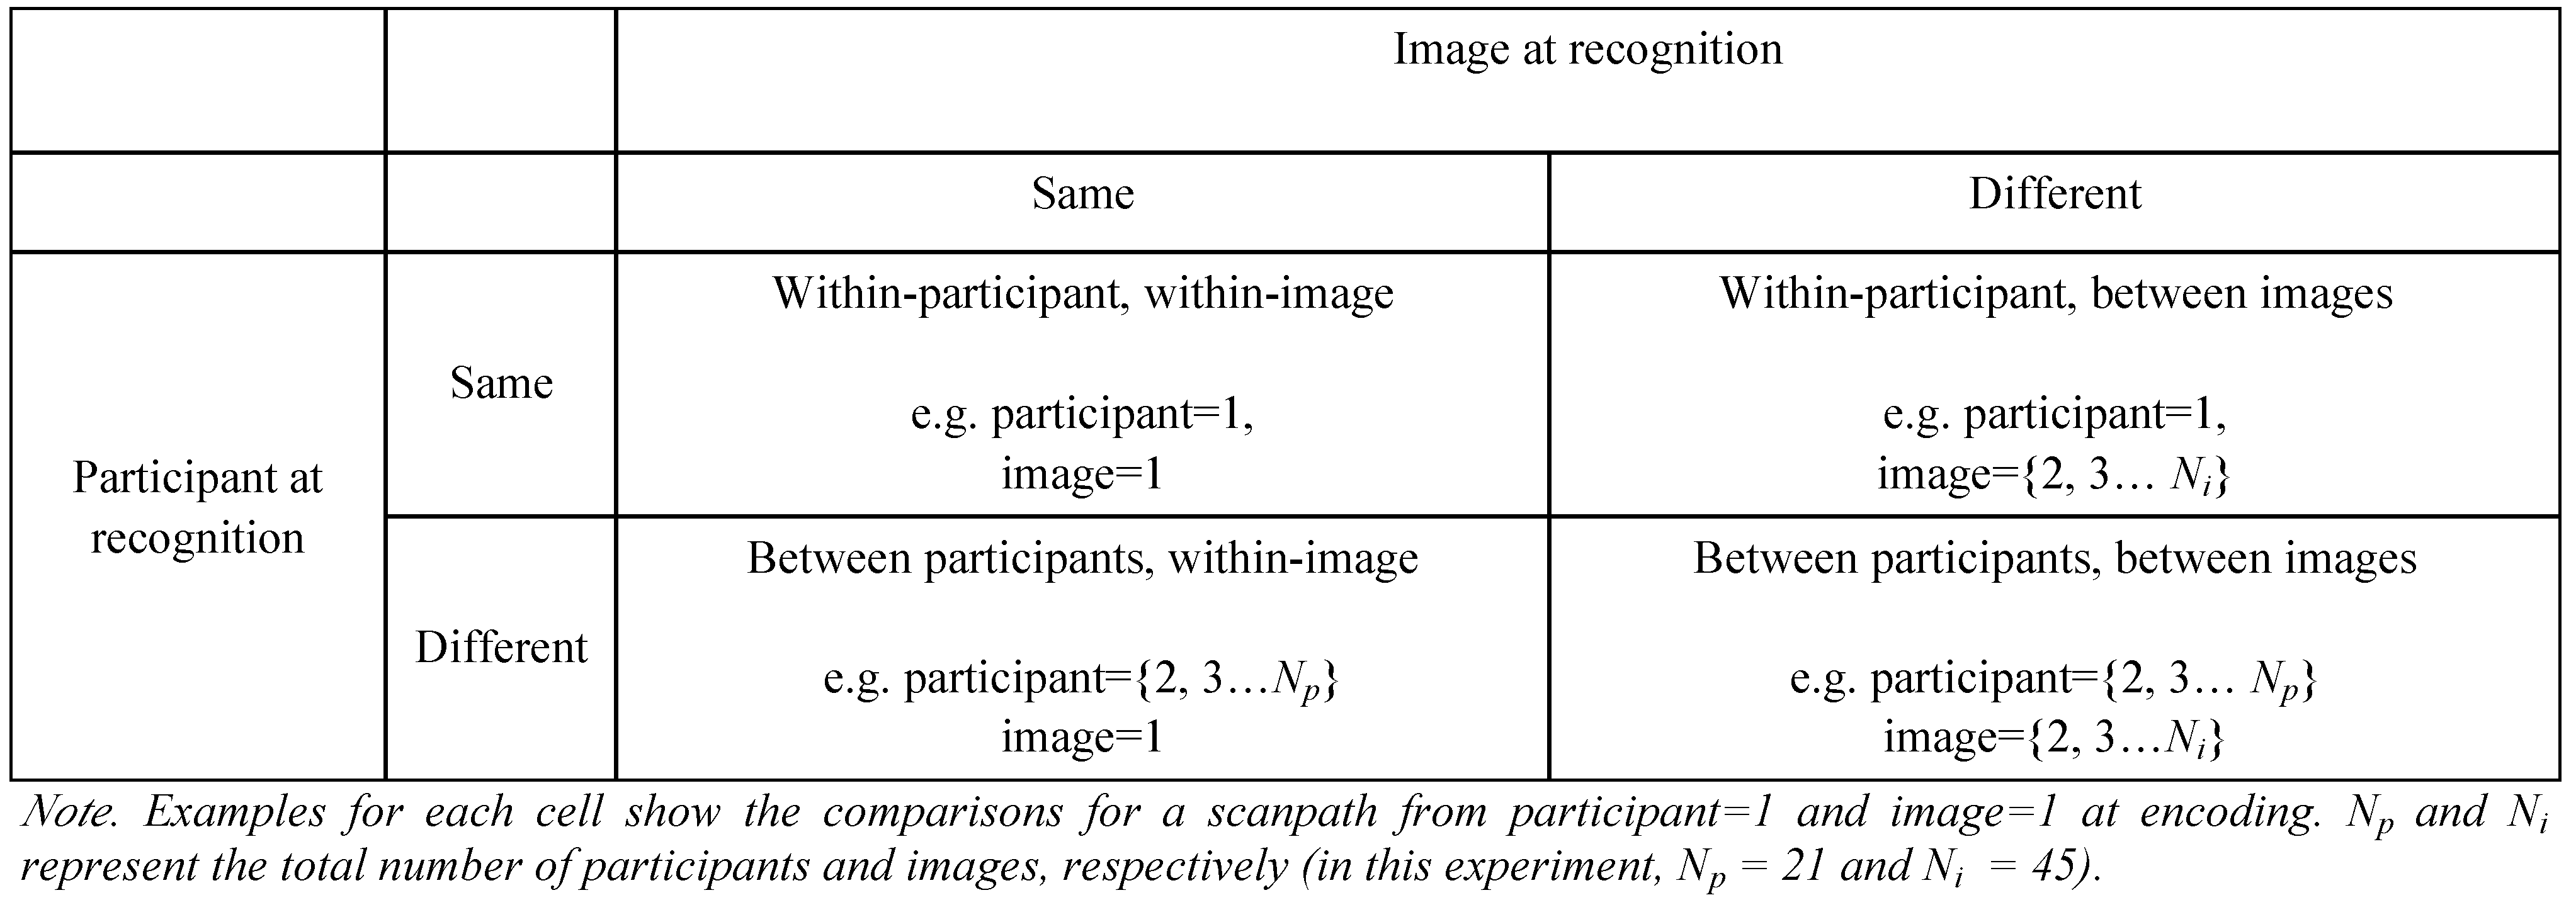
We used MultiMatch to test the similarity between scanpaths in the memory experiment, with the aim of determining whether scanpaths were consistent within a participant and whether this reflected memory performance. Each scanpath made at encoding was subjected to 4 different comparisons according to the observer producing the paired scanpath during the recognition test (the same observer or a different observer) and the image eliciting the scanpath (the same image or a different image). These comparisons are summarized in Table 1.

Table 1.
The scanpath comparisons made, according to two factors: consistency in participant and in image. Each comparison compared a scanpath from encoding with one from recognition.
Across all analyses, every encoding scanpath was compared to every possible recognition scanpath, totaling almost 900,000 pairwise comparisons. Comparisons were computed for all possible matches of participants and images and similarity was then averaged within each participant.
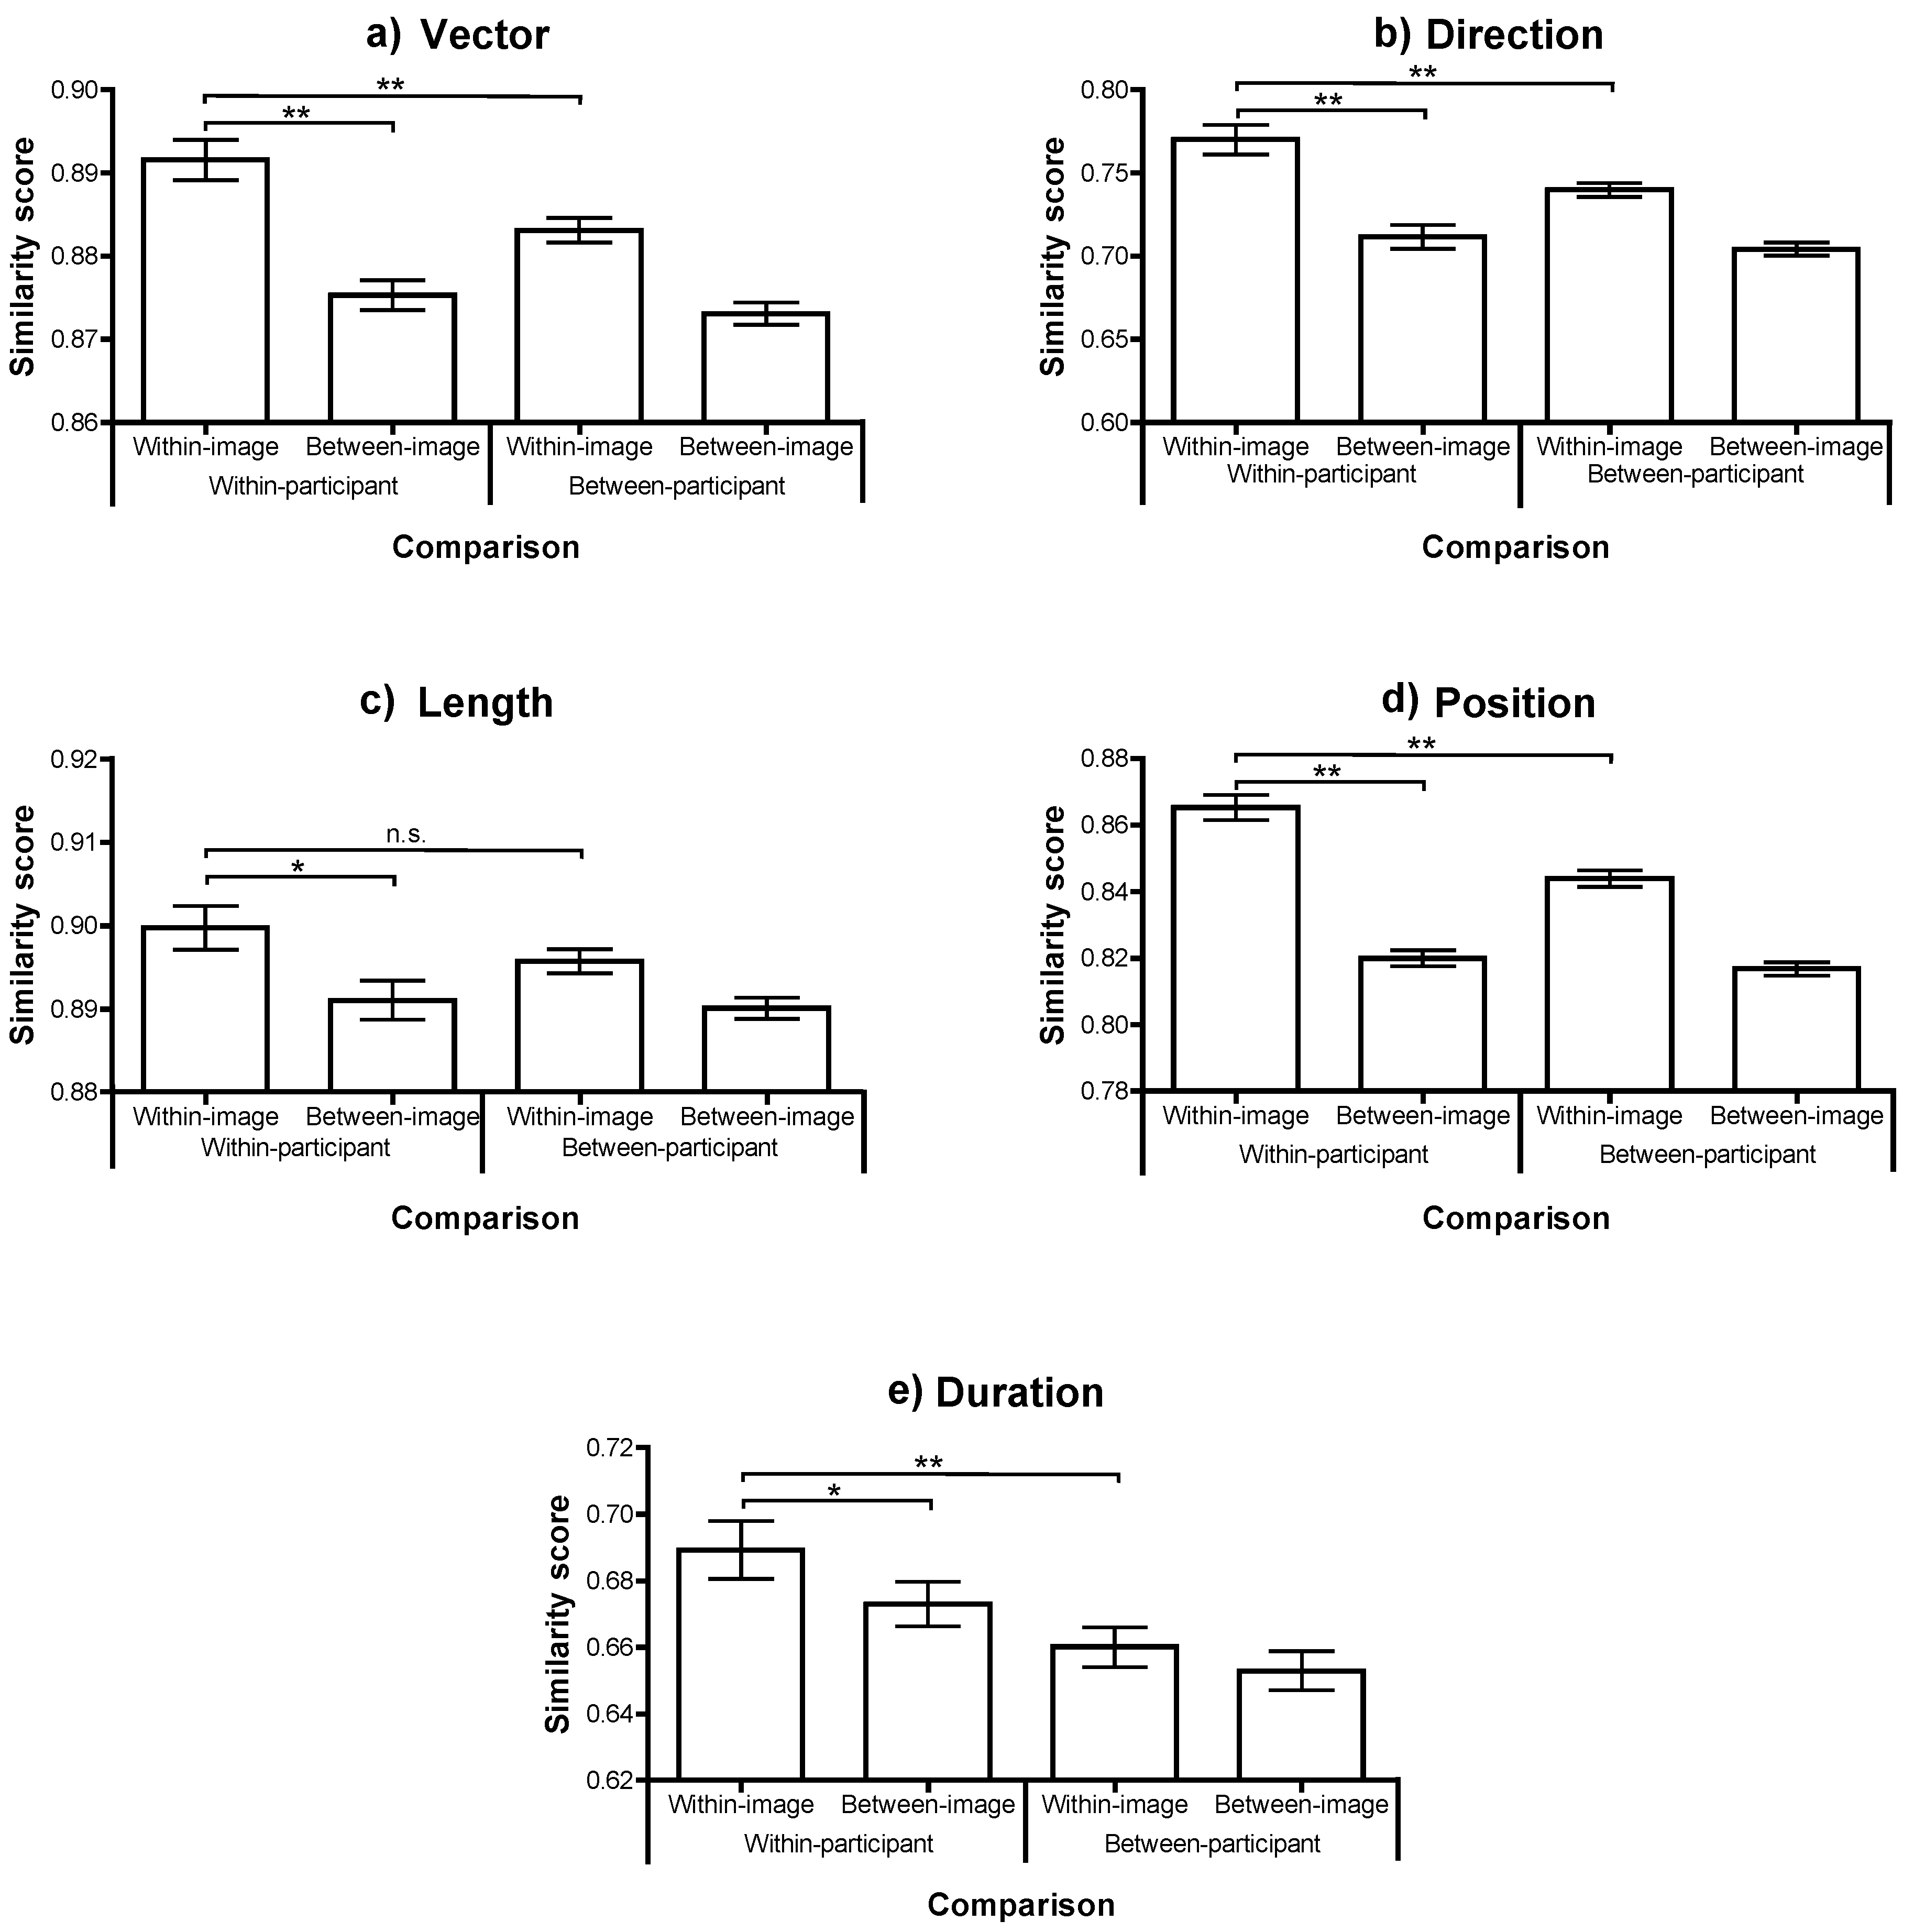
Figure 2 shows the mean and standard error similarity scores for each set of comparisons, and for each of the 5 dimensions measured by MultiMatch. It should be noted that the range and absolute value of scores on the different dimensions are not comparable due to differences in the underlying measurements. Specifically, after being aligned, comparisons are normalized to range between 1 and 0 according to different denominators (e.g. the screen diagonal for distance and pi for direction). Thus the comparison between a similarity score reflecting spatial separation and one reflecting angular distance is not straightforward to interpret. Instead we compared the difference between comparison conditions, separately within each dimension.
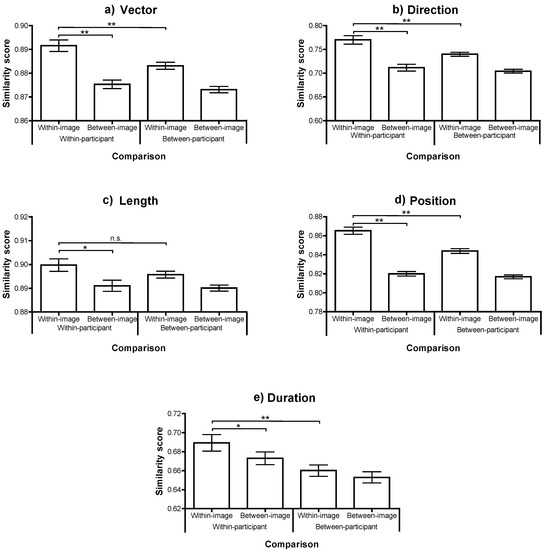
Figure 2.
Scanpath similarity for each comparison, across each of the 5 MultiMatch dimensions (panels (a)-(e)). Bars show the mean similarity, ± one standard error across participants. The significance of paired t-tests examing the key relationships is highlighted: *p<.01; **p<.001.
The participant means for each type of comparison were compared with repeated measures ANOVA (with paired t-tests where necessary). In all dimensions there was a reliable effect of image (within or between), with scanpaths elicited by the same image being more similar than those from different images (all Fs(1, 20)>17, ps<.001). This confirms that there is consistency in the scanpaths made when viewing a particular image. There was also a reliable effect of participant consistency, with scanpaths being more similar, on average, if they were from the same participant, in all dimensions (Fs(1, 20)>13, ps<.005), with the exception of saccade length where the difference was in the same direction but not statistically reliable (F(1, 20)=2.1, p=.2).
Moreover, there was a significant interaction in three of the five dimensions (Vector, Direction and Position; Fs(1,20)>20, ps<.001) which was marginally reliable in the other difference metrics (Length: F(1,20)=3.3, p=.08; Duration: F(1,20)=3.0, p=.096). In each case, the within-participant, within-image comparison produced the highest scanpath similarity. This condition was significantly more similar than the within-participant, between-image comparison in all five dimensions (all ts(20)>3, ps<.01). This result replicates Foulsham and Underwood (2008) with a different comparison method and confirms that the same person, looking at the same image, produces a more similar scanning sequence than the same person looking at a different image.
More interesting, within-participant, within-image similarity was significantly higher than between-participant, within-image similarity in four out of five dimensions (all t(20)>4, ps<.001), with the exception of similarity in Length, where the trend approached significance (t(20)=2.0, p=.06). This confirms what was first reported by Noton and Stark (1971): that individuals show a replicating scanpath over a specific image which is to some extent peculiar to them and therefore truly idiosyncratic. Furthermore, because scanpath similarity is higher within a participant than between two participants looking at the same image, this cannot be due to a consistent and normative response to image content. Neither is it explained by the systematic tendencies observed in general across scenes (for example a characteristic range of saccade amplitudes) or within particular scenes (for example the tendence to make horizontal saccades in landscapes; Foulsham, Kingstone, & Underwood, 2008). Attempts by researchers to model fixation locations during natural image viewing have often taken the between-subjects similarity (or the extent to which one participant’s eye movements can be predicted based on those of all other participants in the same image) as the upper bound of model performance (Peters, Iyer, Itti, & Koch, 2005; Torralba, Oliva, Castelhano, & Henderson, 2006). While this is the theoretical maximum of any normative model based on the “average” viewer, the present results demonstrate that there is also reliable within-subject consistency over and above what observers look at in general.
The average similarity score was highest for the within-participant, within-image comparison across all of the 5 dimensions. This order was found in the relative position similarity, indicating that participants tended to fixate spatial locations during recognition that were significantly more similar to their own fixation pattern at encoding than to someone else’s. The length of their scanpaths (derived from their saccade amplitude) and the sequence of directions showed the same within-participant consistency. Moreover, combining the length and angle of each of the shifts of overt attention making up the scanpath into a vector, this dimension confirmed that the scanpath shape peculiar to an observer viewing a particular image tended to recur.
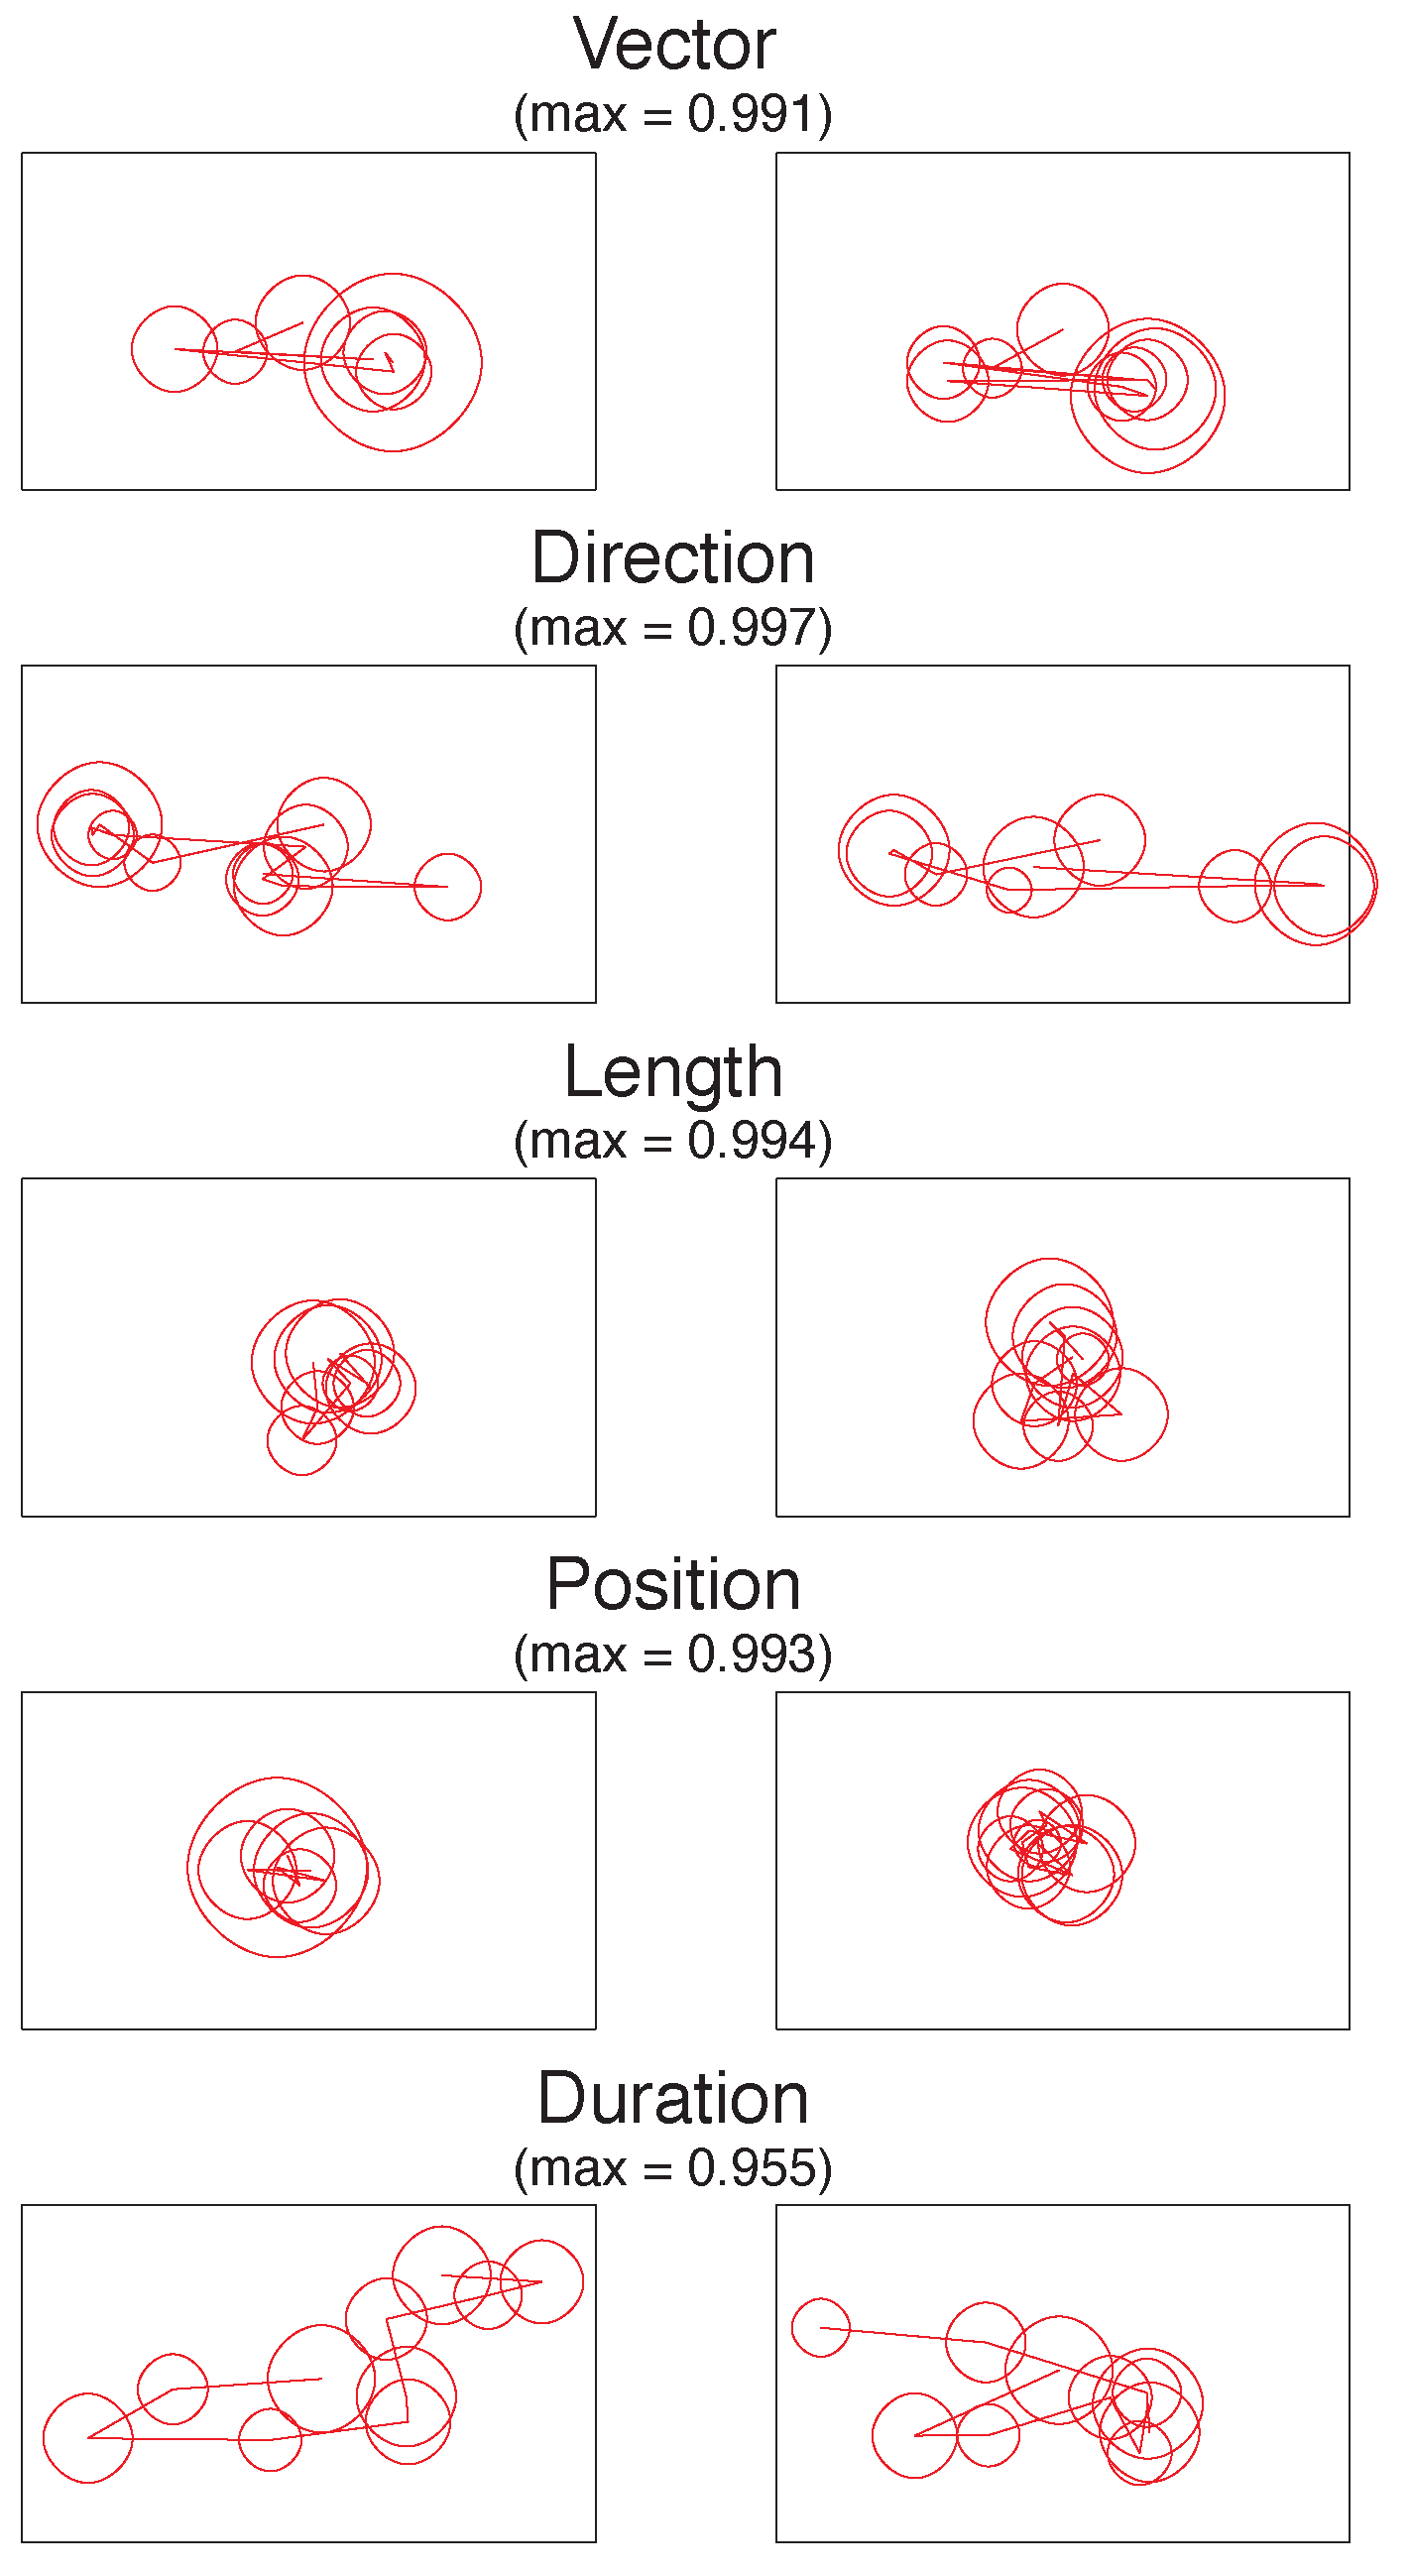
The different dimensions of MultiMatch provide a fuller picture than previous research as to how scanpaths from different viewings are similar. To illustrate these differences, Figure 3 displays the encoding v. recognition scanpath pairs ranked as the most similar within each of the 5 dimensions.
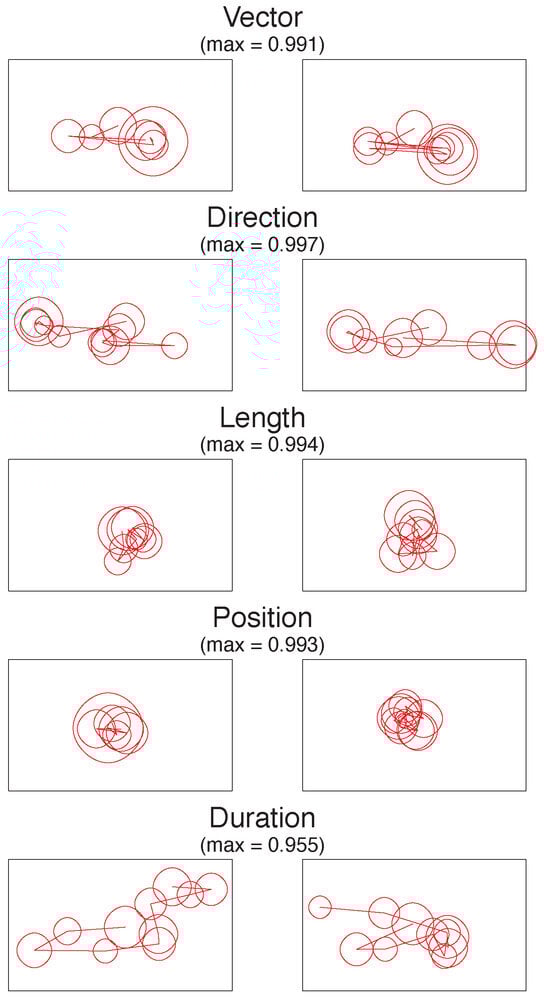
Figure 3.
The most similar empirically observed scanpath pairs in each of the five dimensions, with viewing starting in the centre. The MultiMatch similarity score is given for each pair, out of a theoretical maximum of 1.
In the Vector dimension, both scanpaths show a similar shape, with gaze moving from the centre of the image to the left and then to the lower right. The scanpaths that are highly similar in direction show a slightly different shape and order but contain saccades with very similar directions (mostly horizontal). The Length and Position examples are also highly similar, mostly because in these (atypical) trials, participants have remained fixating in the centre of the screen. Finally, in the duration example, similarity is high even though the shape of the scanpaths is different because, when aligned, the corresponding fixations are closely matched in their duration.
Idiosyncrasies in fixation duration
The degree of similarity across the different comparisons shows a somewhat different pattern within the duration dimensions (Figure 2(e)). As in the other comparisons, scanpaths were most similar when compared between the same person and the same image. However, unlike the spatial dimensions, duration similarity was higher in the within-participant, between-image comparison than in the between-participant, within-image comparison. In other words, individual participants tended to produce scanpath sequences with a similar duration, even when viewing different images.
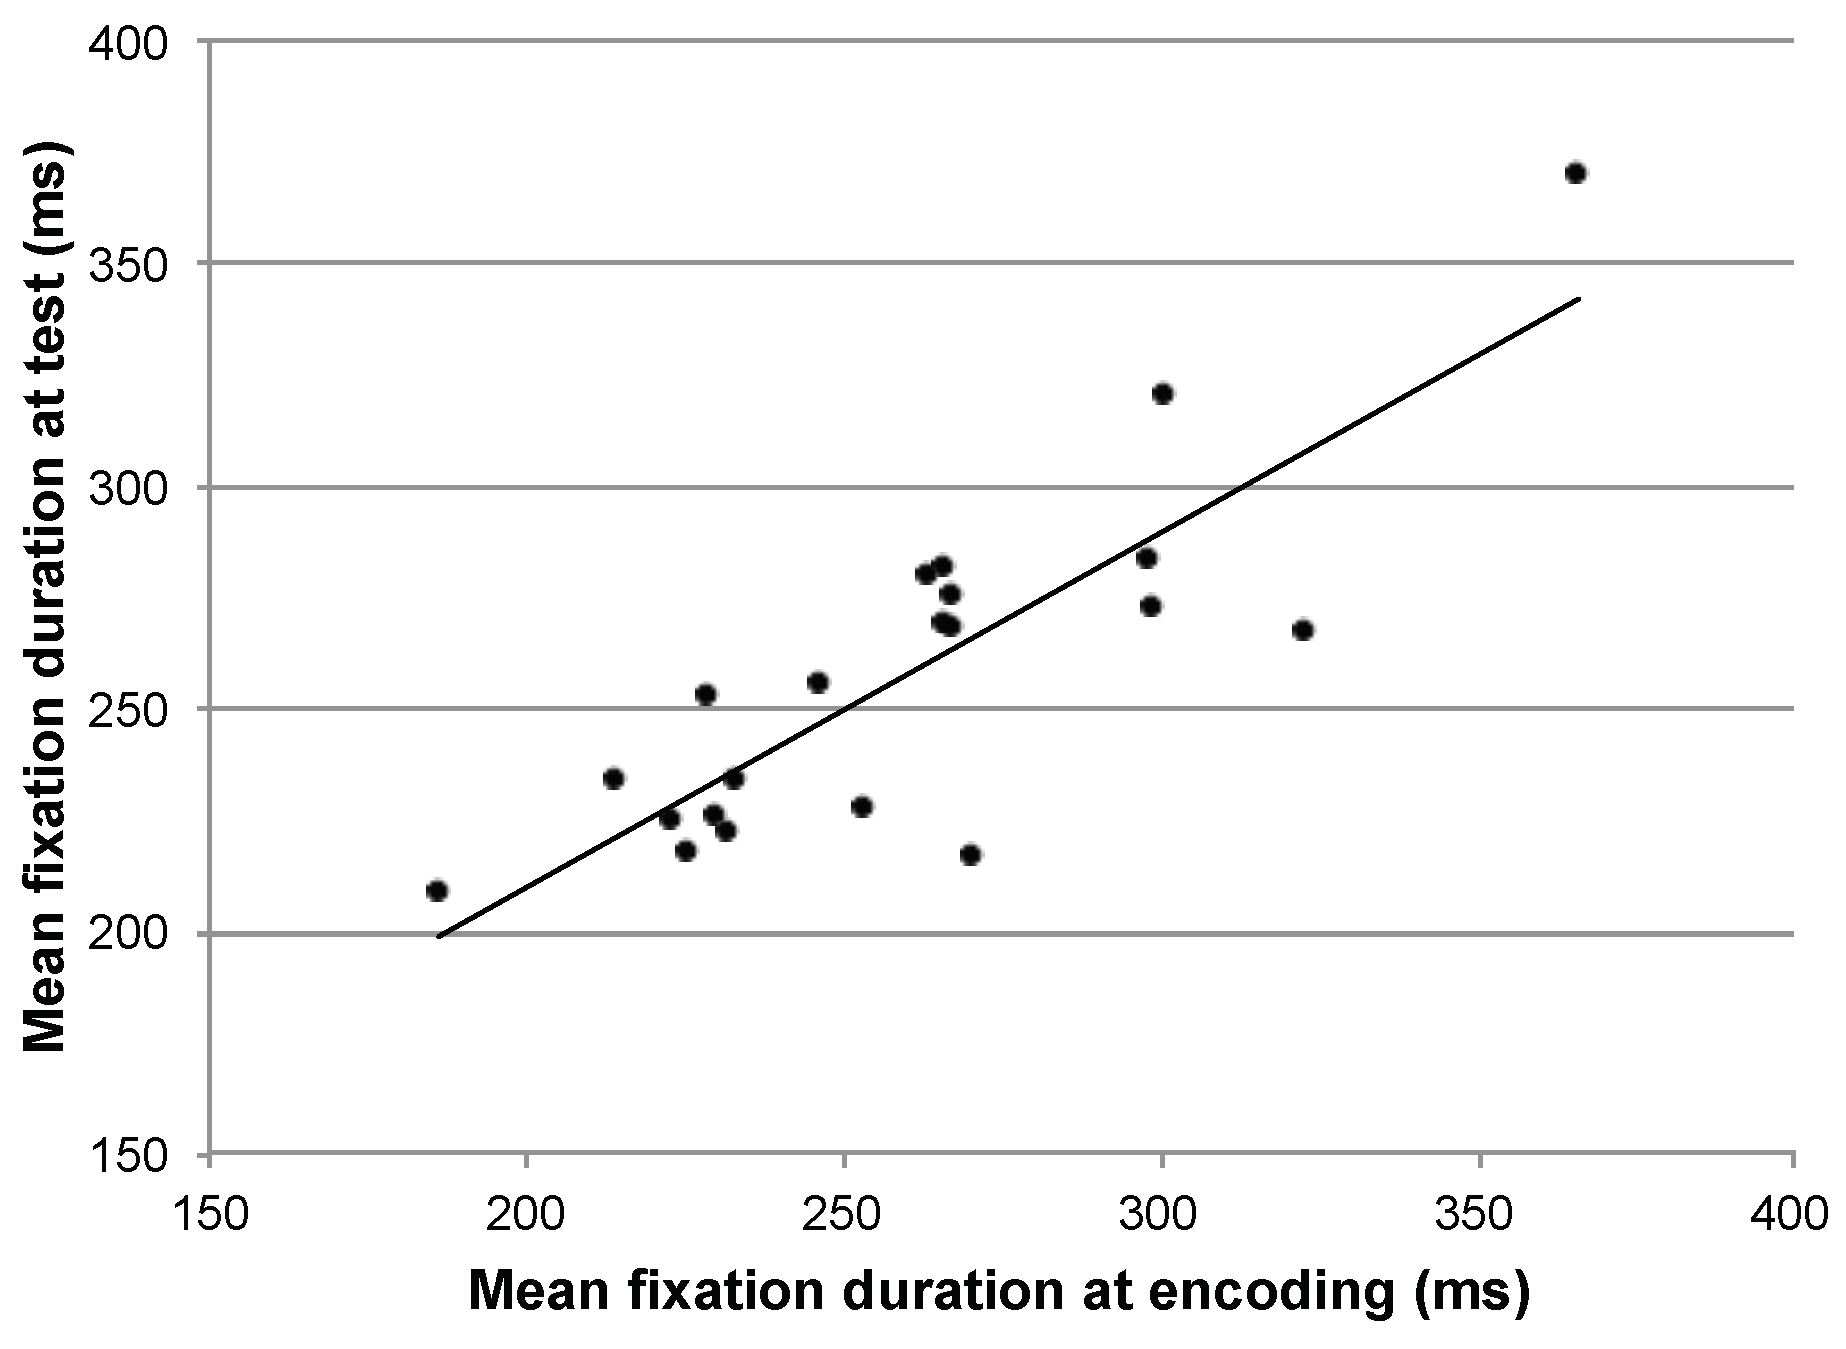
It has previously been reported that general eye movement statistics such as average saccade amplitude and average fixation duration are consistent within a particular participant performing different tasks (Groner & Menz, 1985; Andrews & Coppola, 1999; Rayner, Li, Williams, Cave, & Well, 2007). To examine whether an association between overall fixation duration during the encoding and recognition phase of the current experiment might explain the high within-participant similarity, we performed a correlation. The mean fixation duration for each participant during encoding was highly correlated with his or her mean fixation duration during the recognition trials (r=0.84, p<.01). Participants who made longer fixations when looking at images for the first time also made longer fixations when recognizing images later (Figure 4).
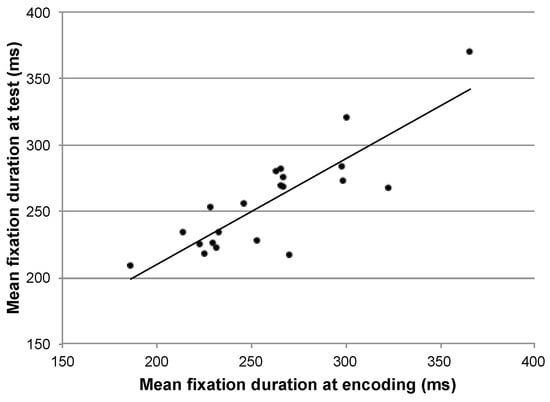
Figure 4.
Correlation between the average fixation duration, per participant, in the two phases.
This correlation probably explains the high within-participant scanpath duration similarity, when quantified by the MultiMatch algorithm. Individual differences in spatial distributions or saccade vectors had less of an influence, as shown by the relatively lower similarity in these dimensions in the Within-participant, between-image comparison. Interestingly, because the actual image had relatively less influence on duration similarity, it appears that overall fixation duration was less affected by image content and more by the particular viewer.
Scanpath similarity and memory
What causes this relationship between scanpaths at two different viewings of the same image? One candidate concerns memory. If the scanpath being reproduced is specific to that particular image then it suggests there must be some interplay between explicitly recognizing the image and moving the eyes in a similar way. This is indeed one of the predictions in Scanpath Theory—that the sequence of eye movements associated with a stimulus is stored and re-enacted during later recognition. One study to consider this was carried out by Humphrey and Underwood (2010), who reported that scanpath similarity (quantified by the string-edit distance) was no higher in correctly recognized trials than in incorrect trials. However, there was a slight numerical difference between the correct and incorrect trials in that study, and the lack of an effect may have come about because of the previously discussed issues with the string-edit distance, or because there were relatively few incorrect trials to analyse.
We therefore analysed the memory dataset to investigate whether there was a relationship between the within-participant, within-image similarity on a particular recognition trial and the accuracy of the subsequent memory response. The prediction is that correct recognition trials will have a higher scanpath similarity than those that are missed. For each dimension, within-participant, within-image scanpath similarity was averaged across correct and incorrect trials for each participant. The two types of trial were then compared with paired t-tests.
Of the five similarity dimensions, only Duration had a significant relationship with accuracy. Trials that led to a correct response resulted in a sequence of fixation durations that were more similar (MultiMatch mean = 0.70, SEM = 0.03) to those in the encoding phase than those in incorrect trials (M = 0.66, SEM = 0.03; t(20)=2.6, p=.02). There was no difference in the Vector (Ms ± SEMs: correct = 0.89 ± 0.01; incorrect = 0.89 ± 0.01) or Length (correct = 0.90 ± 0.01; incorrect = 0.90 ± 0.01) comparisons. The difference between correct and incorrect trials in Direction (correct = 0.77 ± 0.03; incorrect = 0.75 ± 0.04) and Position (correct = 0.87 ± 0.01; incorrect = 0.86 ± 0.01) were small and in each case, the t-test comparisons were not reliable (all ps>.1). To test whether scanpath similarity can predict accuracy on a trial-by-trial basis, we performed a logistic regression predicting trial recognition outcome (hit or miss) from similarity in the five MultiMatch dimensions. A test of the full model versus a model with intercept only was not statistically significant (χ2 = 8.7, df=5, p=.12). However, a simpler model with only the similarity in Duration was statistically reliable (χ2 = 6.0, df=1, p<.02). The coefficient relating similarity in fixation duration to memory accuracy on a trial by trial basis was statistically significant (B=1.6, p<.02).
Discussion
The present study had three main aims. The first was to apply the MultiMatch scanpath comparison algorithm to real data from a memory task with complex pictorial stimuli. These comparisons have previously proved challenging, particularly when there are no theoretically defined AOIs. The MultiMatch method has a number of advantages. It does not require AOIs and is more sensitive to the precise distance between fixations than the string-edit distance. Unlike measures based only on the linear distance between fixations or the correlation between attention maps, this method also preserves the sequence of fixations and saccades.
The simplification step, whereby scanpaths are clustered into a set of vectors, has considerable flexibility and allows interested researchers to vary the simplification (by changing thresholds for direction and amplitude), or omit it entirely, according to their aims. Further research is necessary to investigate the impact of the thresholds chosen in this step on natural eye movements. For example, clustering saccades based on amplitude may provide a way to selectively look at global versus local scanning, which have been identified as different “modes” of attention (Groner, Walder, & Groner, 1984; Unema, Pannasch, Joos, & Velichkovsky, 2005). Scanpath similarity in certain conditions might be found in some modes but not others. It should be noted that because the present research compared scanpath similarity across different comparisons, all of which used the same MultiMatch parameters, the settings chosen cannot explain the results. Because the different dimensions resulting from Multi-Match yield different baselines it is important to use control comparisons (e.g. from different participants or images) in this way, rather than assuming a certain level of similarity to be greater than chance.
The second aim was to test whether scanpaths elicited during the recognition of images are truly idiosyncratic— more consistent within individuals than between different observers. The results with this novel comparison algorithm confirmed that an individual’s scanpath made during recognition was more similar to that person’s viewing sequence at encoding than to a different person’s. Similarity was highest when the same person viewing the same image was compared. This supports the original descriptions by Noton and Stark (1971), and extends the findings of Foulsham and Underwood (2008) with this dataset, but who did not fully compare similarity both within and between participants. Interestingly, the findings are also somewhat different from those reported recently by Drusch and Bastien (2012) in the context of webpage browsing. In that study, within-participant similarity was higher when a participants performed two different tasks than when they performed the same task twice. The authors used a modified string-editing comparison method and it would be interesting to see whether their counterintuitive result occurs with MultiMatch and different stimuli.
Previous research has provided considerable information about how an image might cause a certain pattern of eye movements in all participants (e.g., through salient or meaningful elements drawing attention; Itti & Koch, 2001; Henderson et al., 2007). It is also known that people in general move their eyes in certain ways more than others, showing systematic tendencies which are predictive across images (Tatler & Vincent, 2008). The present results also demonstrate that, both across images in general and within a particular image, each participant showed a consistent pattern that was distinctive to themselves. These sequential patterns (i.e., the tendency to make certain saccades and fixations in a particular order) go beyond the correlation between general eye movement parameters reported by Andrews and Coppola (1999). This is an understudied source of “top-down” variation in attention. This variation could in principle be related to memory or the particular dispositions, knowledge or expertise of the observer (Underwood et al., 2009), or to lower-level idiosyncrasies in the visual system. We can begin to clarify which of these causes might be responsible by investigating which aspects of eye movements are reproduced between viewings and whether any of these are diagnostic of memory performance
The use of the MultiMatch algorithm permitted tackling this third aim of the study. The algorithm aligned scanpaths according to the sequence of vectors and found greater similarity within-participants in terms of the direction of saccades, the position and duration of fixations and the overall shape of the scanpath. Individual participants tended to show similar sequences of saccades and fixations. The pattern of saccade lengths, however, was not as sensitive to the particular participant, which may be because length/amplitudes show consistent sequential characteristics across all participants, some of which are due to simple properties of the oculomotor system. For example, saccade amplitudes show a characteristic, positively skewed distribution during scene viewing, which appears to be related to both image size and the availability of parafoveal versus peripheral information (Foulsham & Kingstone, 2012).
Analysis of fixation duration has been rather neglected in studies of image perception (but see Nuthmann, Smith, Engbert, & Henderson, 2010), and to our knowledge the sequence of fixation durations in a scanpath has not previously been investigated (though see von der Malsburg & Vasishth, 2011, who include duration in a measure of scanpaths during reading, and Cristino et al., 2010). In the present results, aligned fixation durations were also consistent within participants. Specifically, when a particular participant’s scanpaths were aligned according to shape, the corresponding fixations were likely to be of a similar duration, and more so than when compared to a different person.
Individual fixation durations on a particular location are know to be influenced by a number of visual and semantic factors, such as the presence of high spatial frequency detail (Mannan et al., 1995) or of incongruent or unusual objects (Loftus & Mackworth, 1978; Underwood & Foulsham, 2006). Fixation durations are therefore assumed to largely reflect the processing at a local spatial location, although they may also be determined by the planning of the next saccade (Nuthmann et al., 2010). Duration similarity in the current study remained high in the within-participant, between-image comparison, and such scanpaths were more similar than those from different people viewing the same image. In the MultiMatch metric, similarity between durations is independent from position and so differences imply a dissociation. Thus, interestingly, the pattern we have observed does not seem due to any features of a particular image. Because aligned fixations are not necessarily in the same location, their similarity in duration likely reflects image general, but idiosyncratic, scanning tendencies (for example one person’s habit of making two short fixations followed by one long one). A simpler explanation is that the within-participant similarity in this dimension was higher because participants are consistent in their average fixation duration in the two task phases, and this explanation is supported by the high correlation in these averages. Such correlations have been observed previously, though it is not known exactly why they arise (Andrews & Coppola, 1999; Rayner et al., 2007).
The duration similarity between trials where a participant saw the same image twice (i.e. during recognition) was also the only dimension to prove diagnostic of memory performance. Trials which were correctly recognised were more likely to have a similar set of fixation durations than those that were not. In this case, where all scanpaths came from a matched image, it might reflect a reproduction of the mental processes attached to understanding the scene over multiple fixations. Such reproduction could be both a cause and an effect of consciously recognizing the image. Correlating behavior at encoding and recognition cannot determine the direction of causality (but for an experimental test of scanpath reproduction see Foulsham & Kingstone, in press). It should be noted that here, none of the spatial similarity measures were significantly more similar in correctly recognized trials. That only duration similarity predicted memory argues against scanpath theory because Noton and Stark (1971) would predict that correct recognition should be associated with higher similarity in position or shape of the scanpath. Modern theorists must instead take into account consistent patterns of fixation duration across viewings.
In conclusion, there is much to be learned from a detailed analysis of scanpaths across viewings, and from their relationship to memory. The MultiMatch method provides a good way of quantifying sequential similarity in position, with advantages over simpler string-edit or distance-based approaches. The Vector or Position dimensions of this measure could be fruitfully used in place of simpler algorithms. However, the approach also potentially gives information about specific aspects of the scanpaths which are similar, including fixation duration and scanpath shape independent of position. In the context of the memory task people do indeed show repetitive scanpaths which are more similar within-participants (Noton & Stark, 1971). Our results allow us to more confidently attribute scanpath similarity to idiosyncratic factors, rather than bottom-up image features or between-participants oculomotor tendencies. Moreover, because there was no correlation between similarity in position and recognition memory, encoding and storage of a scanpath does not appear to be a major cause of scanpath similarity. Instead, it is likely that consistent, individual differences in response to a particular image are responsible and hence this is evidence for a clear interaction between person and picture. Further work should tap this consistency for predicting where people will look and understanding individual differences and eye movement control in complex scenes.
References
- Andrews, T. J., and D. M. Coppola. 1999. Idiosyncratic characteristics of saccadic eye movements when viewing different visual environments. Vision Research 39, 17: 2947–2953. [Google Scholar] [PubMed]
- Ballard, D. H., and M. M. Hayhoe. 2009. Modelling the role of task in the control of gaze. Visual Cognition 17, 6-7: 1185–1204. [Google Scholar] [PubMed]
- Brandt, S. A., and L. W. Stark. 1997. Spontaneous eye movements during visual imagery reflect the content of the visual scene. Journal of Cognitive Neuroscience 9, 1: 27–38. [Google Scholar] [PubMed]
- Cristino, F., S. Mathot, J. Theeuwes, and I. Gilchrist. 2010. ScanMatch: A novel method for comparing saccade sequences. Behavior Research Methods 42, (3): 692–700. [Google Scholar]
- Dewhurst, R., M. Nystrom, H. Jarodzka, T. Foulsham, R. Johansson, and K. Holmqvist. in press. It depends on how you look at it: scanpath comparison in multiple dimensions with MultiMatch, a vector based approach. Behaviour Research Methods. [Google Scholar]
- Dijkstra, E. 1959. A note on two problems in connexion with graphs. Numerische Mathematik 1, 1: 269–271. [Google Scholar]
- Drusch, G., and J. M. C. Bastien. 2012. Analysing web pages visual scanpaths: between and within tasks variability. Work: a Journal of Prevention, Assessment and Rehabilitation 41: 1559–1566. [Google Scholar]
- Foulsham, T., and A. Kingstone. 2012. Modeling the influence of central and peripheral information on saccade biases in gaze-contingent scene viewing. Visual Cognition 20: 546–579. [Google Scholar]
- Foulsham, T., and A. Kingstone. in press. Fixation dependent memory for natural scenes: an experimental test of scanpath theory. Journal of Experimental Psychology: General. [Google Scholar]
- Foulsham, T., A. Kingstone, and G. Underwood. 2008. Turning the world around: Patterns in saccade direction vary with picture orientation. Vision Research 48, 17: 1777–1790. [Google Scholar]
- Foulsham, T., and G. Underwood. 2008. What can saliency models predict about eye movements? Spatial and sequential aspects of fixations during encoding and recognition. Journal of Vision 8, 6: 1–17. [Google Scholar] [CrossRef]
- Groner, R., and C. Menz. 1985. Edited by R. Groner, G. W. McConkie and Ch Menz. The effects of stimulus characteristics, task requirements and individual diferences on scanning patterns. In Eye movements and human information processing. Amsterdam: Elsevier: pp. 239–250. [Google Scholar]
- Groner, R., F. Walder, and M. Groner. 1984. Looking at faces: local and global aspects of scanpaths. In Theoretical and applied aspects of eye movement research. Edited by A. Gale and F. Johnson. Amsterdam: Elsevier: pp. 523–533. [Google Scholar]
- Henderson, J. M., J. R. Brockmole, M. S. Castelhano, and M. L. Mack. 2007. Visual saliency does not account for eye movements during visual search in real-world scenes. In Eye movements: A window on mind and brain. Edited by R. van Gompel, M. Fischer, W. Murray and R. W. Hill. Amsterdam: Elsevier: pp. 537–562. [Google Scholar]
- Humphrey, K., and G. Underwood. 2010. The potency of people in pictures: Evidence from sequences of eye fixations. Journal of Vision 10, 10. [Google Scholar] [CrossRef]
- Itti, L., and C. Koch. 2001. Computational modelling of visual attention. Nature Reviews Neuroscience 2, 3: 194–203. [Google Scholar] [CrossRef] [PubMed]
- Jarodzka, H., K. Holmqvist, and M. Nystrom. 2010. A Vector-based, Multidimensional Scanpath Similarity Measure. In ETRA '02: Proceedings of the 2010 symposium on eye tracking research and applications, ACM, New York. [Google Scholar]
- Johansson, R., J. Holsanova, R. Dewhurst, and K. Holmqvist. 2011. Eye movements during scene recollection have a functional role, but they are not reinstatements of those produced during encoding. Journal of Experimental Psychology: Human Perception and Performance. [Google Scholar] [CrossRef]
- Josephson, S., and M. E. Holmes. 2002. Visual attention to repeated internet images: testing the scanpath theory on the world wide web. In ETRA '02: Proceedings of the 2002 symposium on eye tracking research and applications. New York: ACM, pp. 43–49. [Google Scholar]
- Laeng, B., and D. S. Teodorescu. 2002. Eye scanpaths during visual imagery reenact those of perception of the same visual scene. Cognitive Science 26, 2: 207–231. [Google Scholar] [CrossRef]
- Loftus, G. R., and N. H. Mackworth. 1978. Cognitive Determinants Of Fixation Location During Picture Viewing. Journal of Experimental Psychology: Human Perception and Performance 4, 4: 565–572. [Google Scholar] [CrossRef] [PubMed]
- Mannan, S., C. Kennard, and M. Husain. 2009. The role of visual salience in directing eye movements in visual object agnosia. Current Biology 19, 6: R247–R248. [Google Scholar] [CrossRef] [PubMed]
- Mannan, S., K. Ruddock, and D. Wooding. 1995. Automatic control of saccadic eye movements made in visual inspection of briefly presented 2-D images. Spatial Vision, vol. 9, pp. 363–386. [Google Scholar]
- Mathot, S., F. Cristino, I. D. Gilchrist, and J. Theeuwes. 2012. A simple way to estimate similarity between pairs of eye movement sequences. Journal of Eye Movement Research 5, 1: 1–15. [Google Scholar] [CrossRef]
- Noton, D., and L. Stark. 1971. Scanpaths in saccadic eye movements while viewing and recognizing patterns. Vision Research 11, 9: 929–942. [Google Scholar] [CrossRef]
- Nuthmann, A., T. J. Smith, R. Engbert, and J. M. Henderson. 2010. CRISP: a computational model of fixation durations in scene viewing. Psychological Review 117, 2: 382–405. [Google Scholar] [CrossRef]
- Peters, R. J., A. Iyer, L. Itti, and C. Koch. 2005. Components of bottom-up gaze allocation in natural images. Vision Research 45, 18: 2397–2416. [Google Scholar] [CrossRef]
- Rayner, K., X. S. Li, C. C. Williams, K. R. Cave, and A. D. Well. 2007. Eye movements during information processing tasks: Individual differences and cultural effects. Vision Research 47, 21: 2714–2726. [Google Scholar] [CrossRef]
- Smith, T. J., and J. M. Henderson. 2009. Facilitation of return during scene viewing. Visual Cognition 17, (6): 1083–1108. [Google Scholar] [CrossRef]
- Tatler, B. W., R. J. Baddeley, and I. D. Gilchrist. 2005. Visual correlates of fixation selection: effects of scale and time. Vision Research 45, 5: 643–659. [Google Scholar]
- Tatler, B. W., M. Hayhoe, M. Land, and D. Ballard. 2011. Eye guidance in natural vision: reinterpreting salience. Journal of Vision 11, 5. [Google Scholar]
- Tatler, B. W., and B. T. Vincent. 2008. Systematic tendencies in scene viewing. Journal of Eye Movement Research 2, 2: 1/18. [Google Scholar]
- Torralba, A., A. Oliva, M. S. Castelhano, and J. M. Henderson. 2006. Contextual guidance of eye movements and attention in real-world scenes: The role of global features in object search. Psychological Review 113, 4: 766–786. [Google Scholar]
- Underwood, G., and T. Foulsham. 2006. Visual saliency and semantic incongruency influence eye movements when inspecting pictures. Quarterly Journal Of Experimental Psychology 59, 11: 1931–1949. [Google Scholar]
- Underwood, G., T. Foulsham, and K. Humphrey. 2009. Saliency and scan patterns in the inspection of realworld scenes: Eye movements during encoding and recognition. Visual Cognition 17, 6-7: 812–834. [Google Scholar]
- Unema, P. J. A., S. Pannasch, M. Joos, and B. M. Velichkovsky. 2005. Time course of information processing during scene perception: The relationship between saccade amplitude and fixation duration. Visual Cognition 12, 3: 473–494. [Google Scholar] [CrossRef]
- von der Malsburg, T., and S. Vasishth. 2011. What is the scanpath signature of syntactic reanalysis? Journal of Memory and Language 65, 2: 109–127. [Google Scholar] [CrossRef]
© 2012 by the authors. This article is licensed under a Creative Commons Attribution 4.0 International License.