Next Article in Journal
Collecting and Analyzing Eye-Tracking Data in Outdoor Environments
Previous Article in Journal
It’s All About the Transient: Intra-Saccadic Onset Stimuli Do Not Capture Attention
 
 
Journal of Eye Movement Research is published by MDPI from Volume 18 Issue 1 (2025). Previous articles were published by another publisher in Open Access under a CC-BY (or CC-BY-NC-ND) licence, and they are hosted by MDPI on mdpi.com as a courtesy and upon agreement with Bern Open Publishing (BOP).
Article

When East Meets West: Gaze-Contingent Blindspots Abolish Cultural Diversity in Eye Movements for Faces

by
Sébastien Miellet
1,
Lingnan He
2,
Xinyue Zhou
2,
Junpeng Lao
3 and
Roberto Caldara
1
1
University of Fribourg, 1700 Fribourg, Switzerland
2
Sun Yat-sen University, Guangzhou 510275, China
3
University of Glasgow, Glasgow G12 8QQ, UK
J. Eye Mov. Res. 2012, 5(2), 1-12; https://doi.org/10.16910/jemr.5.2.5
Published: 8 May 2012

Abstract

:
Culture impacts on how people sample visual information for face processing. Westerners deploy fixations towards the eyes and the mouth to achieve face recognition. In contrast, Easterners reach equal performance by deploying more central fixations, suggesting an effective extrafoveal information use. However, this hypothesis has not been yet directly investigated, i.e. by providing only extrafoveal information to both groups of observers. We used a parametric gaze-contingent technique dynamically masking central vision the Blindspot – with Western and Eastern observers during face recognition. Westerners shifted progressively towards the typical Eastern central fixation pattern with larger Blindspots, whereas Easterners were insensitive to the Blindspots. These observations clearly show that Easterners preferentially sample information extrafoveally for faces. Conversely, the Western data also show that culturally-dependent visuo-motor strategies can flexibly adjust to constrained visual situations.

Introduction

Eye movement strategies deployed by humans to identify conspecifics are not universal. Since Yarbus (1965), many studies persistently showed, with Western observers, that fixations follow a systematic triangular sequence sampling the eyes and mouth over the course of face identification (e.g., Althoff & Cohen, 1999; Groner, Walder & Groner, 1984; Henderson, Williams & Falk, 2005). However, recent studies showed the deployment of central fixations in Easterners (Blais, Jack, Scheepers, Fiset & Caldara, 2008; Kelly, Liu, Rodger, Miellet, Ge & Caldara, 2011; Kelly, Miellet & Caldara, 2010; Kita, Gunji, Sakihara, Inagaki, Kaga, Nakagawa & Hosokawa, 2010; Rodger, Kelly, Blais & Caldara, 2010). For instance, Blais et al. (2008) have shown that Western Caucasians (WC) predominantly fixate the eye region during face recognition whereas East Asians (EA) focus more on the nose region, yet reach comparable behavioural performance in face recognition (i.e., accuracy and response time) and categorization by race. This finding shows that face processing can be achieved with diverse fundamental scanpaths. Moreover, the cultural biases in visual information sampling as revealed by scanpath 1- extend to the identification of various biological (sheep) and non-biological (greebles) categories of visually homogeneous stimuli (Kelly et al., 2010); 2- are present as early as 7 years old even if they intensify with age (Kelly et al., 2011); 3- do not generalize to other tasks such as animal search in natural visual scenes (Miellet, Zhou, He, Rodger & Caldara, 2010).
The central fixation pattern observed in Easterners is puzzling because a very abundant literature on face recognition robustly showed, in Westerners, that the critical information for face recognition is located in the eyes and partially the mouth, but not the nose (testing Western Caucasian observers in the recognition of Western Caucasian faces: e.g., Davie, Ellis & Shepherd, 1977; Fraser, Craig & Parker, 1990; Haig, 1986; with response classification techniques in normal healthy adults: e.g., Gosselin & Schyns, 2001; Schyns, Bonnar & Gosselin, 2002; and brain damaged patients: Caldara, Schyns, Mayer, Smith, Gosselin & Rossion, 2005; with computational modelling: e.g., Rowley, Baluja & Kanade, 1998; Viola & Jones, 2004). We recently addressed this apparent paradox with the Spotlight technique, by restricting the visual information available to observers with Gaussian apertures, sized 2°, 5° or 8°, and dynamically centered on WCs’ and EAs’ fixations (Caldara, Zhou & Miellet, 2010). Crucially, in the 2° and 5° conditions, the Spolight apertures covered an entire eye, but the eyes and the mouth were not visible when fixating the nose. By contrast, when observers fixated the nose in the 8° condition, the mouth and eyes could be simultaneously viewed. Analysis of fixations strategies showed that the differences reported by Blais et al. (2008) were abolished in the restrictive 2° and 5° conditions with both populations of observers predominantly directing their fixations to the eye region. However, in the 8° condition, when the eyes were visible while fixating the centre of the face, the EA participants reverted to their preferred central landing position. These data suggest that the facial information required to accurately individuate conspecifics is invariant across human beings, but the strategies used to extract this information are likely to be flexible and might be modulated by culture. Therefore, one of the most plausible explanations accounting for EA fixation strategies in face identification would consist of a better use of extrafoveal information in this culture. EA adults fixate the nose region when viewing faces, but actually might exploit the eye region extrafoveally to recognize faces.
One of the most influential, despite arguable, view in the cultural field assumes that the organization of the social systems, in which people develop and live, leads to the diversity in cultural perceptual strategies (for a review see Nisbett & Masuda, 2003; Nisbett & Miyamoto, 2005). In this framework, Western societies are thought to be individualistic, encouraging the pursuit of personal goals (Triandis, 1995). By contrast, Eastern societies are thought to be collectivistic, emphasizing the importance of the group over individual goals. This striking contrast in the societal organizations implies that people in different cultures have fundamentally a different construal of the self and others. This would impact not only in human social interactions, but also critically on the way people afford their (visual) environment (Chiu, 1972; Hsu, 1981; Ji, Zhang & Nisbett, 2005; Markus & Kitayama, 1991; Nisbett, 2003; Triandis, 1989). Westerners would favor the perception and attention to focal objects rather than a context, whereas Easterners would focus more on the relationship between objects. These perceptual biases would be also supported by perceptual strategies of a different nature. Westerners would rely on analytical perceptual processes to adapt to the visual world, whereas Easterners would rely on holistic/global perceptual processes (Nisbett & Miyamoto, 2005). This view has been supported by abundant empirical evidence including: scene perception (e.g., Miyamoto, Nisbett, & Masuda, 2006) and description (e.g., Masuda & Nisbett, 2001), perceptual categorization (Norenzayan, Smith, Kim, & Nisbett, 2002), and eye movements during visual scene processing (Chua, Boland & Nisbett, 2005). It is worth noting that the cultural variation in eye movements during scene perception is highly controversial. While Chua et al. (2005) observed some effects of culture on recognition performance as well as on eye-fixation patterns; Evans, Rotello, Li, and Rayner (2009), Rayner, Castelhano and Yang (2009), and Rayner, Li, Williams, Cave and Well (2007) did not find any consistent difference between the two cultural groups. In short, there is a “causal chain running from social structure to social practice to attention and perception to cognition” (Nisbett and Masuda, 2003).
From these previous results, Miellet et al. (2010) aimed, in a recent study, to address a central question: Is there a mandatory, general perceptual bias modulating extrafoveal information use across cultures? In other words, do EA observers rely more on extrafoveal information than WC observers? To directly address these questions, Miellet et al. (2010) used a gaze-contingent technique designed to dynamically obscure central vision with parametric Blindspots, permitting only extrafoveal information use. The task required the detection and subsequent identification of animals in natural visual scenes. In order to finely assess the central versus extrafoveal influence of visual information, they parametrically manipulated both the Blindspot size (Natural-vision, 2°, 5° or 8°) and the size of the targets (absent, 2°, 5° or 8°). Finally, they used an unbiased, data driven approach based on fixation maps (iMap: Caldara & Miellet, 2011); and introduced novel spatio-temporal analyses in order to finely characterize the dynamics of scene exploration in both groups of observers. The Blindspot is based on a gaze-contingent technique introduced by Rayner and Bertera (1979) and was originally called moving mask. This technique has also been referred as artificial scotoma, simulated scotoma or foveal mask, and has been used in a variety of paradigms: reading (Fine & Rubin, 1999; Rayner & Bertera, 1979, Rayner, Inhoff, Morrison, Slowiaczek & Bertera, 1981), search (Bertera, 1988; Bertera & Rayner, 2000; Cornelissen, Bruin, & Kooijman, 2005; Murphy & Foley-Fisher, 1989; van Diepen & d'Ydewalle, 2003; van Diepen, Ruelens & d'Ydewalle, 1999), visual learning (Castelhano & Henderson, 2008), object identification (Henderson, McClure, Pierce & Schrock, 1997). This gaze-contingent technique has proven very beneficial to investigate the visual processing of peripheral versus central retinal inputs. In Miellet et al.’s study (2010), both groups of observers, Eastern and Western, showed comparable animal identification performance, which decreased as a function of the Blindspot sizes. Importantly, dynamic analysis of the exploration pathways revealed identical oculomotor strategies for both groups of observers during animal search in scenes. This result indicates that there is no such thing as a general (task independent) perceptual bias modulating extrafoveal information use across cultures.
This raises an important question. Do the cultural differences consistently observed on the gaze scanpaths during face recognition reflect differential extrafoveal information use across cultures in this specific, although biologically relevant, task? Indeed, given the discrepancy between Caldara et al. (2010) and Miellet et al. (2010) results (Spotlight technique in face recognition and Blindspot technique during search in natural scenes respectively), it might be that there is not such a thing as a cultural bias in extrafoveal information use or that this bias is confined to face processing. As mentioned before, a method of choice to directly tap into central versus extrafoveal processing is the Blindspot technique.
In order to directly test the hypothesis of a differential use of extrafoveal information across cultures during face recognition, we used the Blindspot technique in an oldnew task with EA and WC participants and with parametric manipulation of the Blindspot size (Natural-vision, 2°, 5° and 8° in order to permit a direct comparison with Caldara et al., 2010 and Miellet et al., 2010 results). If, for face recognition, EA observers rely preferentially on extrafoveally extracted diagnostic features (eyes/mouth) sampled from central fixation locations (on the centre of the face), then the central Blindspot should not alter this extrafoveal extraction and their fixation pattern should not be heavily impacted by the parametric manipulation of the Blindspot size. In contrast, if WC observers preferentially sample foveally the diagnostic features in natural vision, then the Blindspot will impede this sampling strategy and their fixation pattern should progressively shift, as the Blindspot size increases, from the eyes and mouth in natural vision towards the optimal location for extrafoveal sampling of the diagnostic features i.e. the centre of the face. Indeed, the Blindspot precludes the sampling of the diagnostic facial features that are directly fixated. For large Blindspots, the observers would mask the diagnostic features if they fixate them. The diagnostic features are the features that the observers need to sample in order to achieve face recognition (eyes and mouth, see for instance Caldara et al., 2010; Davies, Ellis & Shepherd, 1977; Gosselin & Schyns, 2001; Viola & Jones, 2004). Therefore, we expect that, with large Blindspots, observers will choose a fixation location that allows them to process the diagnostic features without directly fixating them. The middle of the face is the most effective location for sampling extrafoveally eyes and mouth information while minimizing eye movements.
To sum up, we expected to observe, in the naturalvision condition, the well-documented cultural fixation bias for face recognition (central bias for EA observers and eyes-mouth bias for the WC observers). A previous study using the Spotlight technique (Caldara et al., 2010) showed that a gaze-contingent masking of extrafoveal information during face recognition induces a “Westernlike” visual information sampling strategy (fixations on eyes and mouth) among EA observers. Following a similar logic, we hypothesized that the Blindspot technique, by restricting access to central (foveal) visual information, would lead to an “Eastern-like” strategy (fixations on the centre of the face) among WC observers.

Method

Participants

Fifteen Western Caucasian participants from the University of Glasgow, UK (5 males, mean age 25.9 years) and fifteen East Asian participants from the Sun Yat-Sen University, Guangzhou, China (7 males, mean age 24.8 years) participated in this study. All participants had normal or corrected vision and were paid £6 or equivalent per hour for their participation. All participants gave written informed consent and the protocol was approved by the local ethical committees.

Stimuli

Stimuli were obtained from the KDEF (Lundqvist, Flykt & Öhman, 1998) and AFID (Bang, Kim & Choi, 2001) databases and consisted of 56 East Asian and 56 Western Caucasian identities containing equal numbers of males and females. The images were 382x390 pixels in size, subtending 15.6° degrees of visual angle vertically and 15.3° degrees of visual angle horizontally, which represents the size of a real face (approximately 19 cm in height). Faces from the original databases were aligned by the authors on the eye and mouth positions; the images were rescaled to align those facial features position and normalized for luminance. Images were viewed at a distance of 70 cm, reflecting a natural distance during human interaction (Hall, 1966). All images were cropped around the face to remove clothing and were devoid of distinctive features (scarf, jewellery, facial hair etc.). Faces were presented on a 800x600 pixel grey background displayed on a Dell P1130 19” CRT monitor with a refresh rate of 170 Hz.

Eye-Tracking

Eye movements were recorded at a sampling rate of 1000 Hz with the SR Research Desktop-Mount EyeLink 2K eyetracker (with a chin/forehead rest), which has an average gaze position error of about 0.25°, a spatial resolution of 0.01° and a linear output over the range of the monitor used. Only the dominant eye of each participant was tracked although viewing was binocular. The experiment was implemented in Matlab (R2007a), using the Psychophysics (PTB-3) and EyeLink Toolbox extensions (Brainard, 1997; Cornelissen, Peters, & Palmer, 2002). Calibrations of eye fixations were conducted at the beginning of the experiment using a nine-point fixation procedure as implemented in the EyeLink API (see Eye-Link Manual) and using Matlab software. Calibrations were then validated with the EyeLink software and repeated when necessary until the optimal calibration criterion was reached. At the beginning of each trial, participants were instructed to fixate a series of crosses centered in the 4 quadrants of the screen in order to validate the calibration. Then, they had to fixate a cross at the centre of the screen to perform a drift correction. If the drift correction was more than 0.5°, a new calibration was launched to insure an optimal tracking accuracy. The eyetracker, software and setting used in Glasgow and Sun Yat-Sen universities were identical. The Blindspot was either absent (Natural-vision), 2°, 5° or 8° degrees of visual angle, and moved contingent to the participant’s gaze position. The display contingent to gaze position updating required 11ms on average (between 8 and 14ms), eliminating any impression of flickering for the observers.

Procedure

The observers of both groups were exposed to the four Blindspot conditions (Natural-vision, 2°, 5° or 8° degrees of visual angle) in a random order. To ensure that observers would deploy a reliable strategy with the gaze contingent technique, the Blindspot conditions were blocked. Participants started the experiment with a training session in order to familiarize them with the four Blindspot sizes. Then, they were informed that they would be presented with a series of faces to learn and subsequently recognize. They were also informed that they would be given four face recognition blocks containing Asian and Caucasian face stimuli (same number of male and female faces in each block) and corresponding to the four Blindspot sizes. In each block (one block for each Blindspot size), observers were instructed to learn 7 face identities randomly displaying either neutral, happy or disgust expressions. After a 30 second pause, a series of 14 faces (7 faces from the learning phase – 7 new faces) were presented and observers were instructed to indicate as quickly and as accurately as possible whether each face was familiar or not by pressing keys on the keyboard with the index of their left and right hand. Response times and accuracy were collected and analyzed for the purpose of the present experiment. Response buttons were counterbalanced across participants. The emotional expression of the faces was changed between the learning and the recognition stage to avoid trivial image matching strategies.
Each trial started with the presentation of a central fixation cross. Then four crosses were presented, one in the middle of each of the four quadrants of the computer screen. These crosses allowed the experimenter to check that the calibration was still accurate. In this way, we validated the calibration between each trial. A final central fixation cross served as a drift correction, followed by a face presentation. Faces were presented for 5 seconds in the learning phase and until the observer’s response in the recognition phase. To prevent anticipatory strategies, images were presented at random locations on the computer screen. Each trial was subsequently followed by the 6 fixation crosses which preceded the next face stimulus.

Data Analyses

The behavioural performance was measured by the percentages of correct recognition and the reaction time. For the eye-movement analysis, only correct trials were analyzed. Trials further than 2 standard-deviations from the average duration were discarded. Saccades and fixations were determined using a custom algorithm using the same filter parameters as the EyeLink software (saccade velocity threshold = 30°/sec; saccade acceleration threshold = 4000°/sec2) and merging fixations close spatially and temporally (<20ms, <0.3°). Fixation distribution maps were extracted individually for WC and EA observers. Previous studies did not reveal any impact of the task (learning vs. recognition) or the stimulus face race (WC vs. EA) on the statistical fixation maps (Blais et al., 2008; Caldara et al., 2010; Kelly et al., 2010). Here, we analysed the recognition trials and collapsed data for the EA and WC stimuli and face race. We computed the total number of fixations to insure that EA and WC information sampling strategies are comparable. The statistical fixation maps were computed with the iMap toolbox (Caldara & Miellet, 2011). iMap establishes significance using a robust statistical approach correcting for multiple comparisons in the fixation map space, by applying a one-tailed Pixel test (Chauvin, Worsley, Schyns, Arguin & Gosselin, 2005; Zcrit > 4.07; p < .05) for the group fixation maps and a two-tailed Pixel test (Zcrit |4.25|; p < .05) on the differential fixation maps. Finally, for each condition we extracted the average Z-score values for each observer individually, within the regions showing significance in the differential fixation maps for the Natural-vision condition. Cohen’s d effect sizes (Cohen, 1988) of culture were calculated on the average Z-scores for each region showing significance.

Results

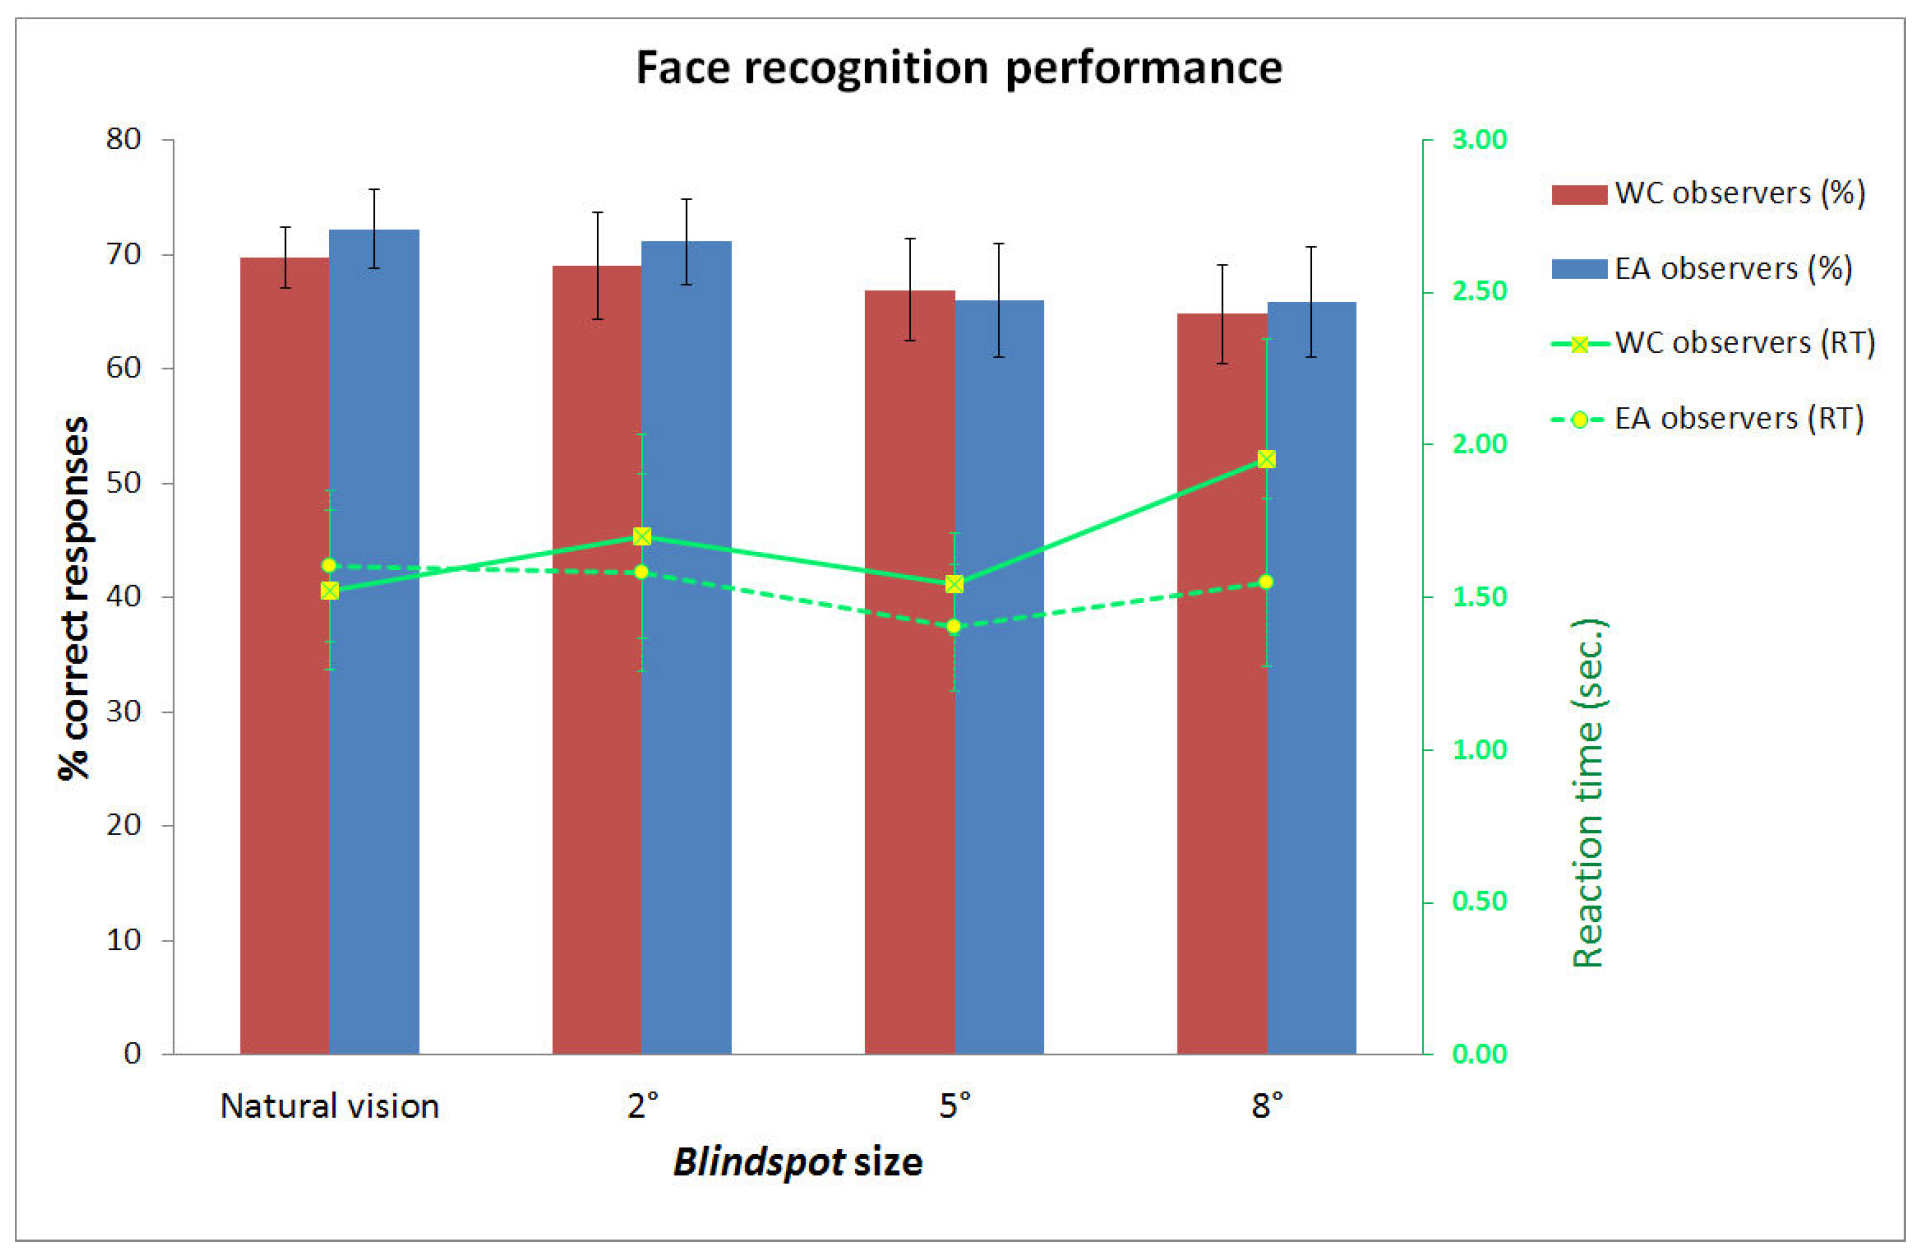
Behavioral Performance

2 (Culture of Observer: Western or Eastern) x 4 (Blindspot size: Natural-vision, 2, 5, 8 degrees) ANOVAs revealed a decrease of face recognition accuracy (F(3, 84)=4.32, p<0.01) and a trend to slower response times (F(3, 84)=2.71, p<0.06) as the Blindspot size increased (Figure 1). Western Caucasian and East Asian observers were equally accurate and fast at recognizing faces (Fs (1, 28) < 1). The interaction between the Culture of the observer and the Blindspot size factors, for accuracy (F(3, 84)=.33, p=.80) and response times (F(3, 84)=1.93, p=.13), failed to reach significance.

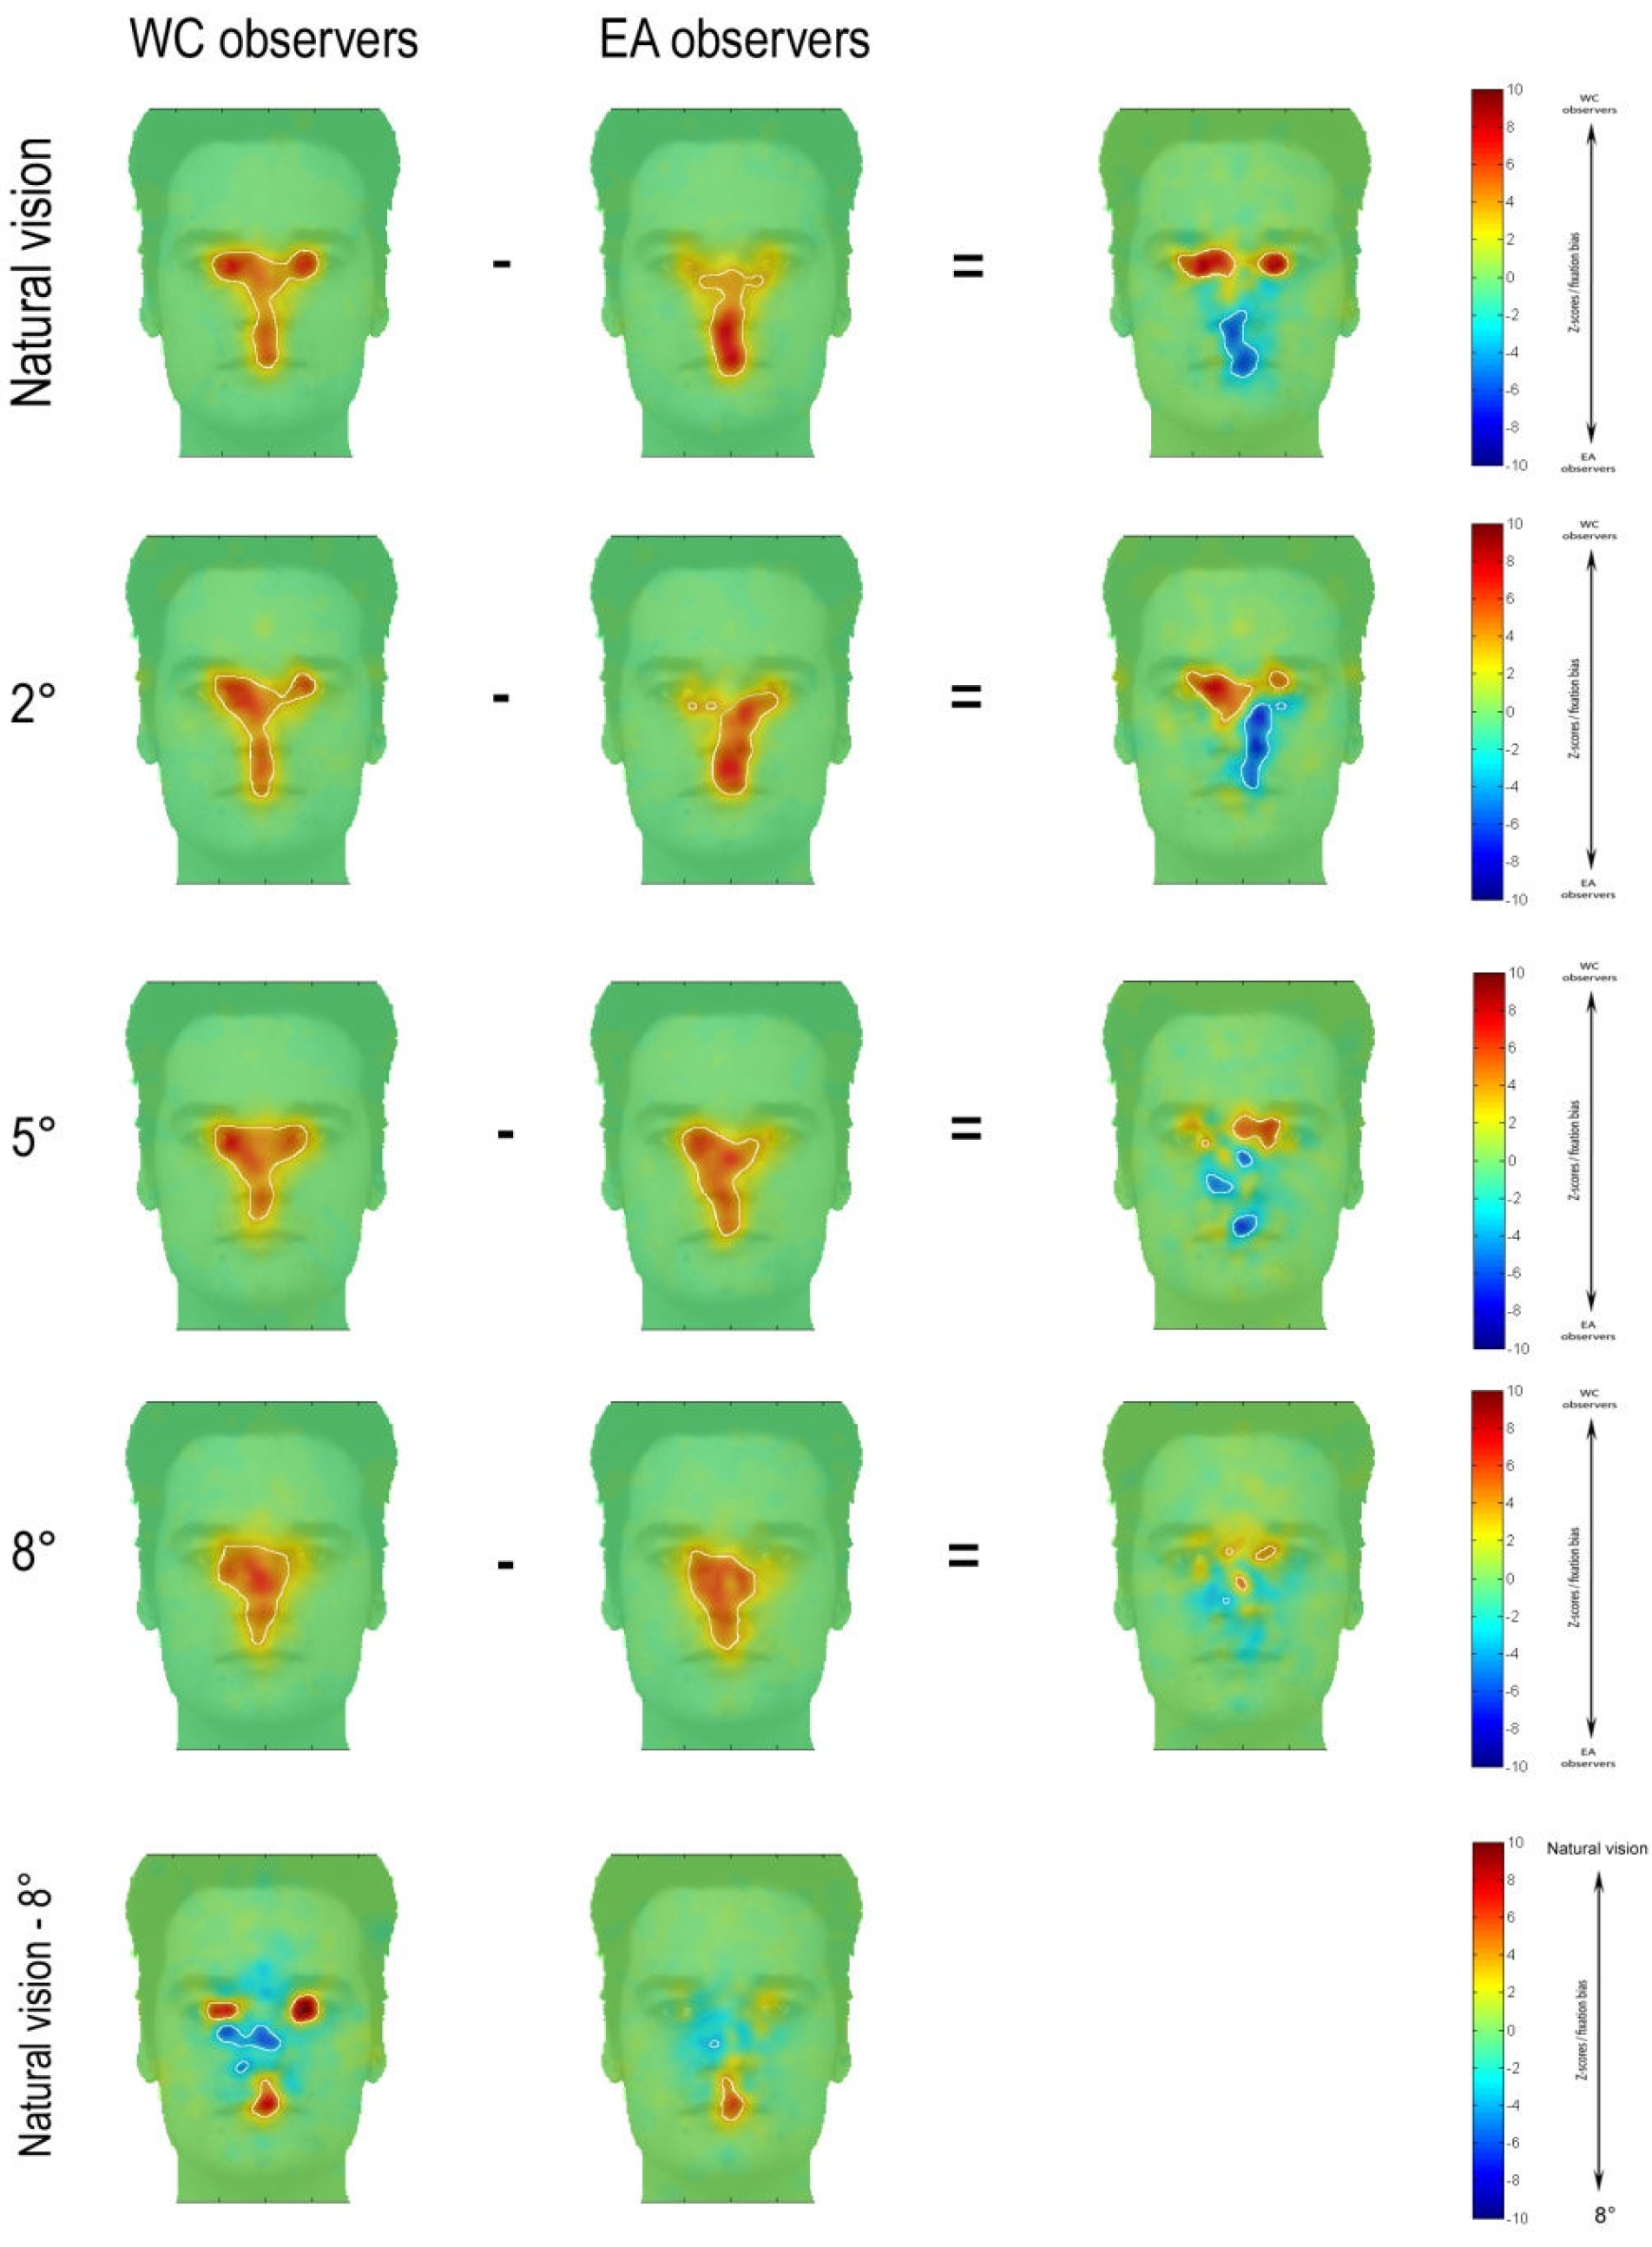
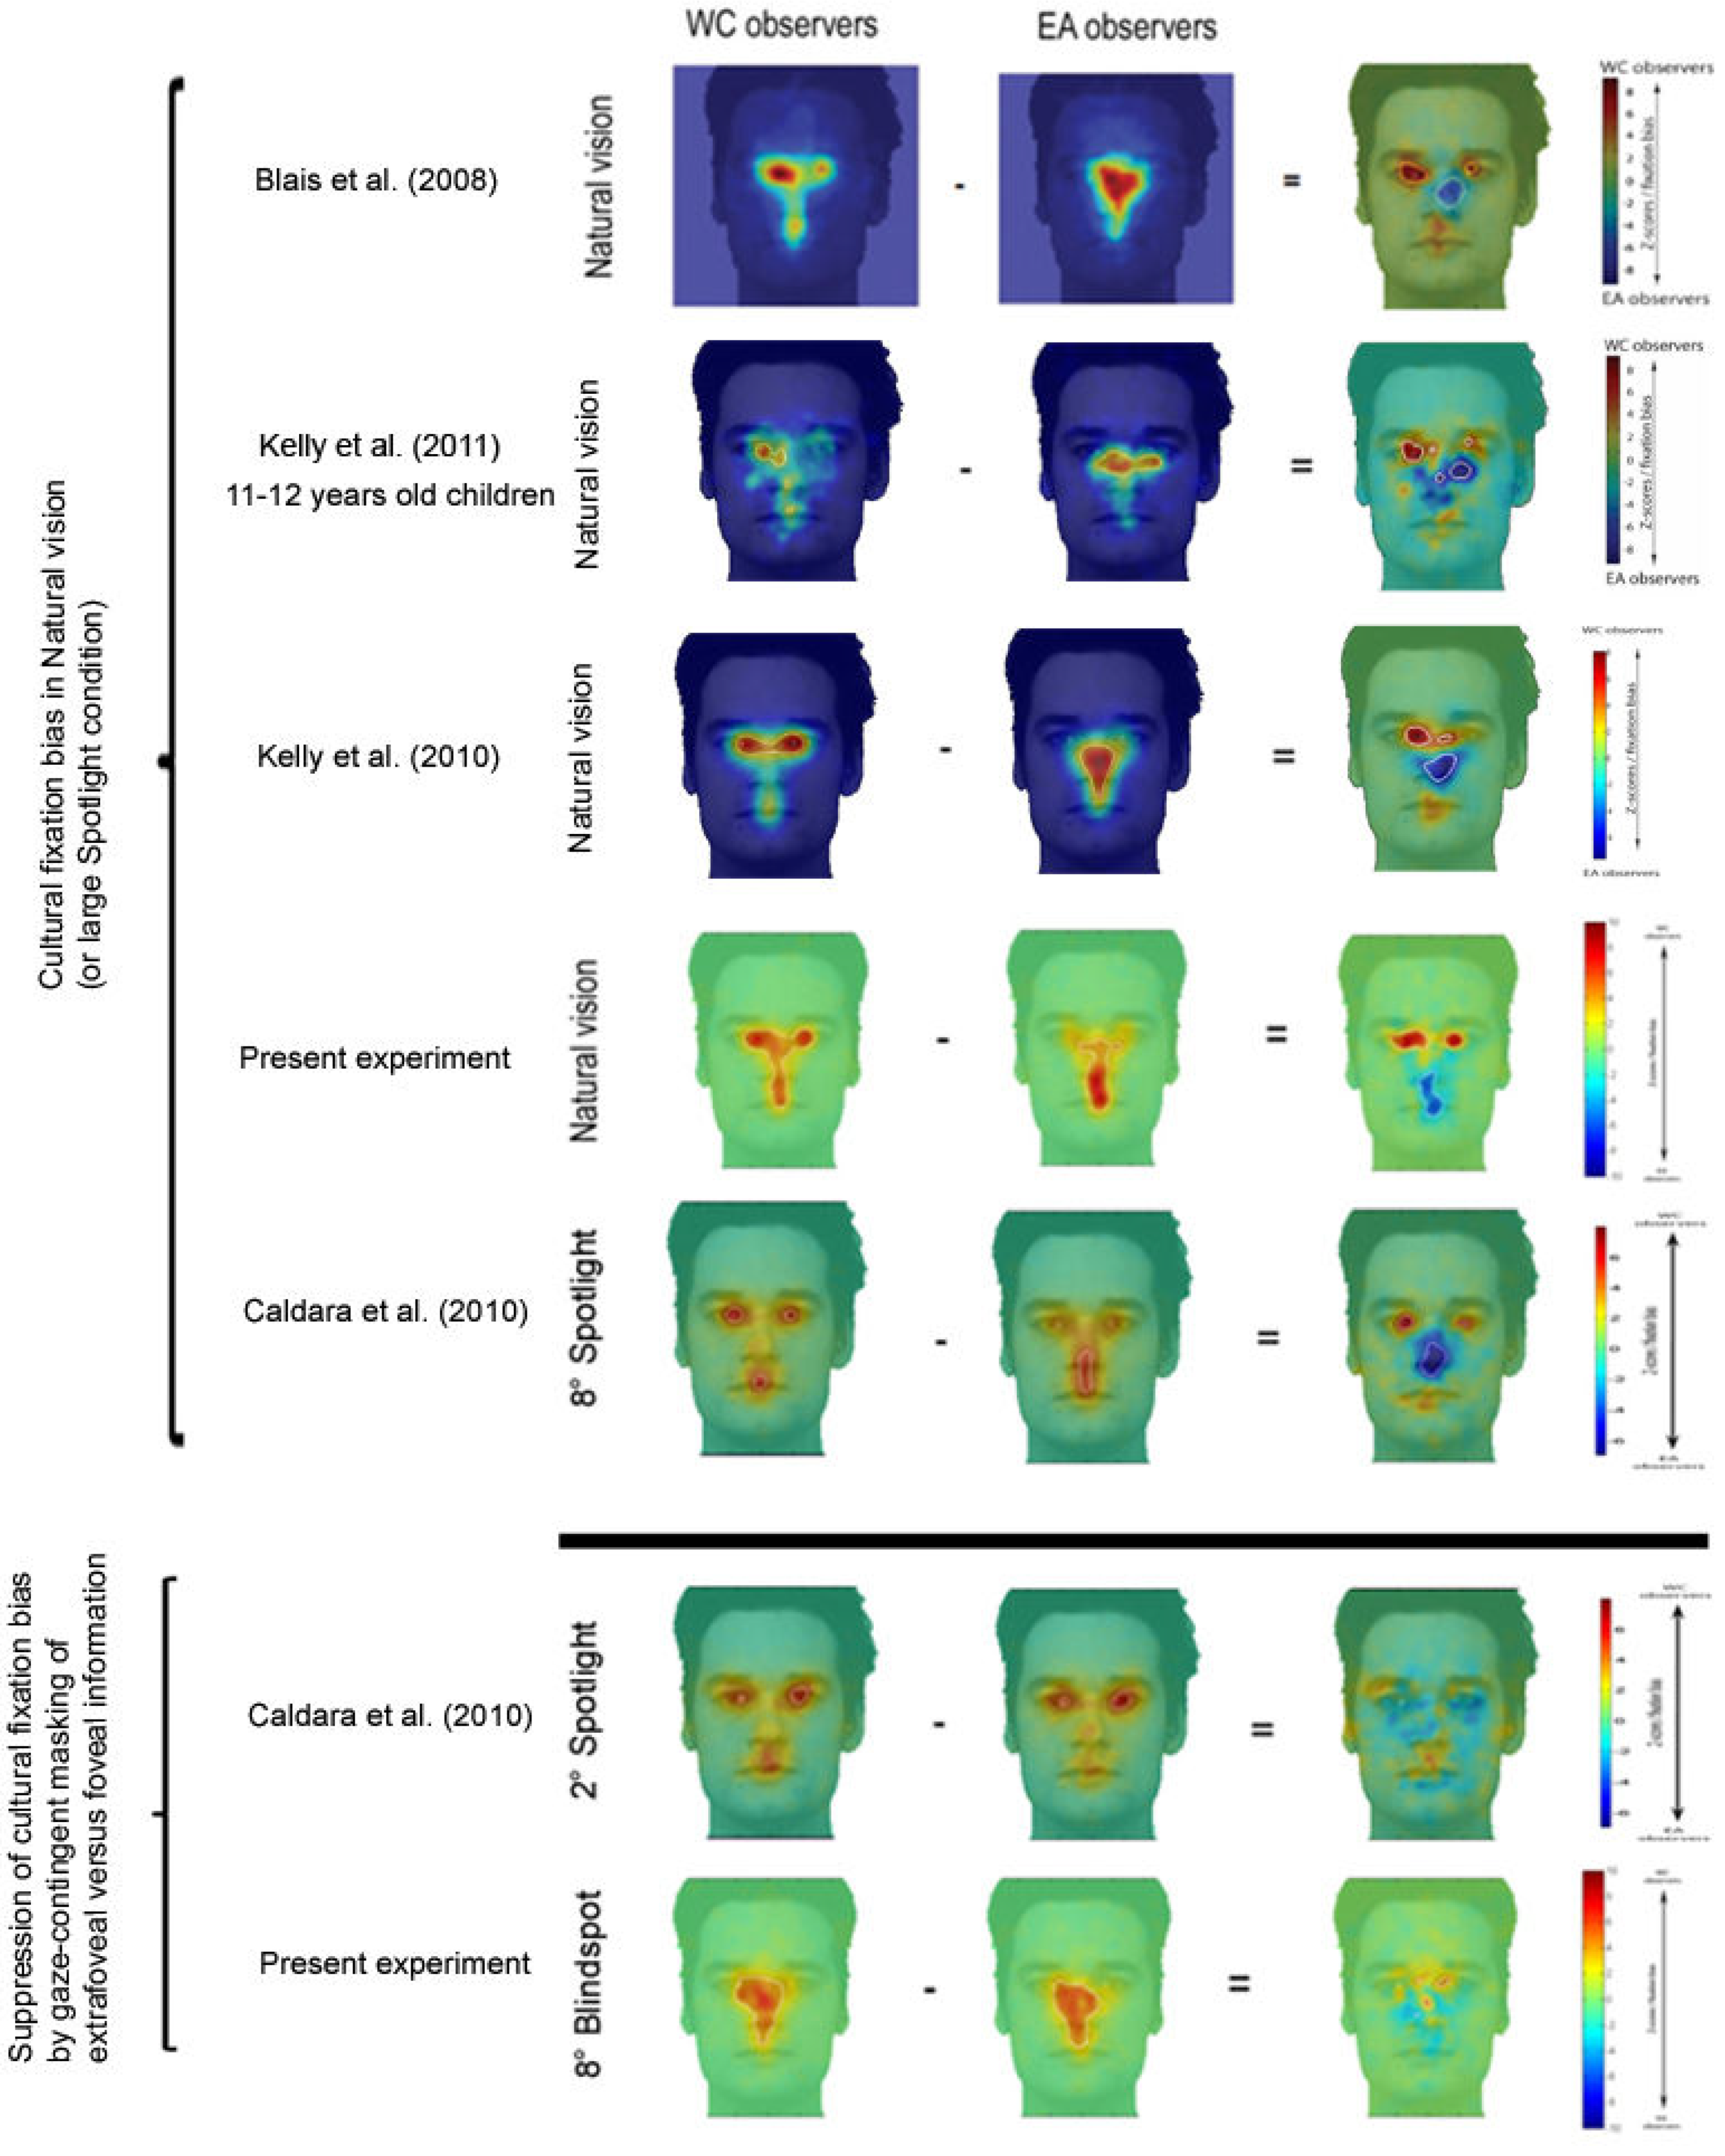
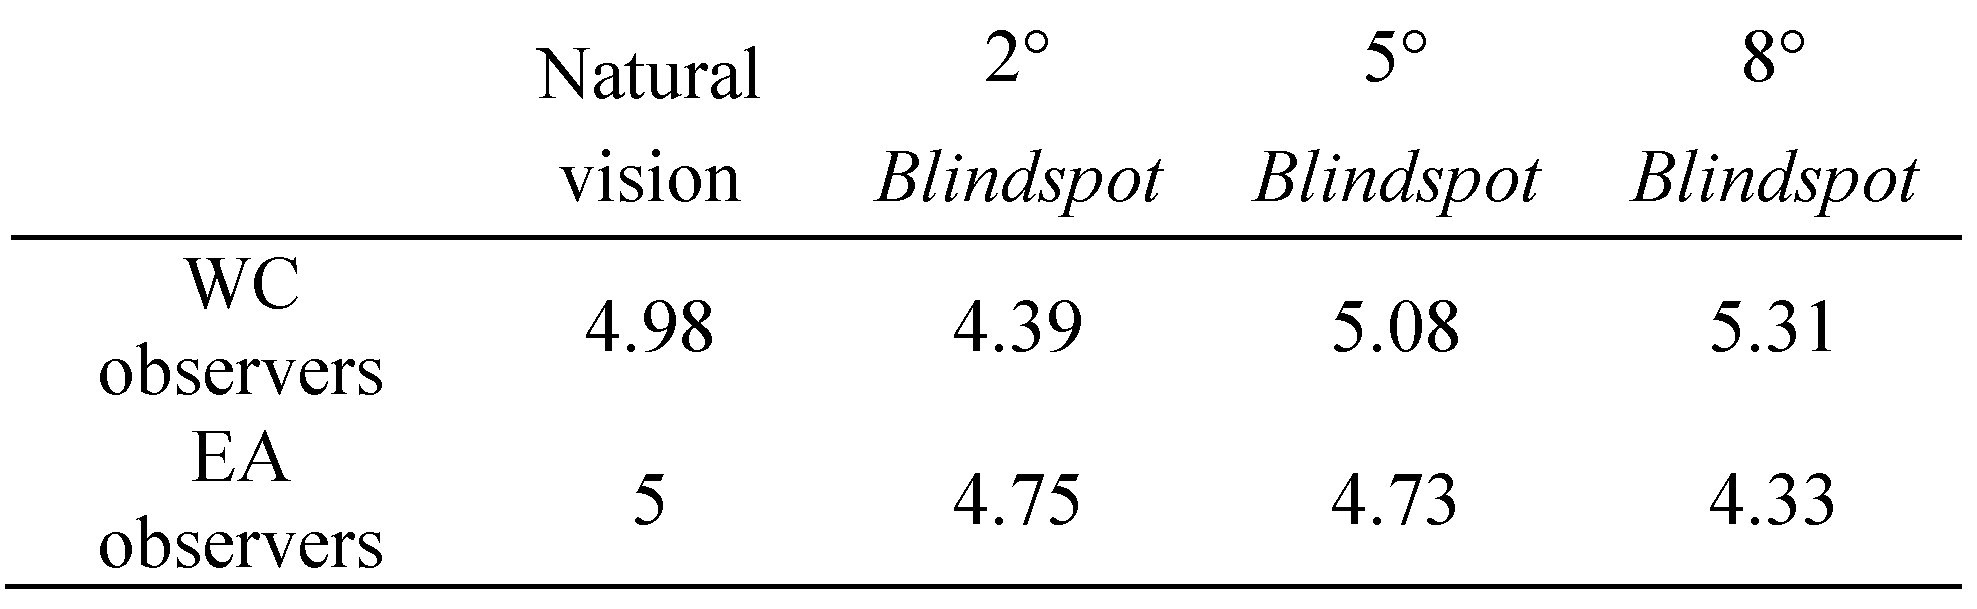
Eye-Tracking Measures

A 2 (Culture of Observer: British or Chinese) x 4 (Blindspot size: No Blindspot, 2, 5, 8 degrees) ANOVA conducted on the number of fixations (Table 1) did not reveal any significant main effects of Culture of observers (F(1, 28) = 1.09, p>.3), Blindspot size (F(3, 84) = 0.53, p>.6), or interaction between Culture of observers and Blindspot size (F(3, 84) = 2.04, p>.11).
Figure 2 shows fixation maps and the regions significantly fixated above chance level according to iMap (white contours) for EA and WC observers and for Natural-vision, 2°, 5° and 8° Blindspot during face recognition. The difference maps reveal the well-established central bias for Easterners (in blue in the difference map) and eye-mouth bias for Westerners (in red in the difference map) in the Natural-vision condition. These cultural fixation biases progressively disappear for larger Blindspots, and in the 8° Blindspot condition, there is no consistent difference between the fixation patterns for WC and EA observers. Crucially, the contrast between the most extreme Blindspot conditions (Natural-vision versus 8°) revealed that Westerners dramatically changed their fixation pattern while Easterners adopted a much more constant exploration strategy (see last row in Figure 2). Easterners keep looking in the middle of the face for Natural-vision or any Blindspot size while the preferred eyes-mouth fixation locations for Westerners in Natural-vision migrate toward the center of the face with increasing Blindspot size.
In order to determine the magnitude of the fixation biases across cultures, we extracted, for each observer, the average of the Z-scored fixation durations within the areas showing significant differences in the differential fixation maps for Natural-vision (Figure 3). Then we carried out, for each of the 4 Blindspot conditions, a two-way mixed design ANOVA on the averaged Z-score values with Face regions (a posteriori determined from the significant differences in the Natural-vision condition, eyes versus centre) as a within-subject factor and Culture of the observer as a between-subjects factor.
These statistical analysis revealed significant interactions for those factors in the Natural-vision and 2° conditions (F(1, 28) = 10.61, p<.003 and F(1, 28) = 5.45, p<.03 respectively). WC observers spent significantly longer fixating the eye region than EA observers in the Naturalvision and 2° conditions as revealed by independent twotailed t-tests (t(28) = 3.25, p<.005 and t(28) = 3.37, p<.03 respectively). In contrast, EA observers fixated longer on the center of the face than WC observers in the Naturalvision condition (t(28) = 2.40, p<.03 ; only a trend was observed in the 2° condition t(28) = 1.78, p=.08). Cultural fixation biases on facial features were reliable and robust, as highlighted by the large magnitude of Cohen’s d effect size values for the significant effects (see Figure 3).

Discussion

In this study we employed the Blindspot gazecontingent technique to unequivocally establish a cultural bias in extrafoveal information use for face recognition. Face recognition performance (accuracy and reaction time) was comparable for both groups of observers and both groups performance deteriorated equally with the Blindspot size increase. Our main prediction was thus confirmed. The cultural fixation bias for face recognition was replicated in the Natural-vision condition. This condition confirmed that WC observers display a triangular fixation pattern sampling the eyes and mouth during face identification (e.g., Althoff & Cohen, 1999; Groner et al., 1984; Henderson et al., 2005), while EA observers favour fixating the centre of the face as reported in many previous eye movement studies (Blais et al., 2008; Kelly et al., 2010; Kita et al., 2010; Rodger et al., 2010). Crucially, Westerners and Easterners showed similar eye movement scanpaths in the large Blindspot condition, with extended fixations towards the centre of the face, abolishing cultural fixation biases observed in natural vision.
Figure 4 summarizes the results obtained in the present experiment and those of previous studies. The upper panel illustrates the cultural fixation biases robustly observed for WC and EA participants during face recognition. The lower panel shows how masking extrafoveal information leads to an Western-like fixation pattern for EA observers (Caldara et al., 2010 with the Spotlight technique) while masking foveal information leads to an Eastern-like fixation pattern for WC observers (present study with the Blindspot technique); both manipulations eliminating differences between the cultural groups fixation pattern. Altogether these results suggest that, in natural vision, Easterners rely more on extrafoveal information sampling during face processing than Westerners; although both groups of observers use the same facial features for face recognition.
Although WC and EA observers show culture-specific information sampling strategies during face recognition, observers of both group are able, under particular constraints (gaze-contingent masking of face information), to use the “opposite” strategy, the one of the other cultural group. Crucially, this strategy shift in response to the viewing conditions is not paired by any loss of performance. Spotlight and Blindspot have the same effect on performance for both groups of observers. This indicate that although WC and EA observers use preferentially distinctive information sampling strategies in face recognition (foveal versus extrafoveal), they do not necessarily extract information more efficiently in their favourite strategy.
Miellet, Caldara & Schyns (2011) recently introduced the iHybrid technique in order to examine whether local or global information subtends face identification. In this technique, two identities are combined in a gazecontingent paradigm using a retinal filter, based on spatial frequency bands decomposition, in order to eliminate any perception of the composite aspect of the stimuli. Hence, iHybrids simultaneously provide local, foveated information from one face and global, extrafoveal information from a second face. Behavioral face identification performance and eye-tracking data show that the visual system can identify faces on the basis of foveally and extrafoveally sampled information. All observers used both strategies, often to recover the very same identity. In short, the consistent cultural bias on fixation patterns during face recognition would reflect a shift between the distributions of foveal versus extrafoveal information sampling strategies for WC versus EA participants. However, it is important to keep in mind that these strategies are not mandatory. In fact, their use seems extremely flexible. The same observer might use one or the other (local/foveal versus global/extrafoveal) on different trials depending on the first fixation location on the face (Miellet et al., 2011). Moreover, EA observers can shift from their favourite strategy (central bias) to the WC observers’ favourite strategy (eyes-mouth bias) without any cost in terms of performance (Caldara et al., 2010 using the Spotlight technique).
In the same way, there is no cost for WC observers to adopt the EA observers’ favorite strategy (present study with the Blindspot technique). The flexibility in information sampling strategy is obviously highly adaptive and enables face recognition despite variations in the viewing conditions such as lighting, distance, first fixation location on the face, occlusions (hair, shade, hat),… It is still unknown how preferential information sampling strategies during face recognition would emerge in a given culture and further studies are necessary to elucidate this point. However, human beings are extremely efficient at assessing others’ gaze direction and they can do it as young as 10 weeks old (Hood, Willen, & Driver, 1998). Thus, alignment and social imitation (see Garrod & Pickering, 2009 for discussion of multilevel alignment) might be sufficient to explain the emergence of such cultural biases in information sampling strategies for face recognition. Importantly, regardless of these theoretical considerations, the present data (together with Caldara et al., 2010 and Miellet et al., 2011) demonstrate that, although different cultural groups adopt preferentially specific visuo-motor strategies for face recognition, individuals can flexibly adapt their information sampling strategies depending on the visual constraints.

Acknowledgments

This study was supported by the Swiss National Science Foundation (100014_138627).

References

  1. Althoff, R. R., and N. J. Cohen. 1999. Eye-movementbased memory effect: a reprocessing effect in face perception. Journal of Experimental Psychology: Learning, Memory & Cognition 25: 997–1010. [Google Scholar]
  2. Bang, S., D. Kim, and S. Choi. 2001. Asian Face Image Database. Edited by Lab IM. Postech, Korea. [Google Scholar]
  3. Bertera, J. H. 1988. The effect of simulated scotomas on visual search in normal subjects. Investigative Ophthalmology & Visual Science 29: 470–475. [Google Scholar]
  4. Bertera, J. H., and K. Rayner. 2000. Eye movements and the span of the effective visual stimulus in visual search. Perception and Psychophysics 62: 576–585. [Google Scholar] [CrossRef] [PubMed]
  5. Blais, C., R. E. Jack, C. Scheepers, D. Fiset, and R. Caldara. 2008. Culture shapes how we look at faces. Public Library of Science ONE 3: e3022. [Google Scholar] [CrossRef] [PubMed]
  6. Brainard, D. H. 1997. The Psychophysics Toolbox. Spatial Vision 10: 433–436. [Google Scholar] [CrossRef]
  7. Caldara, R., and S. Miellet. 2011. iMap: A novel method for statistical fixation mapping of eye movement data. Behavior Research Methods 43, 3: 864–878. [Google Scholar] [CrossRef]
  8. Caldara, R., P. Schyns, E. Mayer, M. L. Smith, F. Gosselin, and B. Rossion. 2005. Does Prosopagnosia Take the Eyes Out of Face Representations? Evidence for a Defect in Representing Diagnostic Facial Information following Brain Damage. Journal of Cognitive Neuroscience 17: 1652–1666. [Google Scholar] [CrossRef]
  9. Caldara, R., X. Zhou, and S. Miellet. 2010. Putting culture under the spotlight reveals universal information use for face recognition. Public Library of Science ONE 5, 3: e9708. [Google Scholar] [CrossRef]
  10. Castelhano, M. S., and J. M. Henderson. 2008. Stable individual differences across images in human saccadic eye movements. Canadian Journal of Experimental Psychology 62: 1–14. [Google Scholar] [CrossRef]
  11. Chauvin, A., K. J. Worsley, P. G. Schyns, M. Arguin, and F. Gosselin. 2005. Accurate statistical tests for smooth classification images. Journal of Vision 5: 659–667. [Google Scholar] [CrossRef]
  12. Chiu, L. H. 1972. A cross-cultural comparison of cognitive styles in Chinese and American children. International Journal of Psychology 7: 235–242. [Google Scholar] [CrossRef]
  13. Chua, H. F., J. E. Boland, and R. E. Nisbett. 2005. Cultural variation in eye movements during scene perception. Proceedings of the National Academy of Sciences, USA, vol. 102, pp. 12629–12633. [Google Scholar]
  14. Cornelissen, F. W., K. J. Bruin, and A. C. Kooijman. 2005. The influence of artificial scotomas on eyemovements during visual search. Optometry & Visual Science 82: 27–35. [Google Scholar]
  15. Cornelissen, F. W., E. M. Peters, and J. Palmer. 2002. The Eyelink Toolbox: eye tracking with MATLAB and the Psychophysics Toolbox. Behavioral Research Methods, Instruments and Computers 34: 613–617. [Google Scholar] [CrossRef] [PubMed]
  16. Davidoff, J., E. Fonteneau, and J. Fagot. 2008. Local and global processing: Observations from a remote culture. Cognition 108, 3: 702–709. [Google Scholar] [CrossRef]
  17. Davies, G., H. Ellis, and J. Shepherd. 1977. Cue saliency in faces as assessed by the "Photofit "technique. Perception 6: 263–269. [Google Scholar] [CrossRef]
  18. Evans, K., C. M. Rotello, X. Li, and K. Rayner. 2009. Scene perception and memory revealed by eye movements and ROC analyses: Does a cultural difference truly exist? Quarterly Journal of Experimental Psychology 62: 276–285. [Google Scholar] [CrossRef]
  19. Fine, E. M., and G. S. Rubin. 1999. Reading with central field loss: number of letters masked is more important than the size of the mask in degrees. Vision Research 39, 4: 747–756. [Google Scholar] [CrossRef]
  20. Fraser, I. H., G. L. Craig, and D. M. Parker. 1990. Reaction time measures of feature saliency in schematic faces. Perception 19: 661–673. [Google Scholar] [CrossRef]
  21. Gosselin, F., and P. G. Schyns. 2001. Bubbles: A technique to reveal the use of information in recognition. Vision Research 41: 2261–2271. [Google Scholar] [CrossRef]
  22. Groner, R., F. Walder, and M. Groner. 1984. Looking at faces: local and global aspects of scanpaths. In Theoretical and applied aspects of eye movements research. Edited by A. G. Gale and F. Johnson. Amsterdam: Elsevier: pp. 523–533. [Google Scholar]
  23. Haig, N. D. 1986. Exploring recognition with interchanged facial features. Perception 15: 235–247. [Google Scholar] [CrossRef]
  24. Hall, E. T. 1966. The Hidden Dimension. New York: Doubleday. [Google Scholar]
  25. Henderson, J. M., K. McClure, S. Pierce, and G. Schrock. 1997. Object identification without foveal vision: Evidence from an artificial scotoma paradigm. Perception & Psychophysics 59: 323–346. [Google Scholar]
  26. Henderson, J. M., C. C. Williams, and R. J. Falk. 2005. Eye movements are functional during face learning. Memory & Cognition 33: 98–106. [Google Scholar]
  27. Hood, M. B., J. D. Willen, and J. Driver. 1998. Adult’s eyes trigger shifts of visual attention in human infants. Psychological Science 9, 2: 131–134. [Google Scholar] [CrossRef]
  28. Hsu, F. L. 1981. Psychosocial homeostasis and jen: Conceptual tools for advancing psychological anthropology. American Anthropology 73: 23–44. [Google Scholar] [CrossRef]
  29. Ji, L., Z. Zhang, and R. E. Nisbett. 2005. Is it culture or is it language? Examination of language effects in crosscultural research on categorization. Journal of Personality and Social Psychology 87: 57–65. [Google Scholar] [CrossRef]
  30. Kelly, D., S. Liu, H. Rodger, S. Miellet, L. Ge, and R. Caldara. 2011. Developing Cultural Differences in Face Processing. Developmental Science 14, 5: 1176–1184. [Google Scholar] [CrossRef] [PubMed]
  31. Kelly, D., S. Miellet, and R. Caldara. 2010. Culture shapes eye movements for visually homogeneous objects. Frontiers in Perception Science 1: 6. [Google Scholar] [CrossRef] [PubMed]
  32. Kita, Y., A. Gunji, K. Sakihara, M. Inagaki, M. Kaga, E. Nakagawa, and T. Hosokawa. 2010. Scanning strategies do not modulate face identification: Eyetracking and near-infrared spectroscopy study. Public Libray of Science ONE 5, 6: e11050. [Google Scholar] [CrossRef]
  33. Lundqvist, D., A. Flykt, and A. Öhman. 1998. The karolinska directed emotional faces. Stockholm, Sweden: Karolinska Institute. [Google Scholar]
  34. Markus, H. R., and S. Kitayama. 1991. Culture and the self: Implications for cognition, emotion, and motivation. Psychological Review 20: 568–579. [Google Scholar] [CrossRef]
  35. Masuda, T., and R. E. Nisbett. 2001. Attending holistically versus analytically: comparing the context sensitivity of Japanese and Americans. Journal of personality and social psychology 81, 5: 922–934. [Google Scholar] [CrossRef]
  36. Miellet, S., R. Caldara, and P. G. Schyns. 2011. Local Jekyll and global Hyde: The dual identity of face identification. Psychological Science 22, 12: 1518–1526. [Google Scholar] [CrossRef]
  37. Miellet, S., X. Zhou, L. He, H. Rodger, and R. Caldara. 2010. Investigating cultural diversity for extrafoveal information use in visual scenes. Journal of Vision 10, 6: 21. [Google Scholar] [CrossRef] [PubMed]
  38. Miyamoto, Y., R. E. Nisbett, and T. Masuda. 2006. Culture and the physical environment. Holistic versus analytic perceptual affordances. Psychological Science 17, 2: 113–119. [Google Scholar] [CrossRef]
  39. Murphy, K. S., and J. A. Foley-Fisher. 1989. Effect of a scotoma on eye movements during visual search. Ophthalmic and Physiological Optics 9: 317–321. [Google Scholar] [CrossRef] [PubMed]
  40. Nisbett, R. E. 2003. The Geography of Thought: How Asians and Westerners Think Differently and Why. The Free Press. [Google Scholar]
  41. Nisbett, R. E., and T. Masuda. 2003. Culture and point of view. Proceedings of the National Academy of Sciences, USA 100: 11163–11170. [Google Scholar] [CrossRef]
  42. Nisbett, R. E., and Y. Miyamoto. 2005. The influence of culture: Holistic versus analytic perception. Trends in Cognitive Sciences 9, 10: 467–473. [Google Scholar] [CrossRef]
  43. Norenzayan, A., E. E. Smith, B. Kim, and R. E. Nisbett. 2002. Cultural preferences for formal versus intuitive reasoning. Cognitive Science 26: 653–684. [Google Scholar] [CrossRef]
  44. Rayner, K., and J. H. Bertera. 1979. Reading without a fovea. Science 206: 468. [Google Scholar] [CrossRef]
  45. Rayner, K., M. S. Castelhano, and J. Yang. 2009. Viewing task influences eye movements during active scene perception. Journal of Experimental Psychology: Learning, Memory, & Cognition 35: 254–259. [Google Scholar]
  46. Rayner, K., A. W. Inhoff, R. Morrison, M. L. Slowiaczek, and J. H. Bertera. 1981. Masking of foveal and parafoveal vision during eye fixations in reading. Journal of Experimental Psychology: Human Perception and Performance 7: 167–179. [Google Scholar] [CrossRef]
  47. Rayner, K., X. Li, C. C. Williams, K. R. Cave, and A.D. Well. 2007. Eye movements during information processing tasks: Individual differences and cultural effects. Vision Research 47, 21: 2714–2726. [Google Scholar] [CrossRef] [PubMed]
  48. Rodger, H., D. Kelly, C. Blais, and R. Caldara. 2010. Inverting faces does not abolish cultural diversity in eye movements. Perception 39, 11: 1491–1503. [Google Scholar] [CrossRef] [PubMed]
  49. Rowley, H. A., S. Baluja, and T. Kanade. 1998. Neural network-based face detection. IEEE Trans on Pattern Analysis and Machine Intelligence 20: 23–38. [Google Scholar]
  50. Schyns, P. G., L. Bonnar, and F. Gosselin. 2002. Show me the features! Understanding recognition from the use of visual information. Psychological Science 13: 402–409. [Google Scholar] [CrossRef] [PubMed]
  51. Triandis, H. C. 1989. The self and social behavior in differing cultural contexts. Psychological Review 96: 269–289. [Google Scholar] [CrossRef]
  52. Triandis, H. C. 1995. Individualism and collectivism. Boulder, C. O.: Westview Press. [Google Scholar]
  53. van Diepen, P. M., and G. d'Ydewalle. 2003. Early peripheral and foveal processing in fixations during scene perception. Visual Cognition 10: 79–100. [Google Scholar] [CrossRef]
  54. van Diepen, P. M., L. Ruelens, and G. d'Ydewalle. 1999. Brief foveal masking during scene perception. Acta Psychologica 101, 1: 91–103. [Google Scholar] [CrossRef]
  55. Viola, P., and M. J. Jones. 2004. Robust real-time face detection. International Journal of Computer Vision 57: 151–173. [Google Scholar] [CrossRef]
  56. Yarbus, A. L. 1965. Role of eye movements in the visual process. Nauka: Moscow, Russia. [Google Scholar]
Figure 1. Average percentage of correct response and reaction time (sec.) for each culture of the observer and Blindspot size.
Jemr 05 00010 g001
Figure 2. Fixation maps for each culture of the observer and Blindspot size. The white contours visualize areas with above chance fixation durations or differences.
Jemr 05 00010 g002
Figure 3. Z-scored fixation durations within the Eyes and Nose areas (showing significant differences in Natural-vision,**:p<.005,*:p<.05 ) for EA and WC observers, and for the four Blindspot conditions.
Jemr 05 00010 g003
Figure 4. Upper panel: Fixation maps showing the fixation biases for WC and EA participants during face recognition in previous studies and present experiment. White contours indicate significant areas according to iMap (Caldara & Miellet, in press) Lower panel: Spotlight (Caldara et al., 2010) and Blindspot’s (present study) results revealing the abolition of differences between the cultural group’s fixation pattern when masking extrafoveal and foveal information respectively.
Jemr 05 00010 g004
Table 1. Average number of fixations during recognition trials for each culture of the observer and Blindspot size.
Jemr 05 00010 i001

