1. Introduction
The aim of gaze guidance is to support the viewer during visual inspection of his/her environment by giving suggestions of where to look (
Barth et al., 2006a,
2006b). Gaze guidance is potentially applicable in situations where the viewer is confronted with a large visual display (or visual field), which needs to be searched for specific information, e.g. while driving a car, when working at a monitor or when analyzing medical images (McNamara et al. 2009;
Kim & Varshney, 2008). The (human) viewer is undoubtedly the most efficient searcher of visual information, yet a viewer can browse detailed visual information only serially; the viewer may tire; or the viewer may be a novice and lack the experience to find specific information in his/her environment. The aim is therefore to point out potentially interesting spots by means of some visual
marker (cue), which would draw the gaze toward those positions. This process of leading gaze through a set of suggested locations should be subtle and non-intrusive, so that the viewer feels least irritated or disrupted by the markers.
A specific guidance system was already tested by McNamara et al. (2008). In their study, observers were asked to count the number of soap bubbles that were placed into a static, virtual-world-like scene, e.g. six fistsized soap bubbles were placed randomly in a virtual office scene. They used a flickering luminance marker, whose amplitude was set to two distinct levels: a high level represented the obvious marker type; a low level represented the subtle marker. The subtle marker was applied in the periphery only (gaze-contingent), was smaller than the soap-bubble target and was never noted by observers; the obvious marker was simply more salient and was clearly noticed by observers. The detection and counting rate was higher for the obvious markers but surprisingly not by much. McNamara’s study clearly demonstrates the potential of unobtrusive gaze guidance.
Another gaze-capturing system is the one developed by Kim and Varshney, who designed a method to attract gaze in 3D-graphic displays (
Kim & Varshney, 2008). Their markers, called ‘persuasive filters’, were designed especially for ‘meshes’ and were created by inverting the center-surround saliency operator.
Both studies were carried out in virtual scenes, which typically contain less visual complexity and noisiness than real-world scenes, in which for instance the luminance of surfaces is much more inhomogeneous. For guidance in real-world scenes, the markers of the above mentioned studies may not be salient enough to attract gaze as they are generated by local subtle manipulations in a noise-free image. The system developed by Barth’s group aims at such a real-world scene guidance, e.g. Vig et al., 2009. Their goal is to guide the viewer through a brief movie with the purpose of manipulating the viewer’s understanding of the movie. In comparison, movies produced by the film industry place the position of the camera such that a viewer’s gaze is placed on the appropriate spot, meaning gaze guidance was already implemented by the director. For simpler types of movies or scenes, guidance needs to be implemented afterward. To pursue this ambitious goal, Barth et al. apply a transformation - based on the Tensor product -, which increases the saliency at image locations that are supposed to attract gaze, and which decreases the saliency at those locations that are to be ignored by the viewer (
Barth et al., 2006a,
2006b). Thus, the marker is not confined to a local area, but can be understood as a global 'lead' generated by the image transformations. The advantage of the method is that it is relatively fast and requires few parameters, but its feasibility in an applied system needs to be demonstrated. In this study, we concentrate rather on a local marker that could be implemented in a relatively straightforward manner.
In all the above mentioned systems the viewer interacts with the system rather passively. For instance, counting the number of occurrences of a visual structure involves merely its detection. Furthermore, observers were under no specific time pressure. But there exist also situations where the observer interacts with a display in a more engaged manner for example in a car cockpit or in a PC setting. Our goal was therefore to create a challenging recognition task, in which the observer had to identify structure and give manual responses. Observers had to detect and identify letters, which appeared transiently, at low-contrast and at a relatively high frequency (see
Figure 1 for the display). A potentially comparable realworld scenario would be the detection and recognition of road signs while driving in dense fog. For such circumstances, little is known about the exact saccadic orienting behavior. For instance, how large is the saccadic constant error, i.e., the undershoot? It is known that for singlesaccade measurements, undershoot measures ca. 8-10% (
Kalesnykas & Hallett, 1994), for a visual search task it is ca. 16% (
Rasche & Gegenfurtner, 2010). This indicates that the more complicated the task is, the more imprecise is saccadic landing. Does this saccadic inaccuracy affect recognition?
To facilitate detection and identification, markers appeared at those spatial locations where a letter was going to appear. Can a marker compensate for the typical saccadic undershoot? How important is the temporal separation between marker and letter (target)? Are certain appearance properties of the marker more gaze-attracting than others? One could expect a moving marker to be more salient for instance.
The letter identification task takes place in a noise display, which has been introduced and described previously already (
Rasche & Gegenfurtner, 2010). The following paragraphs summarize some of its qualities.
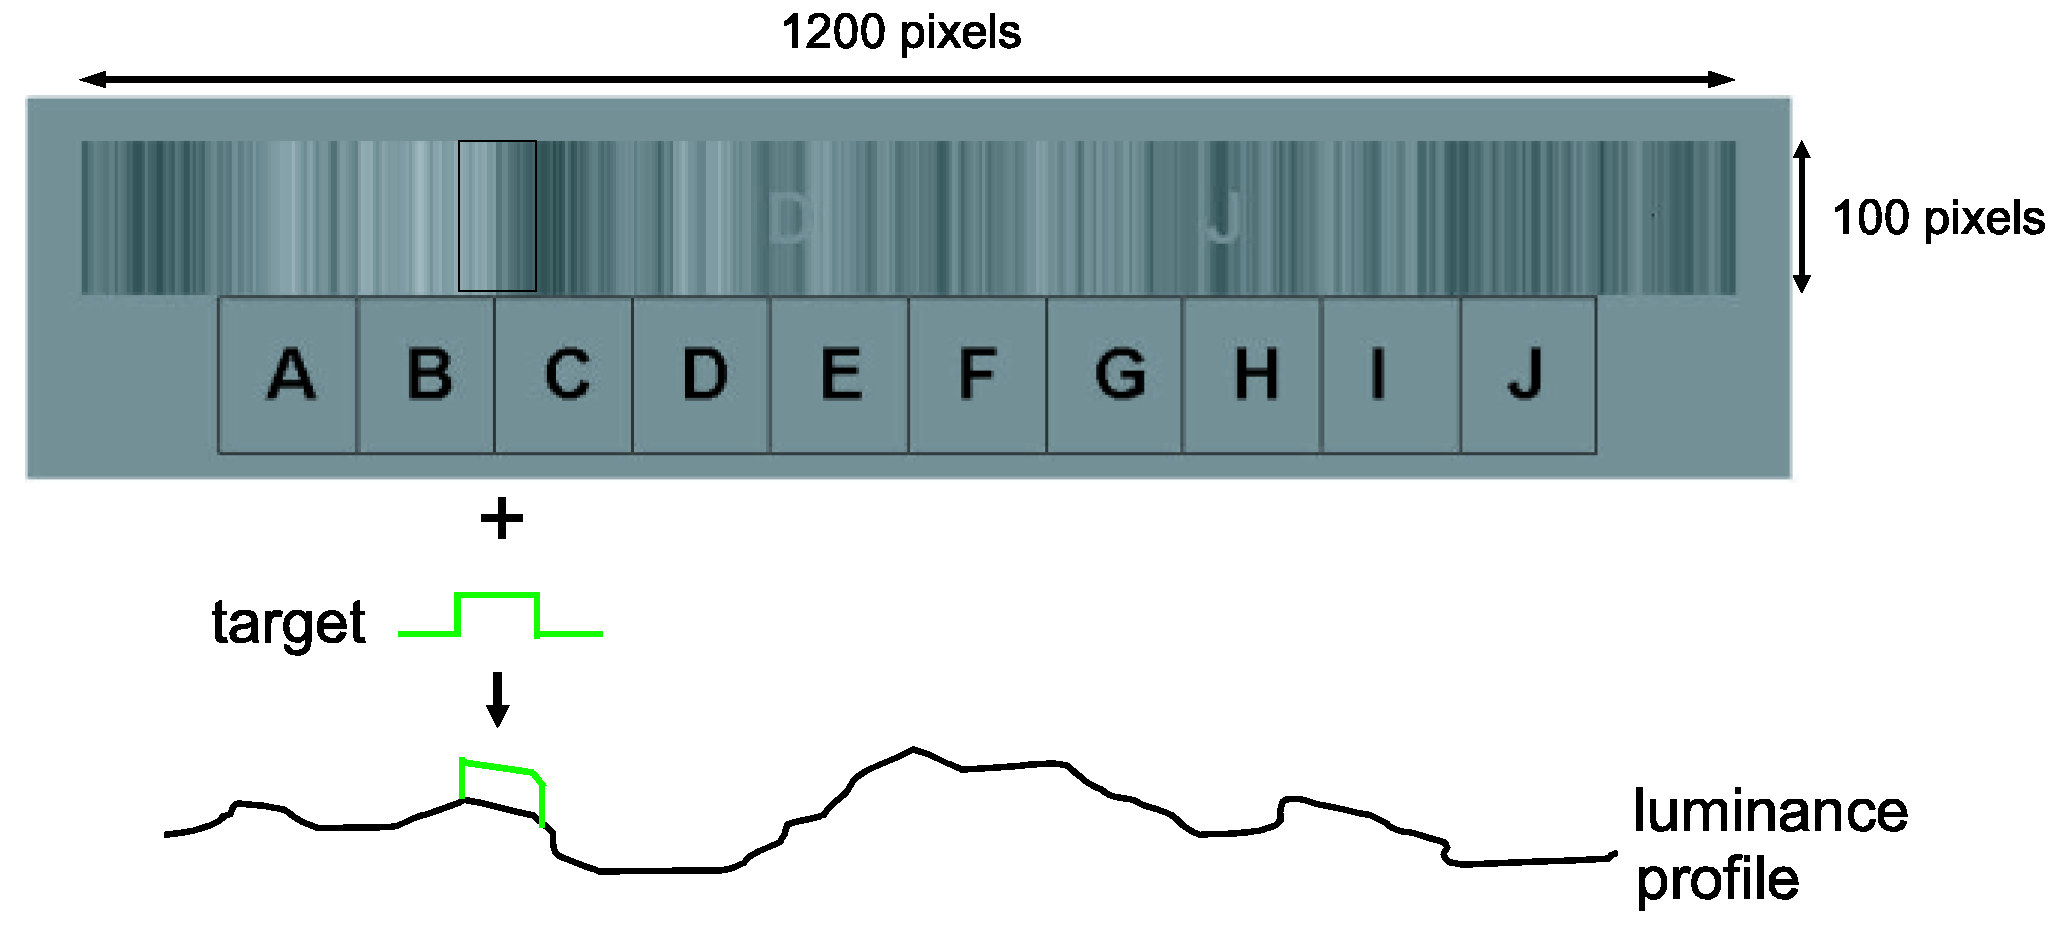
Figure 1.
Letter search and identification task. The bar code (1200x100 pixels) represents a still image of a flickering noise movie whose (temporal and horizontal) frequency spectrum falls off with 1/f. Two letters are shown in the above display, both with high contrast for purposes of demonstration. Below the bar code, the letter menu is displayed, which is used for identification during visual search. A marker was generated by adding a rectangular function to the luminance profile of the bar code (bottom; profile not veridical to bar code). Ca. 6 randomly selected letters were shown per 10-second trial, each one for a duration of 500 ms at a contrast of 0.1 (not to scale in figure).
The display is a dynamic (flickering) bar code, or also called noise movie, see
Figure 1 top for a single frame. The movie is generated from a two-dimensional image, whose power spectrum is correlated in both dimensions in a 1/f relation. Each row is used as the source for a single frame (stretched to a bar code). We chose this type of noise, because the frequency power spectrum of visual images falls off in a 1/f manner (
Field 1987;
Simoncelli & Olshausen, 2001) and because there even exist correlations between frames of movie sequences (
Dong & Attick 1995). A comparison between the statistics of fixation locations and the statistics of non-fixations showed that some of the fixation statistics are surprisingly similar to the ones in natural scenes (
Rasche & Gegenfurtner (
2010), see also Tatler et al. 2005, 2006). Our chosen noise display is therefore more 'distracting' for gaze than a typical psychophysical display and may even be a reasonable approximation to a natural stimulus.
Using this display, the detection rate for a gazedependent marker stimulus was tested. The marker consisted of a small increase in luminance for a limited region (see
Figure 1 for an example). To compensate for the decline in peripheral acuity, the luminance increase was set proportional to gaze eccentricity. During the first few trials of an experiment, observers did not notice the markers, but then learned their appearance. The eccentricity-dependent compensation yielded a relatively constant detection rate (ca. 50%) for eccentricities of up to 25 degrees (Figure 7 in
Rasche & Gegenfurtner, 2010). This eccentricity-dependence adjustment was successfully implemented in an applied study, in which the size of the mouse cursor depended on gaze eccentricity (
Dorr et al., 2009). This gaze-dependent marker is used in this study as well.
3. Results
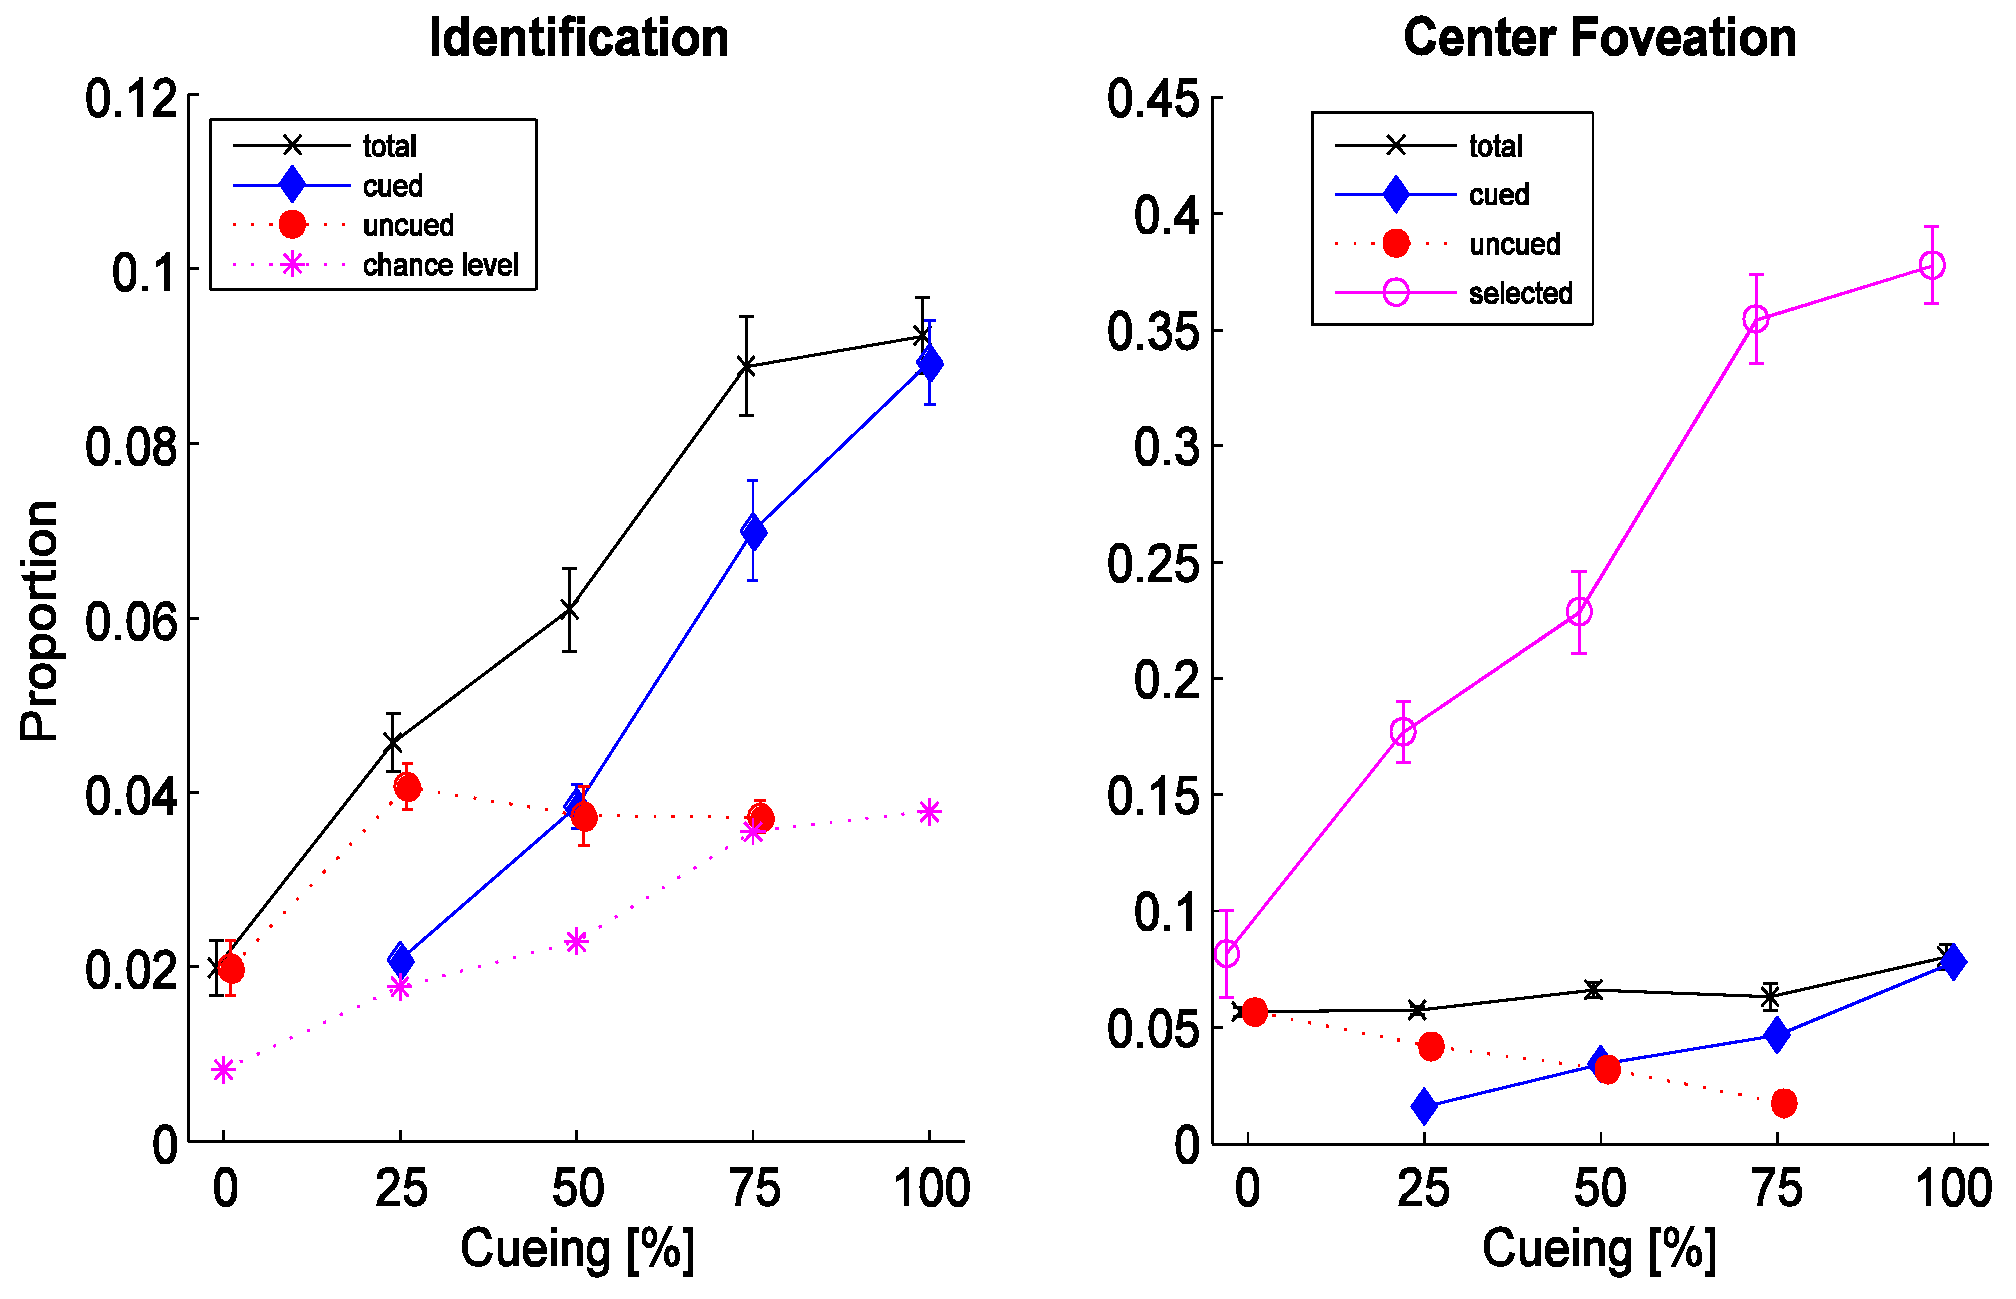
To verify that guidance did facilitate the recognition process, the individual identification rates for cued and uncued letters are plotted separately (
Figure 2 left). The total identification rate, determined as the proportion correct of all selected letters, increases steadily from 0.02 to 0.09 and is significantly different from the distribution of chance level (see next) in a paired T-test of the hypothesis that both observer-averaged distributions have equal means (p=0.009). The absolute identification level is small yet irrelevant to the goal of this experiment. Chance level is calculated as the proportion of manual selections divided by the number of letter types (see
Figure 2, right graph for proportion of manual selections). The performance for cued letters (filled diamonds) increases equally rapid but with a small offset but is statistically different from chance only at a 10 percent level (T-test as above, p=0.091). The uncued identification rate (filled circles) unexpectedly increases slightly from 0% to 25%, but may be explained by an increased propensity to respond when cueing was present. The total rate is not exactly the sum of the cued and uncued rates due to the difficulty of relating the manual identification response to the displayed letter (see also method section). The cued rate at 0% and the uncued rate at 100% for which no actual data points exist, are shown for reason of control. The results so far clearly prove that guidance facilitated the recognition process.
To obtain first insights into the orienting dynamics we now compare the foveation rate - the proportion of letters to which the gaze was moved to - with the selection rate - the proportion of manually selected letters (identification responses). The comparison is made for a ‘foveation hit’ with a 1-degree tolerance representing the center fovea (
Figure 2, right graph). For 0% cueing, the center foveation rate is at a value of around 0.06, whereby the selection rate was only slightly higher, revealing that central foveation was almost a requirement to make an identification response. With increasing amounts of cueing, the selection rate increases rapidly (open circles). A onesample T-test of the hypothesis that the observeraveraged selection rate is the same as its first value showed significant difference (p=0.025); the cued rate increases slower and is also significantly different (T-test as before, p=0.048). This hints that covert attentional shifts must have occurred to obtain ‘certainty’ for the letter identification judgment.
To obtain further clues about the orienting dynamics, we determined the proportion of letter selections for which 0, 1 and 2 saccades toward the target (marker or letter) were carried out, also called no-saccade, onesaccade and two-saccade selections (
Figure 3). For the majority of selections no saccade was carried out, independent of cueing condition (labeled ‘0’, upper left graph called ‘Total’), hinting that covert attentional shifts are the dominant form of orienting to obtain a letter judgment.
One may wonder whether the letter selection process is also based on attentional shifts and hence the criterion for the presence of a saccade toward the menu may not be sufficient. We looked at the individual scan paths of all subjects and observed that there exist many fixations in the letter menu thus justifying the criterion choice.
A large portion of selections was carried out after one saccade toward the target was made (one-saccade selection), ca. 0.35 for all conditions (labeled ‘1’). The proportion of selections, that were carried after two saccades toward the target were made, was small (ca. 0.1) and decreased with increasing amount of cueing; a one-sample T-test of the hypothesis that the observer-averaged distribution is the same as its first value showed significant difference at a 10-percent level (p=0.058). The other plots - the upper right as well as the bottom plots - show the individual proportions for cued and uncued letters for 0, 1 and 2 saccades and are shown for control.
Figure 3.
Proportion of saccades - made toward targets (markers or letters) before letter-identification selection was carried out - as a function of cueing conditions (0%, 25%, …, 100%). Upper left: Total proportion (letters and cues) for 0 (attentional shift only for identification), 1 and 2 saccades. Upper right: Proportion of identification selections for uncued (dashed) and cued (solid) letters, for which no saccade toward the target was made. Lower left: Selection proportion for one saccade. Lower right: Selection proportion for two saccades. Error bars = standard error of inter-observer performance.
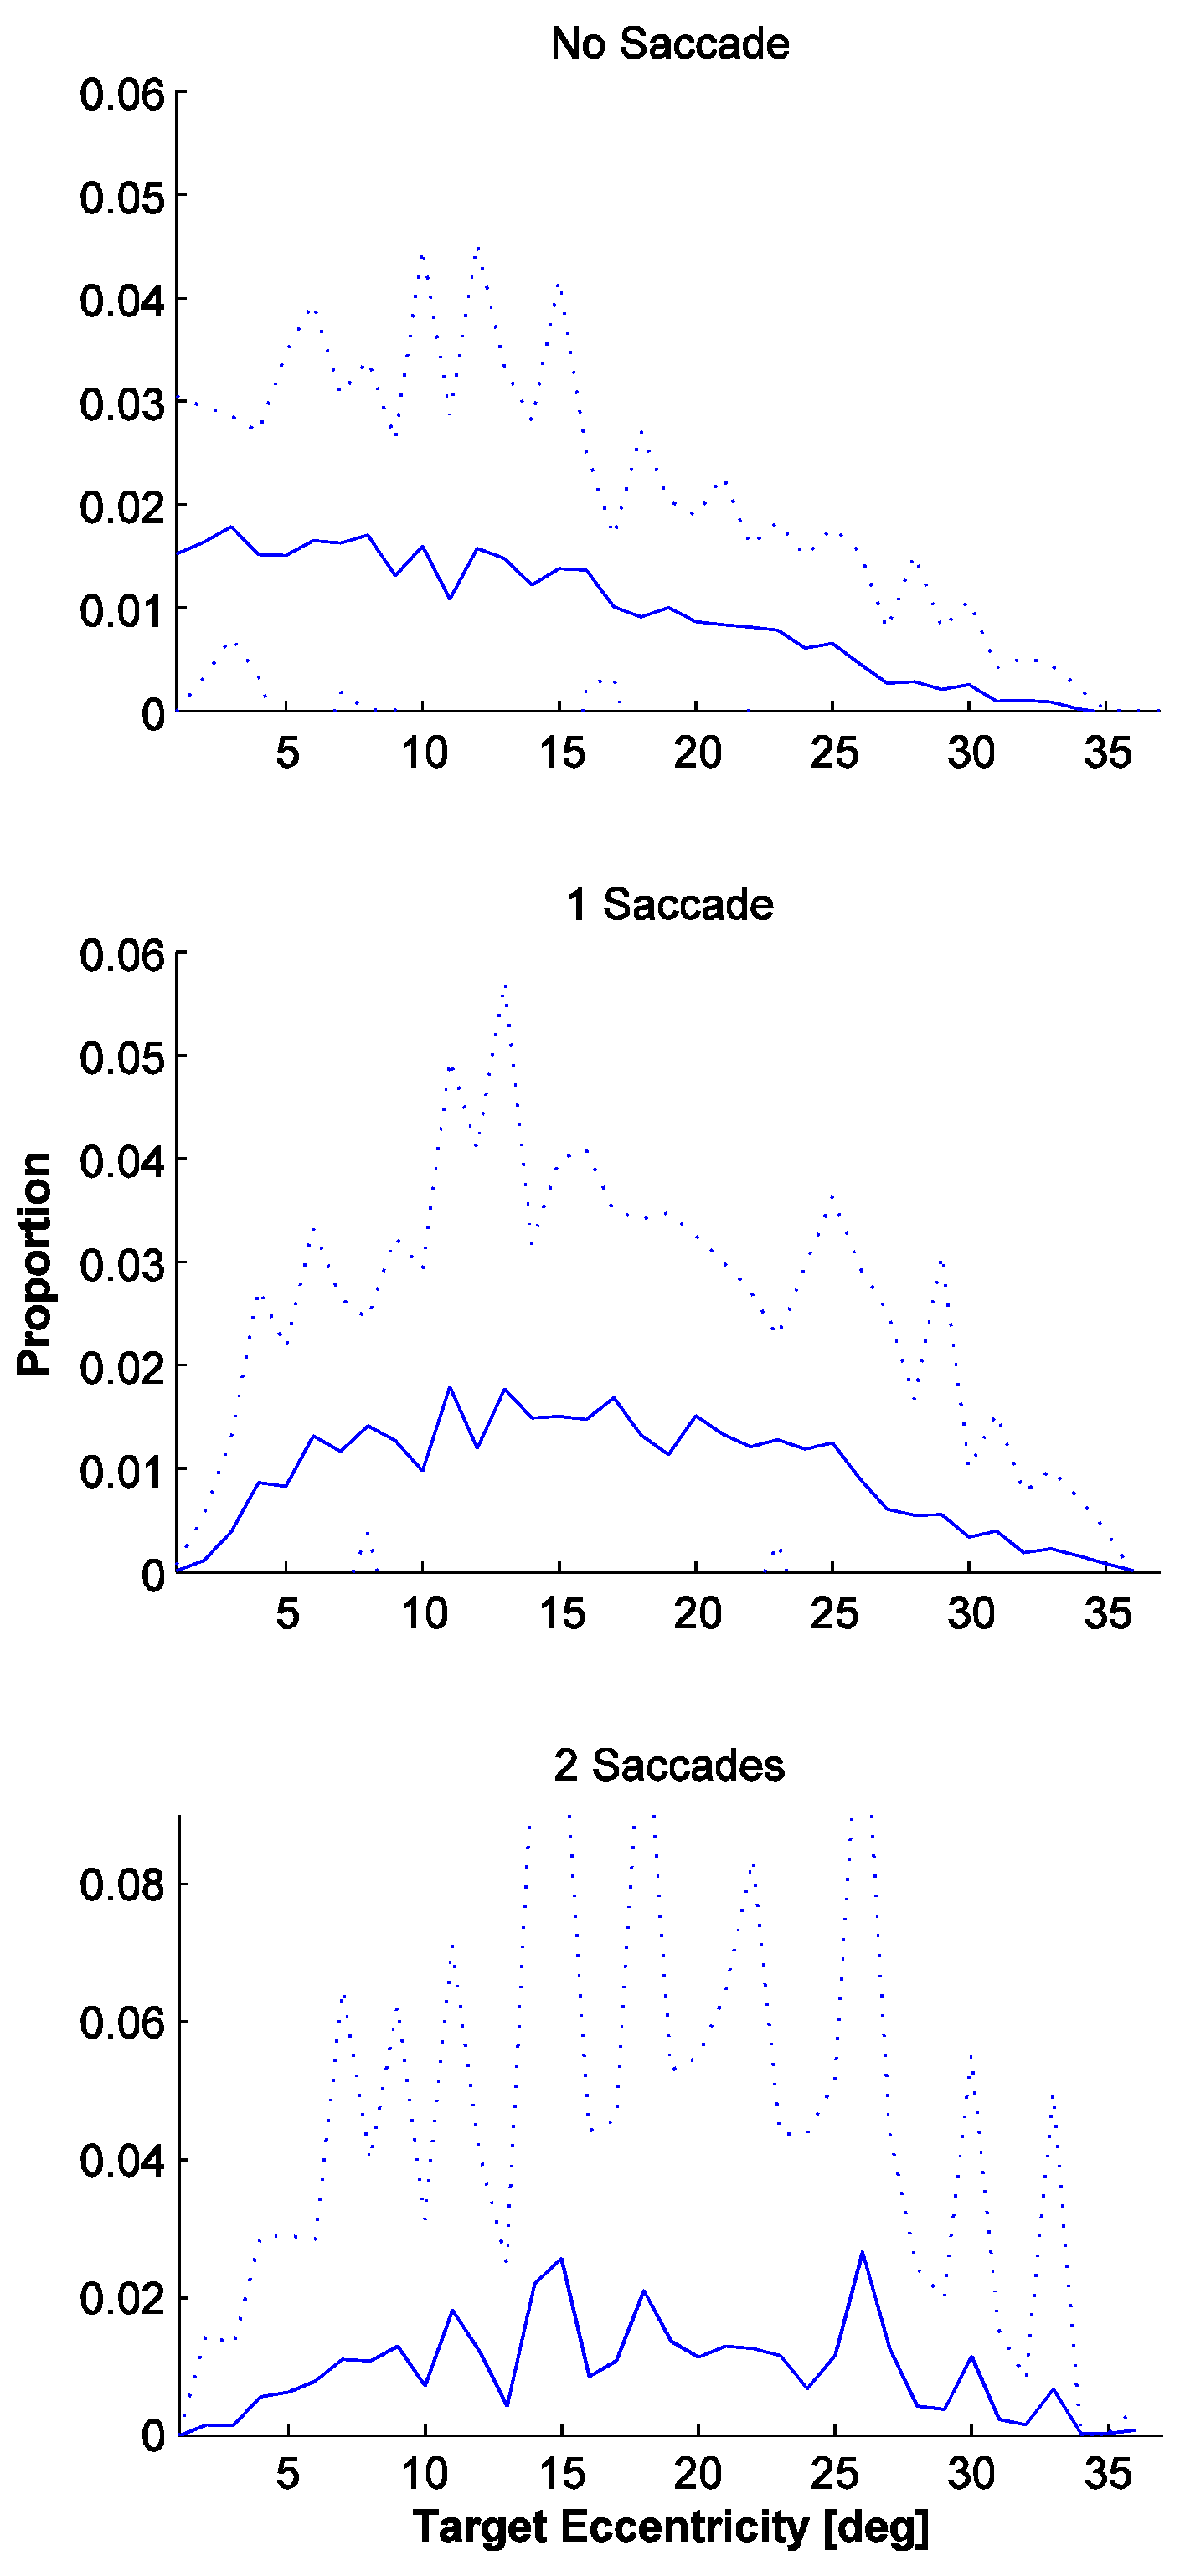
We now perform the eccentricity-dependent analysis of the target location and the saccadic landing precision (
Figure 4 and
Figure 5). This is done for each cueing condition (0%,...,100%) and for cues and letters separately, in an effort to find potential differences in orienting behavior. For each condition, the average across all observers is generated and those condition averages are compared by a T-test, but no statistical differences can be determined. The observer averages are therefore averaged even across cueing conditions, to obtain a distribution of target eccentricities as smooth as possible (
Figure 4). For no-saccade selections, the eccentricity distribution starts high at the center of gaze (0 degrees) and then gradually declines into the far periphery (more than 30 degrees, see top graph). It is emphasized that these shifts do not necessarily imply correct identification. Thus, attentional shifts were favorably carried out for proximal targets. For onesaccade selections the distribution is even and was centered around 15 to 20 degrees (middle graph). It coarsely matches the one for secondary saccades made in the target search (see Figures 8 and 9 in Rasche, Gegenfurtner (2010)). For selections after two saccades the distribution seems to match the one for one-saccade selections.
Figure 4.
Distribution of target eccentricities for identification selections for which 0, 1 and 2 saccades toward the target were made, averaged across cueing conditions (cued/uncued; 0%, 25%, …, 100%). Top: 0 saccade (no-saccade selections). Middle: 1 Saccade. Bottom: 2 Saccades. Dotted = standard error of inter-observer performance.
For the eccentricity-dependent constant-error (undershoot function) we also do not find any significant differences between conditions (T-tests comparing observer averages). We therefore show the variability for one condition, the 50% condition for one-saccade selections (see
Figure 5). The function is much steeper than the one for visual search and shows a constant error of ca. 50%, which is about 3 times as much as for a simple visual search task (error of 16%,
Rasche & Gegenfurtner, 2010).
Figure 5.
Landing precision (constant error) in dependence of target eccentricity for the letter-identification task, when one saccade before letter selection was carried out. Error bars = standard error of inter-observer performance.
Figure 5.
Landing precision (constant error) in dependence of target eccentricity for the letter-identification task, when one saccade before letter selection was carried out. Error bars = standard error of inter-observer performance.
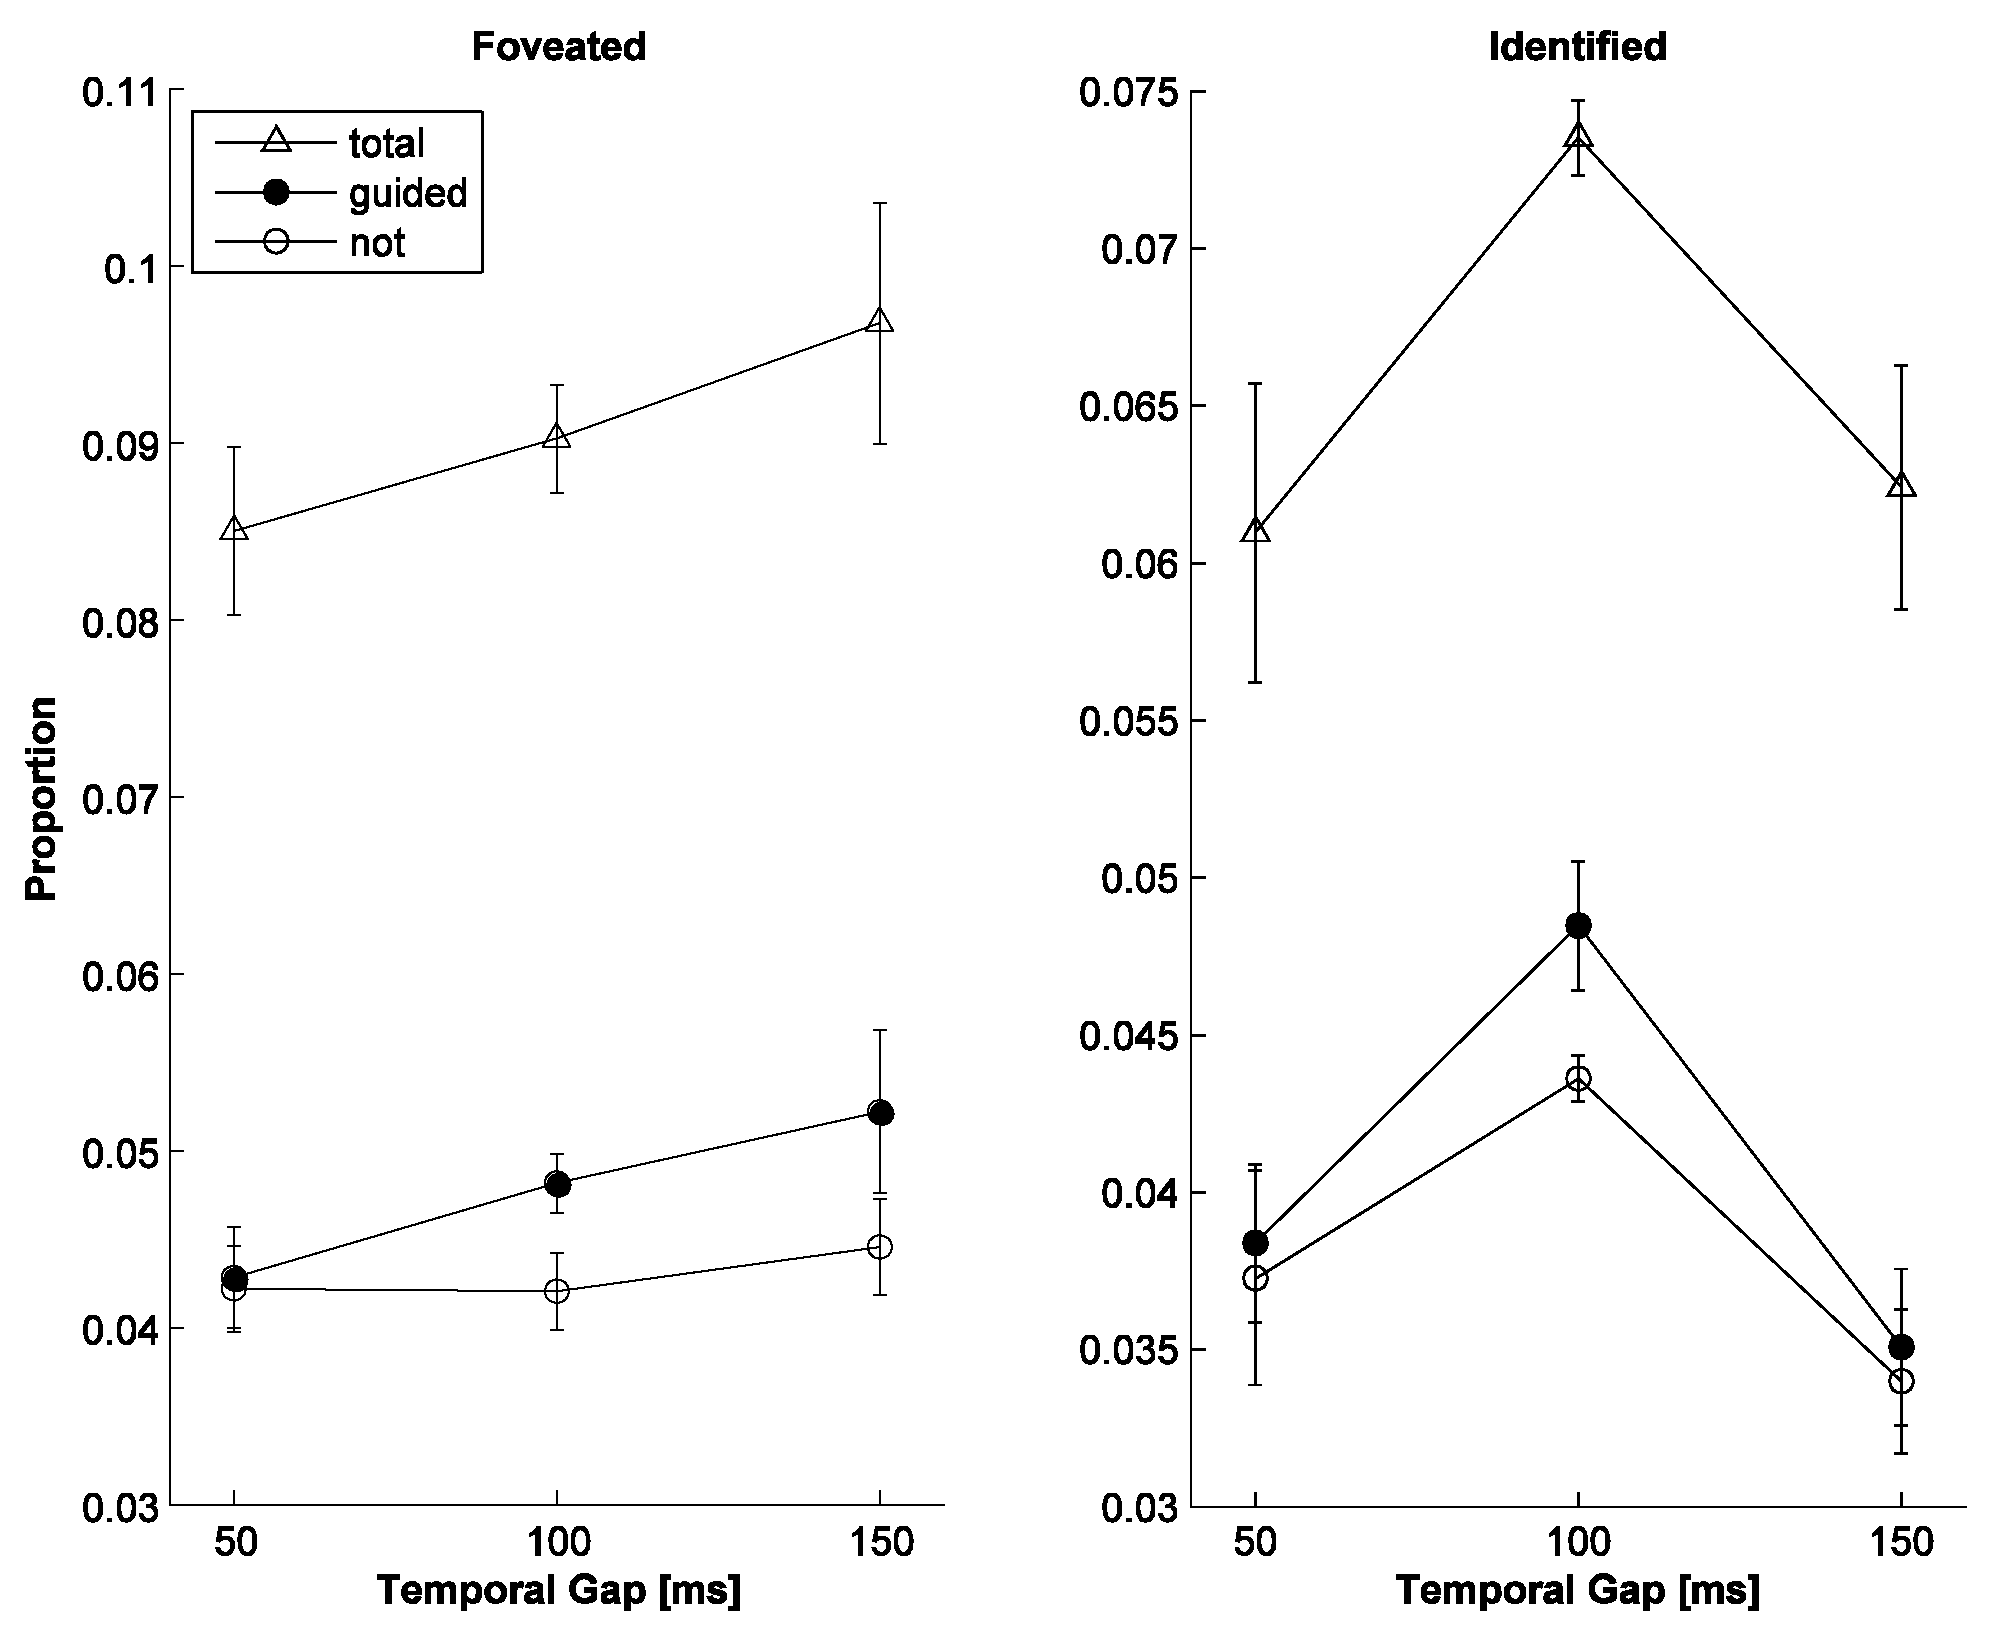
We now test variations of the marker properties in an attempt to find potentially better markers, which could lead to higher task performance. To investigate the timing issue, we varied the temporal gap between marker offset and letter onset (50, 100 and 150 ms). This is carried out with the constant (fixed) marker amplitude at a guidance rate of 50% (
Figure 6). For increasing gap sizes, the total foveation rate steadily increases (triangles); the performance for guided letters and not-guided letters is shown as control. However, for the identification rate, there is a sharp drop for a gap size of 150 ms and the performance for a gap size of 100 ms seems to be close to the optimum.
Figure 6.
Letter foveation and identification rate for three different temporal gaps between marker offset and letter onset for the fixed-amplitude marker (50% guidance). Left: Proportion of foveated letters (total, guided, not-guided). Right: Proportion of identified letters.
Figure 6.
Letter foveation and identification rate for three different temporal gaps between marker offset and letter onset for the fixed-amplitude marker (50% guidance). Left: Proportion of foveated letters (total, guided, not-guided). Right: Proportion of identified letters.
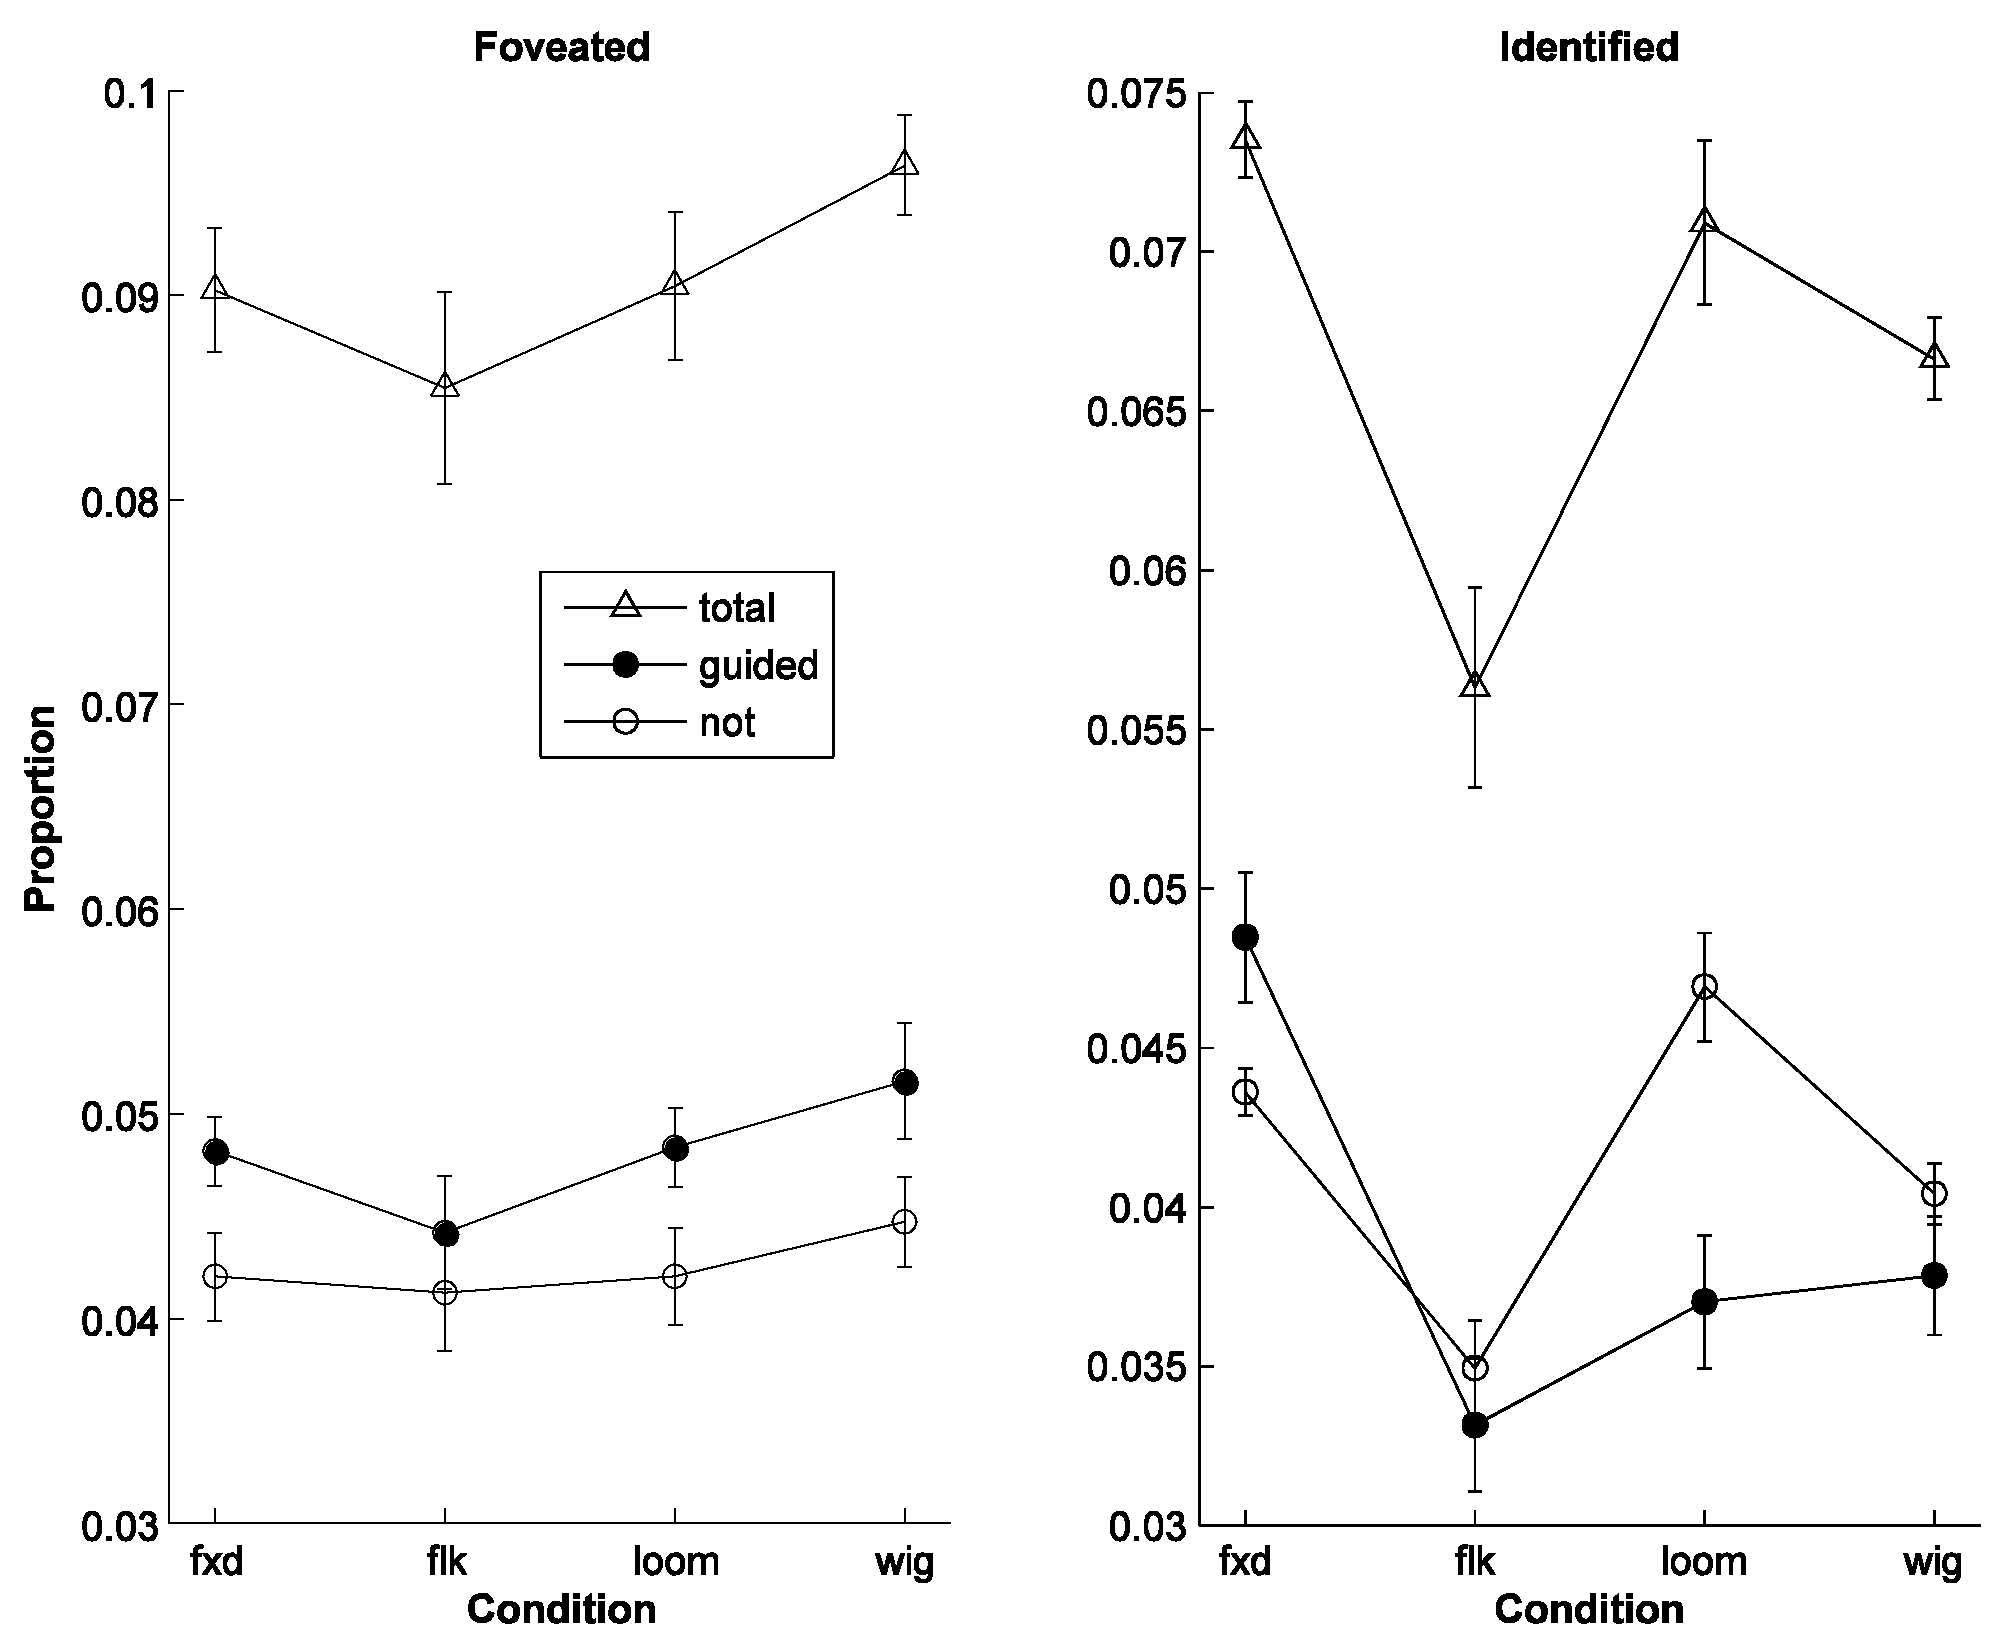
As a temporal gap size of 100 ms seemed the optimum, we used this parameter value when testing 3 other marker variations, a flickering, a looming and a wiggly marker (figure 7). For comparison the performance of the fixed marker used so far is also plotted (label ‘fxd’). For a flickering marker with alternating amplitude (‘flk’) the foveation performance drops slightly (left graph in
Figure 7); for a looming marker (‘loom’) the performance marginally increases; and for a wiggly marker (‘wig’) with an alternating, horizontal displacement along the spatial axis, the performance is highest. Again, the corresponding identification performance looks different (right graph in
Figure 7). It is lowest for the flickering condition, but is highest for the fixed condition. The letter identification performance for guided letters (full circles) is even significantly below the performance for nonguided letters (empty circles). Thus, it seems that this marker type even deteriorates recognition performance.
Figure 7.
Letter foveation and identification rate for different markers (50% guidance; 100 ms gap). Left: Proportion of foveated (total, guided, not-guided). fxd: fixed amplitude (eccentricity-dependent marker without further modification); flk: flickering marker (alternating amplitude); loom: looming marker (gradual amplitude increase and decrease); wig: wiggly marker (alternating spatial displacement). Right: Proportion of identified letters (total, guided, not-guided).
4. Discussion
The principal finding of this study is that despite the presence of a dynamic noise background and despite the low contrast of the letters, observers did not choose to place their gaze upon letters to make identification judgments, but preferred ‘direct’ attentional shifts over saccadic shifts. And if a saccade toward the target was carried out, its constant error was 50% (figure 5), which suggests that the purpose of a saccade was not to land precisely on the target, but rather to bring the target letter somewhat closer in order to perform another, spatially shorter attentional shift. Given this potential strategy, it is no surprise to find that the proportion of two-saccade selections appears to decrease with increasing amount of cueing (
Figure 3, upper left, labeled '2').
Could this saccadic orienting inertia be specific to the experiment? For example, observers may have intended to catch as many letters as possible by viewing the noise movie on a global scale and by consequently suppressing additional saccadic shifts toward the letters. And there is always the possibility that certain parameters of a 'laboratory' experiment cause peculiar behavior. Yet it is still perplexing how robust and far-reaching attentional shifts can be despite the noisiness of the display. It is the marker that encouraged attentional shifts and facilitated identification.
Changing the marker's appearance properties affected the performance in different ways (
Figure 7). The marker manipulations we tested were essentially all some form of ‘motion’ stimulus and given that such stimuli are very salient (
Franconeri & Simons 2003), one could have expected that they increase performance. It is only the wiggly marker, which showed a slight increase in foveation performance, but for identification performance the motion markers were rather detrimental. The reason may have been that such markers do not combine well with a dynamic noise background. In contrast, the ‘fixed’ marker, which pops out as a constant spot in this restless background, may appear as a ‘calm’ guidance. The reason why performance for the flickering marker dropped substantially may have been that the high flicker frequency generates the phenomenon of flicker fusion: with the low amplitude
amrk, the flickering marker may thus simply have appeared at half brightness, and may have been too dim to be noticed as efficiently as the others. There is also the possibility that a motion marker may be more effective in the eye field (outside the parafovea), but the analysis of that is hindered by the difficulty of relating gaze behavior with manual identification responses. But the important lesson drawn from manipulations with these motion markers is that for gaze guidance, the actual identification process should not be underestimated: gaze guidance toward a location is only one aspect of the process, but the identification of structure at that location is another important aspect.
The manipulations with temporal gap sizes aimed at determining the degree of masking (
Figure 6). Masking is the phenomenon that when two stimuli are presented in rapid succession at the same spatial location, then one stimulus can influence or even prohibit the perception of the other (
Coltheart, 1999). Applied to our experiments, this means that a marker can affect the detectability of its guided letter (also called forward-masking). This likely has occurred in case of the 50 ms gap, for which the identification rate was smaller than for the 100 ms gap. But for the larger gap size of 150 ms, identification declined again, possibly because of the intrinsic rhythm of the visual system to move on and to remain only briefly on a fixated spot: the two events (marker and letter) may have been temporally too dissociated.
As our experiments were carried out under strict psychophysical conditions, e.g. using a dark room and a chin rest to fix the head, one may wonder whether the results also extend to more natural conditions. Eye-tracking at a PC monitor or in a car cockpit certainly does not provide the same type of accuracy and the eye-position measurements would therefore show a larger degree of variability. Furthermore, under more natural conditions the amount of undershoot or orienting inaccuracy may be even higher. Hence, the more important is the need for compensating this variability with cleverly placed markers.
We summarize the specific experiences made in this study as a set of caveats and recommendations, which are to be considered when designing a gaze guidance system. We thereby include experiences from our previous study (
Rasche & Gegenfurtner, 2010).
- 1)
To compensate for the decline in peripheral acuity, the marker’s amplitude is set proportional to its eccentricity by an exponentially saturating function: amrk(e)=amin+ amax-exp(-e)amax (amin= minimal amplitude, amax= maximal amplitude).
- 2)
Motion markers can be better gaze-capturing events than stationary markers, however they are potentially detrimental to recognition performance at their location.
- 3)
In case of guidance toward briefly appearing stimuli, the optimal gap size between marker offset and target onset is ca. 100 ms to avoid strong forward-masking effects.