Methods
Participants
Twelve observers (8 males, of whom 1 left-handed; age range 23-36) participated in this study.
Equipment and Software
An EyeLink 1000 System (SR Research, Canada) was used for eye tracking. The participants’ left eyes were tracked at 500 Hz. We used the manufacturer’s software for calibration, validation, drift-correction, and determining saccade and fixation parameters. Participants had their viewing position stabilized by a head and chin rest.
Stimuli were presented on a 41 by 31 cm CRTmonitor (LaCie, Paris, France). Experiments were conducted in a room that was dark, except for the illumination provided by the screen.
Stimuli
Figure 1.
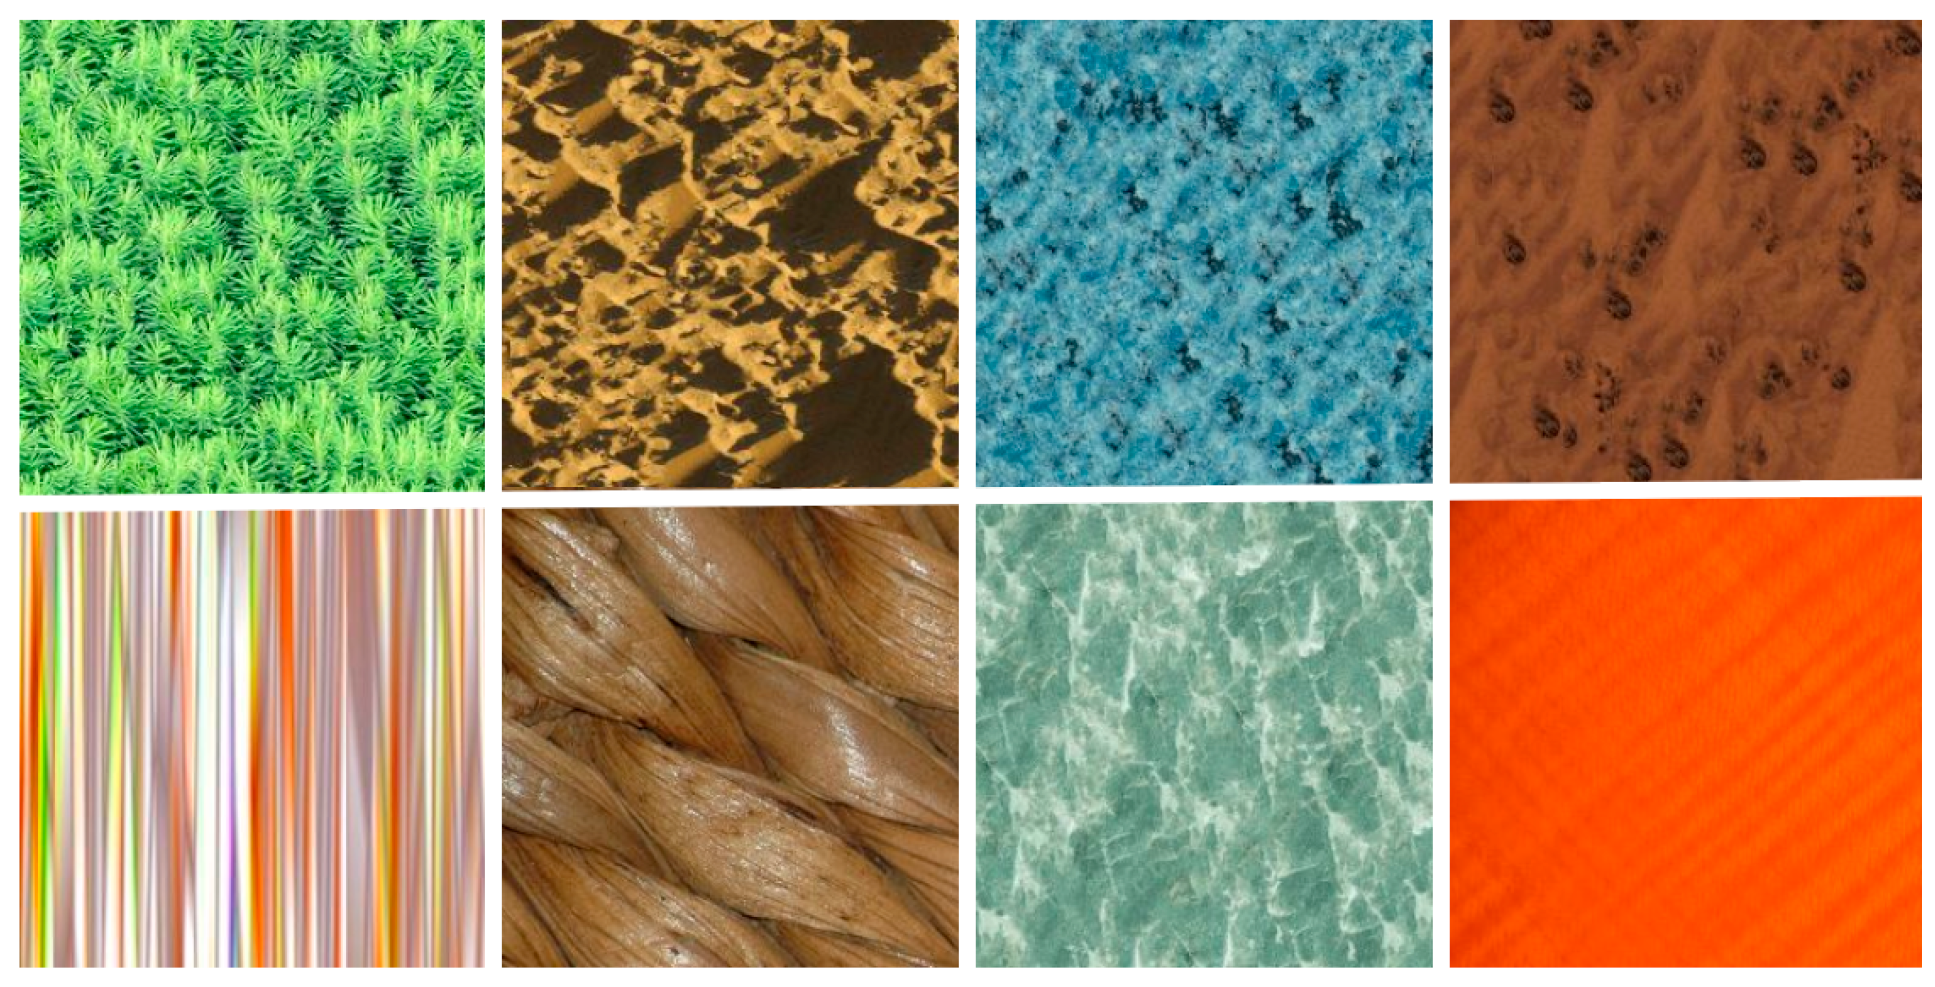
Example textures, used in the experiment. Both computer-generated and natural textures were used, and the set included both colored and grayscaled pictures.
Figure 1.
Example textures, used in the experiment. Both computer-generated and natural textures were used, and the set included both colored and grayscaled pictures.
Texture images had a size of 1280 by 1024 pixels. A texture growth algorithm (
Ashikhmin, 2001) was applied to textures that originally were smaller than this. This growth algorithm does not significantly affect feature values (Jacobs, Haak et al., 2010). When presented, textures filled the entire screen. The visual angle of the stimuli was 39 by 29 degrees. A total of 292 stimuli were presented. We aimed at using a diverse set of texture stimuli. The stimulus set consisted of textures taken from a standard set (
Brodatz, 1966), with additional textures gathered from diverse internet-sources (the set is available on request). Both colored and gray-scaled pictures were included.
Figure 1 shows thumbnails of some of the textures used in the experiments.
Procedure
After signing an informed consent form, participants completed four blocks of trials of judging visual textures. A block typically lasted about 15-20 minutes, and blocks were separated by substantial pauses. No more than two blocks of trials were assessed on a single day. Textures were judged for beauty (B) and for roughness (R), in separate blocks of trails. The order of blocks was either R-B-B-R or B-R-R-B. A single block consisted of 146 trials.
Before starting a block of trials, the participant was instructed to judge the visual textures either on beauty or on roughness. A few test trials were performed before the first block of trials. Following calibration of the eye tracker, the experiment was started. The participant selfinitiated a trial by pressing the spacebar on the computer’s keyboard. A trial started with the presentation of a fixation dot which was used to drift-correct the eyetracker calibration. Next, the fixation dot disappeared and a visual texture was presented for 3500 ms. After disappearance of the texture the fixation dot reappeared, and participants had to indicate their judgment by pressing one of the keys on the numerical part of the keyboard. Key 1 indicated “least beautiful” or “least rough”, while key 9 indicated ”most beautiful” or “most rough”. There was no time limit for making a judgment. The space bar could be pressed to indicate an absence of a judgment. To indicate that the response was registered, the fixation dot increased in size. Following this, the participant initiated the next trial.
Analysis
Criteria for detecting saccades were standard settings for the Eyelink. A saccade was defined by a velocity of at least 30°/s, and an acceleration of at least 8000°/s2, each lasting at least 4 ms. Fixations and saccades starting before the onset of the texture stimulus, or ending after the offset of the texture stimulus were excluded from the analysis.
Per participant and judgment condition, for each texture, the number of fixations, blinks, and saccades were counted, and average fixation duration, cumulative saccade distance (over saccades within a trial), average saccade velocity, average saccade duration, and average pupil size (during the time that stimuli were presented) were computed. In addition, total fixation duration over all trials in a condition was determined. Next, differences in these parameters for the two different conditions were expressed as a contrast, according to the formula:
where V(condition) represents the value of the parameter under study. P can in principle range from –1 to +1. For each participant, the resulting values were averaged over all stimuli. Kolmogorov-Smirnov tests were performed to check for deviations from normality of the distributions of these parameters. Deviations from 0 were statistically tested, over participants. One-sample, twotailed t-tests were performed in SPSS, for all parameters. No correction for multiple testing was performed on these tests, as the parameters are interrelated, and our conclusions are based on the differences as a group, and not so much on the individual parameters.
Fixation contrast maps (
Wooding, 2002) were computed as follows. First, for each individual participant and within each judgment condition, we computed for each stimulus the total amount of time spent fixating each screen location. These values were spatially smoothed with a Gaussian kernel with a standard deviation of 30 pixels. Next, per stimulus a fixation contrast map was computed according to Formula 1, where V(condition) represents the fixation map for a particular judgment condition. Next, the obtained contrast maps were averaged over stimuli. Finally, these maps were averaged over participants, and a familywise-error-corrected nonparametric test (
Nichols & Holmes, 2002) was applied to test for differences in maximum dwell time over the screen.
Correlations between beauty and roughness ratings on the one hand, and pupil size on the other, were computed. This was done both for the pupil size during the judgment (explicit effects of beauty and roughness on pupil size), and for the pupil size during the other judgment (to assess implicit effects of beauty and roughness on pupil size). These correlations were computed per participant. Then, after checking for normality using Kolmogorov-Smirnov tests, one-sample t-tests were conducted to ascertain whether these correlations were significantly different from 0, over participants. We also report some correlations between feature values and ratings and pupil sizes. Considering the amount of features we computed, correction for multiple comparisons would leave none of these relations significant. Hence, we report them without statistical testing, for confirmation in future experiments.
Feature Computation
The texture features most strongly associated with beauty and roughness decisions were determined as follows. First, we computed the correlations between a set of 188 computationally derived features on the one hand, and the beauty and roughness ratings on the other hand. Computed features are based on Gray-Level Cooccurrence Matrices (Haralick, Shanmugam, & Dinstein, 1973), a set of features related to psychological judgments (Tamura, Mori, & Yamawaki, 1978), Neighborhood Gray-Tone Difference Matrices (
Amadasun & King, 1989), the Fourier spectrum (
Tuceryan & Jain, 1998), Gabor energy features (Kim, Park, & Koo, 2005), and features expressing the presence of colors, brightness, and saturation (Datta, Joshi, Li, & Wang, 2006).
The Tamura features are based on psychological evaluations, and comprise coarseness, contrast, directionality, line-likeness, regularity, and roughness. The Gray Level Co-occurrence Matrices indicate how often particular gray levels co-occur at a certain distance. For our purposes, we computed them for distances of 1, 2, 4, and 8 pixels. These matrices are used to compute statistical properties like entropy, energy, homogeneity, et cetera. A Neighborhood Gray Tone Difference Matrix is a vector containing, for each gray-level, a sum of the differences in gray-tone with all the surrounding pixels, for each pixel with that gray-tone. The size of the neighbourhood is variable, and we computed matrices for sizes of 3 by 3 and 5 by 5 pixels. Based on these matrices, the features coarseness, contrast, busyness, complexity, and strength are computed.
Fourier features are based on the spatial frequencies in the brightness variations. The extent to which a certain spatial frequency is present is expressed as its energy or power. First, a two-dimensional image is transformed into the frequency domain using the fast Fourier transform to obtain the Fourier spectrum. Each component of the spectrum is represented by a complex number that describes a frequency in the two-dimensional image by means of amplitude and phase. The component coordinates in the spectrum determine the frequencies’ wavelength and direction. The spatial frequency with highest wavelength (uniform signal, i.e. average brightness) is represented in the centre of the spectrum, while high frequencies can be found on the outside. The average energy of circular bands around the average brightness is computed for different radii. Also, the energy of wedges with their peak at the average brightness is computed, yielding a measure of the orientation of the image. In this way, 12 circular energy, and 24 wedge energy features were computed, each reflecting the presence of information at a different spatial frequency (circular rings) and orientation (wedges). In addition, a number of features summarizing their distribution were computed.
Like Fourier features, Gabor features capture the spatial frequencies in pictures, but they preserve some spatial information. The human visual system is known to contain cells that work as Gabor filters. Gabor ‘energy’, over the entire texture, was computed for 4 spatial frequencies, in six orientations. Average saturation and intensity were based on HSV color space. The presence of the colors red, green, yellow, cyan, blue, and magenta, was computed by partitioning HSV color space into six sectors, and counting the relative frequency of pixels within each sector. The sector frequency was normalized to the average image value and saturation. As we extensively described relations between visual texture features and judgments elsewhere (
Thumfart et al., 2008; Jacobs, Haak et al., 2010), we here restrict ourselves to simply reporting the features correlating most strongly to beauty and roughness judgments.
Features around fixations
To support our idea that differences in eye guidance between the two judgments reflect differences in featurebase attention, we extracted patches around fixations from the textures, and computed the 188 feature values for each of these patches. We then computed average feature values per stimulus, over all fixations. Next, we computed for each stimulus a difference in feature values, according to formula (1), but with absolute values in the denominator, to deal with negative values. Then we computed the means for the 188 feature differences, over subjects. We sorted the resulting (absolute value of) averages, and compared these to permuted data. Our 1000 permutations consisted of switching the feature values between roughness and beauty fixations for randomly selected textures. We then followed the same procedure as with the real data, so that we got 1000 examples of ordered features. We then looked up till what point the real data stayed in the top 5% of the permuted data. Those features were considered to be significantly different between judgments, and the direction of the difference was determined.
Results
Observations
Participants responded well, skipping roughness judgment on 1.2% of the stimuli, and beauty judgment on 1.6 % of stimuli.
Observers did make eye movements. On average, 8.0 fixations (and as fixations alternate with saccades, a similar number of saccades) were made in the 3500 ms period that textures were presented. Over all participants, 26 trials were encountered in which no fixations (and hence, also no, or maximally one, saccade) fell completely within the stimulus duration. Such trials did not contribute to average durations computed over all trials, and derived measures, but they did contribute to the counts of saccades and fixations.
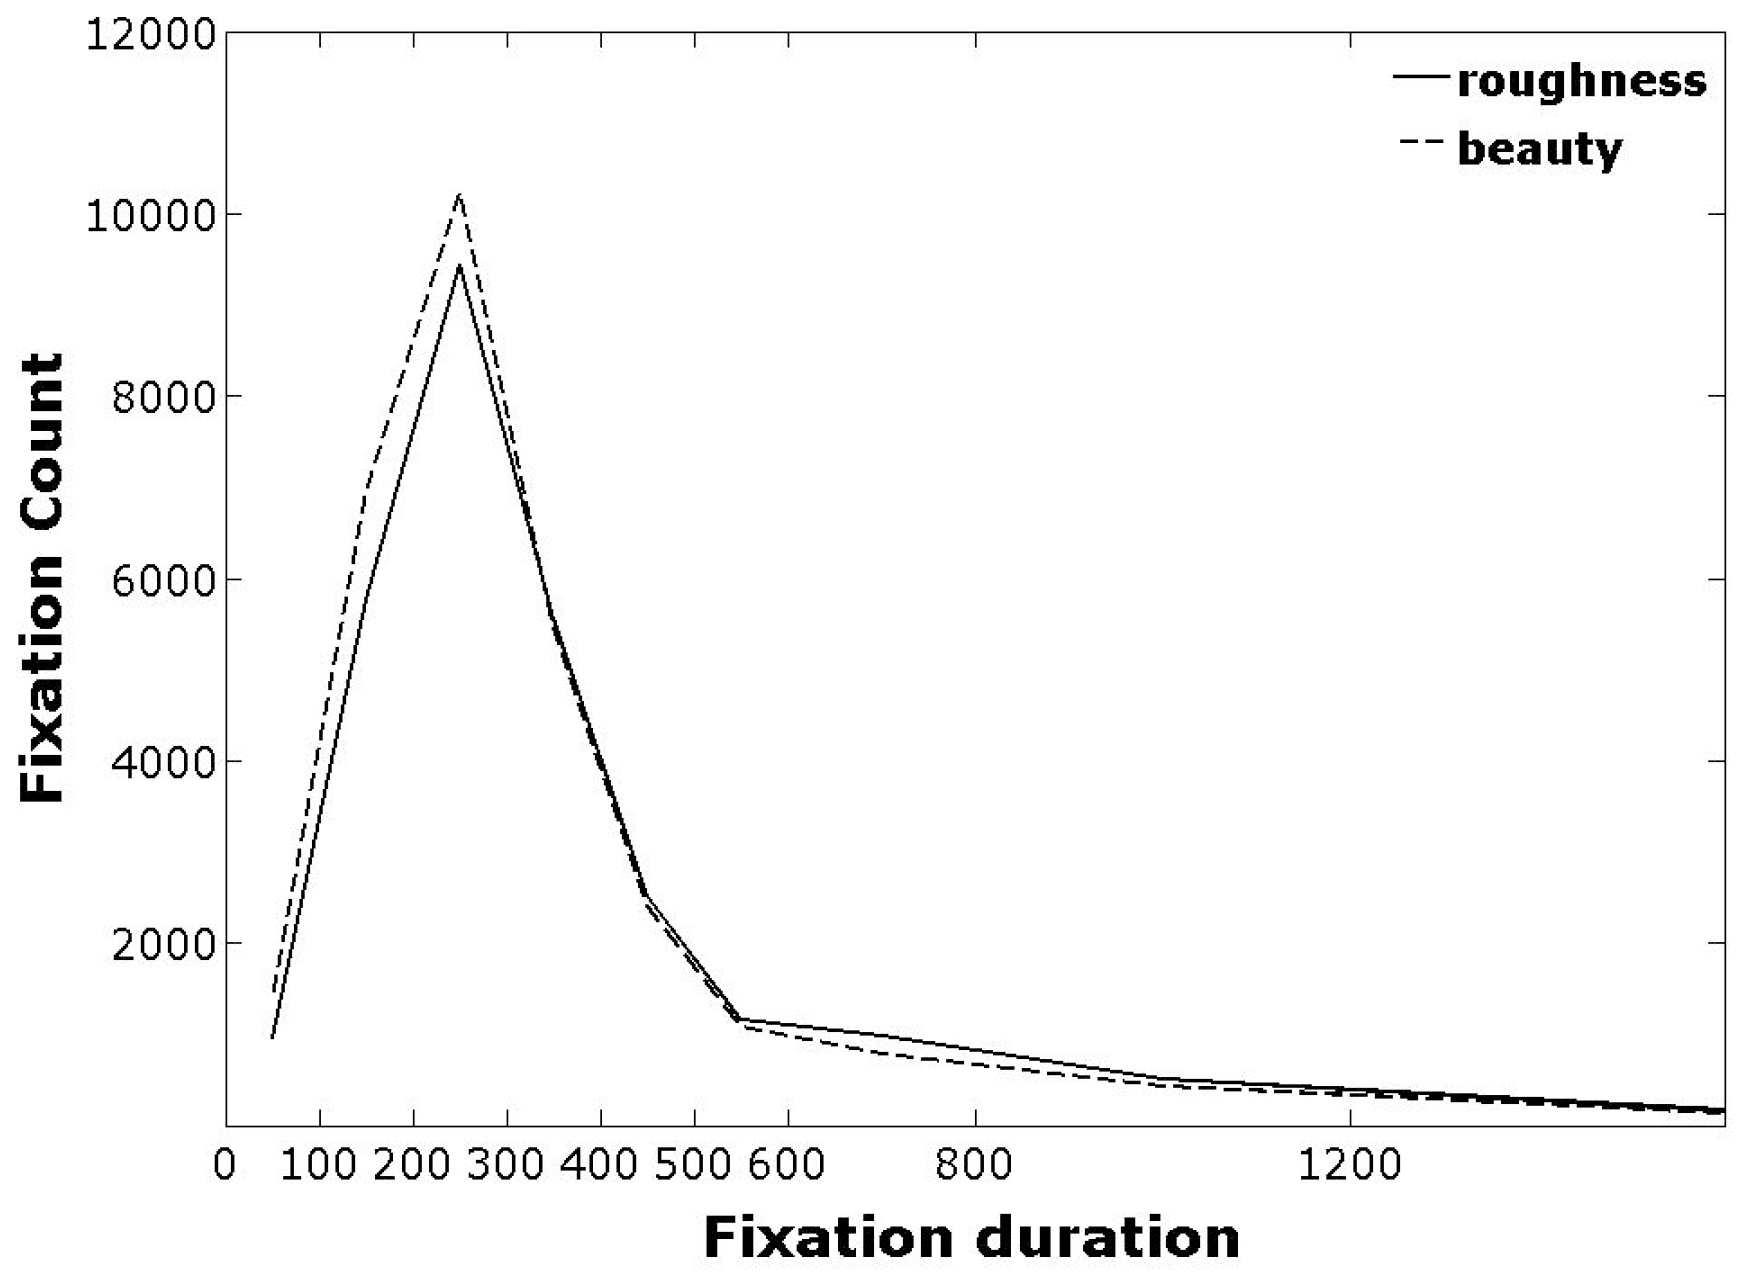
Frequency plots of fixation durations during beauty and roughness judgments are displayed in figure 2. There are more short fixations (< 400 ms) during beauty judgments. For longer fixation durations, the numbers are similar for both judgment types. The distributions of fixation durations per observer were skewed to the right (peak shifted to the left). The most frequent fixation duration was between 200 and 300 ms, although there was an observer with most fixation durations at 700-800 ms (not shown). As pointed out by others, for different experiments (Velichkovsky, Dornhoefer, Pannasch, & Unema, 2000; Pelz, Canosa, Lipps, Babcock, & Rao, 2003), fixation durations under 200 ms were not uncommon.
Figure 2.
Distribution of fixation durations for the beauty and roughness judgments, integrated over all participants.
Figure 2.
Distribution of fixation durations for the beauty and roughness judgments, integrated over all participants.
Spatial distribution of gaze
Figure 3.
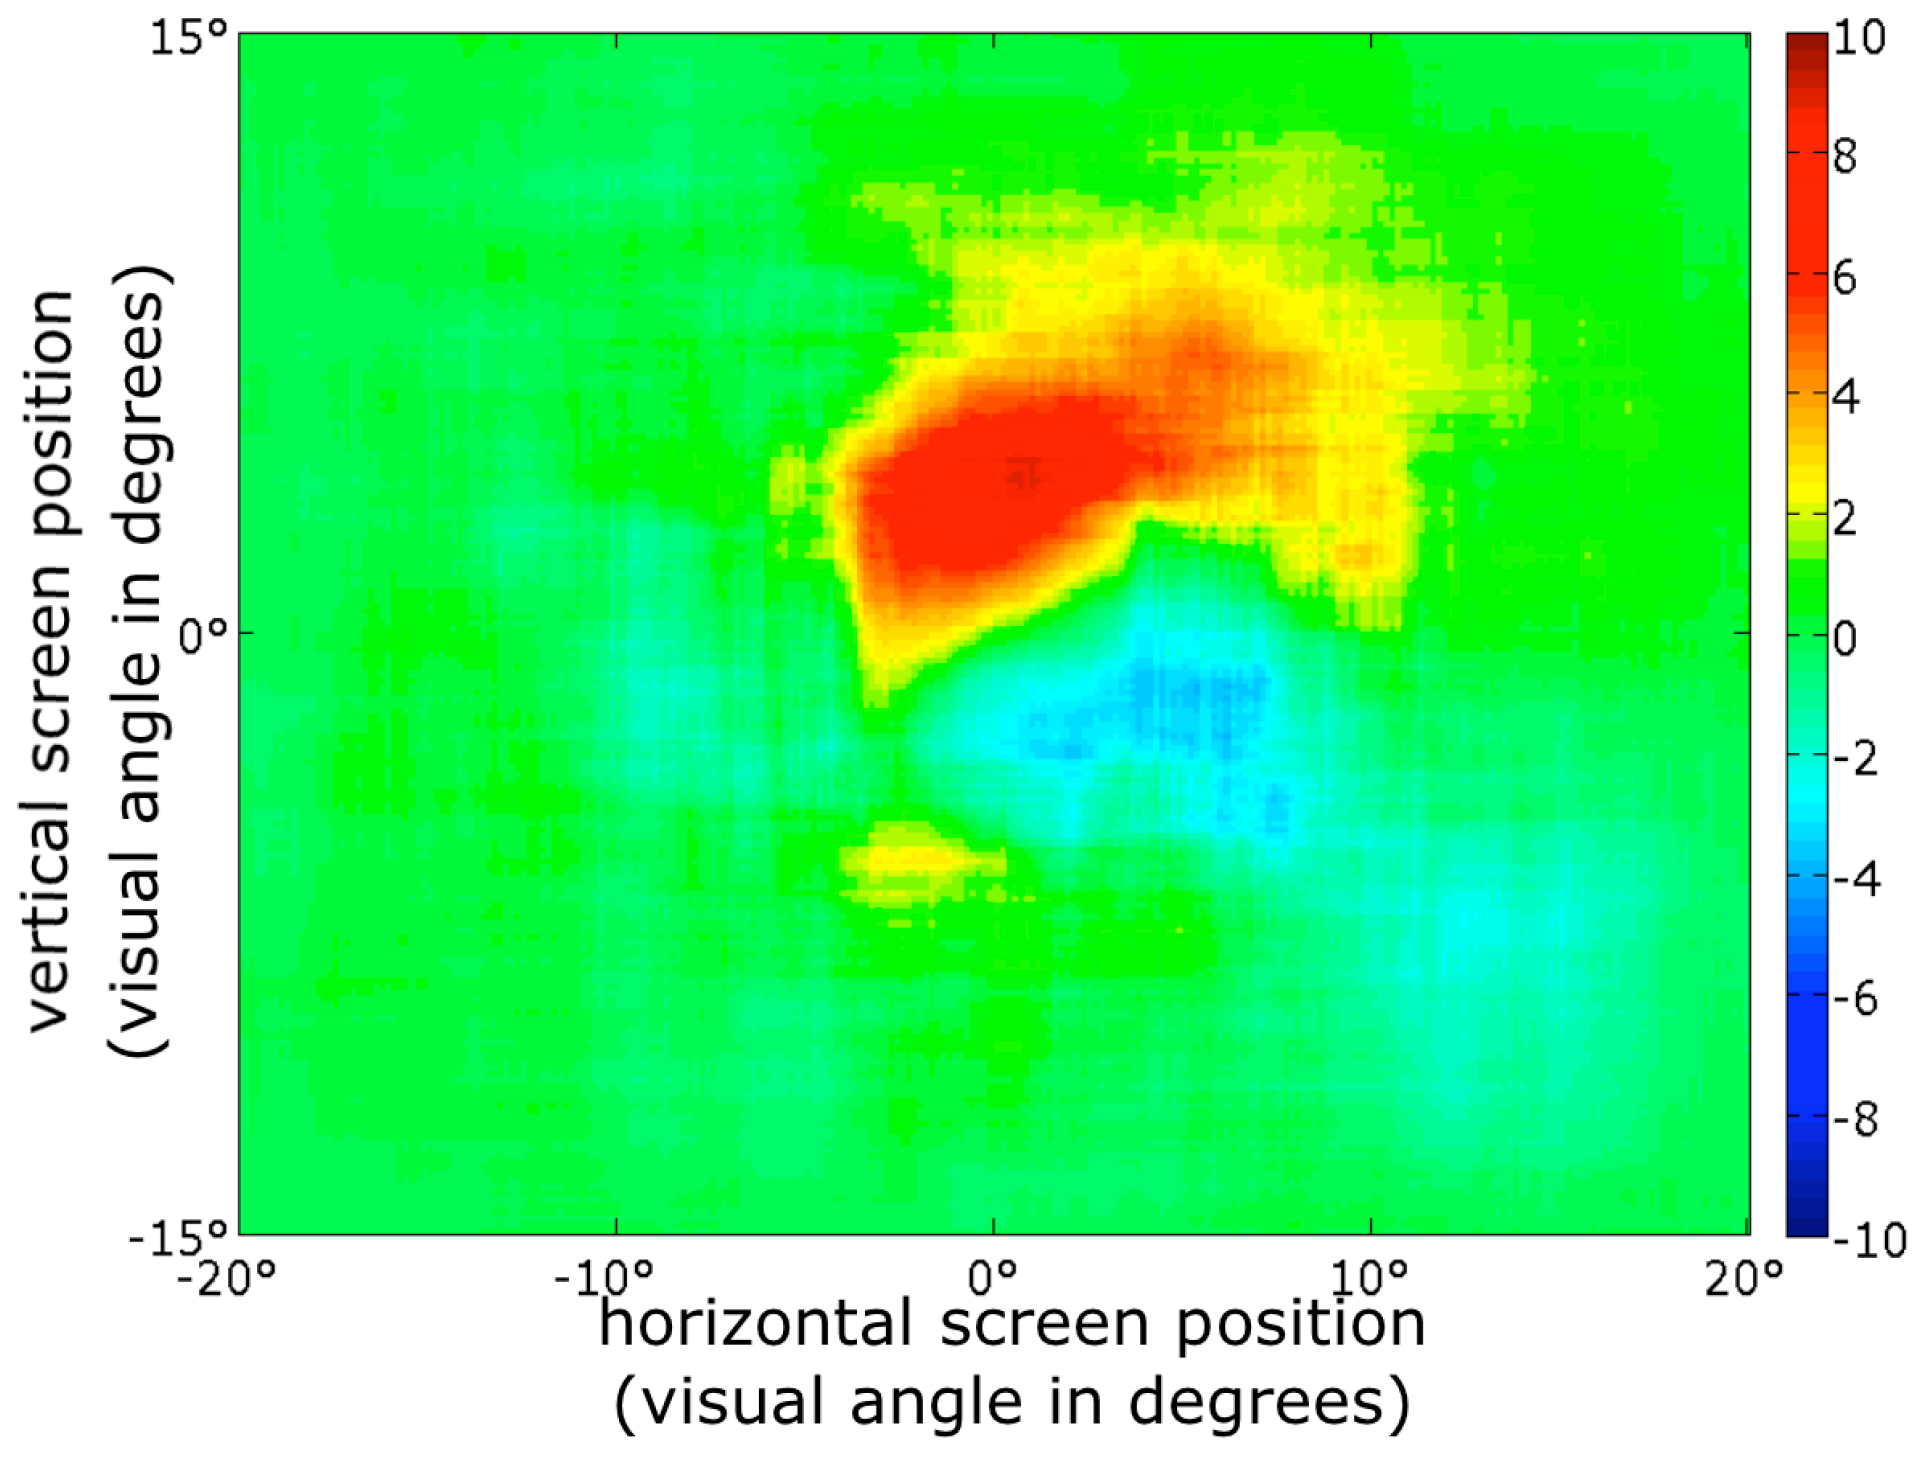
Dwell time contrast map. Red indicates locations on the screen where participants dwelled longer during beauty judgments, blue locations where participants dwelled longer during roughness judgments. Effects are non-significant (p = 0.12 for the maximum, and p = 0.89 for the minimum, FWEcorrected).
Figure 3.
Dwell time contrast map. Red indicates locations on the screen where participants dwelled longer during beauty judgments, blue locations where participants dwelled longer during roughness judgments. Effects are non-significant (p = 0.12 for the maximum, and p = 0.89 for the minimum, FWEcorrected).
Figure 3 shows a map indicating the relative amount of time spent at each location for the two judgment conditions. During beauty judgments, on average participants spend about 8% more of their time (cumulative fixation duration) just above the center of the screen, while they spend on average about 3% more of their time below the screen center during roughness judgments. Although suggestive, these differences were not statistically significant (
p = 0.89 for the maximum, and
p = 0.12 for the mimimum, FWE-corrected). There were few fixations in the periphery, resulting in 0% differences there, between the judgments.
Eye movement parameters
Kolmogorov-Smirnov tests on the eye movement parameters, as computed using Formula (1) did not reveal significant deviations from normality (all
p > .76).
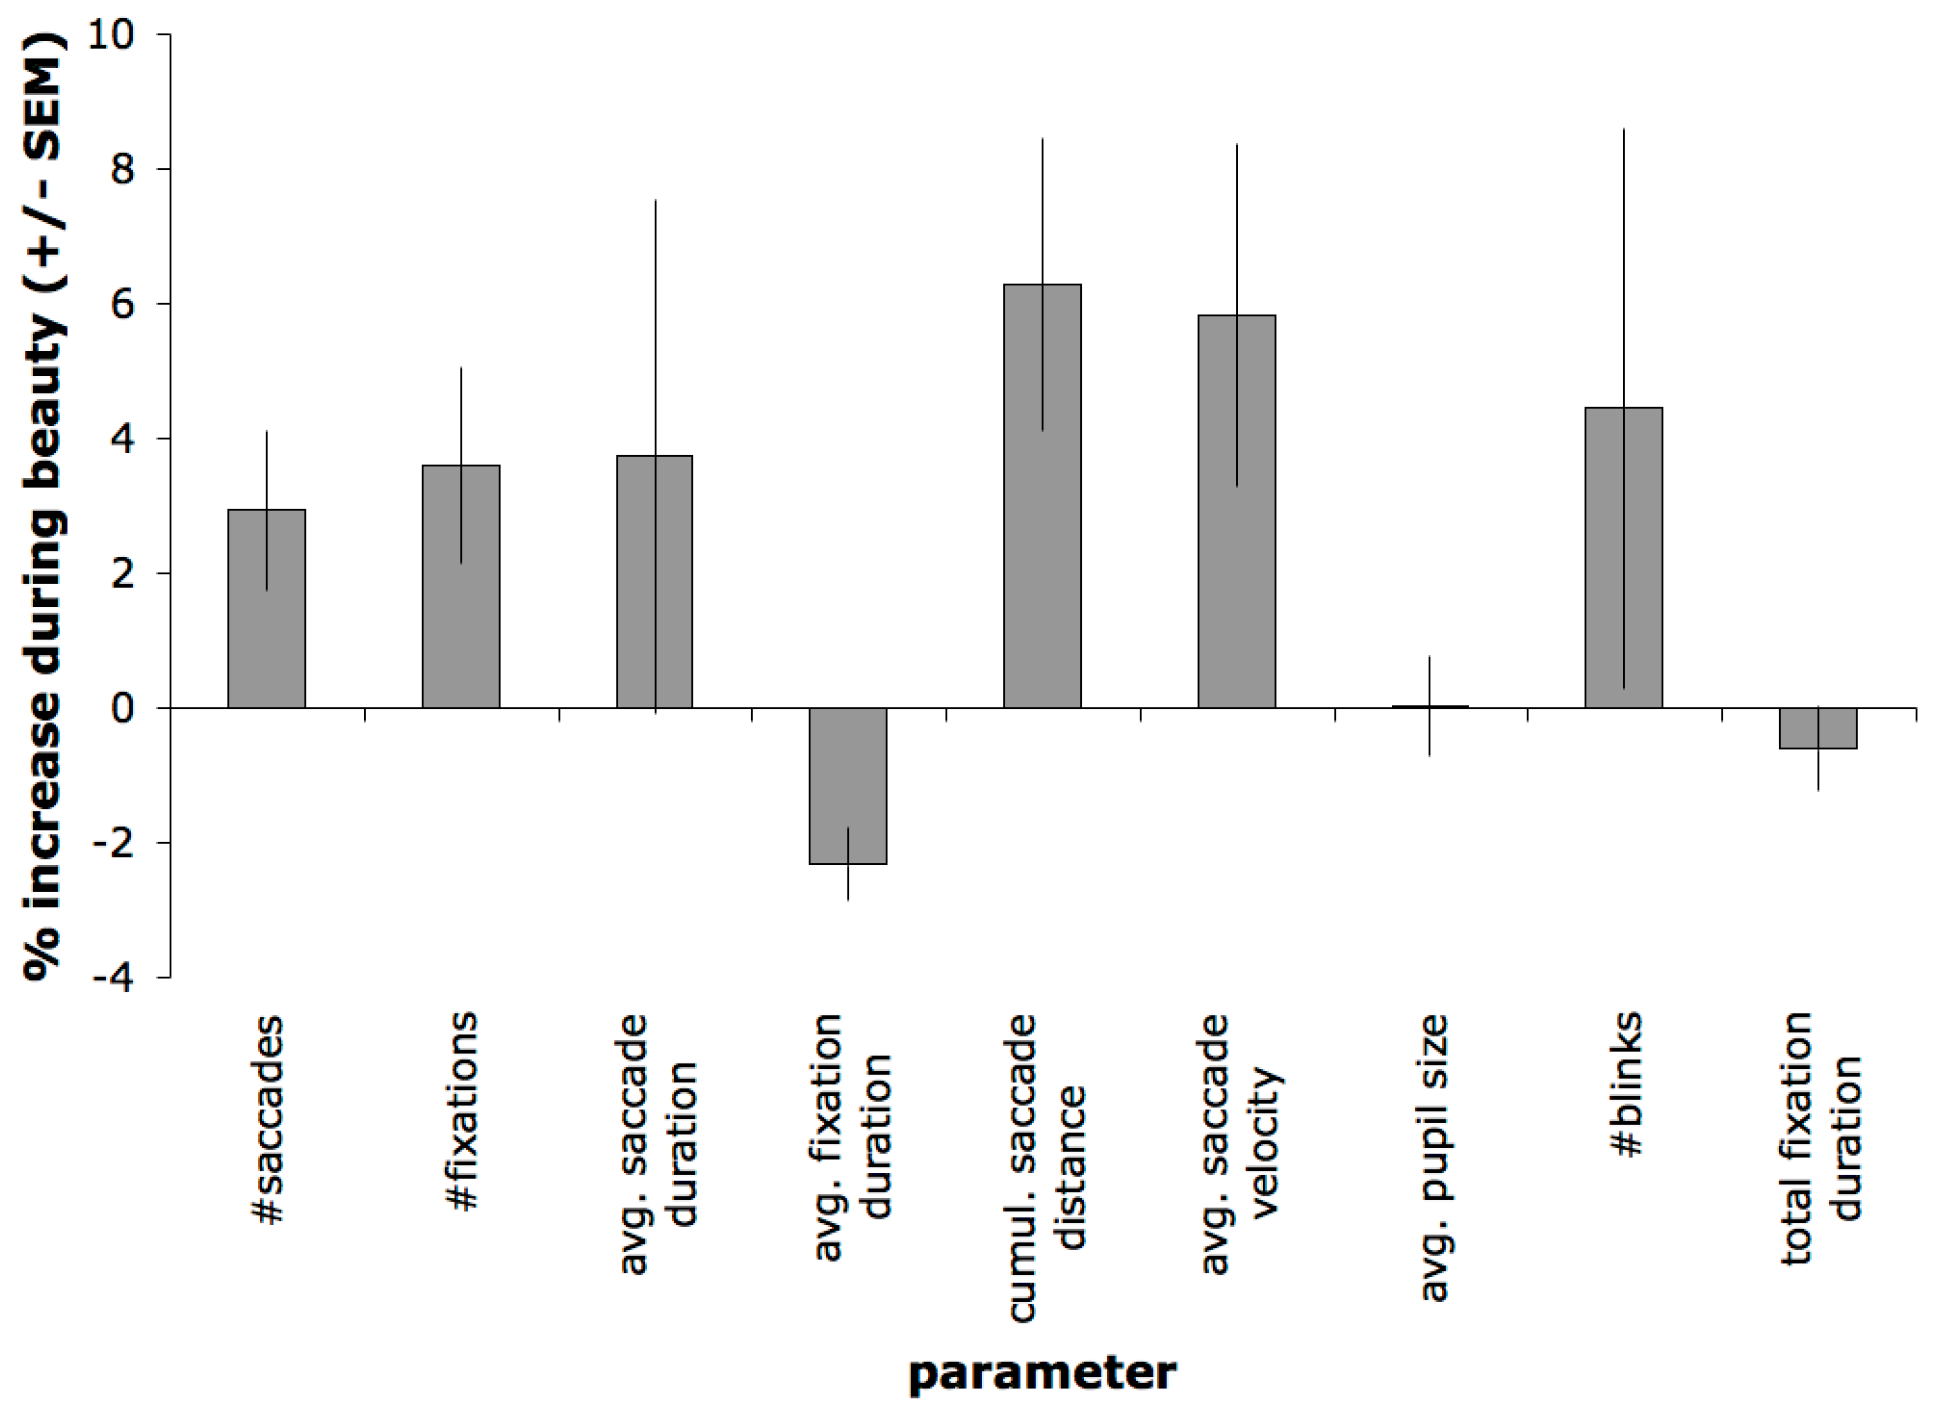
Figure 4 shows changes in eye-movement parameters. Average fixation duration was higher during the roughness judgments compared to the beauty judgments (
t(11) = -4.27,
p = 0.001). Both number of saccades (t(11) = 2.49,
p = 0.03) and the distance covered by the saccades (or cumulative saccade amplitude;
p = 0.02) are significantly higher during the beauty judgments. This suggests observers scanned coarser and more globally during beauty compared to roughness judgments. There was no difference in average saccade duration (
t(11) = .997,
p = 0.35), and average saccade velocity was higher during beauty judgments (t(11) = 2.30,
p = 0.04).
Figure 4.
Eye movement parameters. Increases during beauty compared to roughness judgments, expressed as a percentage of their average. Cumul. = cumulative, avg. = average.
Figure 4.
Eye movement parameters. Increases during beauty compared to roughness judgments, expressed as a percentage of their average. Cumul. = cumulative, avg. = average.
Pupil size
Kolmogorov-Smirnov tests on the correlations between pupil size and ratings did not reveal any significant deviations from normality (all p > .8).
No differences were found in the average pupil size (t(11) = 0.03, p = 0.98) nor in the number of blinks (t(11) = 1.07, p = 0.31), between the judgment conditions.
There was no correlation between pupil size and beauty rating, neither during the explicit rating of beauty (r = 0.02, t(11) = 0, p = 1), nor during the implicit rating of beauty (i.e. between pupil size during the roughness judgment and the beauty rating) (r = -0.01, t(11) = .192, p = .851).
There was a correlation between pupil size and rated roughness, both during the (explicit) rating of roughness (r = 0.13, t(11) = 8.07, p =.000), and during the (implicit) rating of beauty (r = 0.11, t(11) = 5.83, p < .001).
Feature correlations
The features correlating most strongly to mean beauty ratings were average saturation (r(10) = 0.47) and the yellowness of the texture (r(10) = 0.37), and a coarseness-measure based on the Neighborhood Gray-Tone Difference Matrices (r(10)= 0.33).
The features correlating most strongly to roughness ratings were entropy-measures (for a range of distances) based on the Gray-Level Co-occurrence Matrices (all correlations in the range of 0.6 to 0.7). We note also a positive correlation between average pupil size and average saturation, during both beauty (r(10) = 0.24) and roughness judgments (r(10) = 0.22).
Fixations on different features
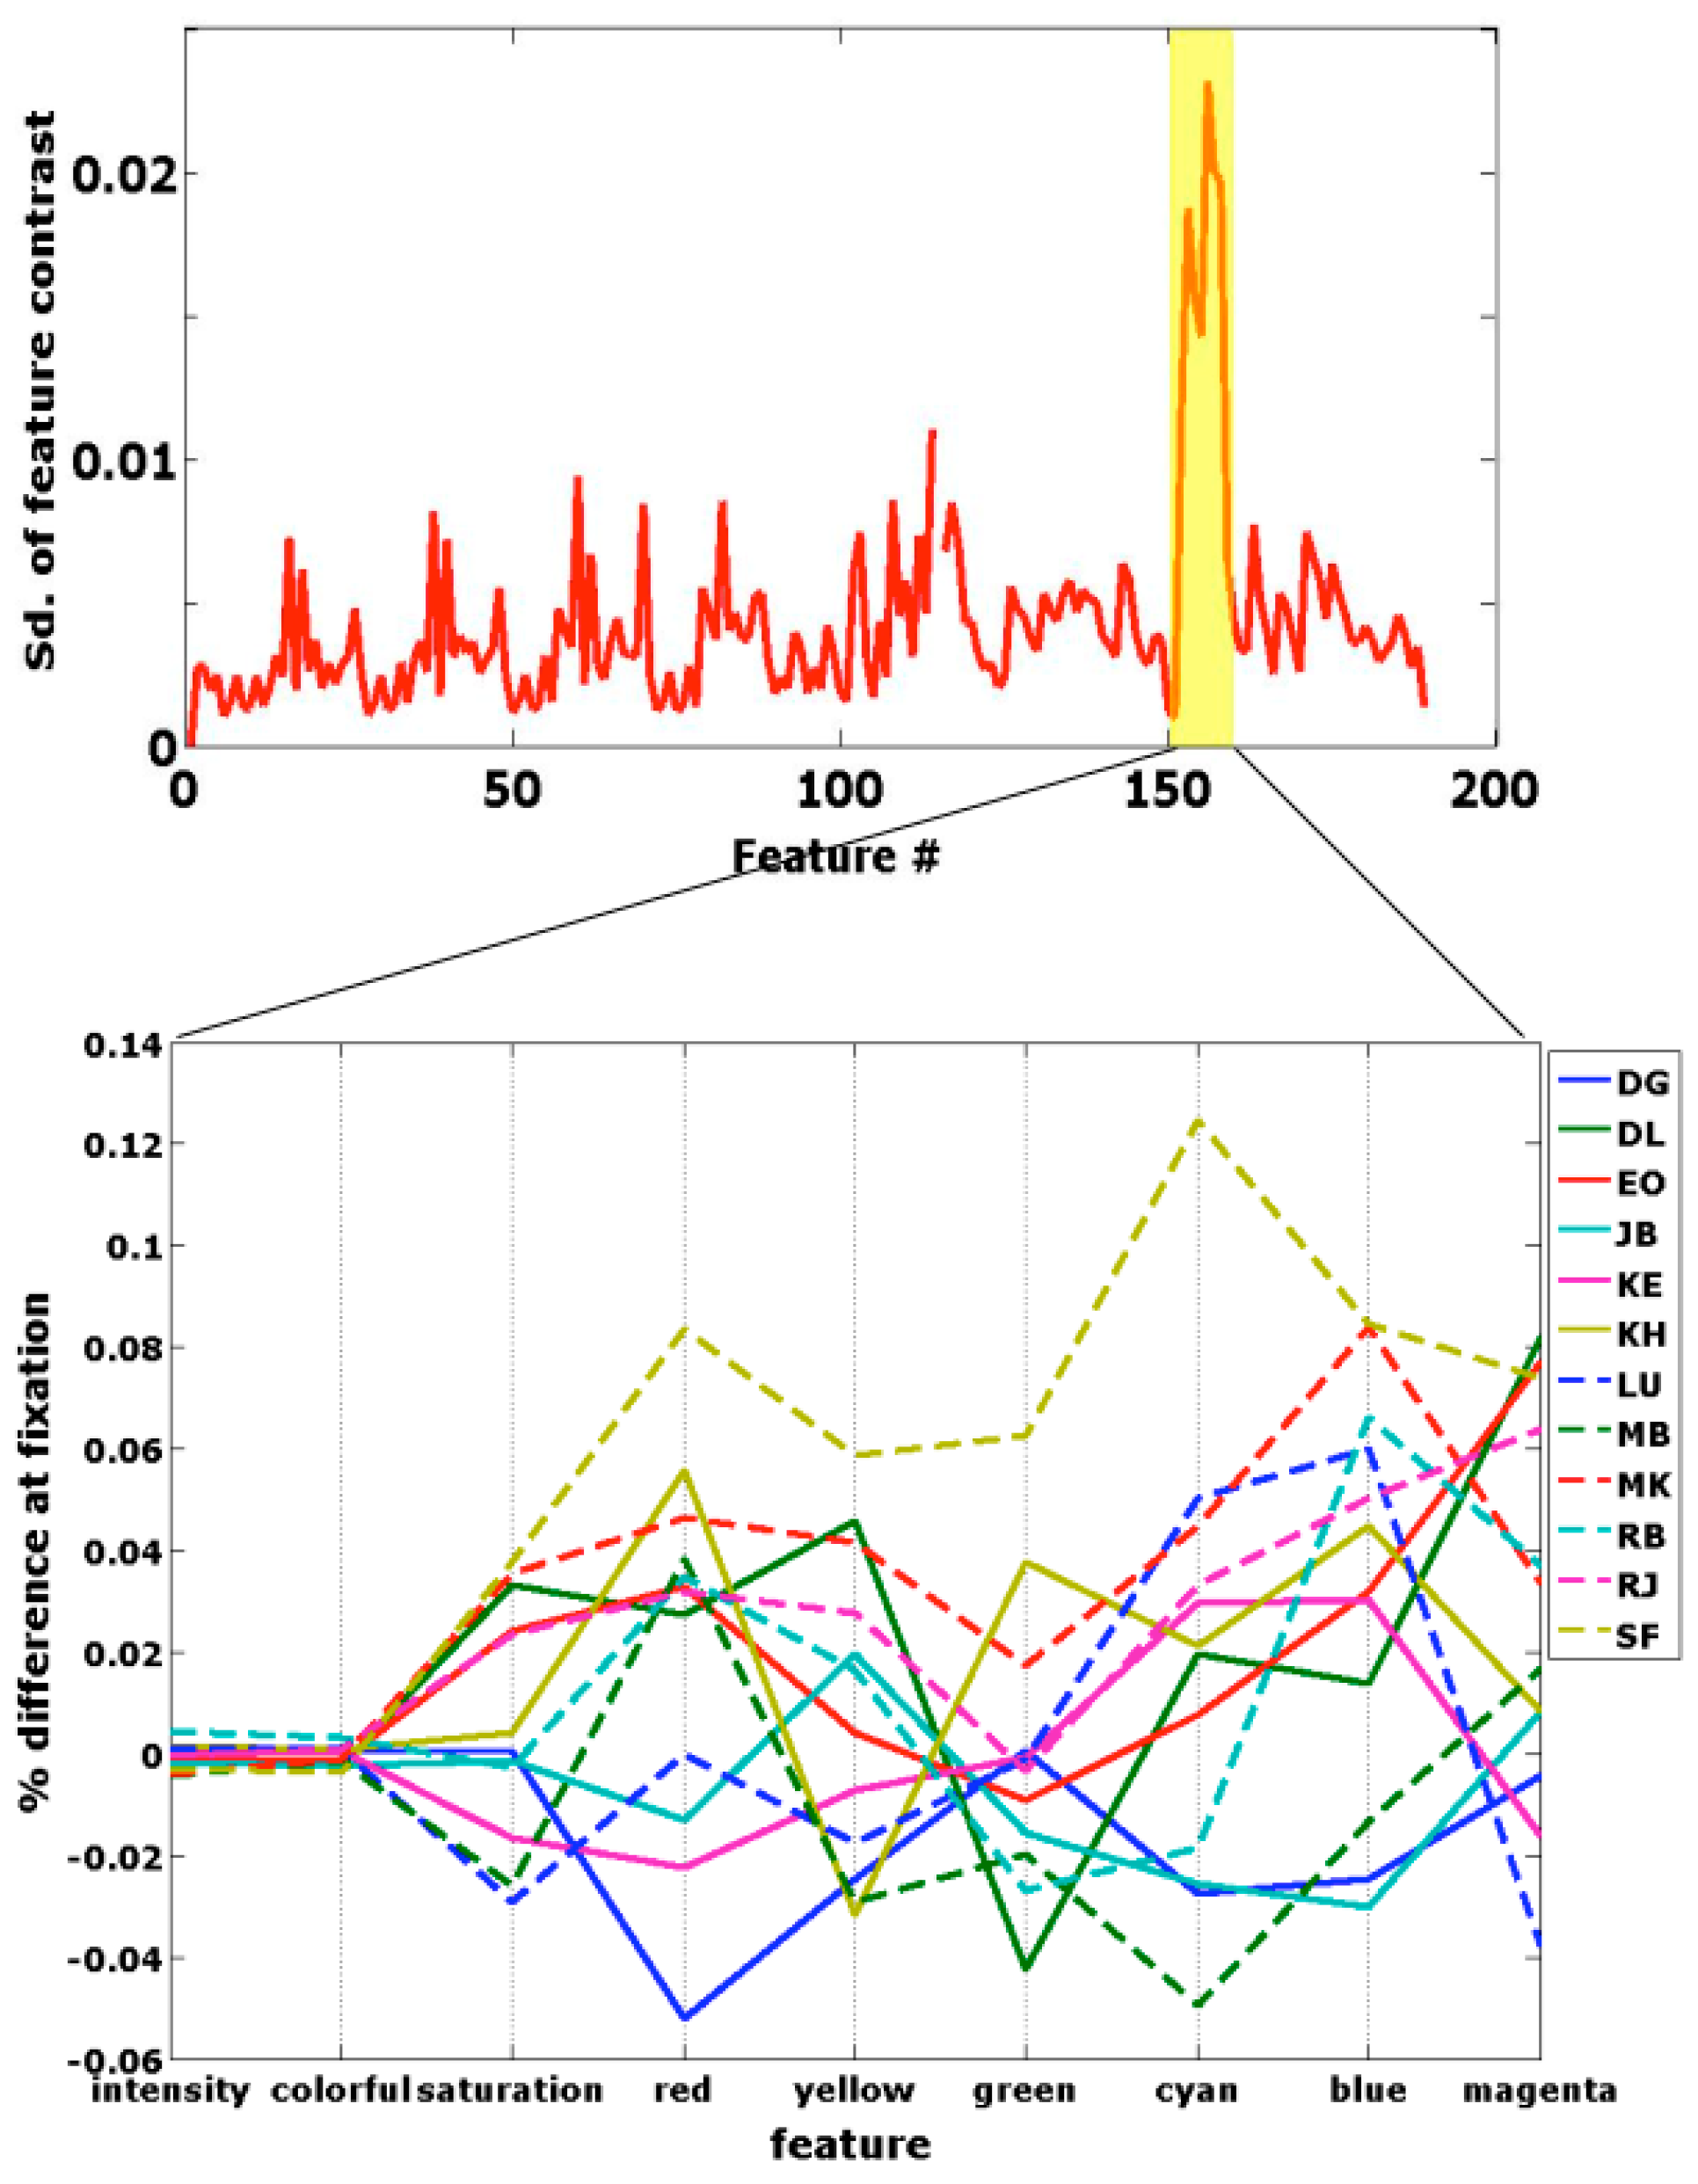
We found that the colors blue, magenta, red and cyan had higher values around fixations during the beauty judgment than during roughness judgments. More striking than the differences in average feature values between judgments, were the standard deviations over subjects (figure 5, top). The color features showed much higher standard deviations than the other features. Looking at the individual participants’ averages (figure 5, bottom), it appears that some participants looked more at all colors during the beauty judgment, while others looked at some colors at the expense of other colors. One participant, DG, looked less at some colors, possibly indicating that he was in fact judging for ugliness rather than beauty.
Figure 5.
Feature differences, computed according to Formula (1), between fixations during beauty and fixations during roughness. The top shows the standard deviation over subjects for all features. The color features are numbered 150-158 (highlighted in yellow). The bottom graph shows the feature differences per subject for the color features.
Discussion
We examined differences in eye movement parameters between beauty and roughness judgments to visual textures, because previous findings of differential engagement of the amygdala in these judgments suggested such a possibility.
We found that several eye-movement parameters differed between roughness judgments and beauty judgments, even though identical stimuli were shown. As this is a task effect, it is a
top-down effect. Although this classification does little more than rephrasing the finding, it brings forward the possibility that other forms of topdown effects on eye movements may exist. For example, mood might also have an influence on the guidance of eye movements, and indeed such influences have already been reported (
Wadlinger & Isaacowitz, 2006).
Although we demonstrated the presence of task effects on eye movements in our texture stimuli, it remains to be shown what the relevant dimensions are along which these tasks differ. We chose beauty and roughness judgments, because we found that these loaded strongly on orthogonal dimensions in a judgment space, derived from a range of judgments that people made about visual textures (Jacobs, Haak et al., 2010). We interpreted these dimensions as an evaluative dimension on the one hand, on which judgments such as beauty, elegance, warmth, and colorfulness loaded strongly, and a descriptive dimension on the other, with high loadings of roughness, age, and complexity. We chose judgments from these orthogonal dimensions to maximize the possibility of finding effects. Now that we indeed found effects these may arise from this distinction, but other differences between the tasks may also account for the different findings. To confirm our idea that the evaluative-descriptive distinction is the relevant one, replications with other judgments, such as complexity (descriptive) and elegance, warmth, interestingness, or colorfulness (evaluative) would be in order. One can think of other differences between the tasks, such as difficulty in feature extraction, a possibility that we entertain below. Another possibility would be the implicit tactile nature of a roughness judgment, likely requiring a visuo-tactile transformation of the information. But even if such differences exist, these may generalize to all judgments differing along the evaluative-descriptive dimension.
As the differences in eye guidance between the two tasks were not related to differences in the spatial location of the relevant information, these differences are strong evidence for non-spatial, possibly feature-based, differences in attention. In particular, the longer average fixation durations during the roughness judgments can readily be interpreted as reflecting differences in featurebased attention. A longer fixation during roughness judgments likely reflects additional time needed to extract the relevant information. Longer fixation durations have already been shown to be related to tougher discriminability of the information at the fixated location (
Hooge & Erkelens, 1996; Cornelissen, Bruin, & Kooijman, 2005), to more elements around a fixation location (
Salthouse & Ellis, 1980), to search for detailed information, as compared to free viewing (
Buswell, 1935), to time spent searching (Over, Hooge, Vlaskamp, & Erkelens, 2007), and to non-expertise (Antes, Chang, Lenzen, & Mullis, 1985). All these findings corroborate the notion that more difficult feature extraction leads to longer fixation times. Also, the nature of the information upon which the judgments are based suggests that simpler features are used for beauty (e.g., color information, a firstorder feature) than for roughness (e.g., entropy information; a third-order feature) assessments. Shorter fixations and larger saccades have been associated with higher spatial frequencies (M. T. Groner, Groner, & von Mühlenen, 2008), suggesting that attention may have been directed at different spatial frequencies in our stimuli, under the different task instructions. Closely related to our current findings, fixation durations are longer when attending to location than when attending to color (Hayhoe, Bensinger, & Ballard, 1998), again suggesting that color is a relatively easy feature to extract.
In the previous paragraph, we argue that our findings should be interpreted in terms of feature-based attention differing between two different judgments. We should point out, however, that it is also possible that beauty and roughness judgments are based on the same features, and that differences occur only in the processing subsequent to the extraction of the features. Longer fixations could then be the result of higher processing load during the judgment of roughness. However, pupil size, an index for processing load, did not differ between the judgments. Hence, it is unlikely that processing load differs between the judgments, and differences in the extraction of features remain as an alternative. Also, one may question to what extent it is possible to separate feature extraction from processing further downstream. Importantly, we showed that feature values for some color features are, overall, higher around fixations during beauty judgments than during roughness judgments, although there is individual variability in the colors that are attended. Behavioral results here, and in other data from our group (Jacobs, Haak et al., 2010), indicate that color information is important for determining beauty. These results support the idea that people attend to different features, depending on what is relevant for the task at hand. The results also suggest that (most) people attend predominantly to the beautiful, colored, parts of a stimulus, when judging for beauty. It would be interesting to see in future experiments if this changes when people judge for ugliness.
A parsimonious explanation for longer fixation durations during roughness judgments may be the following: sensory evidence for the presence of certain features at a fixated location needs to build up and exceed some recognition threshold. If this build-up is slower or the threshold is higher for the roughness features than for the beauty features, this would lead to longer fixation durations during roughness judgments. This procedure repeats, until sufficient information is gathered from different parts of the stimulus, until a decision has been reached.
It is not clear how models of eye guidance based on salience maps can explain our findings. In these models, longer fixations are translated into a higher salience for the fixated region. Hence, longer fixations during roughness judgments would have to be translated into higher salience for the fixated regions. But as the information in our textures is highly repetitive, the computation of salience would increase all over the stimulus. If fixation durations are based on the relative salience of a fixated region with respect to the salience of the surroundings, the resulting duration would not be higher at all, and the modeling would fail. In addition, the models that incorporate task effects only deal with search tasks with predefined targets (
Navalpakkam & Itti, 2005;
Torralba et al., 2006). In the case of beauty judgments, there is no pre-defined search target, although it would be possible to translate such a task into a search for relevant features. It seems that our findings relate better to a window of attention. This window of attention is larger during beauty judgments. The window of attention tends to narrow for more difficult tasks (
Ahissar & Hochstein, 2000), suggesting that the roughness judgment or the extraction of the relevant features for this judgment is more difficult. In terms of ambient versus focal modes of information processing (
Unema et al., 2005), our findings mean that beauty judgments are associated with a more ambient (short fixations, long saccades), and roughness judgments with a more focal (long fixations, short saccades), mode of processing. We note that the saccade durations were not significantly different between our judgments, however, although numerically in the right direction. We do not endorse the notions of ambient processing relying on the dorsal visual pathway and focal processing relying on a ventral visual pathway, as is often claimed in connection with the ambient-focal distinction (
Unema et al., 2005). Models need to go beyond the computation of salience maps, and incorporate eye movement parameters separately. Recently, reinforcement learning has been applied to model the deployment of human attention and eye gaze (
Ballard & Hayhoe, 2009). As this approach includes not only where, but also when people look, this seems to us a much better framework for modeling data of the type we provided.
The finding of higher amygdala activation during beauty judgments than during roughness judgments (Jacobs, Renken, Aleman, & Cornelissen, 2010) that inspired our current investigation, may underlie the enforecement of the different scanning modes found here. The experiments were nearly identical, except that in one case brain activity was measured, while in the current experiment eye movements were monitored. Hence, the different findings related to the different judgments are likely to be associated, certainly when one considers reports of amygdalar involvement in attention (
Anderson & Phelps, 2001;
Carlson et al., 2009; Jacobs, Renken et al., 2010) and eye movements (
Bancaud et al., 1966;
Adolphs et al., 2005;
Ohrmann et al., 2007;
van Reekum et al., 2007).
One separate issue that deserves discussion is that we did not find effects of stimulus beauty on pupil size, despite reports in the literature pointing to such effects in the presence of emotional stimuli. For example, sounds, such as baby’s crying and laughter (
Partala & Surakka, 2003) and visual stimuli that are selectively interesting to the different sexes, such as opposite sex semi-nudes and pictures of mothers and babies (
Hess & Polt, 1960), increase pupil size. Those effects may reflect arousal elicited by the stimuli. As our stimuli were clearly not very arousing, this may account for the absence of an effect of beauty on pupil size. Moreover, beauty itself may not be a very arousing aspect to judge on, compared to evidently emotional judgments. In line with our results, the valence of written words does not seem to influence pupil size (
Silk et al., 2009). The original Hess and Polt finding has been interpreted as reflecting relationships between positive or pleasurable emotions and pupil size, even in textbooks (
Mather, 2006), but this interpretation appears to be unwarranted.
There were no influences of judgment task on pupil size. Rated roughness was related to pupil size, with rougher-looking textures eliciting pupil dilation. So, a relationship with rated roughness is established here, independent of whether this roughness was explicitly rated. This relationship may be based on (a combination of) features.
In consideration of the many features we computed, some of which are interrelated, and none of which we manipulated systematically, we can not draw any hard conclusions with regard to relations of dependent variables to those features. The correlations between features and some dependent variables were reported for confirmation in future experiments, although we believe that the correlation of several color features (saturation, yellowness) with beauty judgments is no coincidence, and also a correlation between entropy measures and roughness judgments makes sense to us.
Conclusions
We found task-driven differences in eye movement parameters between beauty and roughness judgments of identical texture stimuli. As the spatial distribution of dwell times does not differ between these judgments, the differences in the eye movement patterns must result from differences in non-spatial, hence feature-based, attention. Average fixation duration, the number of fixations and saccades, and the average saccade duration differed between the two judgments. This points to differences in how people scan their environment, depending on their current goals. These differences in how people scan their environment cannot be explained by differences in placement of the relevant information, as would be possible when paintings or photographs were used as stimuli. Rather, we believe these differences should be interpreted as reflecting differences in non-spatial, feature-based attention (repetition in the paragraph), related to a higher difficulty in extracting the relevant information during the roughness judgment.
So far, models of attention and eye guidance focus on the guidance of the eyes to salient information, often taking the observer’s task into account. Our findings indicate that models of eye guidance need to go beyond spatial salience maps, and need to incorporate top-down effects on eye movement parameters other than location of fixation, for example by modeling effects of feature complexity on fixation duration.
People’s fixation locations are a good index of what they are currently thinking about. We have shown that more subtle indices of eye movements may provide additional, valuable information about stimulus processing, such as the difficulty of extracting features for the assessment of certain higher-order qualities, such as beauty and roughness of textures. The eyes are a window to the soul, as an English proverb goes. As we have shown, this may be true, in more ways than hitherto acknowledged.