Abstract
Contingency analyses of eye movements may reveal variables that are relevant to the stimulus control of observing behavior. The present research tracked the eye movements of four adults exposed to a simultaneous discrimination among four stimuli, two twodimensional (square and circle) and two three-dimensional (cube and cylinder) monochromatic figures with approximately equal luminance. On each discrimination trial, the stimuli were displayed in the four corners of a video monitor and participants chose among them by pressing corresponding keys. For two participants, choosing either cube or square (S+) was followed by the word “correct” and a 3-second inter-trial interval. Alternatively, choosing either cylinder or circle (S-) was followed by "incorrect" and a 30-second intertrial interval. For the other two participants, contingencies were reversed. The position of the stimuli on the screen varied randomly across trials. The procedure continued for 80 trials. During these trials, discriminated choices were established. Despite the presence of both a two- and a three-dimensional S+ on each trial, responses to the three-dimensional S+ tended to prevail. Although general eye fixations tended to decrease as discrimination was established, subjects tended to observe S+ for longer durations than S-. Characteristics of the stimuli may interact with the contingencies of reinforcement in the stimulus control of observing behavior.
Introduction
Researchers in eye movements typically categorize saccades into two basic types: those exogenously controlled (stimulus-driven, involuntary, or bottom-up) and those endogenously controlled (goal-directed, voluntary, or top-down) (e.g., Godijn & Theeuwes, 2003). Behavior Analysis is primarily concerned with the environmental variables that control the second type of saccades, mainly the effect of consequences of the eye movements on subsequent eye movements (operant behavior) (Schroeder & Holland, 1968, 1969; Madelain, Champrenaut & Chauvin, 2007). Using a corneal reflection technique and apparatus (Mackworth & Thomas, 1962), Schroeder and Holland (1968) demonstrated that human saccadic eye movements could be affected by their consequences (i.e. eye movements could be conditioned). The researchers established an experimental situation where saccadic eye movements toward a pointer triggered its deflection. The different programmed conditions for the deflection consequences affected frequency and distribution of fixations to the pointer deflector.
Having established the sensitivity of saccadic eye movement to its consequences, behavior analysts began to reveal controlling behavior/environment relations in several empirical contexts, including simple discrimination (Schroeder, 1969a), conditional discrimination (Magnusson, 2002; Dube et al., 2006) transfer of discriminative stimulus control (Schroeder, 1969b, 1997), concurrent schedules (Schroeder & Holland, 1969), stimulus over-selectivity (Dube et al., 2003), and programmed instruction (Doran & Holland, 1971).
According to some of these studies, not only consequences, but also the stimuli that were present when the consequences were produced, acquired control over the eye movements. Recording the eye movements using a Mackworth V-1164-2 corneal reflection system with television digitizer (described by Schroeder & Holland, 1968), Schroeder (1970) investigated the effects of different consequences upon fixations to figures presented in the corners of a screen in a choice task. Initially, all figures were fixated. During the experiment, participants began to make choices without foveal fixations. Eventually participants held foveal fixation at the center position of the screen (practice effect) while they choose the figures.
Schroeder (1970) suggested that the practice effect may have occurred due to differences in the luminance of the figures. The present study replicated Schroeder’s study (1970) and extended it by balancing the luminance of the figures and evaluating its influence upon the practice effect.
Method
Participants
Four female undergraduate students participated in one session each. Participants all signed an agreement with minimal information about the experiment, declared having normal vision, and were naïve with respect to the task and the apparatus.
Setting and apparatus
Sessions were held in a 2 m x 3 m room. The room was divided in two by a partition wall. In one side there was a chair and a table with a computer monitor and keyboard. Stimulus presentation, delivery of consequences, and recording of the participant’s choices were conducted by computer software developed for this research. On the other side of the partition wall was the equipment used by the experimenter. The apparatus consisted of a RK-826PCI Pupil/Corneal Reflection Tracking Hardware System - with precision of 0.3 deg in a visual field of 20 deg. x 20 deg, permitting free movements of the head - and a RK-630 Auto-calibration System, installed in a PC platform with ISCAN Raw Movement Data Acquisition software. Images were captured in another PC platform with Pinnacle Studio Plus 9® software and analyzed frame by frame (30Hz) with Video Frame Coder software (Abilities Software, Sudbury, MA, USA).
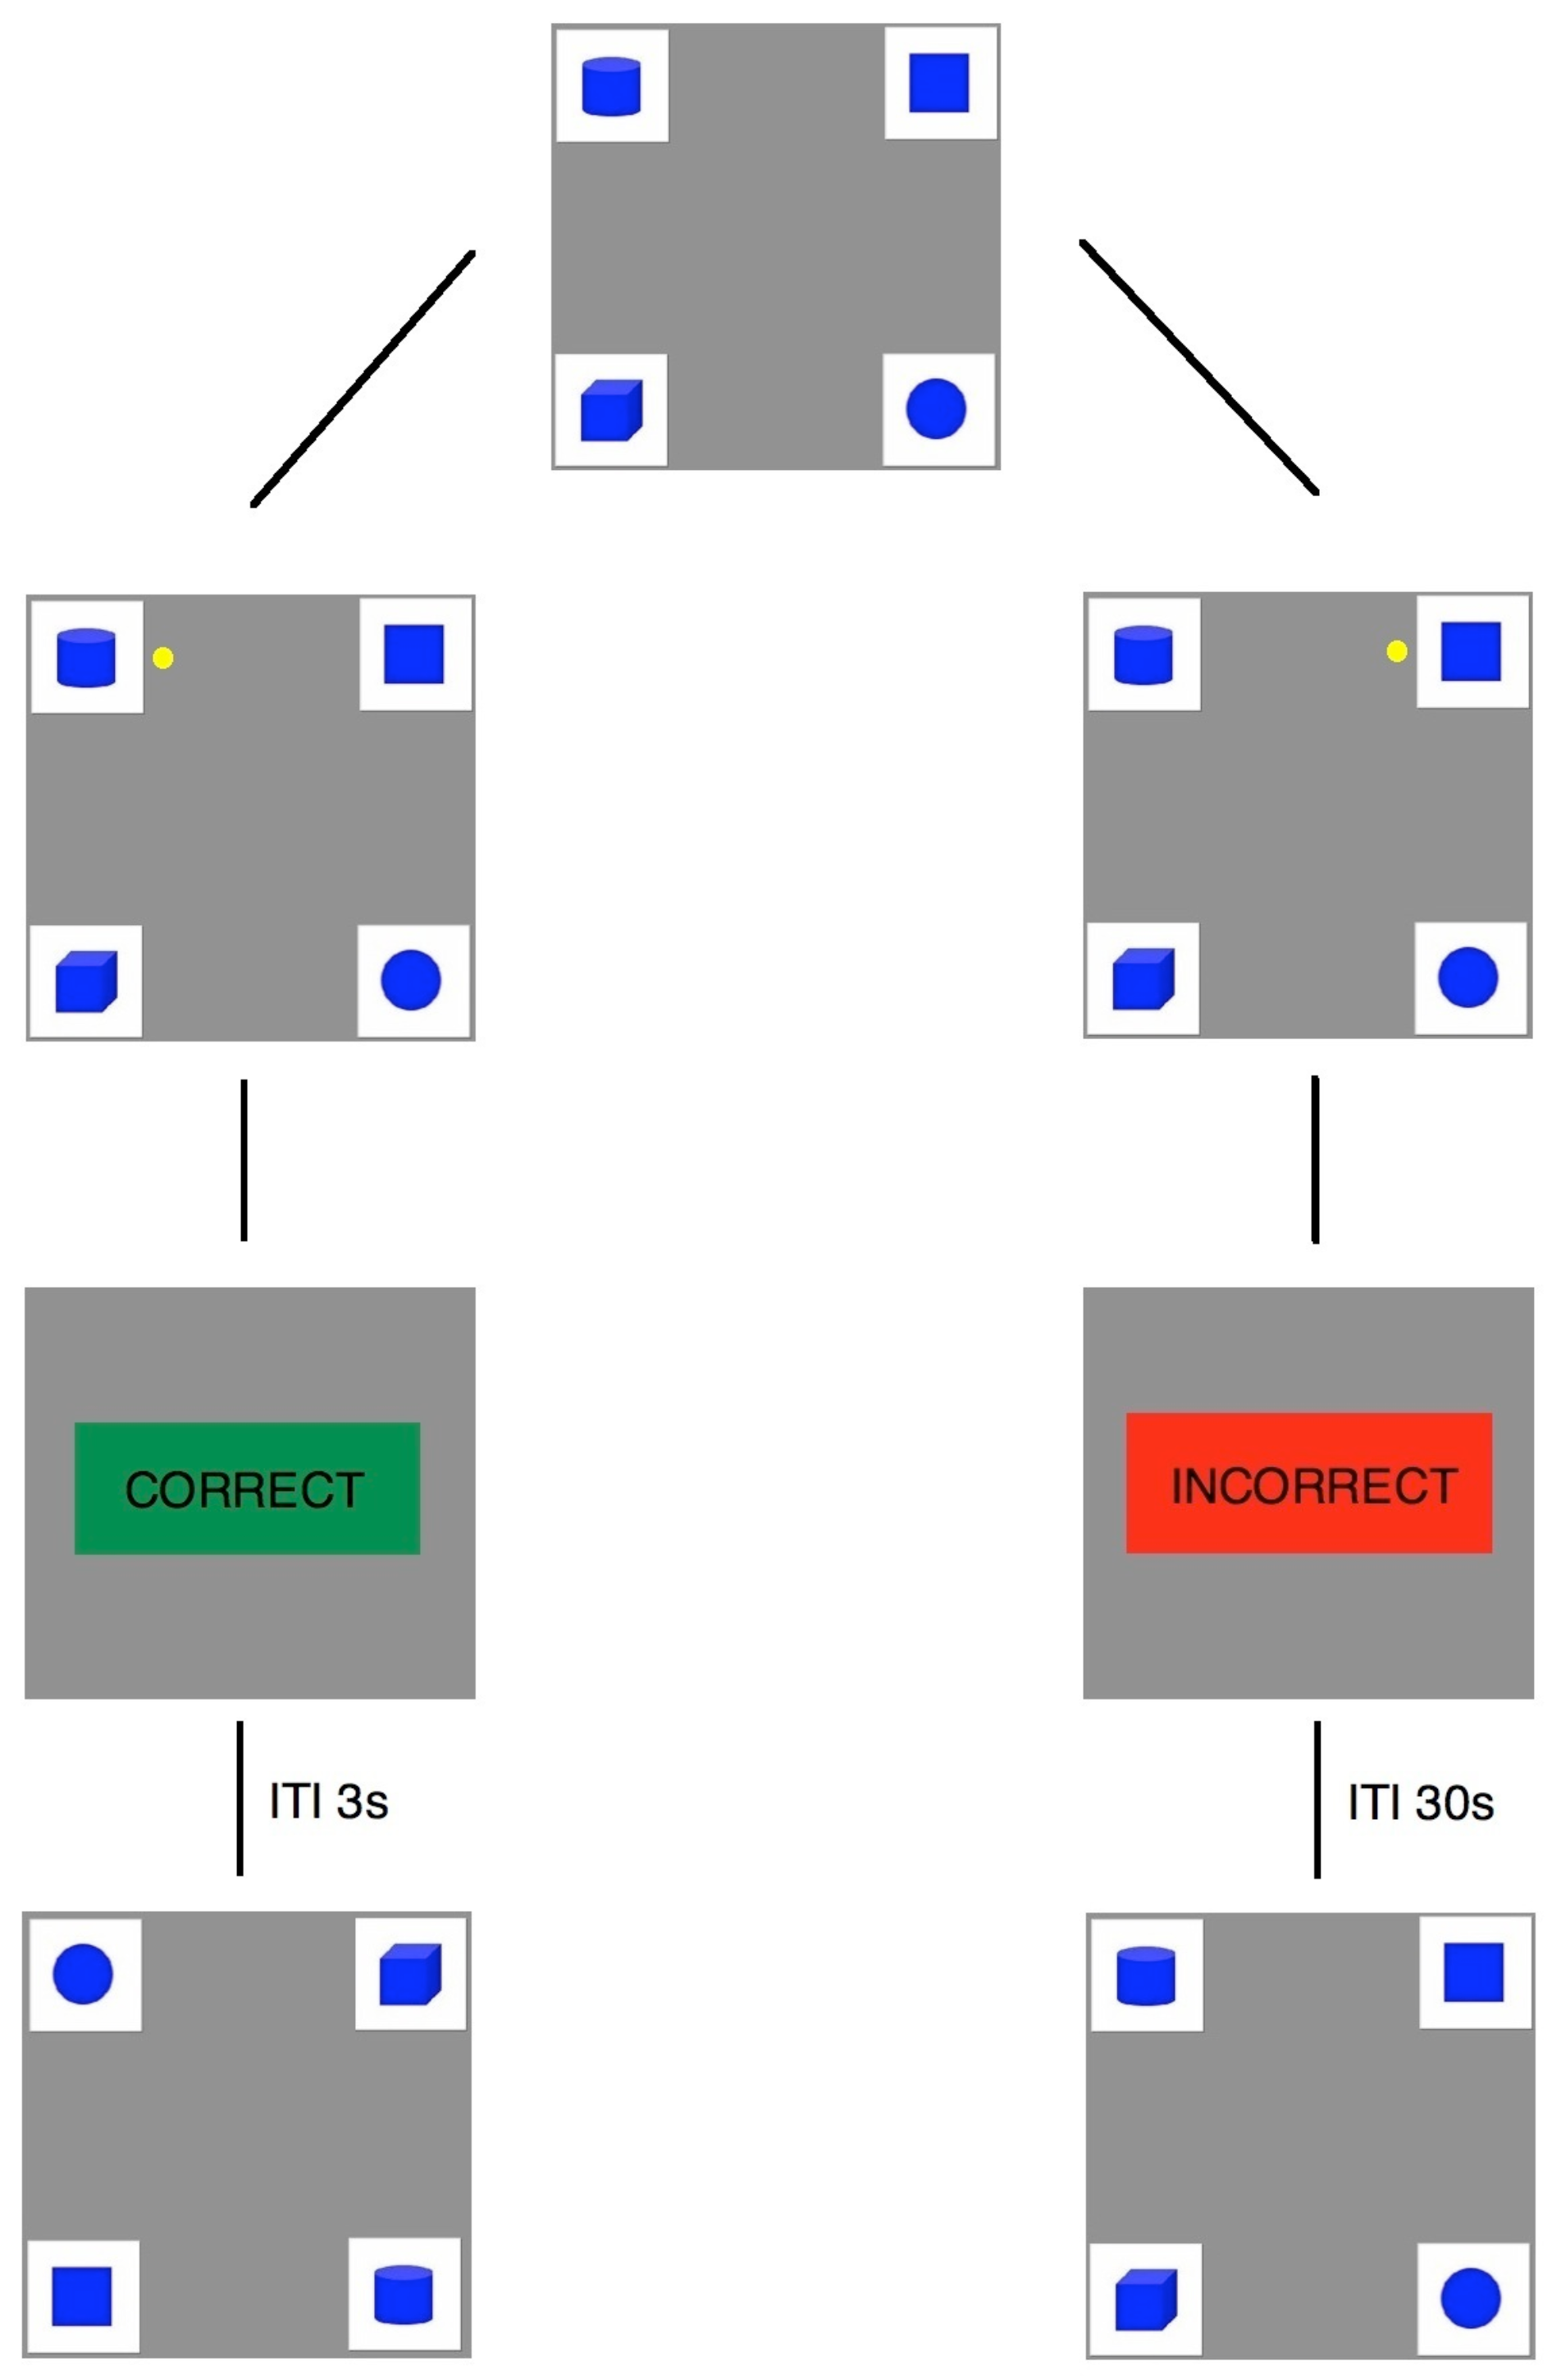
Stimuli were four monochromatic blue figures with approximately the same luminance, varying between 19.4 cd/m2 to 19.9 cd/m2. Two figures were two-dimensional – square and circle – and the other two were threedimensional – cube and cylinder (Figure 1). Figures’ dimensions were 2.4 cm x 2.4 cm, displayed in a 4 cm x 4 cm white background. Center-to-center distance between figures was 11.5 cm. A minimum viewing distance of 65 cm was maintained between the participant’s eye and the monitor, and thus the maximum sizes in terms of visual angle was 2 deg x 2 deg for the figures, 3.5 deg x 3.5 deg for the backgrounds, and 10.1 deg center-to-center distance for the figures..

Figure 1.
Series of frames displayed for participants during a trial. The left branch is an example of a correct choice; the right branch is an example of an incorrect choice.
Procedure
Sessions began with an apparatus calibration routine that lasted for approximately 10 minutes. Then the following instructions were read:
“Figures will appear in the corners of this screen. Your job is to choose the correct figure. You indicate your choice by pressing letter W on the keyboard to choose the upper left corner; S to choose the bottom left corner, P to choose the upper right corner and L to choose the bottom right corner. A yellow light will appear next to the figure you chose. If the choice you made is correct, a green light will appear on the center of the screen; if the choice is incorrect, a red light will appear. In the beginning you may have to guess a bit, but you shouldn’t have any trouble figuring it out eventually.”
The session consisted of four blocks of 20 trials each. On each trial the four figures were presented simultaneously, one in each corner of the screen (Figure 1). The locations of figures across trials were balanced in each block, and figures were presented in the same location for no more than two consecutive trials. The participant responded by pressing one of the four letters (W, S, P, L). A yellow light flashed for 2s next to the chosen figure. For two participants (P4 and P5) choices of “square” or “cube” were followed by the word “correct” displayed on a green background, a 3-second inter-trial interval (ITI) and the beginning of the next trial; choices of “circle” or “cylinder” were followed by the word “incorrect” displayed on a red background, a 30-second ITI and the representation of the same trial (correction trial). For the other two participants (P6 and P7) the consequences for figure choices were reversed (i.e., “circle” or “cylinder” correct, and “square” or “cube” incorrect).
Results and Discussion
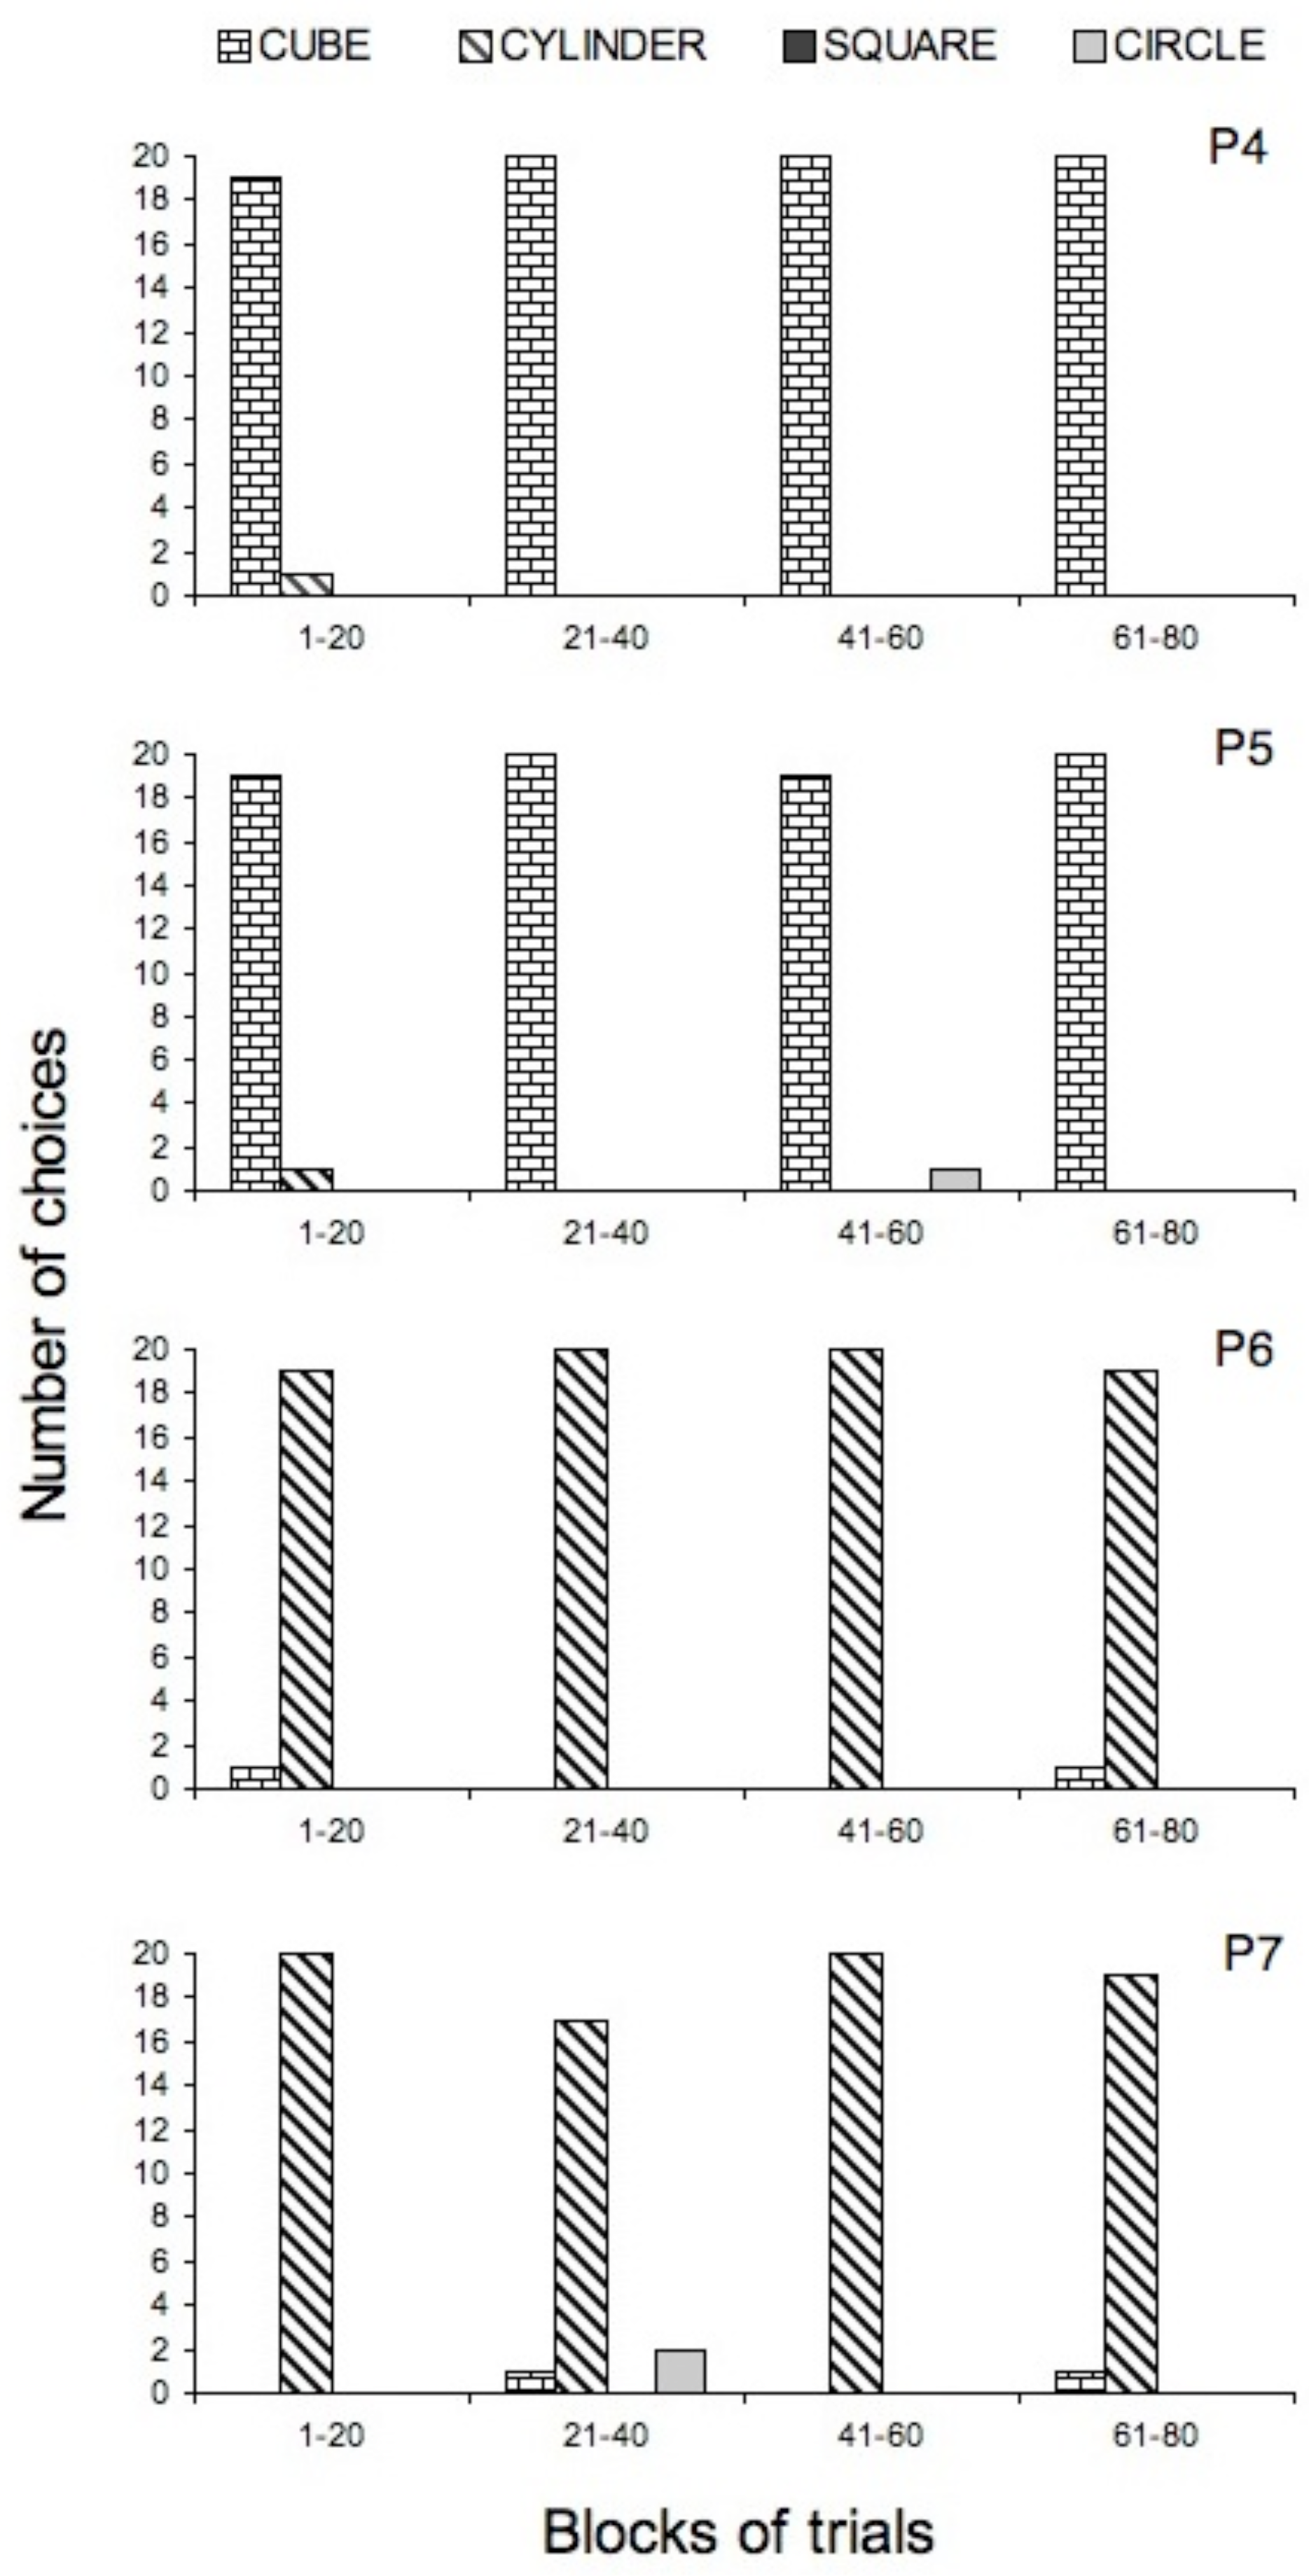
Figure 2 shows the participants’ manual choice distributions during the four blocks of trials. All participants chose almost exclusively only one figure, the threedimensional figure followed by the “correct” message and shorter ITI as consequences. This result is consistent with the model of selection by consequences proposed by Skinner (1981) to explain behavior (for a more detailed explanation of reinforcing consequences upon behavior, see Mazur, 2006).
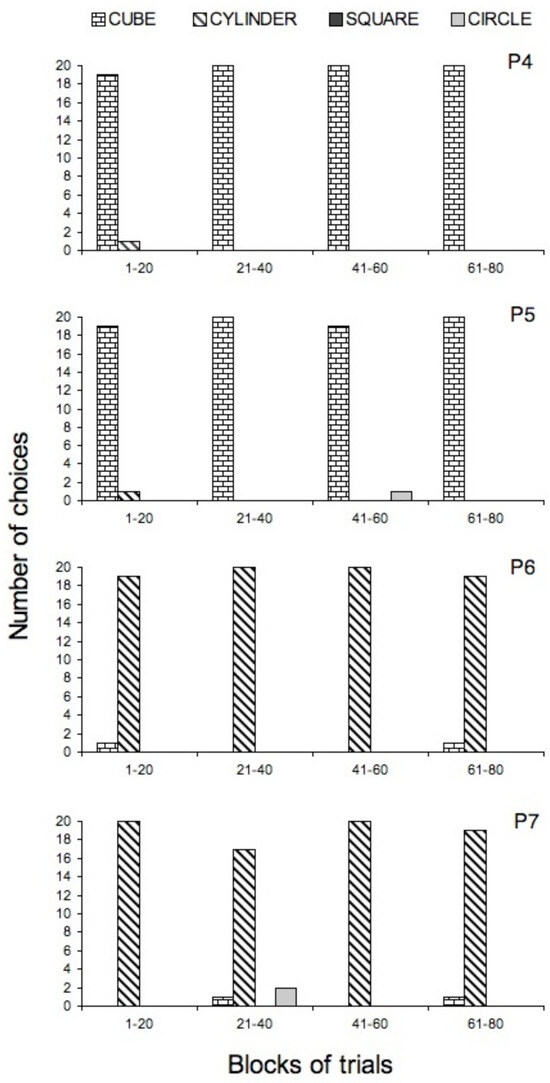
Figure 2.
Number of choices of each figure, per block of 20 trials, for each participant. Corrections trials not included.
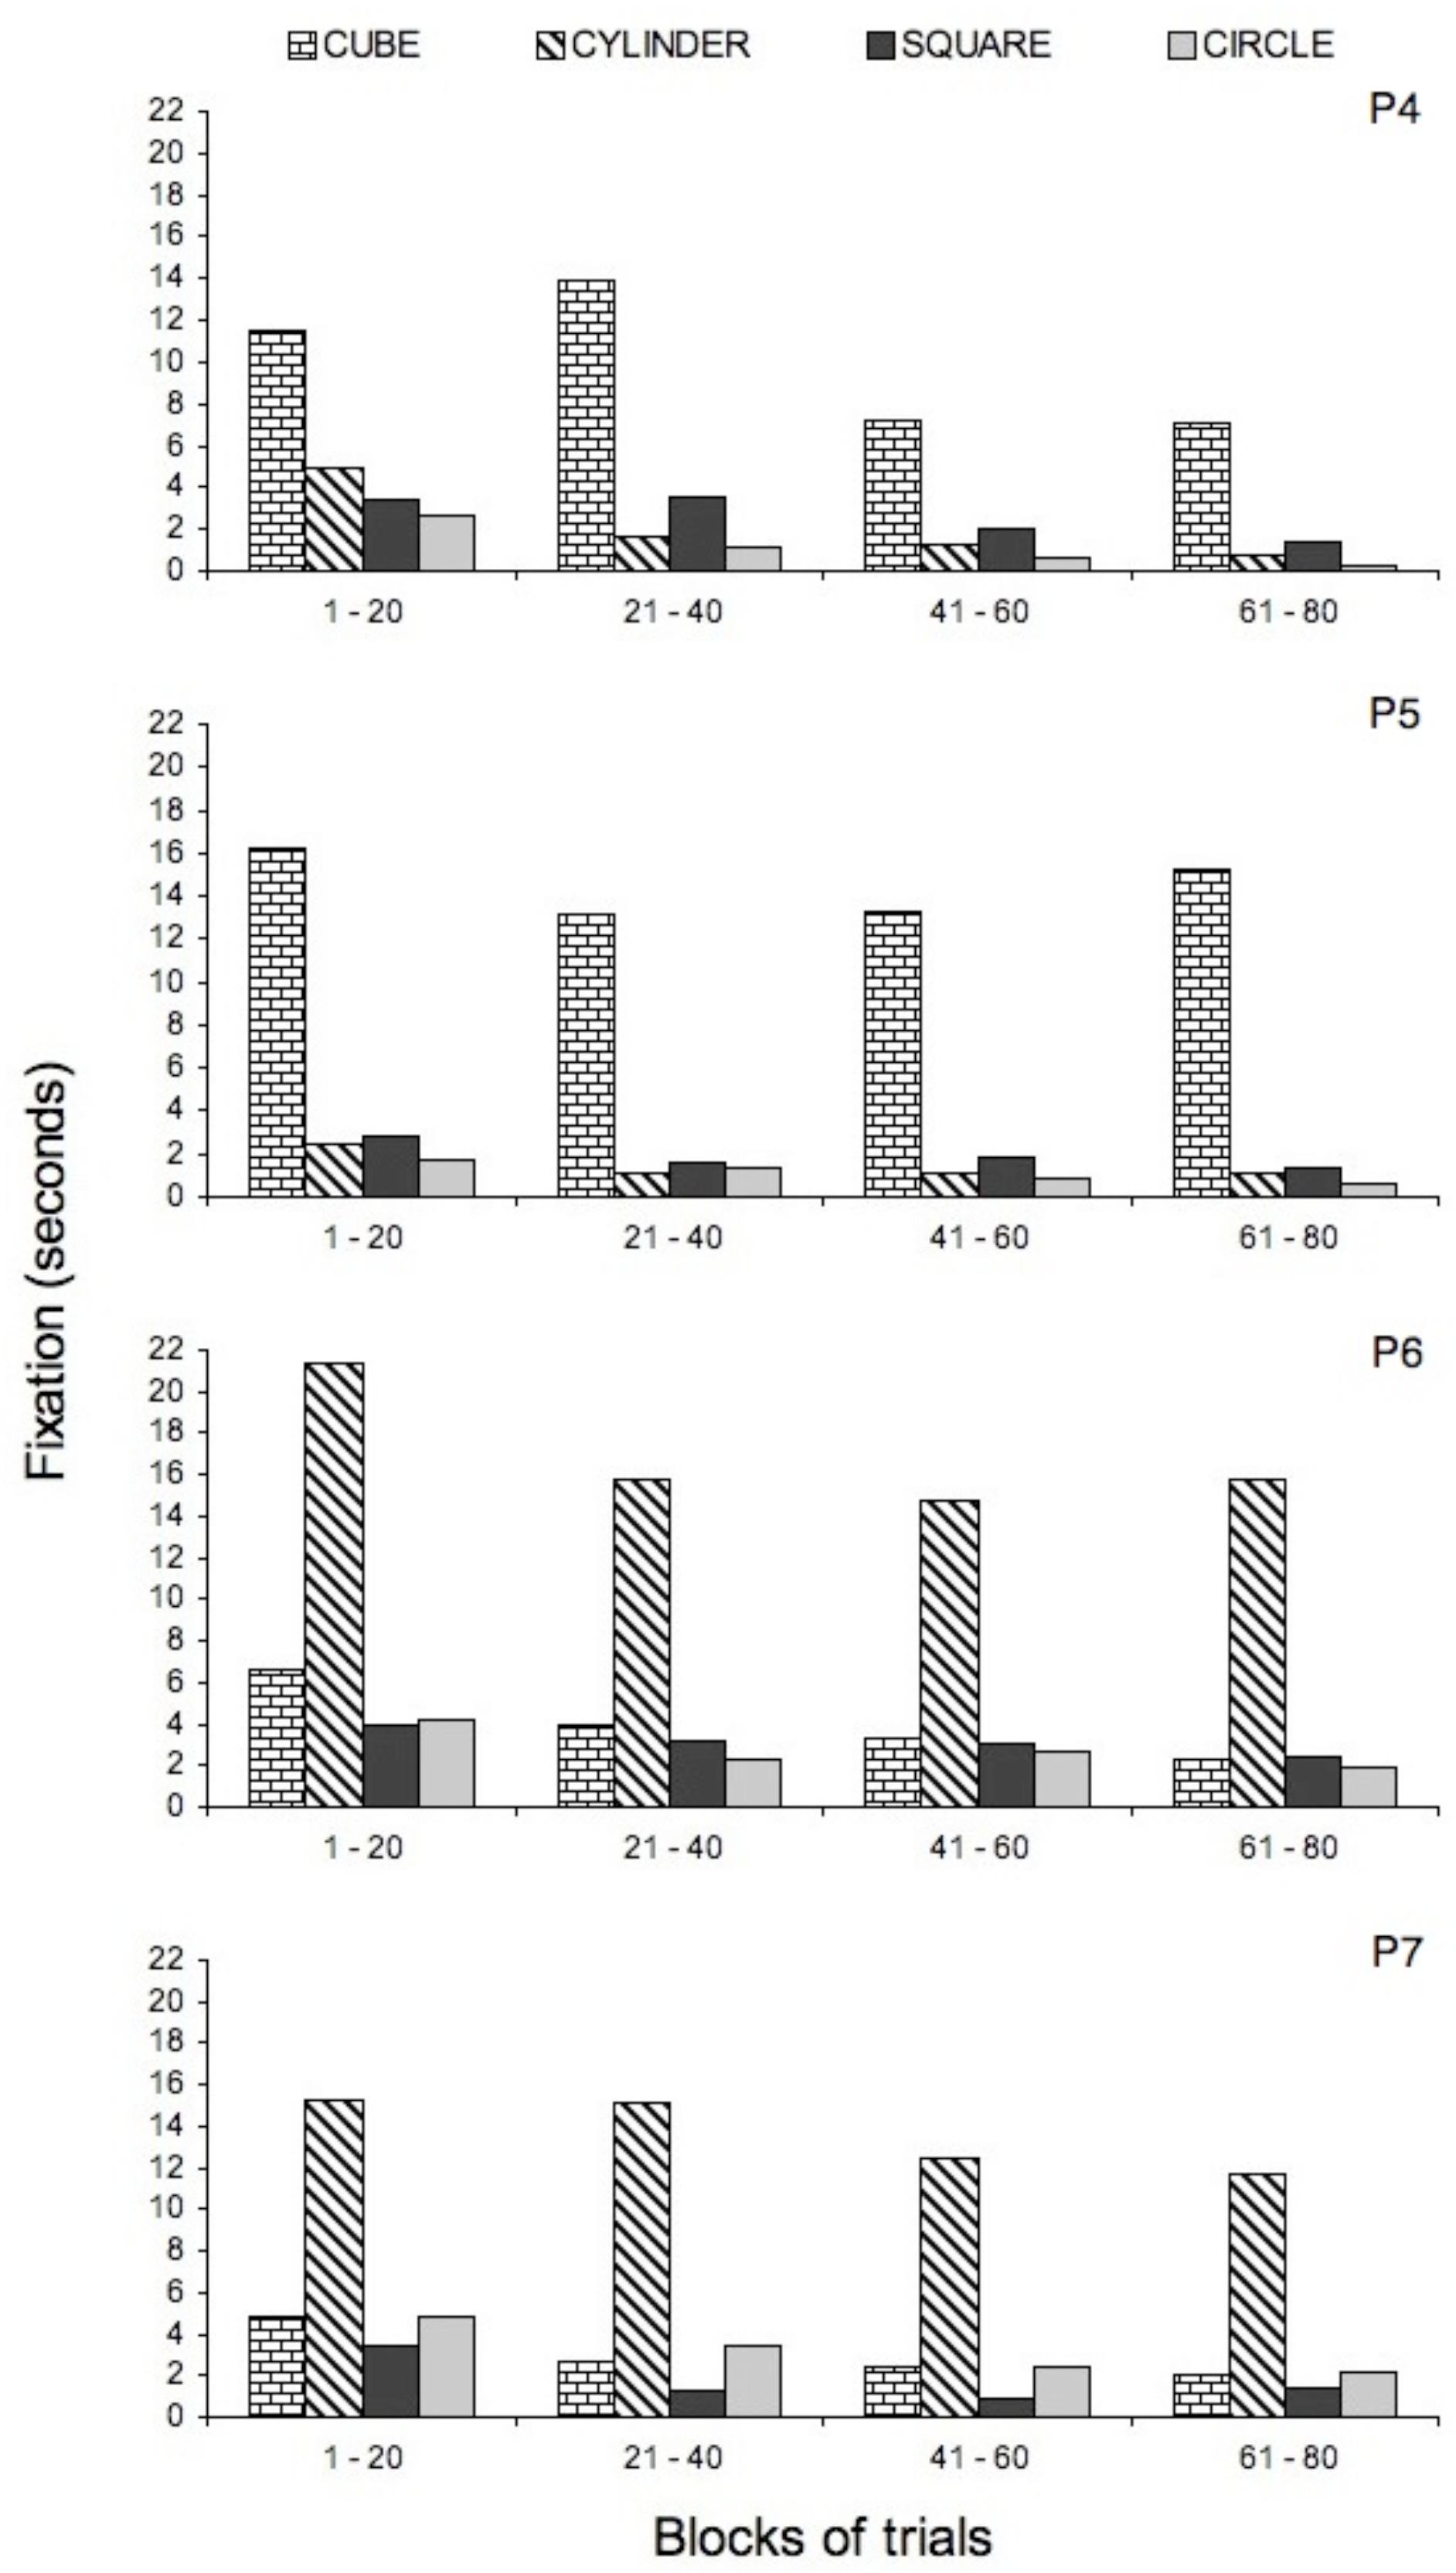
In accordance with the manual choices, fixation occurred significantly more often to the “correct” chosen figure than to all other figures (Figure 3). (The average of the total time spent fixating the “correct” chosen figure was significantly different from the average of the total time fixating each of the other three figures. ANOVA: F (3, 9) = 78,974; p< .005). The average time spent fixating the four figures, from the most to the least fixated, can be seen in Figure 4. The longer fixation of “correct” figures shows the sensitivity of observing behavior to its consequences (Schroeder, 1970; Schroeder & Holland, 1968). These results also support Dinsmoor’s (1983) selective observing theory: The figures served not only as discriminative stimuli for the manual task response, but also as discriminative stimuli for maintaining or terminating the fixation responses to them.
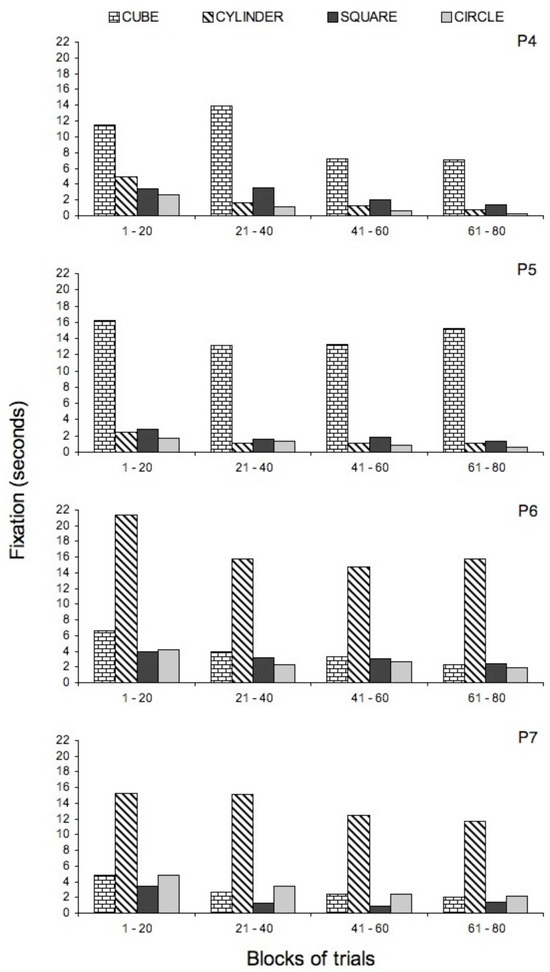
Figure 3.
Total fixation time (in seconds) for each figure, per block of 20 trials, for each participant. Trials with the same configuration that followed “incorrect” choices (correction trials) are not presented.

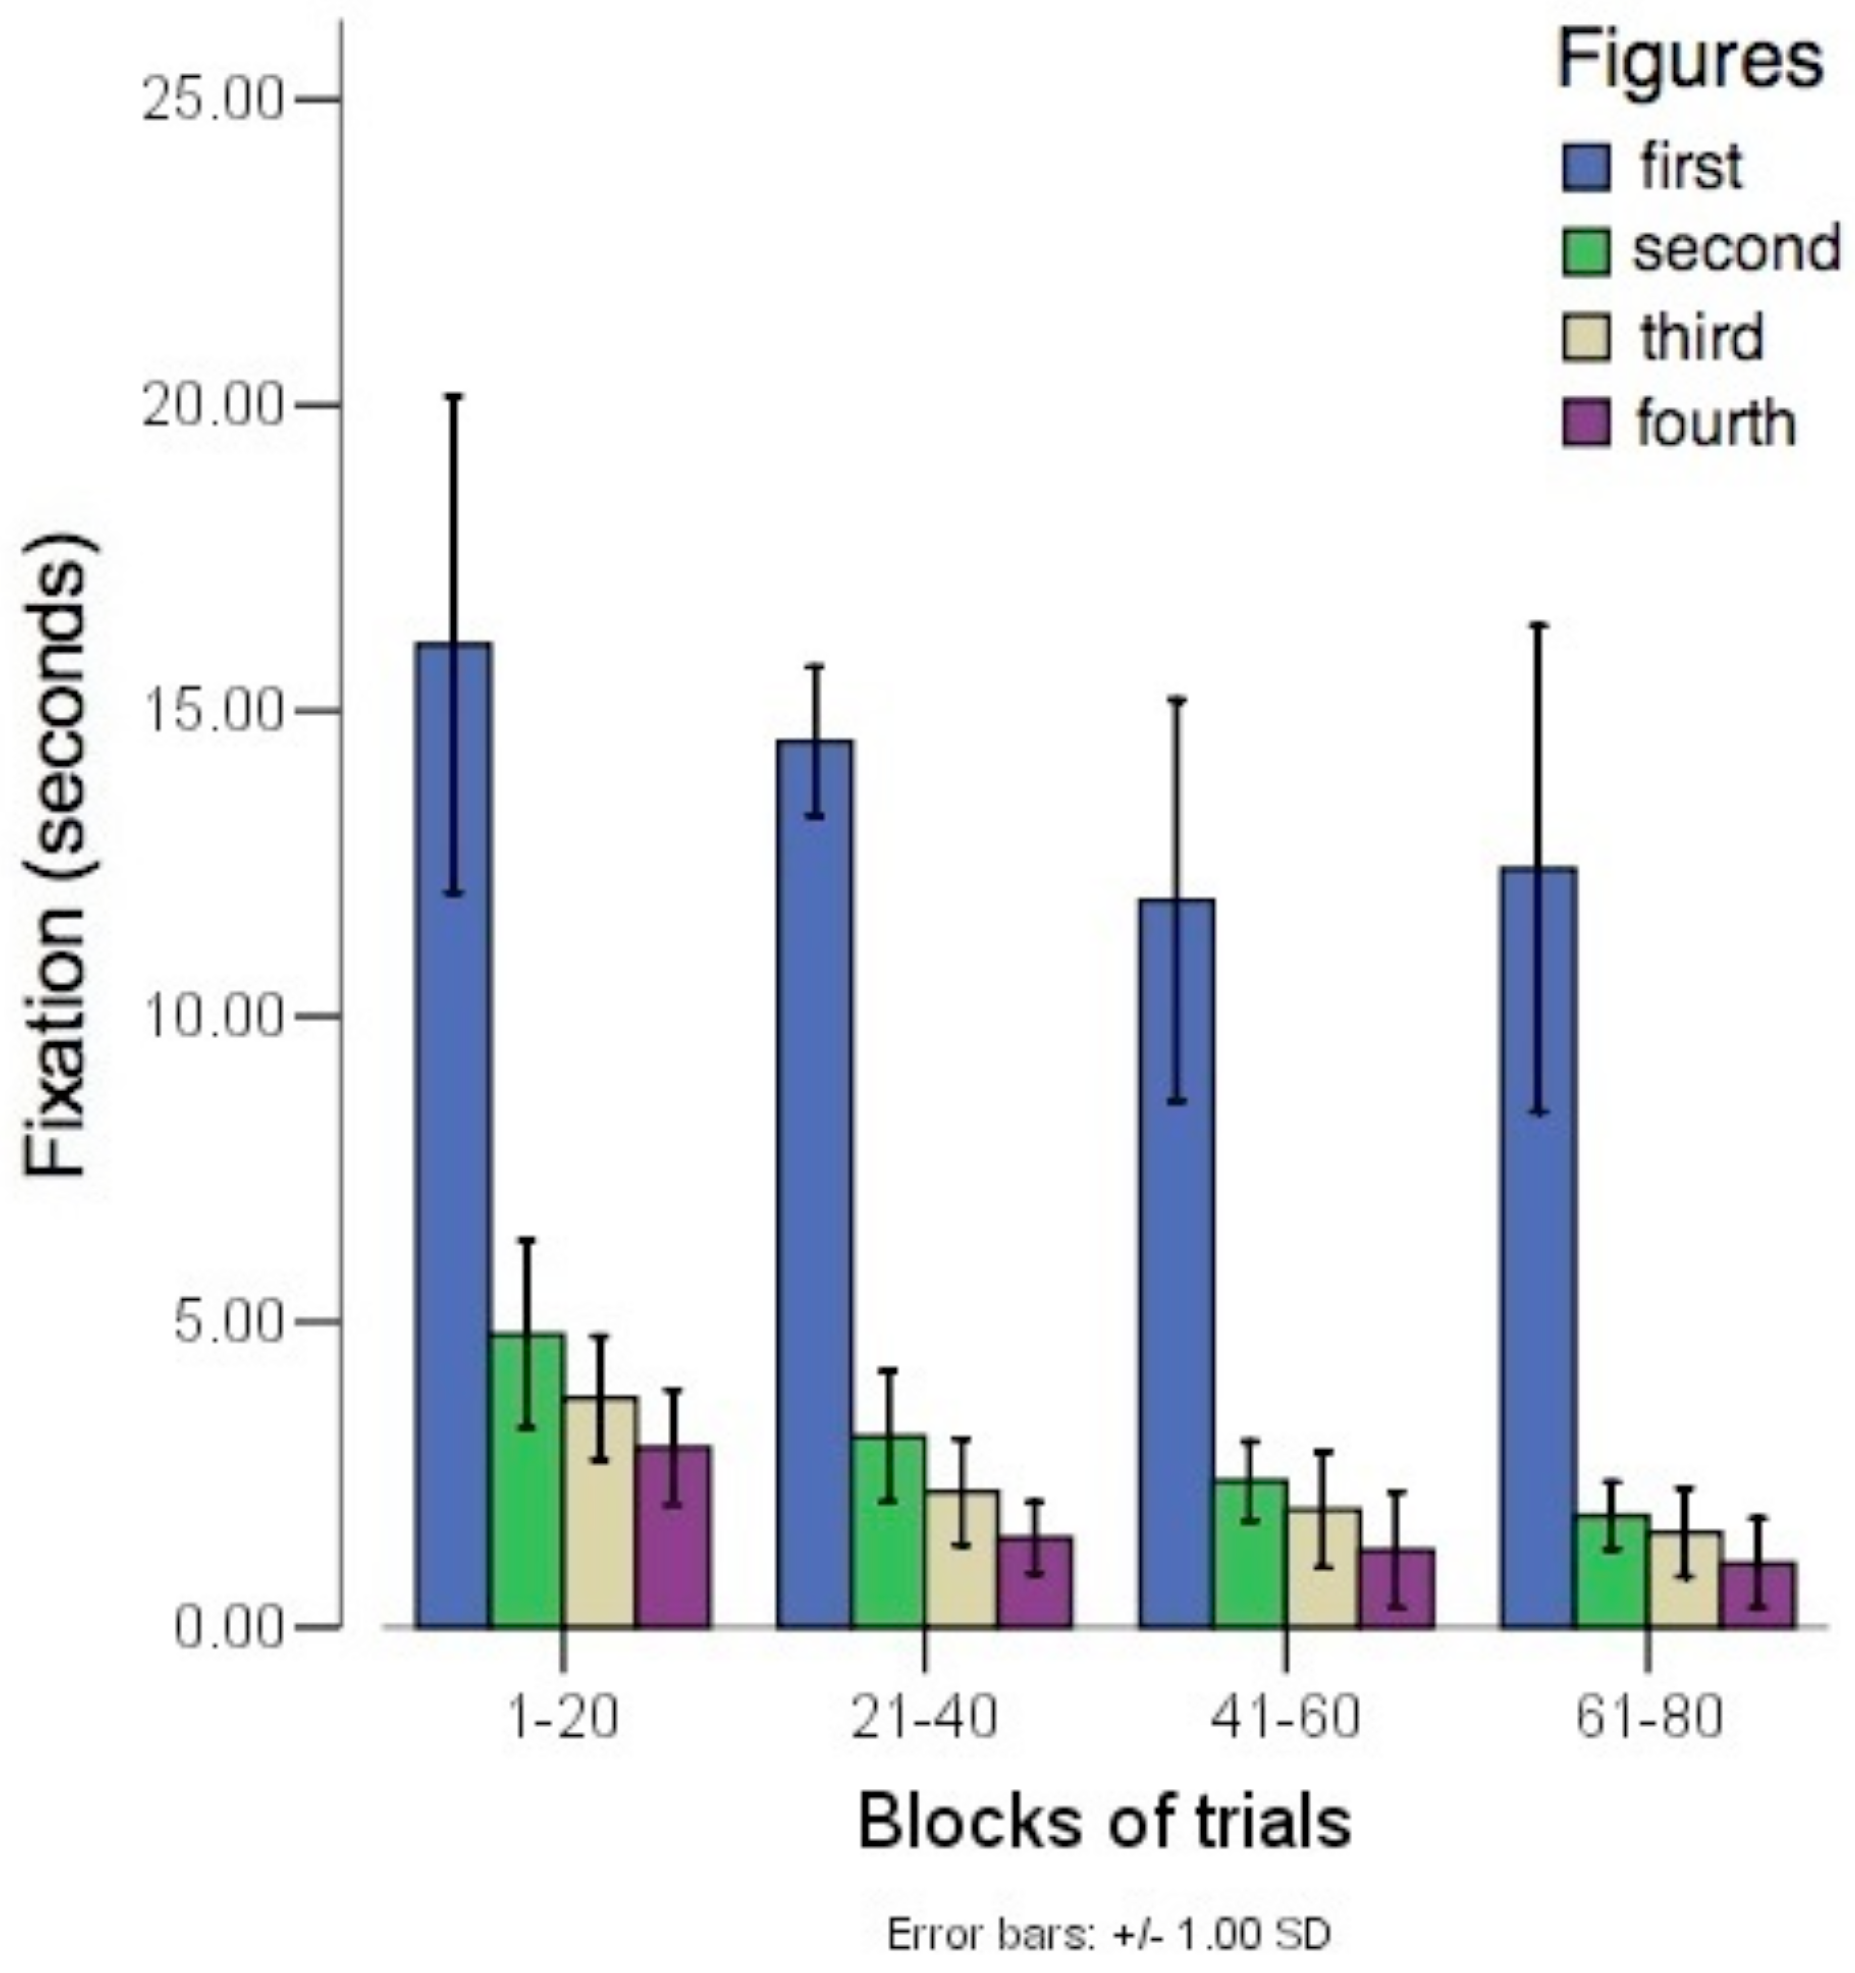
Figure 4.
The average of the four participants’ time spent fixating figures (duration in seconds) across the four blocks of trials. The bars, from left to right, show the average from the most to the least fixated figure.
A practice effect can be observed in the significant decrease of fixation durations from one block to another (Taking in account the average total time spent fixating figures during each block, the average total time spent fixating figures in one block was significantly different from the others. ANOVA: F (3, 9) = 15, 191; p = .001). Figure 4 shows that fixations of figures related to a “correct” message and shorter ITI consequences decreased less than fixation of all other figures, but the decreases were not significantly different (Taking in account the interaction between the first and the last block in relation to the total average time spent fixating each figure in the first and in the last block, ANOVA: F (9, 27) = 1,471; p = .209, differences were not significant).
Several aspects of the present experiment replicated Schroeder (1970), including the consequences for the manual task, the visual angular distance between stimuli, and the same general experimental situation. The primary difference was equal luminance across stimuli in the present study and unequal luminance in Schroeder (1970). Schroeder’s results showed zero frequency of foveal fixation on figures in the final trials of his procedure. In contrast, the present experiment found a decrease in fixation durations, but no choice was made without at least one fixation on the chosen figure. This result suggests that balancing the luminance of the figures in a choice situation may increase the probability that stimuli will be fixated, a reduction in practice effects.
This experiment contributes to the literature showing that the control of differential programmed consequences in the manual task (e.g., “correct” message and shorter ITI versus “incorrect” message and longer ITI) is a relevant variable in experiments involving endogenously controlled saccades and subsequent fixations. Previous studies have already shown that stimuli related to different consequences in the manual task control different frequencies of saccades towards them (Magnusson, 2002; Schroeder, 1969a, 1969b, 1970; 1997, Schroeder & Holland, 1968, 1969). The present results also show that, although differential consequences were programmed for the manual task, such differential consequences affected systematically the time spent fixating the stimuli related to them (e.g. Dube et al., 2006; Dube et al., 2003; Tomanari et al., 2007).
Finally, the present results support Schroeder’s hypothesis that the difference in the luminance of the figures is a critical variable to enhance the practice effect. In our experiment, the decrease in time spent fixating the most-chosen stimulus ranked from 6% to 38% across participants. In Schroeder’s study (1970), all participants ceased to fixate the most chosen stimuli during the last block of trials (decrease of 100%). Taken together, these results show that it is possible to increase the fixation duration for target stimuli (i.e., reduce the practice effect) in a repetitive task situation by balancing (controlling) the luminance of the stimuli.
Acknowledgments
The authors thank Dr. William Dube for the careful reading and Carlos Pinto for the statistics revision. The present research received financial support from CNPq and FAPESP, two Brazilian funding agencies, in the form of grants and scholarships.
References
- Dinsmoor, J. A. 1983. Observing and conditioned reinforcement. The Behavioral and Brains Sciences 6: 693–728. [Google Scholar]
- Dube, W. V., L. M. Balsamo, T. R. Fowler, C. A. Dickson, K. M. Lombard, and G. Y. Tomanari. 2006. Observing behavior topography in delayed matching to multiple samples. The Psychological Record 56: 233244. [Google Scholar]
- Dube, W. V., K. M. Lombard, K. M. Farren, D. S. Flusser, L. M. Balsamo, T. R. Fowler, and G. Y. Tomanari. 2003. Edited by S. Soraci and K. Murata-Soraci. Stimulus over-selectivity and observing behavior in individuals with mental retardation. In Visual Information Processing. Praeger: pp. 109–123. [Google Scholar]
- Doran, J., and J. G. Holland. 1971. Eye movements as a function of response contingencies measured by blackout technique. Journal of Applied Behavior Analysis 4: 11–17. [Google Scholar] [PubMed]
- Godijn, R., and J. Theeuwes. 2003. Edited by J. Hyönä, R. Radach and H. Deubel. The relationship between exogenous and endogenous saccades and attention. In The Mind’s Eye: Cognitive and Applied Aspects of Eye Movement Research. Elsevier Science BV: pp. 3–26. [Google Scholar]
- Mackworth, N., and E. Thomas. 1962. Head-mounted eye-marker camera. Journal of Optical Society of America 52: 713–716. [Google Scholar] [CrossRef]
- Madelain, L., L. Champrenaut, and A. Chauvin. 2007. Control of sensorimotor variability by consequences. Journal of Neurophysiology 98: 2255–2265. [Google Scholar] [CrossRef]
- Magnusson, A. 2002. Topography of eye movements under select and reject control. Unpublished doctoral dissertation, Northeastern University. [Google Scholar]
- Mazur, J. E. 2006. Learning and behavior, 6th ed. Pearson Prentice Hall. [Google Scholar]
- Schroeder, S. R. 1969a. Effects of cue factors on selective eye movements and choices during successive discriminations. Perceptual and Motor Skills 29: 991998. [Google Scholar] [CrossRef] [PubMed]
- Schroeder, S. R. 1969b. Fixation and choice selectivity during discrimination transfer. Psychonomic Science 17: 324–325. [Google Scholar]
- Schroeder, S. R. 1970. Selective eye movements to simultaneously presented stimuli during discrimination. Perception & Psychophysics 7: 121–124. [Google Scholar]
- Schroeder, S. R. 1997. Edited by D. M. Baer and E. M. Pinkston. Selective eye fixations during transfer of discriminative stimulus control. In Environment and Behavior. Westview: pp. 97–110. [Google Scholar]
- Schroeder, S. R., and J. G. Holland. 1968. Operant control of eye movements. Journal of Applied Behavior Analysis 1: 161–166. [Google Scholar] [PubMed]
- Schroeder, S. R., and J. G. Holland. 1969. Reinforcement of eye movements with concurrent schedules. Journal of the Experimental Analysis of Behavior 12: 897903. [Google Scholar]
- Skinner, B. F. 1981. Selection by consequences. Science 213: 501/4. [Google Scholar] [PubMed]
- Tomanari, G. Y., L. M. Balsamo, T. R. Fowler, K. M. Farren, and W. V. Dube. 2007. Manual and ocular observing behavior in human subjects. European Journal of Behavior Analysis 8: 29–40. [Google Scholar]

Copyright © 2008. This article is licensed under a Creative Commons Attribution 4.0 International License.