Abstract
Purely symmetrical vergence stimuli aligned along the midline (cyclopean axis) require only a pure vergence response. Yet, in most responses saccades are observed and these saccades must either produce an error in the desired midline response or correct an error produced by asymmetry in the vergence response. A previous study (Semmlow et al., 2008) has shown that the first saccade to appear in a response to a pure vergence stimulus usually increased the deviation from the midline, although all subjects (N = 12) had some responses where the initial saccade corrected a vergence induced midline error. This study focuses on those responses where the initial saccade produces an increased midline deviation and the resultant compensation that ultimately brings the eyes to the correct binocular position. This correction is accomplished by a higher level compensatory mechanism that uses offsetting asymmetrical vergence and/or corrective saccades. While responses consist of a mixture of the two compensatory mechanisms, the dominant mechanism is subject-dependent. Since fixation errors are quite small (minutes of arc), some feedback controlled physiological process involving smooth eye movements, and possibly saccades, must move the eyes to reduce binocular error to fixation disparity levels.
Introduction
Pure vergence stimuli can be constructed in the laboratory and are useful for the study of disparity vergence eye movements. Such stimuli can be presented using a stereo pair of images moving in equal and opposite directions or by two targets placed at different depths along the midline (i.e., mid-sagittal or cyclopean axis). In the latter case, an accommodative (i.e., blurdriven) stimulus may also drive the vergence response. These “pure vergence stimuli” might be expected to produce a “pure vergence response” where vergence motor components drive the two eyes an equal amount in opposite (i.e., disjunctive) directions. Theoretically, pure vergence responses would follow along the mid-sagittal plane with no version component to the response.
Here we define version and vergence formally by the equations (These definitions apply only to movement directions and the plotting convention used here. They do not define the motor components of either version or vergence which are difficult to isolate. See Semmlow et al. (2008) for a discussion of terminology.):
Vergence = left eye amplitude – right eye amplitude
Version = (left eye amplitude + right eye amplitude)/2
In this paper, we define convergence as positive. Since the left eye (the positive eye in Eq. 1) moves to the right during convergence, rightward version movements are signed positive to be consistent with the vergence equation (Eq. 1). Hence divergence and leftward version movements are noted as negative.
In the response to a pure vergence stimulus, the version component should theoretically be equal zero. In normal subjects with good binocular vision, the net version component must be very small by the end of the movement, since steady fixations errors are close to zero (Ogle, 1954). Two factors can lead to a transient version component during a symmetrical vergence response. First, vergence responses often contain saccades (Levi et al., 1987; van Leeuwen et al., 1998; Zee et al., 1992; Collewijn et al., 1995; Semmlow et al., 2008) and even a small saccade will generate a substantial deviation for the midline. Second, even if no saccades are present, vergence movements in response to a symmetrical vergence stimulus are often asymmetrical because one eye often moves faster than the other in pure vergence responses (Hong et al., 1998).
When saccades are present, there is a facilitation of the vergence response in the form of increased velocity during the intersaccadic period. This facilitation was originally attributed by Zee et al. (1992) to the decrease in vergence burst neuron inhibition when omnipause neurons are silenced during saccades. The original model of this interaction, the “saccade-related vergence burst model” has been updated to include an additional influence from the saccadic system that modifies a parameter of the vergence pulse generator (Kumar et al., 2006). This picture of saccade-vergence interaction has recently been modified by neurophysiological evidence from King and Zhou (2002) and Cullen’s group showing that premotor neurons encode combined conjunctive and disjunctive behavior for a given eye, the ipsilateral eye (Van Horn & Cullen 2008; Van Horn, Sylvestre and Cullen, 2008). This and evidence from other premotor areas have led this group to conclude that saccade burst neurons by themselves “carry all the vergence drive necessary” to mediate the vergence response (Van Horn, Sylvestre and Cullen, 2008).
The neural mechanism by which eye movements are organized at the premotor level is an active research area, but the focus of this work is on the processes and strategy used to compensate for the midline deviation produced by saccades during responses to pure vergence stimuli. These corrective processes represent a high level control strategy and are only peripherally related to the interactions between version and vergence described above.
Semmlow et al. (2008) found that most responses to a pure vergence stimulus do contain saccades. For more than half of their subjects, every response contained at least one saccade. A similar finding has been reported by Coubard and Kapoula (2008) who found either horizontal or vertical saccades in 84% of all vergence responses. Semmlow et al. (2008) also found that the initial saccade in these responses to pure vergence stimuli usually increased the deviation from the midline. (Here we refer to midline deviations as simply “error” and the saccades that produce these deviations, “error-inducing saccades.”) Although most initial saccades produced error, all subjects had some responses where the initial saccade reduced the midline deviation by compensating for a vergence-induced midline deviations. Semmlow et al. (2008) present evidence that most error-inducing initial saccades were the result of a monocular distraction produced by the transient diplopia of the vergence stimulus along with ocular preference. A similar suggestion has been made by van Leeuwen et al. (1998) who showed that subjects without a strong monocular preference were much more likely to produce saccadefree vergence responses to pure vergence stimuli. In a few subjects, initial error-inducing saccades brought the preferred eye closer to the target, which could lead to faster recognition at the expense of delayed binocular vision.
Irrespective of the motivation for error-inducing saccades, some compensation must occur by the end of the movement. While larger errors, particularly congurgate errors, may be tolerated under certain conditions, normal subjects can achieve highly accurate binocular fixation with errors of minutes of arc (Ogle, 1954). If the initial saccade in the vergence response moves the eyes away from the midline, then either a subsequent compensatory saccade, an offsetting vergence asymmetry (or slow version), or both is required to bring the eyes back to the midline. This study will isolate those vergence responses containing error-inducing initial saccades and determine the corrective mechanism used to bring the eyes back to binocular fixation.
Methods
Details regarding the data acquisition and analysis procedures can be found in an earlier paper (Semmlow et al., 2008) and will be only briefly repeated here.
Data Acquisition and Subjects:
Twelve subjects between the ages of 21 and 67 participated in this study. Subjects all had normal binocular vision assessed by the Randot Stereopsis test and used refractive correction if needed. All signed informed consent approved by the NJIT institutional review board. Eye movements of the left and right eyes were recorded using a Skalar Iris (model 6500, Delft, Netherlands) limbus tracker, and calibration references were taken for each movement. The stimulus consisted of three LED targets (Stanley model MU07 part 5101, London, OH) carefully aligned along the midline to produce convergent and divergent step-like stimuli. Of the several different stimuli presented during an experimental run, only convergent stimuli between 4 and 8 deg (i.e., 4 deg step change) were analyzed in this study. All stimuli had a random delay to reduce predictive cues (Alvarez et al., 2005). Random delays do not eliminate prediction of direction, but when the stimulus direction is also randomized, prediction is substantially reduced. Data were sampled at at a rate of 200 Hz.
Analysis:
Recordings of the left and right eye- movement in response to 4 deg step changes in pure vergence stimuli were collected from 12 subjects. Calibration was done immediately before and after the two second data acquisition period with the assumption that fixation errors were very small before, and several seconds after, the stimulus. All of the parameters described below are based on left and right eye position during the two second data acquisition period assuming that most of the movement is completed within two seconds after the stimulus presentation. Following calibration the individual eye movements were combined into version and vergence time responses using the standard definitions given above (Eqs. 1 and 2).
For all responses, a custom MATLAB (Waltham, MA) interactive graphics program was used both to measure saccadic behavior and construct an estimated saccade-free vergence response. The analysis procedure is discussed in detail in Semmlow et al. (2008) and is outlined here. To identify saccades, the derivative of individual left and right eye-movements was calculated using the two-point central difference algorithm. (This algorithm applies smoothing to the derivative trace.) The velocity trace was similar to the curve shown in Figure 1B (solid line) and was displayed on the computer screen. A human operator identified and marked the beginning and end of the high velocity segments using a mousecontrolled cursor (indicated by ‘*’ in Figure 1B). Hence saccades are defined by their dynamics which feature peak velocities well above those of other eye movements. These marks were used to identify the position and timing of all saccades in a response and these parameters were used in our analysis. Only saccades greater than approximately 0.1 to 0.15 deg were identified and quantified since saccades less than this value produce velocity traces that were difficult to indentify accurately.
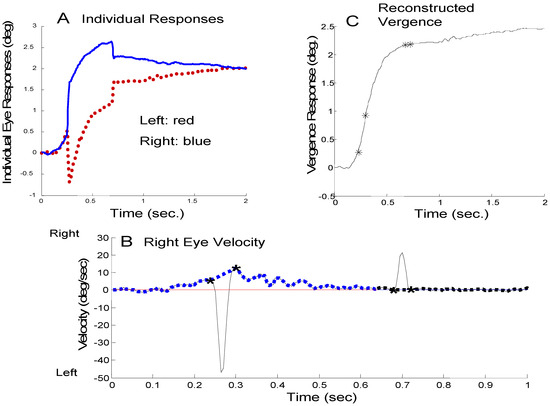
Figure 1.
Outline of the technique used to separate vergence and saccades. A) Individual left- (red) and right- (blue) eye movements where a convergent movement is plotted as positive. This unusual plot scheme emphasizes the dynamic characteristics of vergence. In these plots, congregate movements are in opposite directions. B) The velocity trace of the right-eye movement (black line) during this response. The high-velocity contributions have been separated from low-velocity components by linear interpolation between the beginning and end of each saccade (blue dotted line). The difference between the black solid high-velocity curve and the blue dotted low-velocity curve provides an estimate of the high-velocity component in this eye movement. C) The reconstructed saccadefree vergence response is obtained by integrating the left and right eye low-velocity traces and combining using Eq. 1.
Saccade-free eye movements were estimated by constructing a low-velocity profile where the highvelocity section was replaced with a linear change in velocity. This is shown for a right eye velocity trace in Figure 1B where the low-velocity estimate is shown as a dashed blue curve. The low-velocity estimate (blue curve) is integrated to produce a reconstructed saccadefree vergence response as shown in Figure 1C. The reconstructed vergence movements shown here will be identical to the original vergence movement except for the period during saccades when the behavior is necessarily an estimate. The difference between high- and low-velocity components can be used to estimate the ‘vergence-free’ velocity of the saccadic component in each eye.
If the high-velocity components could be attributed solely to saccades and the low-velocity to vergence, then this velocity separation technique would be sufficient to separate the two components. However, as mentioned above, there is considerable evidence that disparity vergence is enhanced when accompanied by either horizontal or vertical saccades. Here, we classify highvelocity components as a combination of saccades and saccade-induced vergence enhancement. Although not of interest in this study, saccade-induced vergence enhancements were quantified by differences between the left- and right-eye high velocity components.
Results
The goal of this paper is to describe the mechanism used for returning the eyes to midline binocular fixation after an initial saccade has produced a midline error. There are two possible mechanisms to correct the saccadic-induced error: saccadic compensation and/or an asymmetrical vergence response. In the discussion, we note the latter could be a true asymmetric (i.e., monocular) response or the combination of symmetric slow vergence and symmetric slow version responses We use the term ‘asymmetric vergence’ as a generic description of the behavior with no implications about the neural nature of the response. We use the term ‘vergence asymmetry’ as the measure of the version component of the an asymmetric vergence. Both saccades and asymmetrical vergence were used to compensate saccadic-induced midline errors in our subjects. An example of saccadic compensation is seen in Figure 2A. A large 2.5 deg initial leftward saccade occurs near the beginning of the vergence movement and is compensated approximately 200 msec later by a rightward saccade. There is still some residual error at the end of the second saccade (approximately 0.3 deg) and it is eventually corrected by a combination of asymmetrical vergence and other saccades, Figure 2B and Figure 2C, respectively.
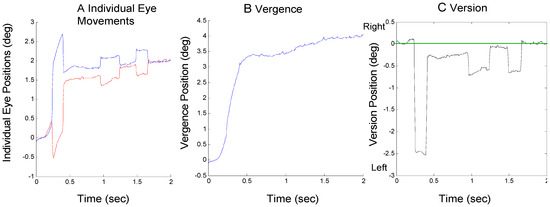
Figure 2.
A response from Sub. 10 where an initial error-inducing saccade is followed by a correcting saccade. A) Individual eye movements are plotted using the same format as in Figure 1A where convergence is plotted upward for both eyes. B) The convergence movement as defined by Eq. 1. C) The version movement as defined by Eq. 2 where rightward movements are plotted as positive. The straight green line indicates the midline or mid-sagittal plane.
An example of the second compensatory mechanism, an offsetting asymmetrical vergence, is shown in Figure 3. In Figure 3A, an approximately 1.4 deg saccade to the right visual field is quickly offset by a larger vergence movement in the right eye (blue curve) than in the left (red curve). The combined vergence signal using Eq. 1 and version signal using Eq. 2 is shown in Figure 3B and Figure 3C respectively.
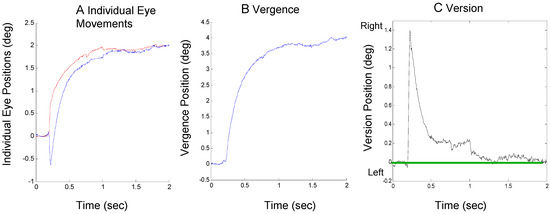
Figure 3.
A response from Sub. 4 where an initial error-inducing saccade is corrected primarily by subsequent vergence asymmetry showing individual eye movements (plot A), the convergence movement (plot B) and the version movement (plot C). The format is the same as Figure 2.
It is also possible that both mechanisms contribute approximately equally to compensate for an initial errorinducing saccade. This is illustrated in Figure 4 where a large initial rightward saccade is compensated about equally by a leftward saccade and a vergence assymmetry.
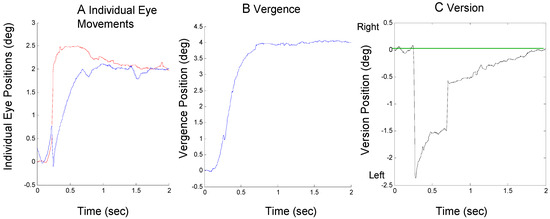
Figure 4.
A response from Sub. 1 where an initial error-inducing saccade is corrected by both a secondary saccade and asymmetrical vergence showing an individual eye movements (plot A), the convergence movement (plot B) and the version movement (plot C). The format is the same as Figure 2.
Error-Inducing Saccades – Saccadic Correction
If the midline error produced by an initial errorinducing saccade is compensated by a secondary saccade, we would expect that the amplitude of the second saccade would correlate strongly (and negatively) with the amplitude of the initial saccade. Figure 5 shows the correlation between an initial error-inducing saccade and the subsequent saccade for three subjects. These subjects were chosen because they represent the range of behaviors seen in our subjects. If all of the error induced by the initial saccade were compensated by the second saccade, points would lie along the 1-to-1 line passing through zero (solid black line). The slope of the regression line would be -1. When a point lies above or below this line, the difference between the point and that line represents the compensatory contribution of the other mechanism, in this case asymmetrical vergence (or slow version). The dashed black line shows the linear regression of second saccade amplitude against initial saccade amplitude when the initial saccade was errorinducing. (Only responses that had an initial error– inducing saccade were included in the data of Figure 6.) When the error-inducing saccade was the only saccade in the response, the amplitude of this saccade was plotted as a square point and these responses were not included in the regression analysis.
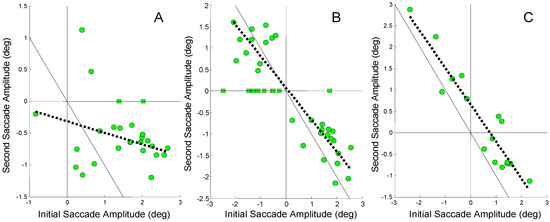
Figure 5.
The amplitude of the second saccade plotted against the amplitude of the initial saccade in responses where the initial saccade was error-inducing. The squares are for responses that had only the error-inducing saccade. A) A low regression slope of -0.18 is seen between the amplitude of the second and initial saccade in Sub. 3 (r2 = 0.1, not significant p > 0.1). B) A moderate correlation with a slope of -0.74 is found between the amplitude of second and initial saccade in Sub. 6 (r2 = 0.74; p < 0.01). C) A high correlation with a slope of -0.86 is found between the second and initial saccade in Sub. 12 (r2 = 0.88; p <0 .01). Note the scales of the horizontal and vertical axes are different.
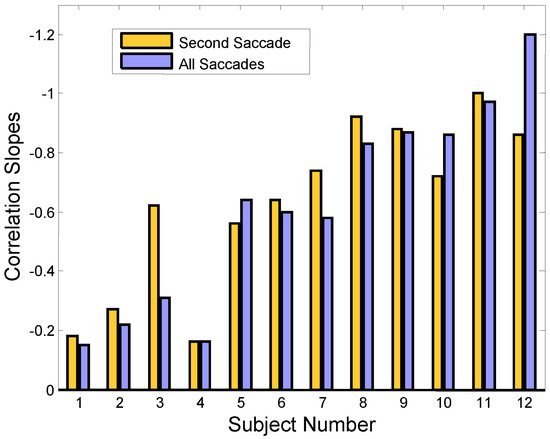
Figure 6.
Regression slopes showing the correlation between the amplitude of second and initial saccades (gold bars) and the net amplitude of all subsequent saccades and the initial saccade (purple). Only responses that had initial error-inducing saccades are included in the correlation. The ‘*’ indicates statistically significant correlations (p < 0.01). Negative correlation is plotted upward.
Figure 5A shows a highly scattered set of data with a regression line (dashed line) having a slope = -0.18 and a low correlation coefficient (r2 = 0.1). This non-significant correlation indicates that the second saccade did not systematically compensate for the midline deviation produced by the initial error-inducing saccade. A figure below shows that vergence asymmetry is primarily responsible for compensating the saccade-induced midline errors in this subject.
In Figure 5B, a steeper regression line (slope = -0.74) is seen with a significant correlation (r2 = 0.74; p < 0.01) indicating that some, but not all of the error compensation is provided by the second saccade. In Figure 5C, a large negative slope is found (slope = -0.86) with high correlation (r2 = 0.88, p < 0.01). It is clear that in this subject the second saccade is compensating for much of the midline error produced by the initial saccade. The fact that the regression line is shifted to the right of the 1-to1 line indicates that the secondary saccades are slightly larger than that necessary for full compensation.
The information provided in Figure 5 is summarized by graphing the regression slopes for all our subjects in Figure 6 (gold bars). Compensatory correlations are negative: a compensating secondary saccade has an amplitude that is the negative (i.e., oppositely directed) of the initial saccade. For better visualization, the negative values are plotted upward. The higher bars show greater correlation between the error-inducing saccade and the corrective saccade. The purple bars represent the regression slope between the initial error-inducing saccade versus all successive saccades. Again, only responses that have an initial error-inducing saccade are used to determine the regression slopes. (The bar graph shows subject numbers on the bottom which have been ordered so that the regression slope values are generally increasing.)
Responses often contain more than two saccades and it is possible that these additional saccades could also be compensating for the midline error induced by the initial saccade. The purple bars in Figure 6 show the correlation slopes when the net amplitude of all saccades following the initial error-inducing saccade is used. For most subjects, there is no increase in the regression slope, indicating that saccades that occur after the second saccade do not serve in a compensatory role. In Sub. 12, a large increase in slope value is seen, but saccadic compensation is actually reduced because the slope is now further from the ideal -1.0 value than it was before the additional saccades were included. Hence, we conclude that in all subjects that use saccades to reduce the midline error, only the second saccade is involved in compensation.
If the initial error-inducing saccade is not fully compensated by subsequent saccades, the difference must be accounted for by vergence asymmetry. Compensation through asymmetical vergence is quantified in the next section.
Figure 7 shows data from the same three subjects as Figure 5, but in this case vergence asymmetry is plotted along the vertical axis. Vergence asymmetry is taken as the difference in saccade-free left and right eye movements at the end of the response. This is also equal to the total vergence asymmetry during the response. As with Figure 5, these plots include only responses that have an initial error-inducing saccade. Since the vergence compensation is measured at the end of the response while the saccadic-induced error occurs early (sometimes even before the vergence response begins), a strong correlation suggests a causal relationship, one in which the vergence asymmetry is in response to the error saccade.
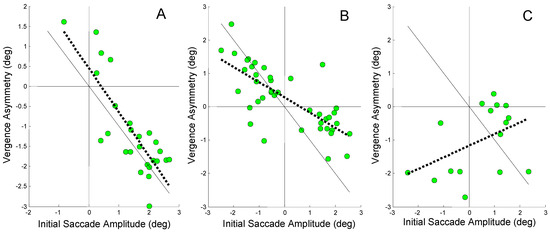
Figure 7.
Vergence asymmetry plotted against the amplitude of an initial error-inducing saccade. The regression line is plotted as a dotted black line and the ideal 1 to 1 line is plotted as a solid black line. A) A high regression slope of -1.1 is found for Sub. 3 (r2 = 0.67; p < 0.01). B) A moderate regression slope of -0.46 is found in Sub. 6 (r2 = 0.55; p < 0.01). C) The relationship between vergence asymmetry and initial saccade has a small non-significant positive slope of 0.35 in Sub. 12 (r2 = 0.19). Note the scales of the horizontal and vertical axes are different.
Error-Inducing Saccades ~ Vergence Correction
If the midline error produced by the initial saccade is compensated by asymmetrical vergence, the vergence asymmetry should have a strong negative correlation with the amplitude of the initial saccade.
In Figure 7A, a strong negative correlation is observed between vergence asymmetry and the amplitude of the initial error-inducing saccade. The regression line has a slope of -1.1 (r2 = 0.67; p < 0.01) indicating that most of the initial error is compensated by asymmetrical vergence (The fact that the slope is greater than 1.0 suggests that vergence asymmetry is compensating for asymmetries induced by later saccades as well as the initial saccade.). This complements the findings in Figure 5A that show saccades have no role in compensating for the saccade-induced midline error in this subject’s responses. In Figure 7B, the slope is reduced to -0.46, but the correlation remains significant (r2 = 0.55; p < 0.01) demonstrating that some of the error compensation comes from asymmetrical vergence. Again this complements the data in Figure 7B which shows that some saccadic compensation was also used for compensation in this subject. The positive regression slope for the Sub. 12 in Figure 7C shows that vergence asymmetry plays no role in compensating for the error induced by the initial saccade. Vergence asymmetry may even be increasing the saccade-induced error although the correlation was not significant. Figure 5C indicated that the second saccade was the primary compensatory mechanism in this subject.
The role of asymmetrical vergence can be summarized for our 12 subjects using a bar graph of regression slopes as in Figure 6. Again, negative values are plotted upward so that higher bars indicate greater compensation from vergence asymmetry. Figure 8 plots the regression slopes of the relationship between vergence asymmetry and initial saccadic amplitude (purple bars) and also repeats the slopes of the relationship between the amplitudes of the error-inducing and corrective secondary saccade (gold bars in Figure 6). Since the inverse values are plotted, a negative value means that the regression slope was actually positive; that is opposite to the slope of a compensatory mechanism. As expected, the slopes that indicate the use of asymmetrical vergence as a compensatory mechanism (purple bars) are approximately complementary to the slopes indicative of saccadic compensation.
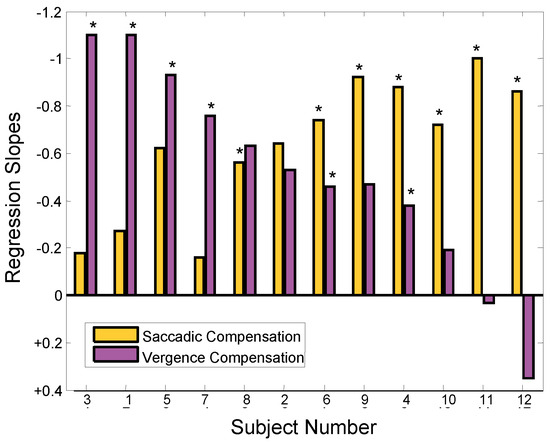
Figure 8.
Absolute value of regression line slopes of the relationship between vergence asymmetry and the amplitude of the initial error-inducing saccade (purple bars). The slopes of the relationship between the amplitude of the initial errorinducing and second saccades presented in Figure 6 is repeated here for comparison (gold bars). The ‘*’ indicates slopes that had statistically significant correlations (p < 0.01). Negative values are plotted upward as in Figure 6.
A comparison of the regression slopes in Figure 8 for saccadic and vergence correction of initial error shows a reciprocal relationship. This relationship is emphasized in the plot of saccade compensation slopes versus vergence compensation slopes shown in Figure 9. The inverse 1-to-1 line is shown as a solid black line and the correlation of these values as a dashed red line. The regression line has slope of -0.89 showing a highly correlated inverse relationship between these two corrective mechanisms (r2 = 0.61; p < 0.01). The 12 subjects have been grouped into three classes based on the dominant compensatory mechanism. The boundaries were first identified using unsupervised cluster analysis (routine “clusterdata” from the MATLAB Statistical Toolbox), but are also apparent from the data.
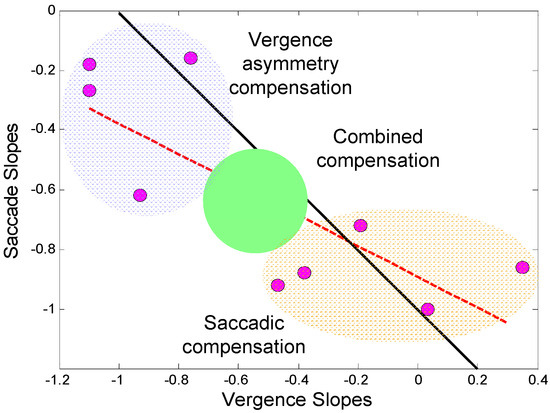
Figure 9.
Regression slopes for saccadic compensation of initial saccadic error versus the slopes for vergence compensation of this error (from the data in Figure 8). Three subject groups have been defined based on the dominant corrective mechanism(s): Vergence compensation in blue, combined vergence and saccadic compensation in green and saccadic compensation in orange. The inverse 1-to-1 line is shown as a solid black line. The regression slope of these data are plotted as a dashed red line.
Discussion
Horizontal saccades are found in almost every response to a pure vergence stimulus in our untrained subjects. While we did not measure vertical saccades, their only influence on our data would be to enhance vergence dynamics and that is not of interest in this study. Here, we concentrate on the processes that return the eyes to binocular fixation in those responses where the initial saccade produces a midline error. The three regions shown in Figure 9 were selected by cluster analysis and represent the primary mechanism for correction based on the amplitude of the corrective movement. The reason a subject selects a given strategy is not currently known. The groups do not correspond to any of the groups found in the previous study (Semmlow et al., 2008) that were based on saccadic behaviors. The type of strategy used is also not determined by properties of the vergence system such as peak velocities or response latencies. However, based on the strong negative correlation between the two compensatory processes, the role of each of the compensatory processes appears to be well-established, on average, within any given subject.
The regression slopes indicate an average behavior observed over all responses. Even in subjects that rely primarily on one mechanism, either or both mechanisms may be utilized in any given movement. In other words, for any given response, the two processes trade-off compensating each other’s errors. An example of this shown in Figure 10 which plots the relationship between the second and initial saccade amplitude, Figure 10A, and vergence asymmetry and initial saccade amplitude, Figure 10B, for Sub. 10. This subject relies heavily on saccadic compensation as seen in Figure 10A (regression slope = -0.72); however, in the two specific responses plotted as yellow diamonds, the saccadic compensation is unusually weak. Figure 10B shows that in these two particular responses (also plotted as yellow diamonds), the vergence asymmetry is much larger than normal for this subject and it is vergence compensation that is primarily responsible for correcting the initial error in these responses.
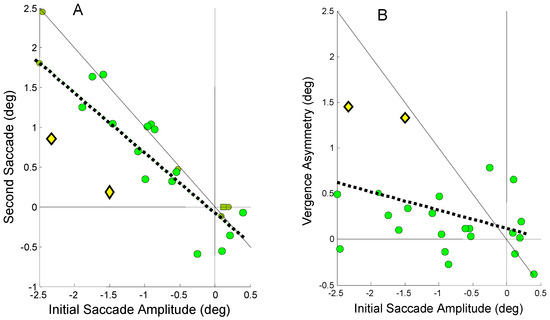
Figure 10.
A) Second saccade amplitude as a function of the initial error-inducing saccade amplitude for Sub. 10. This subject relies heavily on saccadic compensation (regression slope = -0.72; r2 = 0.78; p < 0.01). Two responses (yellow diamonds) are highlighted where the saccadic compensations are well below that necessary for accurate binocular fixation (the negative 1 to 1 line). B) The plot of vergence asymmetry versus initial saccadic amplitude shows a much larger than normal vergence asymmetry is used to provide the necessary compensation in these two responses.
Despite this variability, the eyes always arrive at the correct final position using saccadic and/or vergence compensation. Since there are two potential compensatory mechanisms, some process must exist to achieve balance between the two processes.
Krommenhoek and Van Gisbergen (1994) have shown that both saccades and vergence components use internal (i.e., extra-retinal) feedback loops in their control. These internal feedback mechanisms may provide a possible mechanism for balancing between the two compensatory processes. Considering the accuracy of binocular fixation, a visually driven feedback path is probably involved in compensating for any residual binocular error. The factors that determine the dominant compensatory strategy and the mechanism that ultimately attains the highly accurate binocular fixation are the two most important questions to emerge from this work.
We have been referring to all slow version movements as vergence asymmetry primarily as a matter of verbal convenience. It is likely that early slow midline deviations are attributable to vergence asymmetry as the two eye movements rarely show identical vergence dynamics (Horng et al., 1998). If one eye is faster, or has a shorter latency, the inequality will create a deviation from the midline. However, toward the end of the movement when dynamic vergence has decayed is it possible that the vergence asymmetry is due to some type of slow conjunctive movement: either smooth pursuit or another unknown slow corrective process? Recent evidence regarding the premotor organization cited above indicates that both vergence and saccades, including slow vergence are driven by neurons preferential to a specific eye. This suggests that the observed vergence asymmetry is due to monocular control components that drive the two eyes asymmetrically to achieve the final required binocular fixation. An intriguing final question is whether or not these motor signals are the result of monocular or binocular stimulus signals.
Acknowledgments
Yung-Fu Chen was supported, in part, by a grant CMU96-145 from China Medical University, Taichung, Taiwan. John Semmlow and Tara Alvarez were supported, in part, by a Grant from Essilor International, St. Maur, France and an NSF CAREER award BES-0447713. The manuscript was also strengthened considerably by an extensive critique from an anonymous reviewer.
References
- Alvarez, T. L., M. Bhavsar, J. L. Semmlow, M. T. Bergen, and C. Pedrono. 2005. Short-term predictive changes in the dynamics of disparity vergence eye movements. J Vis. 31: 640–649. [Google Scholar] [CrossRef] [PubMed]
- Bahill, A. T., and L. Stark. 1979. The trajectories of saccadic eye movements. Sci Am 240: 108–117. [Google Scholar] [CrossRef] [PubMed]
- Collewijn, H., C. J. Erkelens, and R. Steinman. 1988. Binocular co-ordination of human horizontal saccadic eye movements. J Physiol. 404: 157–182. [Google Scholar] [CrossRef] [PubMed]
- Collewijn, H., C. J. Erkelens, and R. Steinman. 1995. Voluntary binocular gaze-shifts in the plane of regard: dynamics of version and vergence. Vision Res. 35: 3335–3358. [Google Scholar] [CrossRef] [PubMed]
- Collewijn, H., C. J. Erkelens, and R. Steinman. 1997. Trajectories of the human binocular fixation point during conjugate and non-conjugate gaze-shifts. Voluntary binocular gaze-shifts in the plane of regard: dynamics of version and vergence. Vision Res. 37: 1049–1069. [Google Scholar] [CrossRef] [PubMed][Green Version]
- Coubard, O. A., and Z. Kapoula. 2008. Saccades during symmetrical vergence. Graefes Arch Clin Exp Ophthalmol 246: 521–536. [Google Scholar] [CrossRef]
- Horng, J.-L., J. L. Semmlow, G. K. Hung, and K. J. Ciuffreda. 1998. Dynamic Asymmetries in Disparity Vergence. Vision Res. 38: 1254–1261. [Google Scholar] [CrossRef]
- King, W. M., and W. Zhou. 2002. Neural basis of disjunctive eye movements. Ann NY Acad Sci 956: 283–293. [Google Scholar] [CrossRef]
- Krommenhoek, K. P., and J. A. M. Van Gisbergen. 1994. Evidence for nonretinal feedback in combined version-vergence eye movements. Exp Brain Res. 102: 95–109. [Google Scholar] [CrossRef] [PubMed]
- Kumar, N. A., Y. H. Han, R. F. Kirsch, L. F. Dell’Osso, M. W. King, and J. R. Leigh. 2006. Test of models for saccadevergence interaction using novel stimulus conditions. Biol Cyber 95: 143–157. [Google Scholar]
- Levi, L., D. S. Zee, and T. C. Hain. 1987. Disjunctive and disconjugate saccades during symmetrical vergence. Invest Ophthalmol Visual Sci 28: 332. [Google Scholar]
- Maxwell, J. S., and W. M. King. 1992. Dynamics and efficacy of saccade-facilitated vergence eye movements in monkeys. J. Neurophysiol. 68: 12481259. [Google Scholar]
- Ogle, K. N. 1954. Fixation disparity. Am Orthopt J. 4: 3539. [Google Scholar] [CrossRef]
- Semmlow, J. S., Y.-F. Chen, C. Pedrono, and T. Alvarez. 2008. Saccadic behavior during the response to pure disparity vergence stimuli I: General Properties. J. Eye Movement Res. 1, 2. [Google Scholar]
- Van Horn, M. R., and K. E. Cullen. 2008. Dynamic coding of vertical facilitated vergence by premotor saccadic burst neurons. J. Neurophysiol 100: 1967–1982. [Google Scholar] [PubMed]
- Van Horn, M. R., P. A. Sylvestre, and K. E. Cullen. 2008. The brain stem saccadic burst generator encodes gaze in three-dimensional space. J Neurophysiol 99: 26022616. [Google Scholar] [CrossRef][Green Version]
- Van Leeuwen, A. F., H. Collewijn, and C. J. Erkelens. 1998. Dynamics of horizontal vergence movements: interaction with horizontal and vertical saccades and relation with monocular preferences. Vision Res. 38, 24: 3943–3954. [Google Scholar] [CrossRef] [PubMed][Green Version]
- Waitzman, D. M., M. R. Van Horn, and K. E. Cullen. 2008. Neuronal evidence for individual eye control in the primate cMRF. Prog Brain Res. 171: 143–50. [Google Scholar] [PubMed]
- Zee, D. S., E. J. Fitzgibbon, and L. M. Optican. 1992. Saccadevergence interactions in humans. J. Neurophysiol 68: 1624–1641. [Google Scholar] [PubMed]


Copyright © 2008. This article is licensed under a Creative Commons Attribution 4.0 International License.