Introduction
Arthur Sulzberger jr., editor of the «New York Times», recently said (February, 2007) “I really don’t know whether we’ll be printing the Times in five years”. A continuously growing up of online newspapers bring together an increasing interest to improve the usability of their websites, and by consequence their achievement among readers. In fact, there are many unanswered questions such as the best choice for the home page layout, the placement of navigation tools, the style and the format of headlines within the home page and the design of the article pages. The style of writing should probably be adapted to online reading to improve usability. Advertising in terms of size, position, animation is also very important since it represents a critical source of profits.
In this framework some aspects of subjects’ behaviour during reading online newspapers play a crucial role and are worth investigating. Which part of the page first draws subjects’ attention? Are the ads observed or ignored? Does the subject actually read the text or just scan a few words? Are the navigation tools sufficiently meaningful? Are the services provided within the news website easily reachable by the reader?
All these questions can be answered by measuring subjects’ eye movement during reading online newspapers and by computing quantitative parameters from the recorded signals such as: gaze duration, number of fixations, fixations duration, sequence of accesses among different regions of the page.
Reading a printed newspaper is an everyday experience: the newspaper is normally skimmed through page by page. The reader knows where the pages about politics, economy, domestic news, and so on, are positioned and moves back and forth among pages. Online newspapers are in fact websites, that means a collection of many web pages organised as a multi-level hierarchical structure that is radically different from the serial sequence of printed pages. Moreover in these websites not only news are provided, but also many services, some free and some paid-for.
In a printed newspaper the reader always knows exactly where he/she is situated within the newspaper by just having a look at the page number. In the news website instead navigation needs to be assisted by specific tools and the hierarchical structure of the website should be made available to the reader. The reader has to reconstruct in his/her mind a conceptual model in order to easily find what is looking for.
In the last 10-15 years eye movements analysis has became more and more diffused in the field of humancomputer interaction and usability research (see
Jacob & Karn, 2003 for a review). Eye tracking analysis has been applied to study web usability (
Goldberg & Kotval, 1999; Cowen, Ball, & Delin, 2002; Goldberg, Stimson, Lewenstein, Scott, & Wichansky, 2002;
Goldberg & Wichansky, 2003; Pan, Hembrooke, Gay, Granka, Feuser, & Newman, 2004;
Russel, 2005;
Bojko, 2006; Nakamichi, Shima, Sakai, & Matsumoto, 2006;
Shrestha & Lenz, 2007;
Shrestha & Owens, 2008) and to evaluate e-learning systems (
Zambarbieri, 2003; Zambarbieri, Robino, Crespi, & Calvi, 2006).
Within the Internet world online newspaper represents a very specific kind of website. Its first objective is that of providing news, but many other elements are present as well, such as ads and services to the reader: Weather information, stock exchange, archives of news, just to mention only the most frequent. Online newspapers actually represent a segment of the web that is increasing considerably in the recent years and a more systematic use of eye tracking methodology to understand how the readers actually interact with the news websites can represent a powerful tool for evaluation and enhancement.
A few studies have been published in the recent years that make use of eye movement to analyse and compare subjects’ behaviour during reading printed and online newspapers (Holmqvist, Holsanova, Barthelson, & Lundqvist, 2003; Holsanova, Rahm, & Holmqvist, 2006; Bucher, Schumacher, & Duckwitz, 2007; Quinn, Stark, & Edmonds, 2007).
Within this large field of research, the study described in this paper represent the first study conducted in Italy. The style of newspapers and also the habit of readers can vary significantly among countries and languages. Two Italian newspaper websites are considered and the analysis is focused on the exploration behaviour within the newspaper home page and on the reading of article pages.
Methods
Eye movement recording
Eye movements were recorded by using the EyeGaze (LC Technologies, Inc.
http://www.eyegaze.com) system, a videooculographic device that consists of a videocamera mounted below the computer display. A small, low power, infrared light emitting diode (LED) located at the centre of the camera lens illuminates the eye. The LED generates the corneal reflection and causes the bright pupil effect which enhances the camera’s image of the pupil. Specialized image-processing software identifies and locates the centres of both the pupil and the corneal reflection and projects gaze position within the video image. The EyeGaze system generates raw gazepoint location data at the camera field rate of 60 Hz.
During the experiments subjects were comfortably seated at the desk, at a distance of 60 cm from a 17” computer display (1024*768 pixels resolution). A chin rest was provided to help the subjects to avoid head displacements outside the tolerance range of the system. Subjects were instructed according to the specific experimental tasks and each session started with the eye movement calibration procedure.
The NYAN (Interactive Minds Dresden
http://www.interactive-minds.com) software has been used for data acquisition and data analysis. During acquisition eye and mouse movements were recorded together with the video recording of the screen, that allows to take into account any scrolling within the page.
Experimental protocol
The Italian newspapers Corriere della Sera (
www.corriere.it) and La Stampa (
www.lastampa.it) have been considered and will be referred to in the following paragraphs as Case Study 1 (CS1) and Case Study 2 (CS2), respectively.
14 subjects have been examined. Subjects have been selected from a questionnaire concerning their computer expertise. To the purpouse of the study, the selected subjects were experienced web users and familiar with both newspapers considered in the study, but not regular online newspaper readers on a daily basis.
During the experiments the home page and a story page were presented for each Case Study. The sequence of Case Study presentation was randomized among subjects to avoid any biasing effect. The story pages have been selected in advance in order to have the same text read by all subjects. The length of the text of the stories selected for the experiments fit the length of the screen and no scrolling is needed. Home page navigation was made online from the updated version currently in the web at the time of the experiment.
Three minutes were left for home page navigation whereas story reading ended only at subjects’ request. Then the experiment proceeded by presenting the home page and the story page of the other Case Study. After each home page navigation subjects were given a questionnaire to determine their recall of the contents displayed on the page.
Data analysis
The first step in data analysis is the identification of saccades and fixations within the recorded eye movements. The algorithm used to identify fixations is based on a gaze deviation threshold (in pixel) and a fixation duration threshold (in sample).
Then Areas of Interest (AOI) are identified within each page. AOIs are defined within a capture of the entire page allowing to analyse data independently from any scrolling the subject performs up and down. Scrolling is taken into account by the NYAN software that guarantees, at any time of the recorded session, a precise correspondence between gaze position on the screen and gaze position within the entire web page. The metrics computed for each AOI are:
- ▪
time to first fixation (start time of the first fixation in the AOI);
- ▪
number of fixations;
- ▪
total gaze duration (sum of all fixations durations in the AOI);
- ▪
mean fixation duration.
These parameters are computed in total from the entire experimental session and separately for the first, second, third and fourth pass within each AOI. A pass is defined by the time a fixation enters an AOI until a consecutive fixation is outside the AOI.
Data from fixations and saccades can be exported from the NYAN software in many different format. This allows further analyses purposely implemented to answer the particular requests of the experimental design.
Home page AOIs
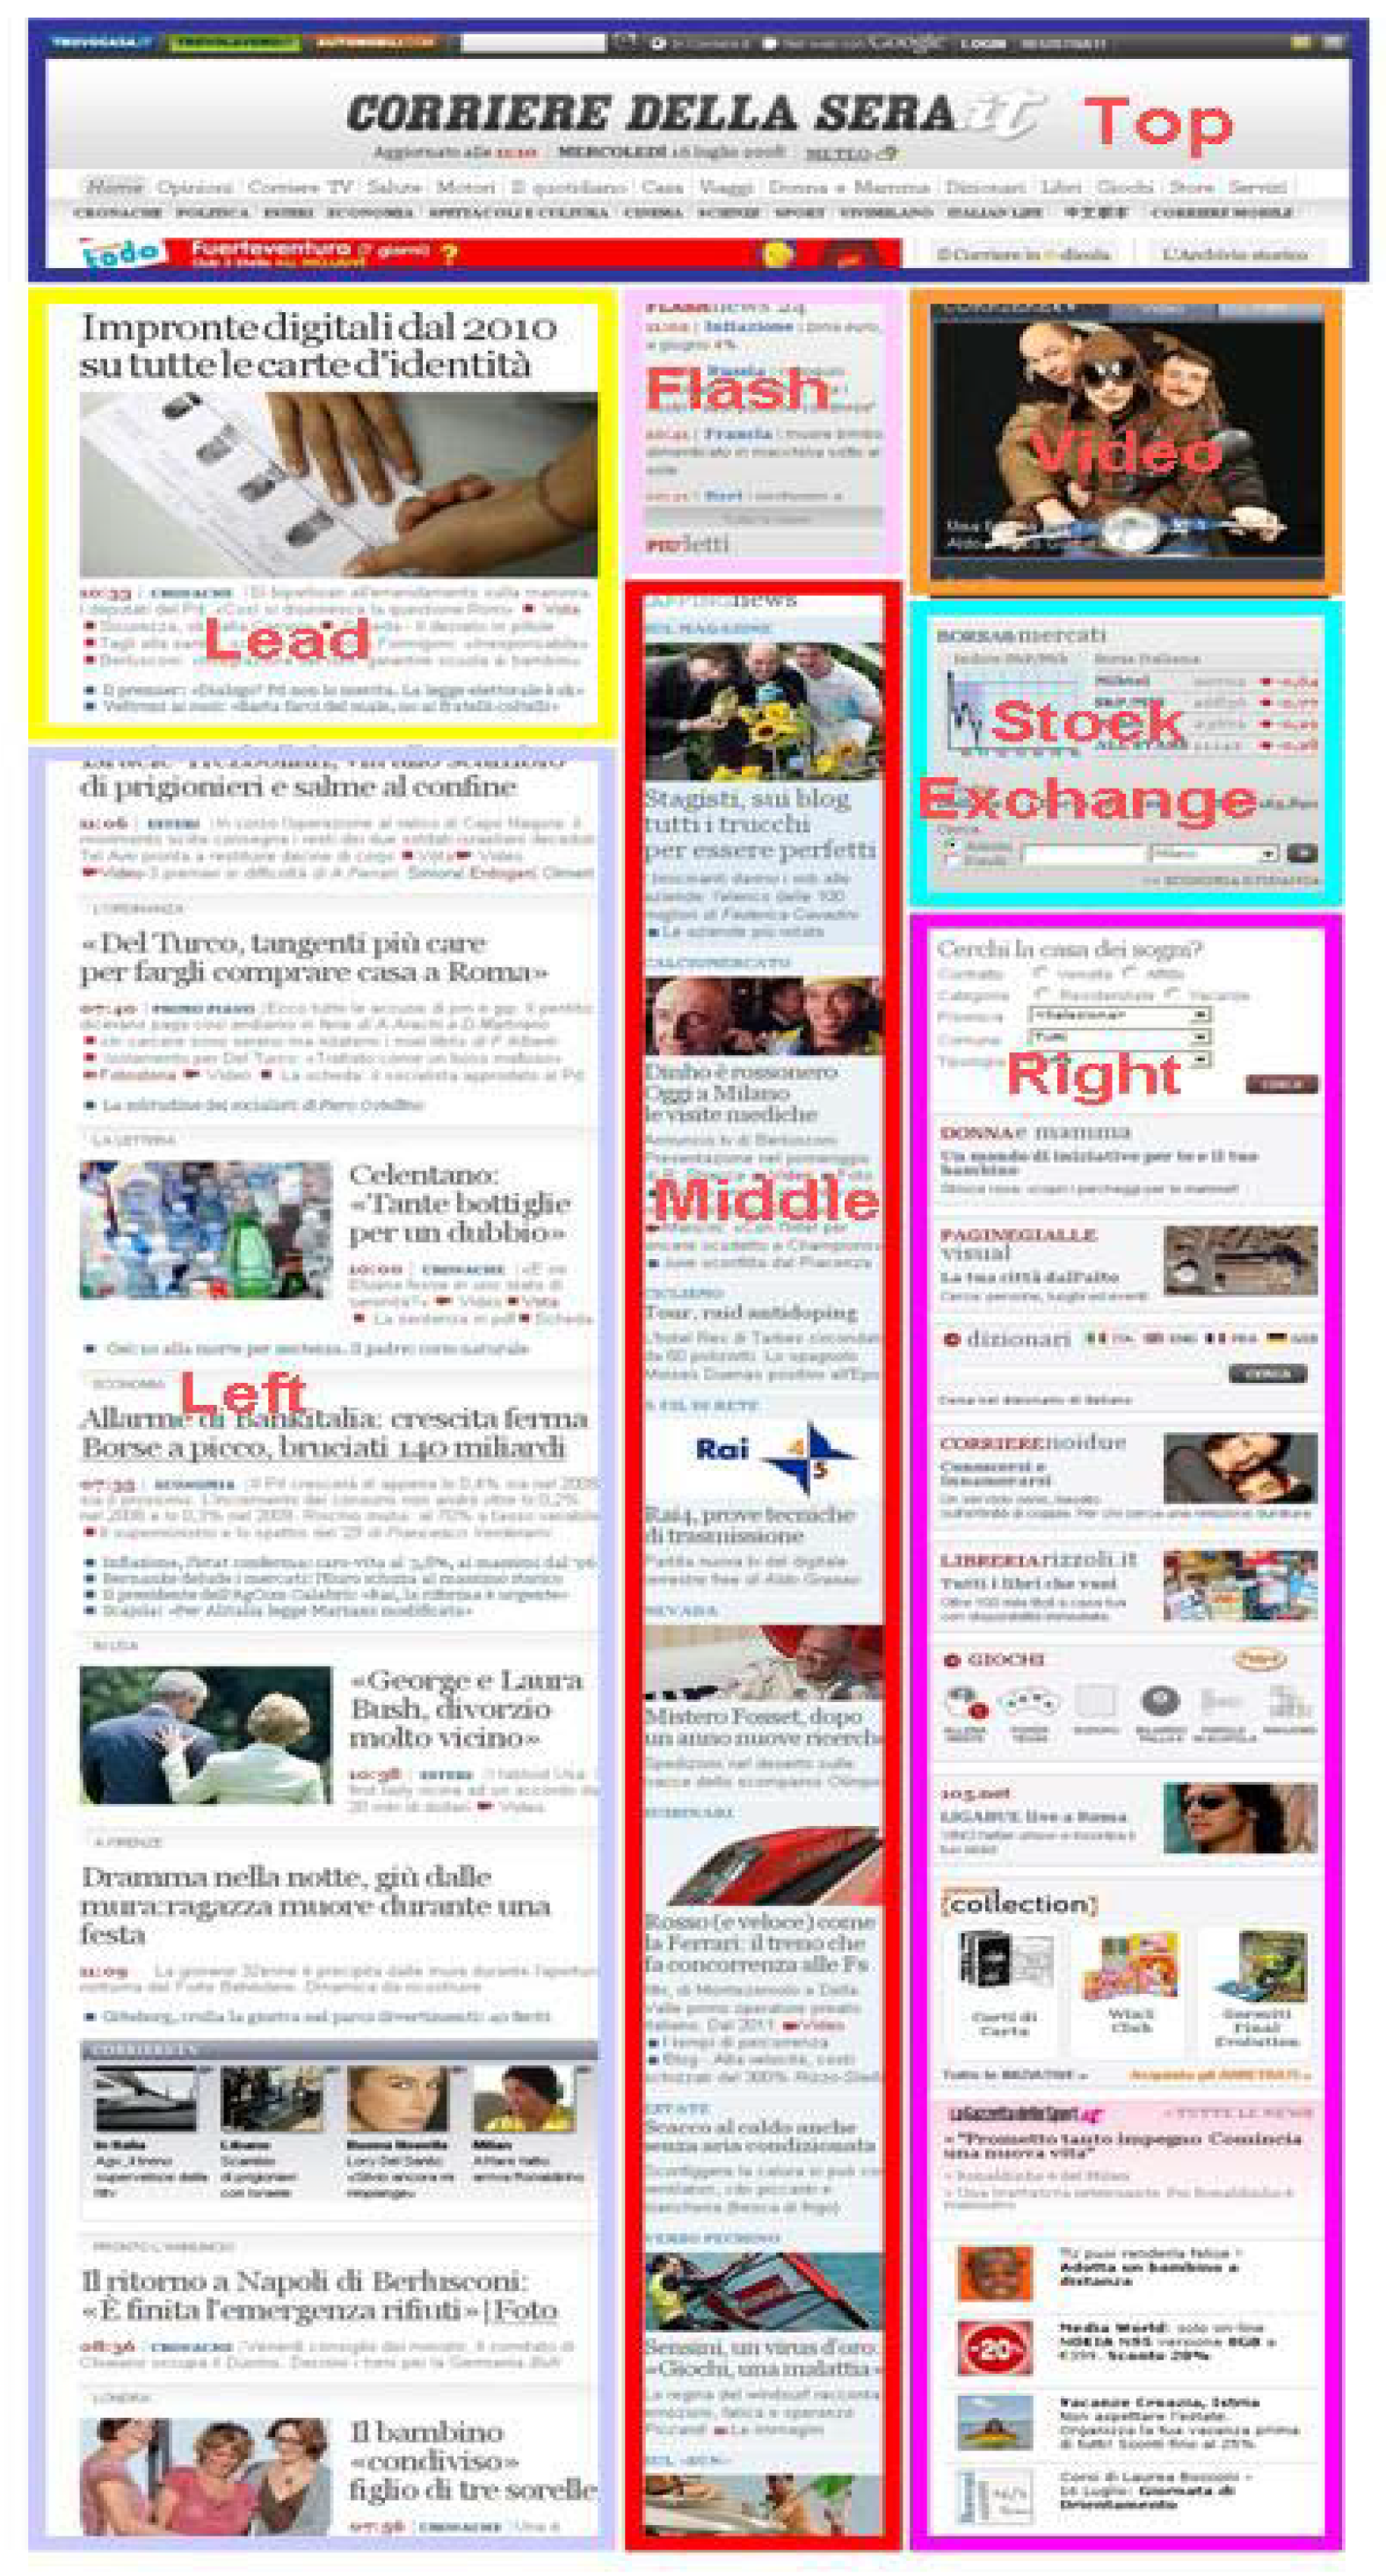
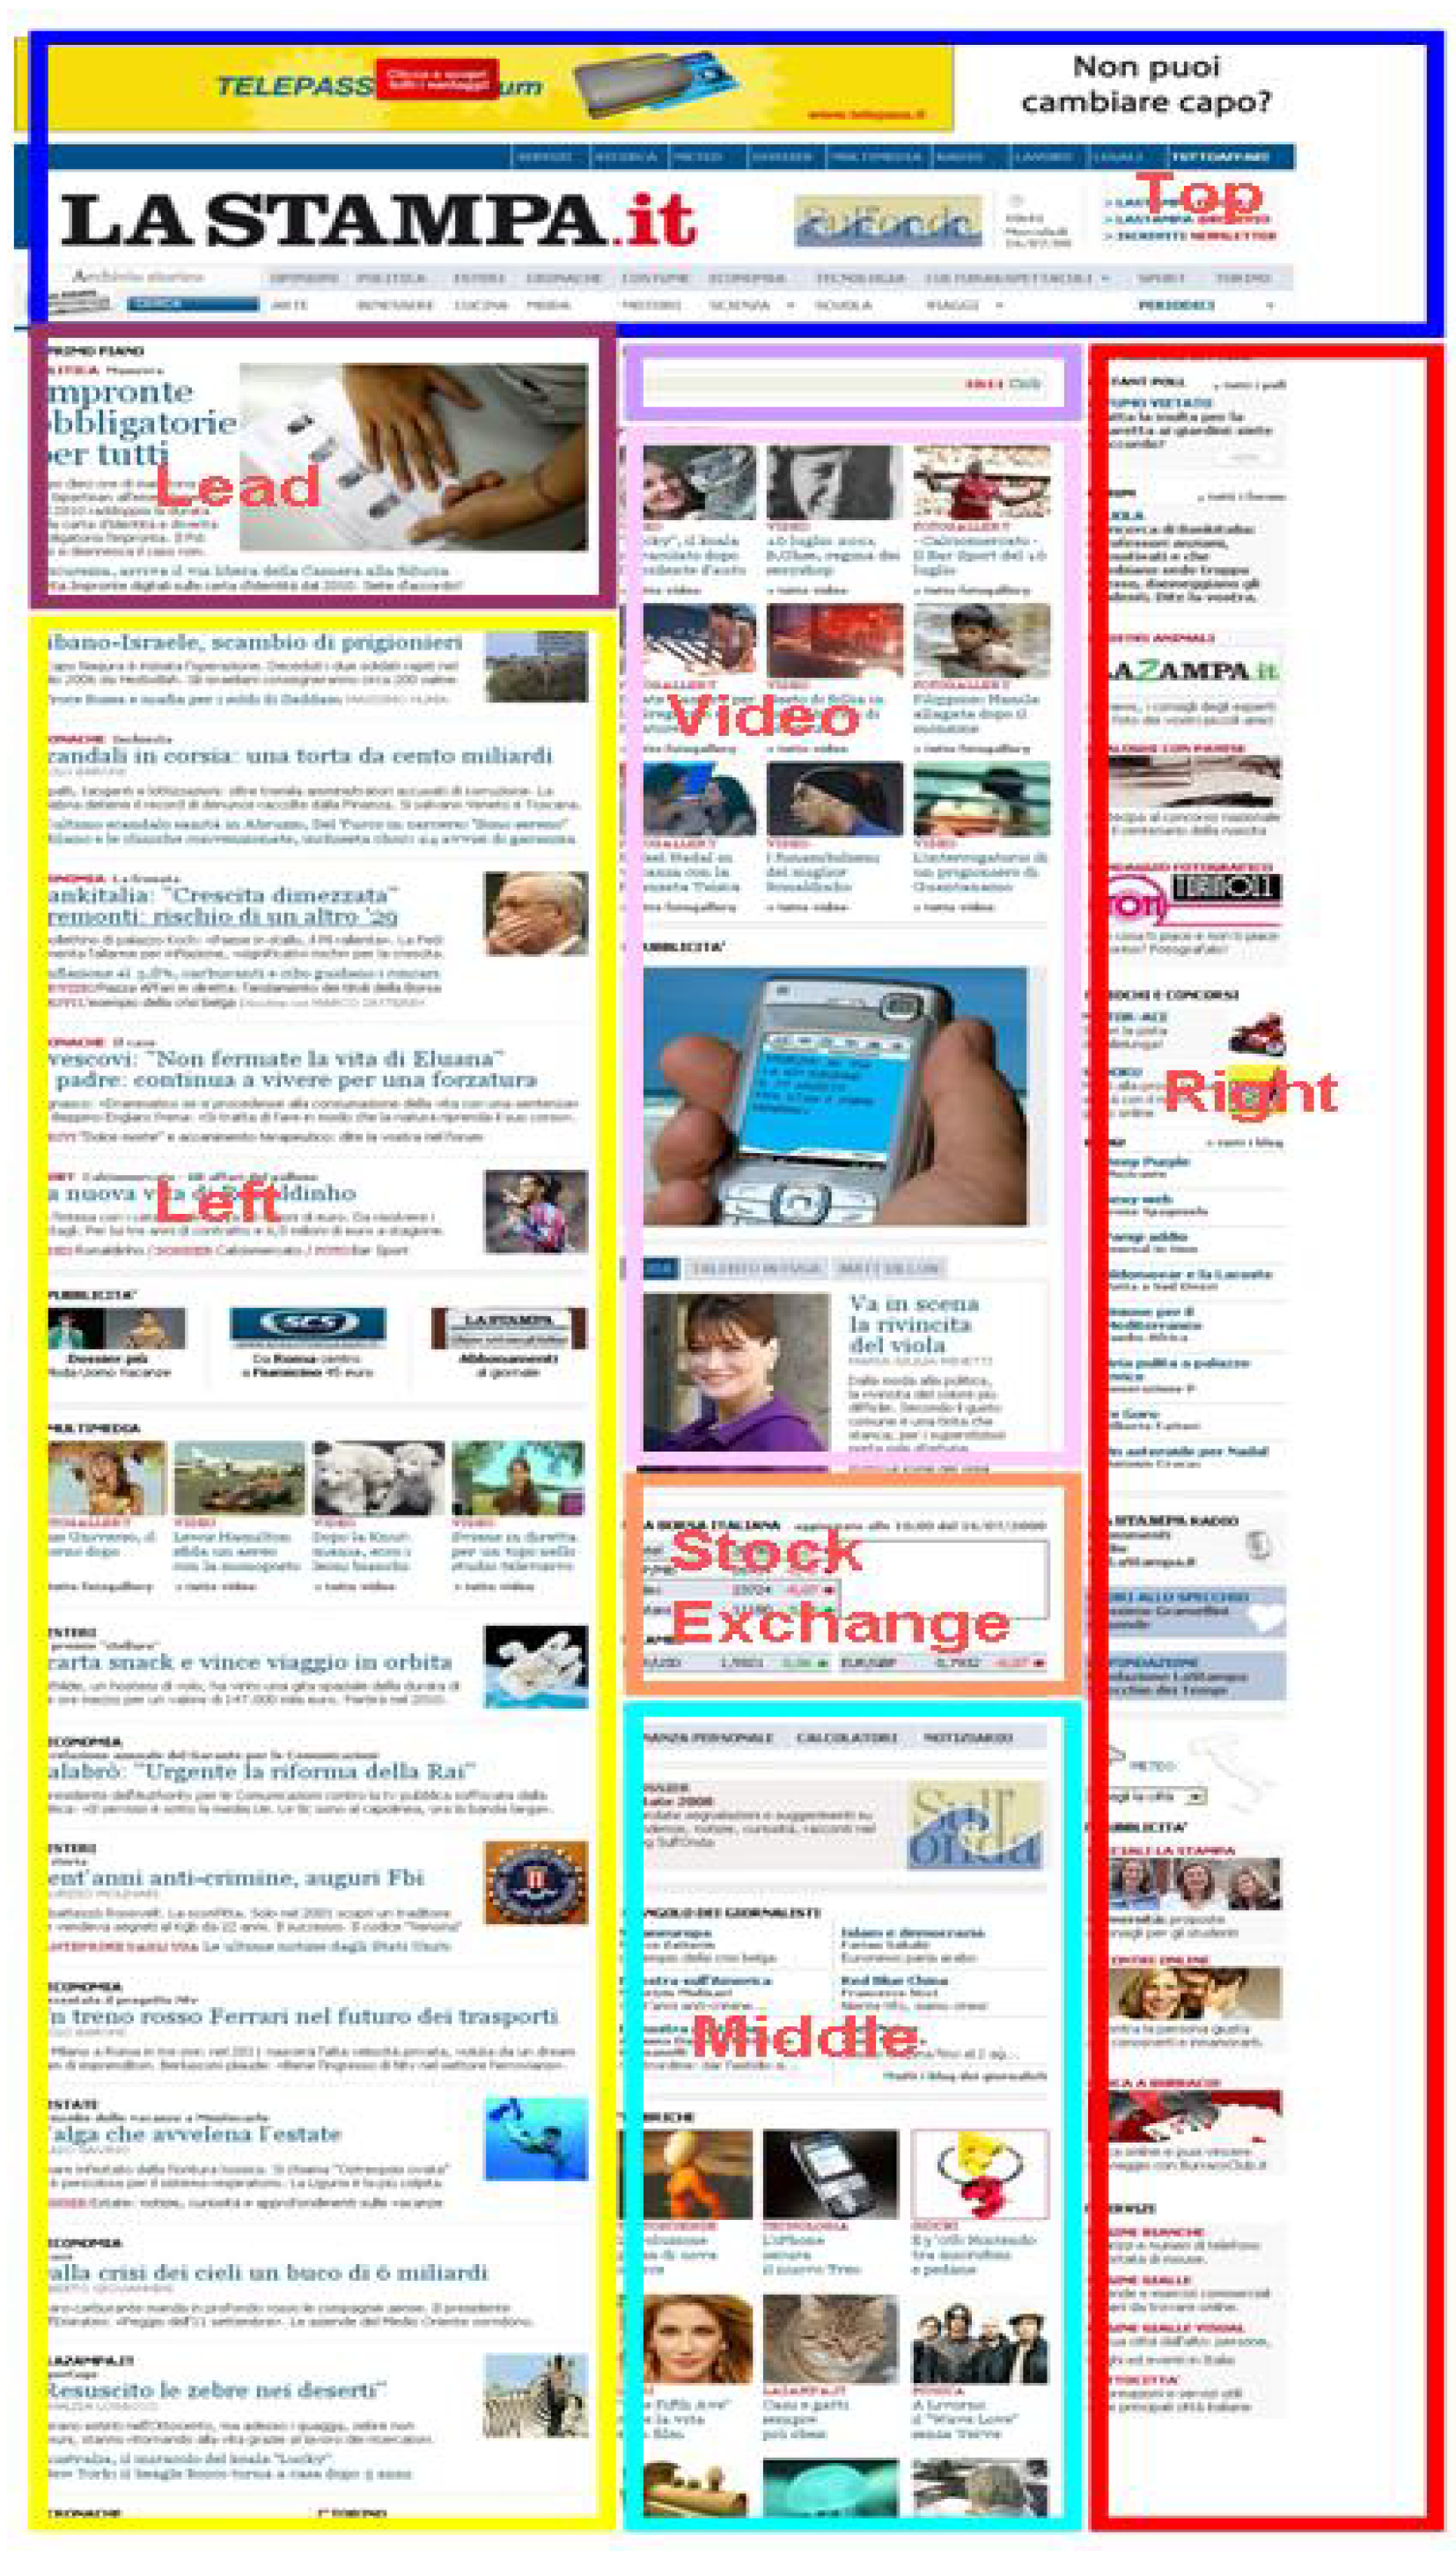
In the home page of an online newspaper the upper part generally contains the logo of the newspaper, navigation bars, small size ads.
Below this area the page is structured into columns that often are emphasized by grid lines. A column can be either homogeneous in terms of contents or made of different kinds of elements.
The home pages of the examined newspapers are made of three columns. The Areas of Interest identified for the analysis are shown in
Figure 1 and
Figure 2:
Top area
Lead story
Left Column Brief stories
Central Column Brief stories
Flash news
Video
Stock Exchange Service
Right Column
Lead story is the most important news of the day and it is always located in the upper part of the left column.
The right column in both home pages contains many elements: small ads, links to internal sections, clickable list, and others, but for the aim of the present study the area has been considered as a whole.
Story Page AOIs
The story page selected from CS1 and CS2 are shown in
Figure 3 and
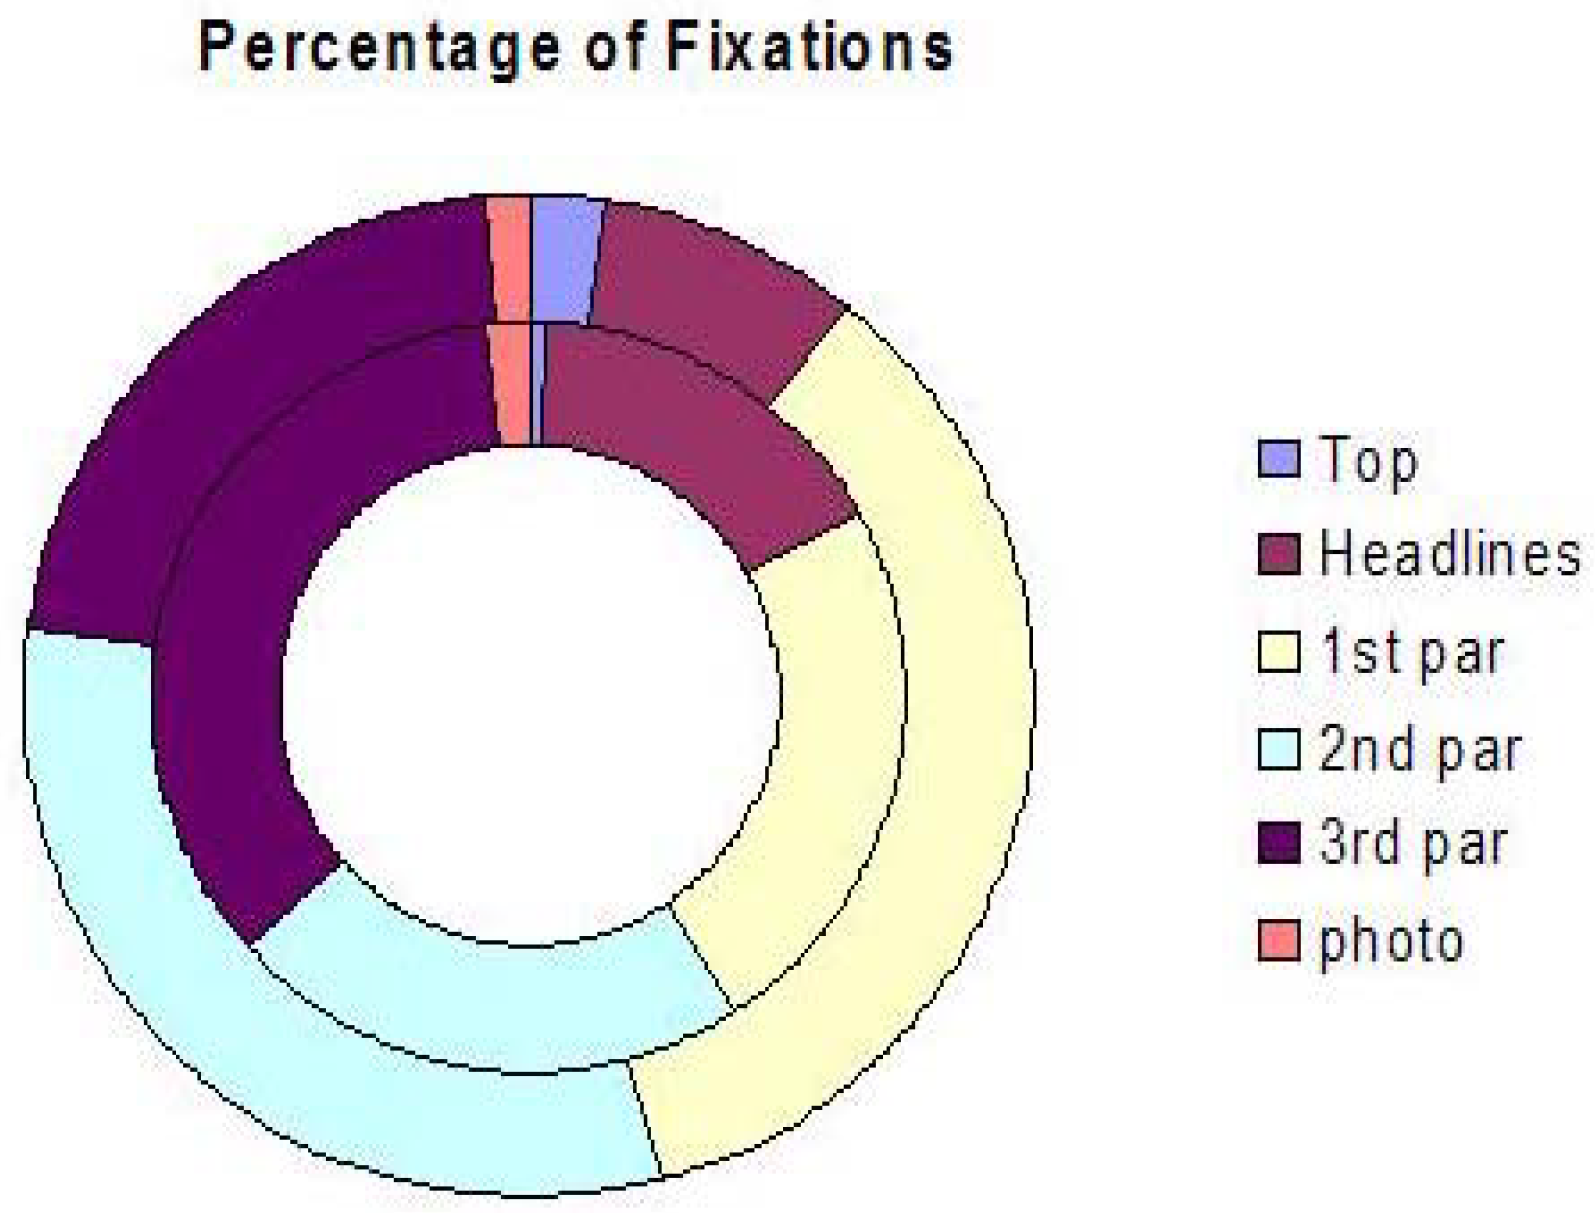
Figure 4, respectively. The two pages are very similar for what concerns the text of the story: Headlines and three paragraphs. The only difference is represented by the position of the photo. The AOIs defined within the story page are:
Top area
Headlines
First paragraph
Second paragraph
Third paragraph
Right column
The right column contains only story lists in CS1 and also ads and small photos in CS2.
Results
Home page navigation
86% of the subjects access CS1 home page from the top area and makes a few fixations in this area before moving to the lead story. The remaining 14% of the subjects access directly to the lead story. In CS2 the percentage of first fixation is shared between the top (57%) and the lead story (36%). Only in one case out of the total 28 recordings of home page exploration the first fixation was found outside these two areas.
Following the first fixations within the top area, subjects begin to read the lead story and the brief stories in the left and the central column scanning from top to bottom by scrolling along the entire home page. Once reached the lower part they go back scrolling up the page.
The sequence of accesses among AOIs can be quantified from fixations starting time, but the dynamical aspect of exploration that includes the scrolling up and down can be easily appreciated only by visual inspection of video showing the recorded eye movements superposed on the screen. In general all the examined subjects focus their attention in the left part of the screen where news can be read. Fixations to the right column are more similar to quick glances, that means sporadic and brief fixations. Most of the fixations to the right column are made later during exploration when the reader starts to move back to the top of the page.
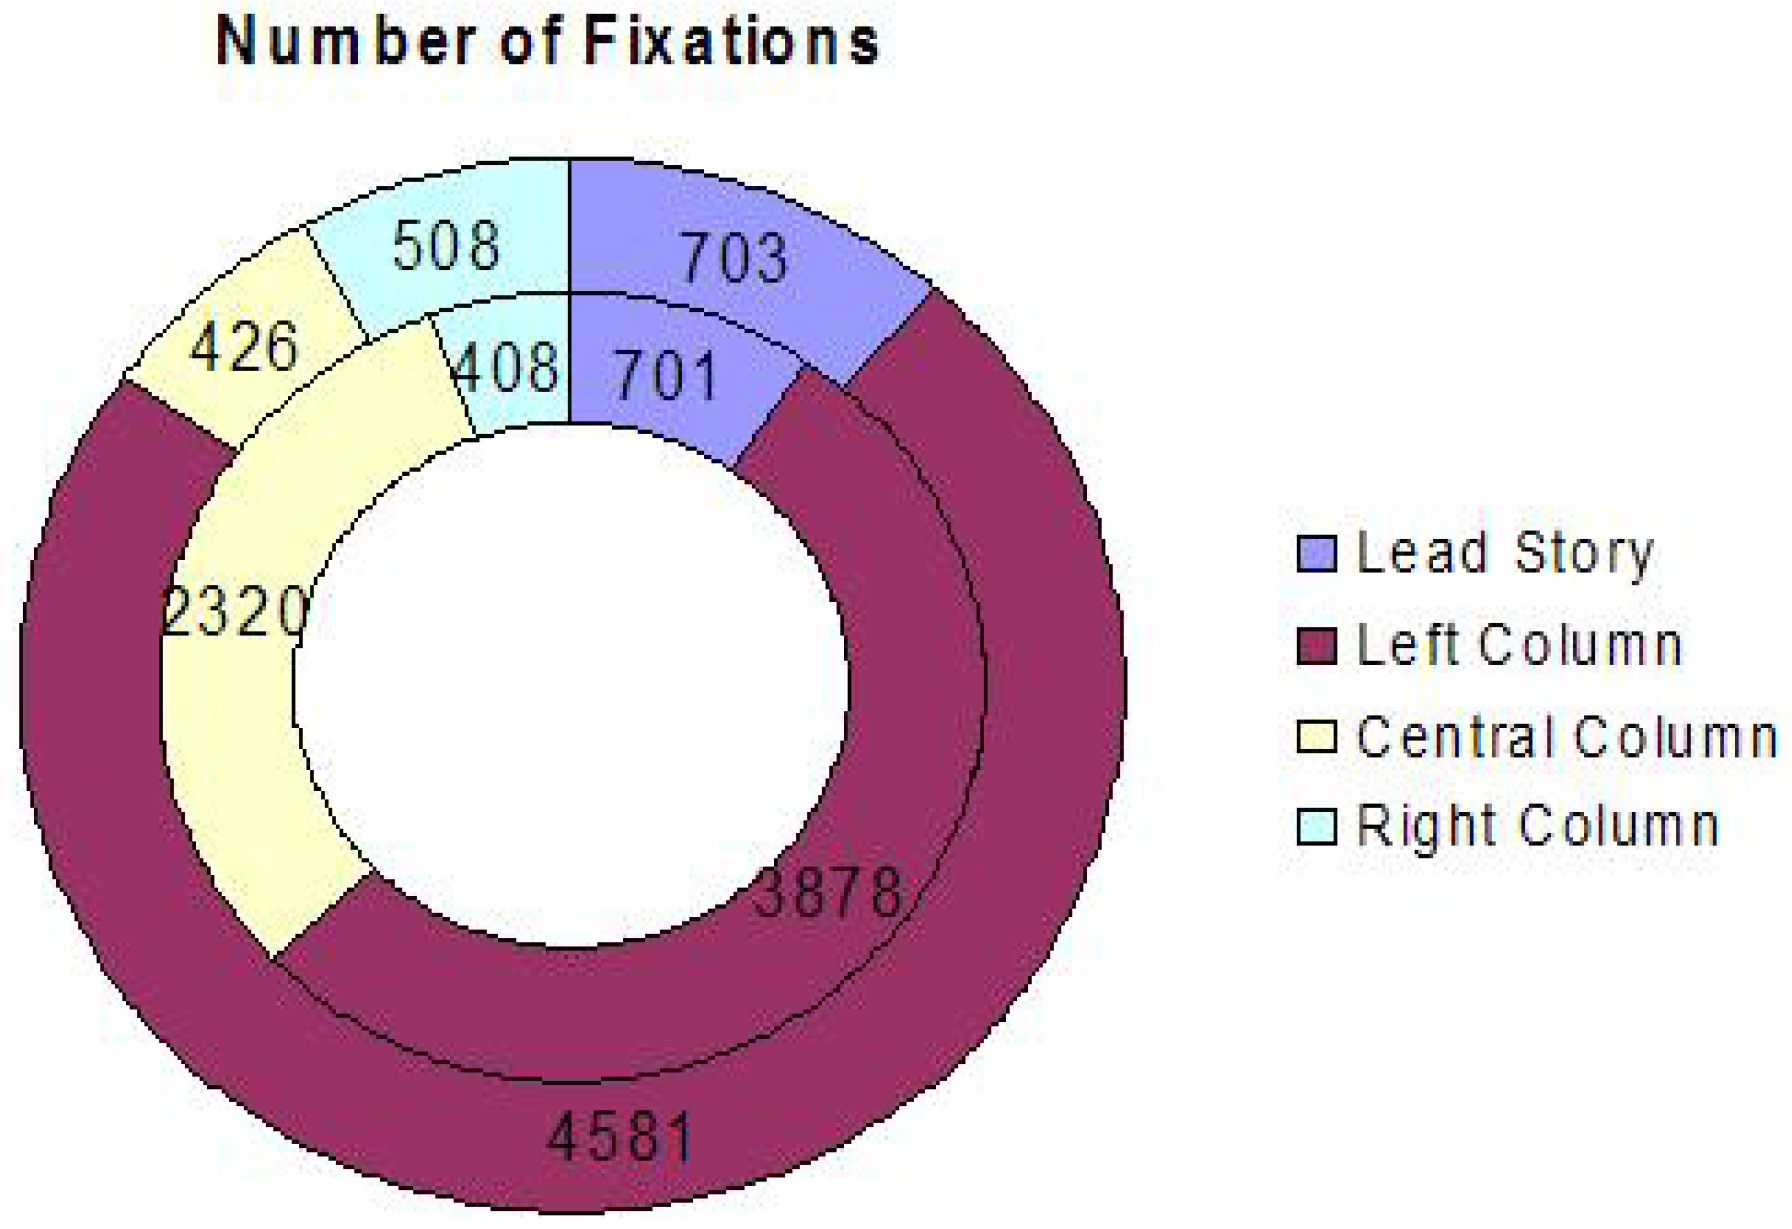
In the time allowed for home page exploration, subjects make about 8.000 fixations for each Case Study (subject’s mean fixations number is 578 ± 76 in CS1 and 548 ± 94 in CS2). How are the total of fixation distributed among AOIs?
The number of fixations within Lead Story, Left Column, Central Column and Right Column areas is represented in
Figure 5 as a ring diagram. Lead Story receives 9% of fixations in both CS.
Left Column Brief Stories have comparable width in both newspapers. Central Column Brief Stories instead are different in size, but in total the amount of fixations in the two columns is perfectly comparable.
Right Column instead seems to be less interesting for the reader that in both Case Study makes a small number of fixations. Actually, this AOI does not contain news but many different elements such as small ads, links to internal sections of the website, clickable lists.
Data from the questionnaire delivered to the subjects at the end of the experiments to determine their recall of the contents displayed on the page show a significant percentage of correct responses. For both Case Study 70% of the answers is correct, 15% is missing, and only 15% is wrong.
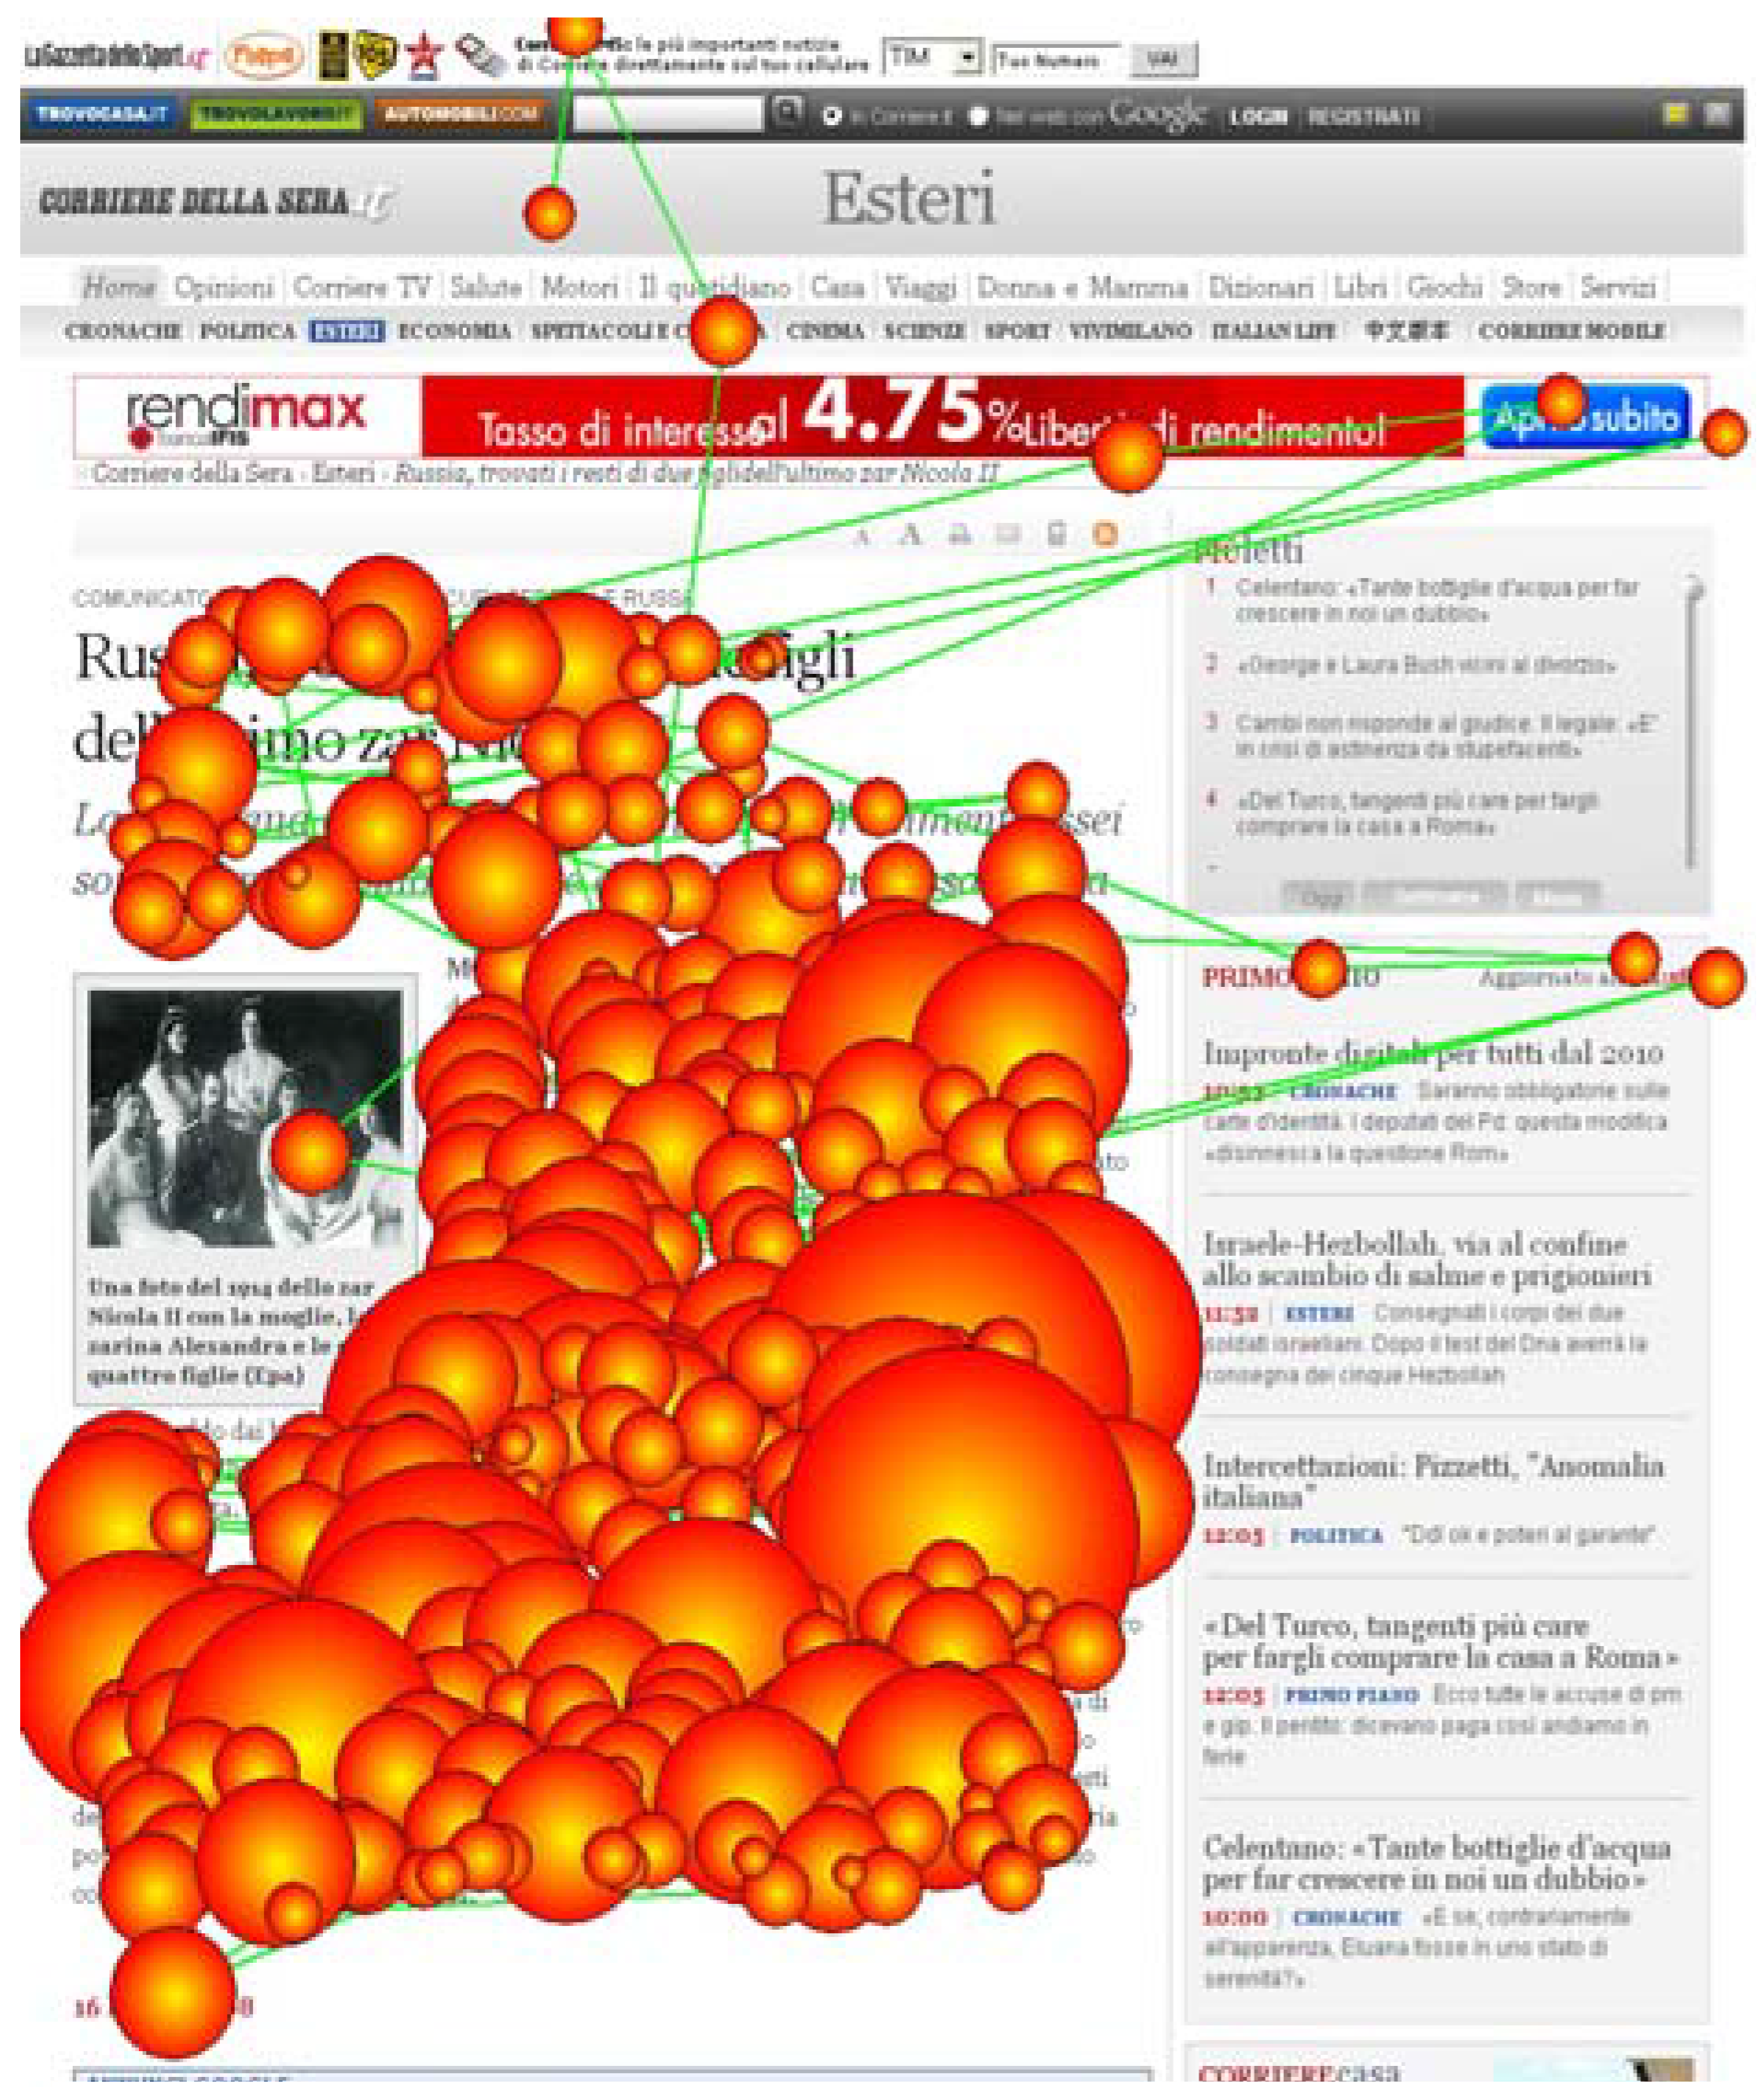
Reading story page
The top area was fixated first by 93% of subjects in CS1 and 71% in CS2. Then the reading of each paragraph proceeds regularly in the normal sequence as the subjects were reading a book page. All subjects read the story till the last line of text, and make few fixations to the other areas of the page. A typical behaviour is represented in
Figure 6. Each fixation is represented by a circle with a radius proportional to its duration. Lines connecting successive fixations represent saccades.
In spite of the different content of the two stories examined, 92% of fixations are on the text. The mean fixation duration was found to be 267 msec for CS1 and 269 msec for CS2. The diagram in
Figure 7 illustrated how the total number of fixations is distributed among AOIs. The photo within the text receives few fixations in both pages (85 in CS1 and 55 in CS2) independently from the different position with respect to the text. At the end of the experiments, all subjects were able to correctly summarize the content of the story.
Discussion and Conclusion
Reading online newspaper means moving among many elements (headlines, stories, ads, teasers, videos, photos, graphics) and navigating within a multi-level hierarchical structure. Understanding what the reader actually reads or just looks at is one of the crucial point in developing news websites.
It can be found in the literature a few studies that make use of the eye tracking methodology to study subject behaviour during reading both printed and online version of newspapers. A recent study by Bucher, Schumacher & Duckwitz (2007) investigates reading printed newspapers with different format: broadsheet and compact. Many questions are addressed by this study such as how attention is distributed among pages and how it is correlated with the paper size.
The Poynter Institute for Media Studies (
http://www.poynter.org/) is using eye tracking methodology since 1990 by considering and comparing printed and online newspapers. The questions addressed by Poynter’s studies were mainly oriented to find practical applications for editors and designers; the information provided by eye tracking studies can help editors and managers in making crucial decision about how to attract, engage and inform readers. Their more recent study, Poynter’s EyeTrack07 Project, has compared reading behaviour of printed, both tabloid and broadsheet newspapers, and online newspapers in USA (Quinn, Stark, & Edmonds, 2007).
The study described in the present paper considers online newspapers only, focusing the attention on two aspects of readers’ behaviour: navigation within the home page to quickly collect the most updated pieces of news and reading of a story within an internal section.
The home page of a newspaper is crowded by different kinds of information. Not only the lead story and tens of brief stories, but also ads banners, links to internal section of the site, photos and videos. How a reader explores the home page? It has been found from the experimental results that the entry point is in the top area or on the lead story and this is not surprising according to the many results in the field of web analysis.
Once the reader has accessed the home page he/she starts the exploration almost methodically from left to right and from top to bottom. Home page is very long and requires a lot of scrolling, and the reader actually scrolls down and then back again to the top of the page. The high percentage of correct answers to the questionnaire indicate that the subjects during the exploration of the home page receive enough information to recall what he/she has read. In the short time allowed for home page exploration the reader receives an overview of what is going on, in the country and in the world, in that precise moment (online newspapers are normally refreshed any 45-60 minutes). This is probably the most important feature of online newspapers that can be quickly read many times during the day. What happens when readers enter an article page? The results described in the paper indicate that in the article page all subjects read carefully the entire text, in spite of the presence of other elements. The right column of the page in fact receives few fixations and therefore little attention.
In conclusion, the methodology based on eye tracking analysis has been widely proved to be a reliable tool for evaluating web and e-learning usability. The same methodology can be successfully applied within the domain of online newspapers to evaluate their usability and readability. The impact of this specific application of information technology is growing as the number of online readers is always increasing, including young and elderly people, with or without computer expertise, not to forget persons with disabilities.
By consequence any effort to better understand readers’ behaviour is a further step to improve online newspapers. Being quantitative and objective, eye tracking represents the best methodology to investigate the many, still unanswered, questions.