Depression Detection Using Virtual Avatar Communication and Eye Tracking
Abstract
:Introduction
Methods
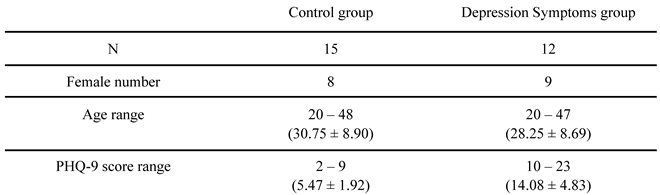
Participants
Surveys
- 1.
- Positive and Negative Affect Schedule (PANAS)
- 2.
- Patient Health Questionnaire-9 (PHQ-9)
- 3.
- International Personality Item Pool – Five Factor Model – 50 (IPIP-Big5)
Apparatus
Experimental setup
Interviewers
Conversation task
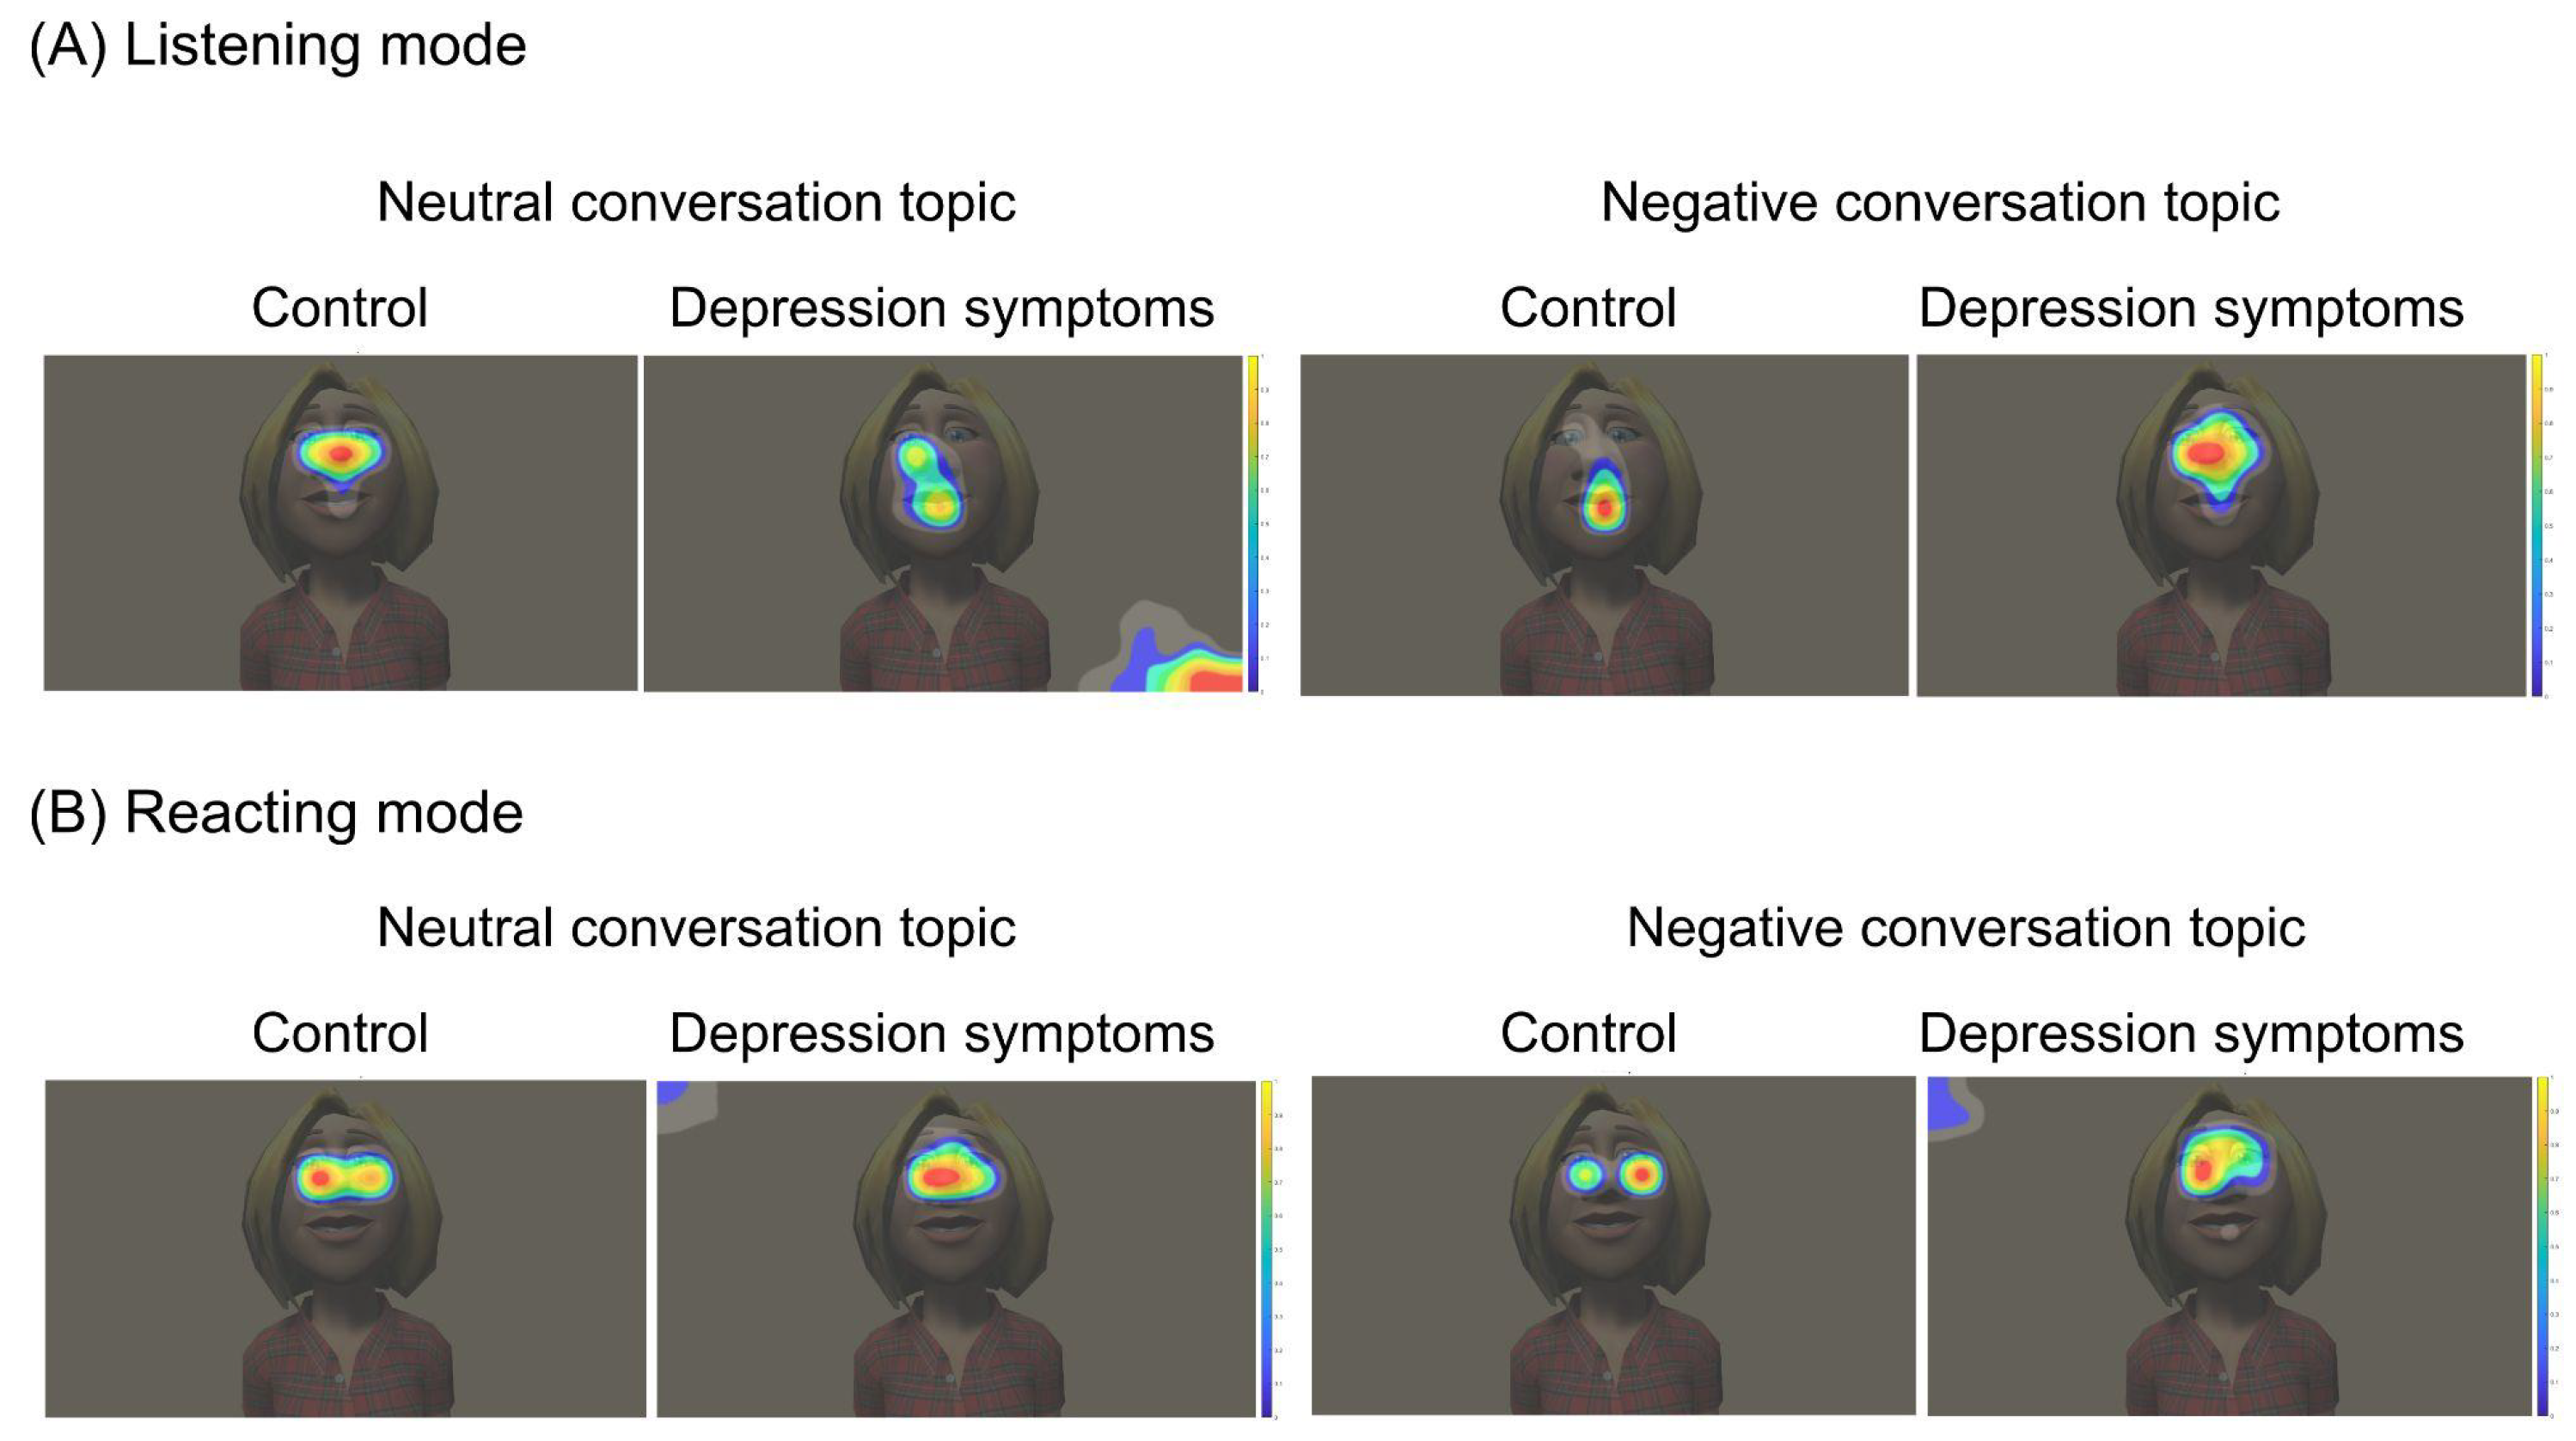
Eye tracking analysis
Statistical analysis
Results
Saccades’ frequency
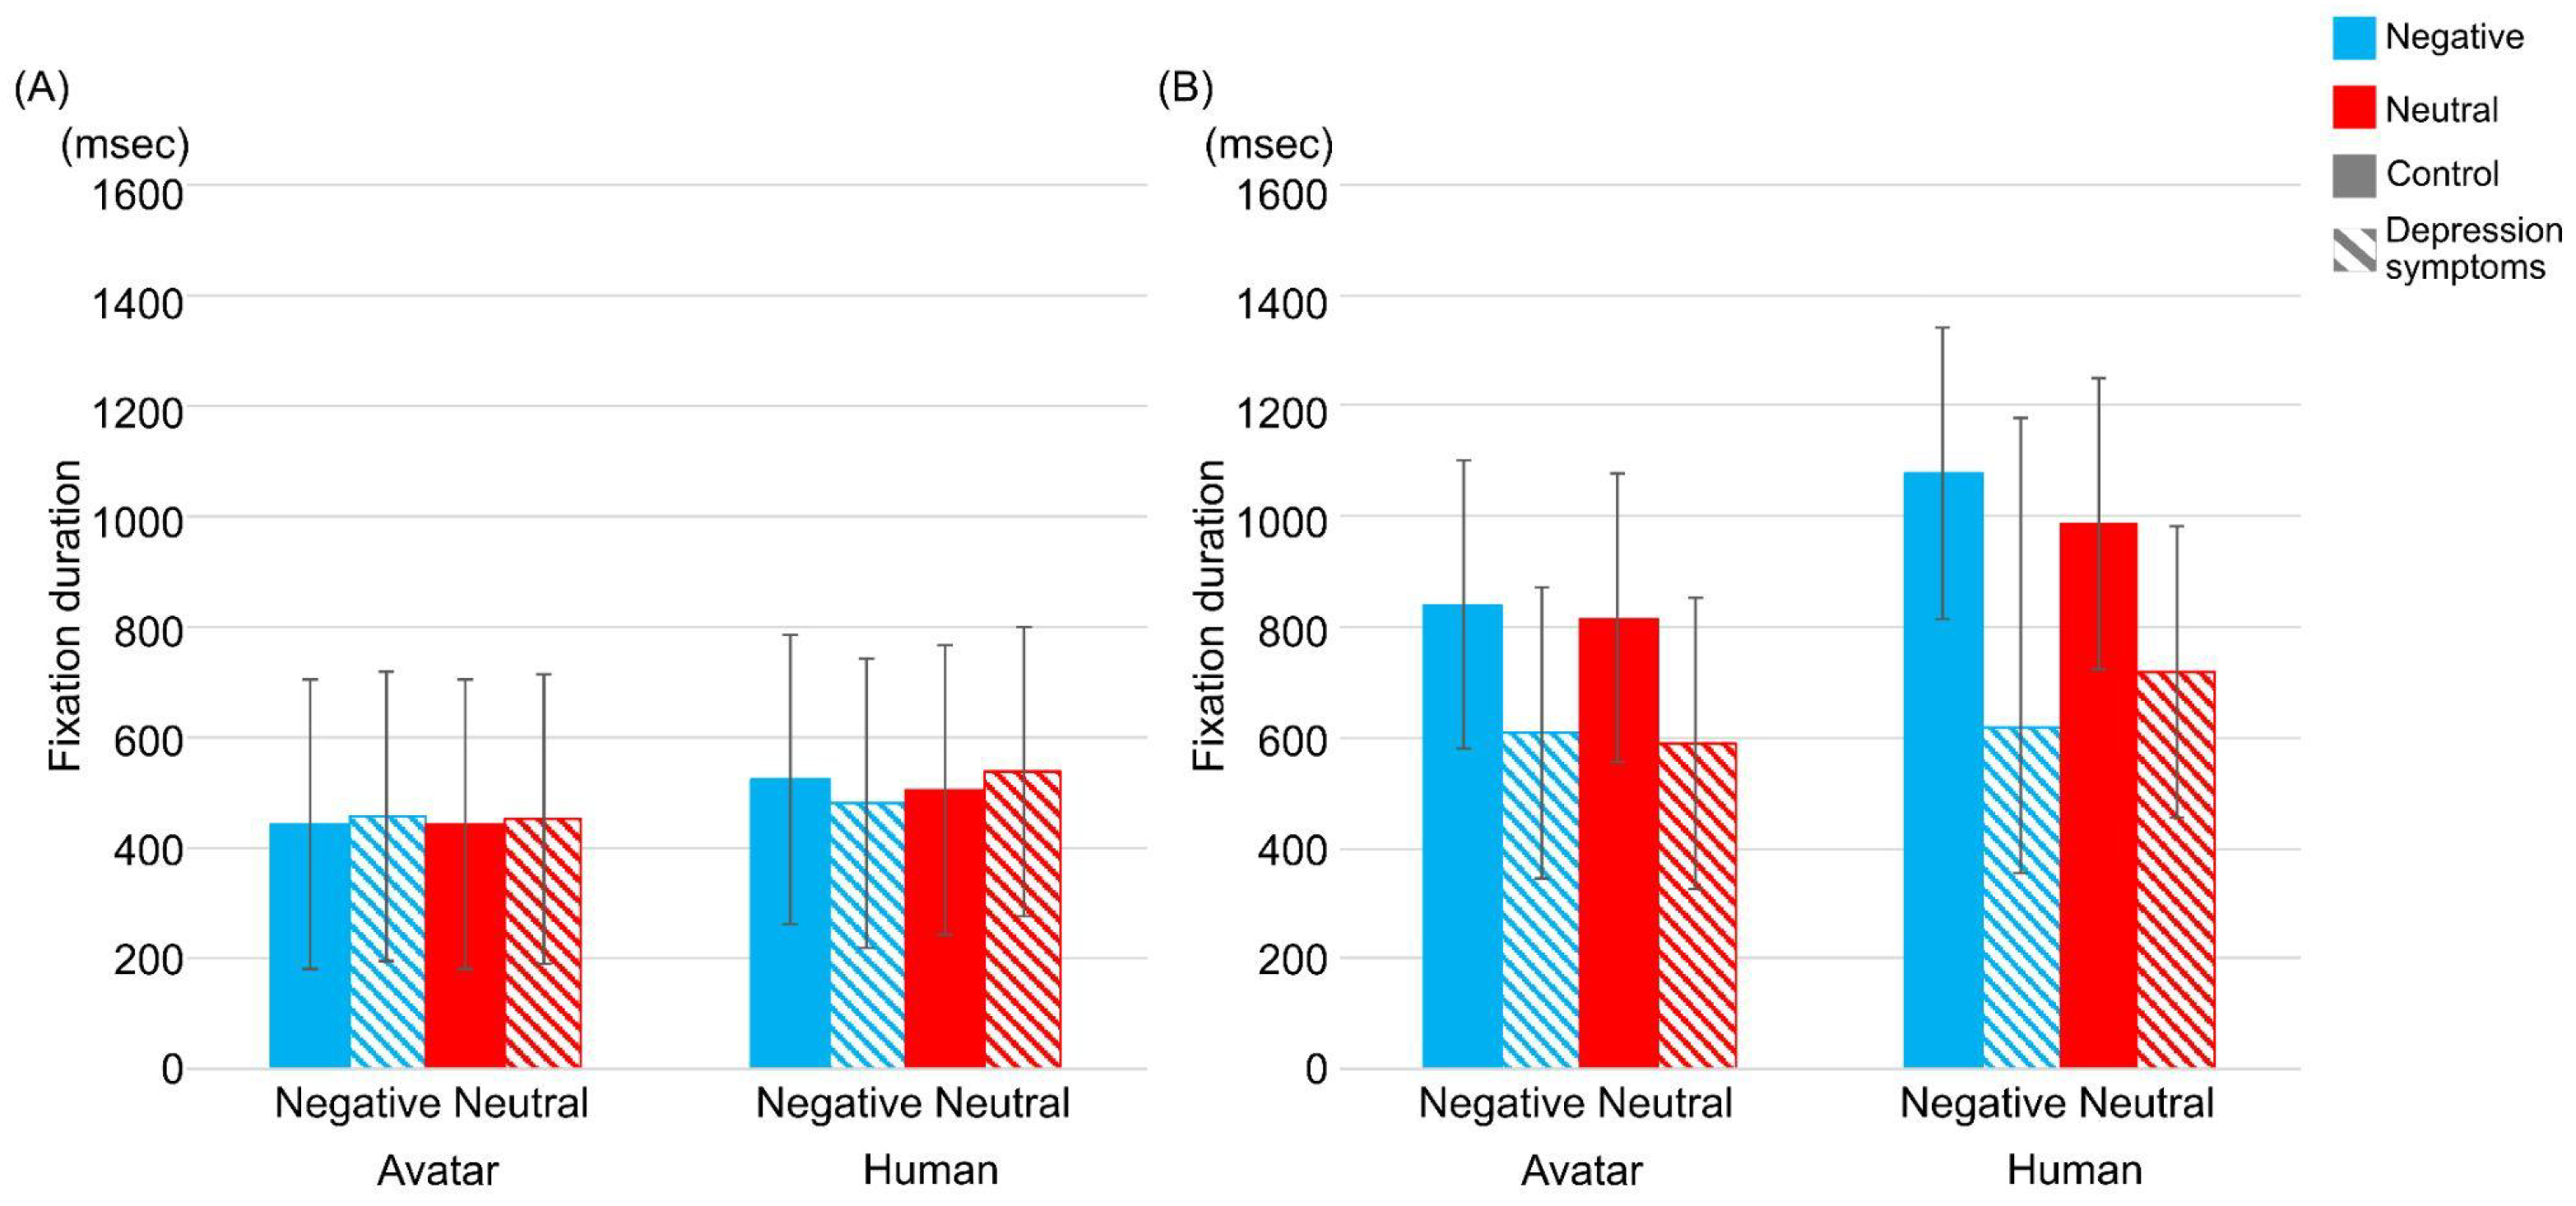
Fixation duration
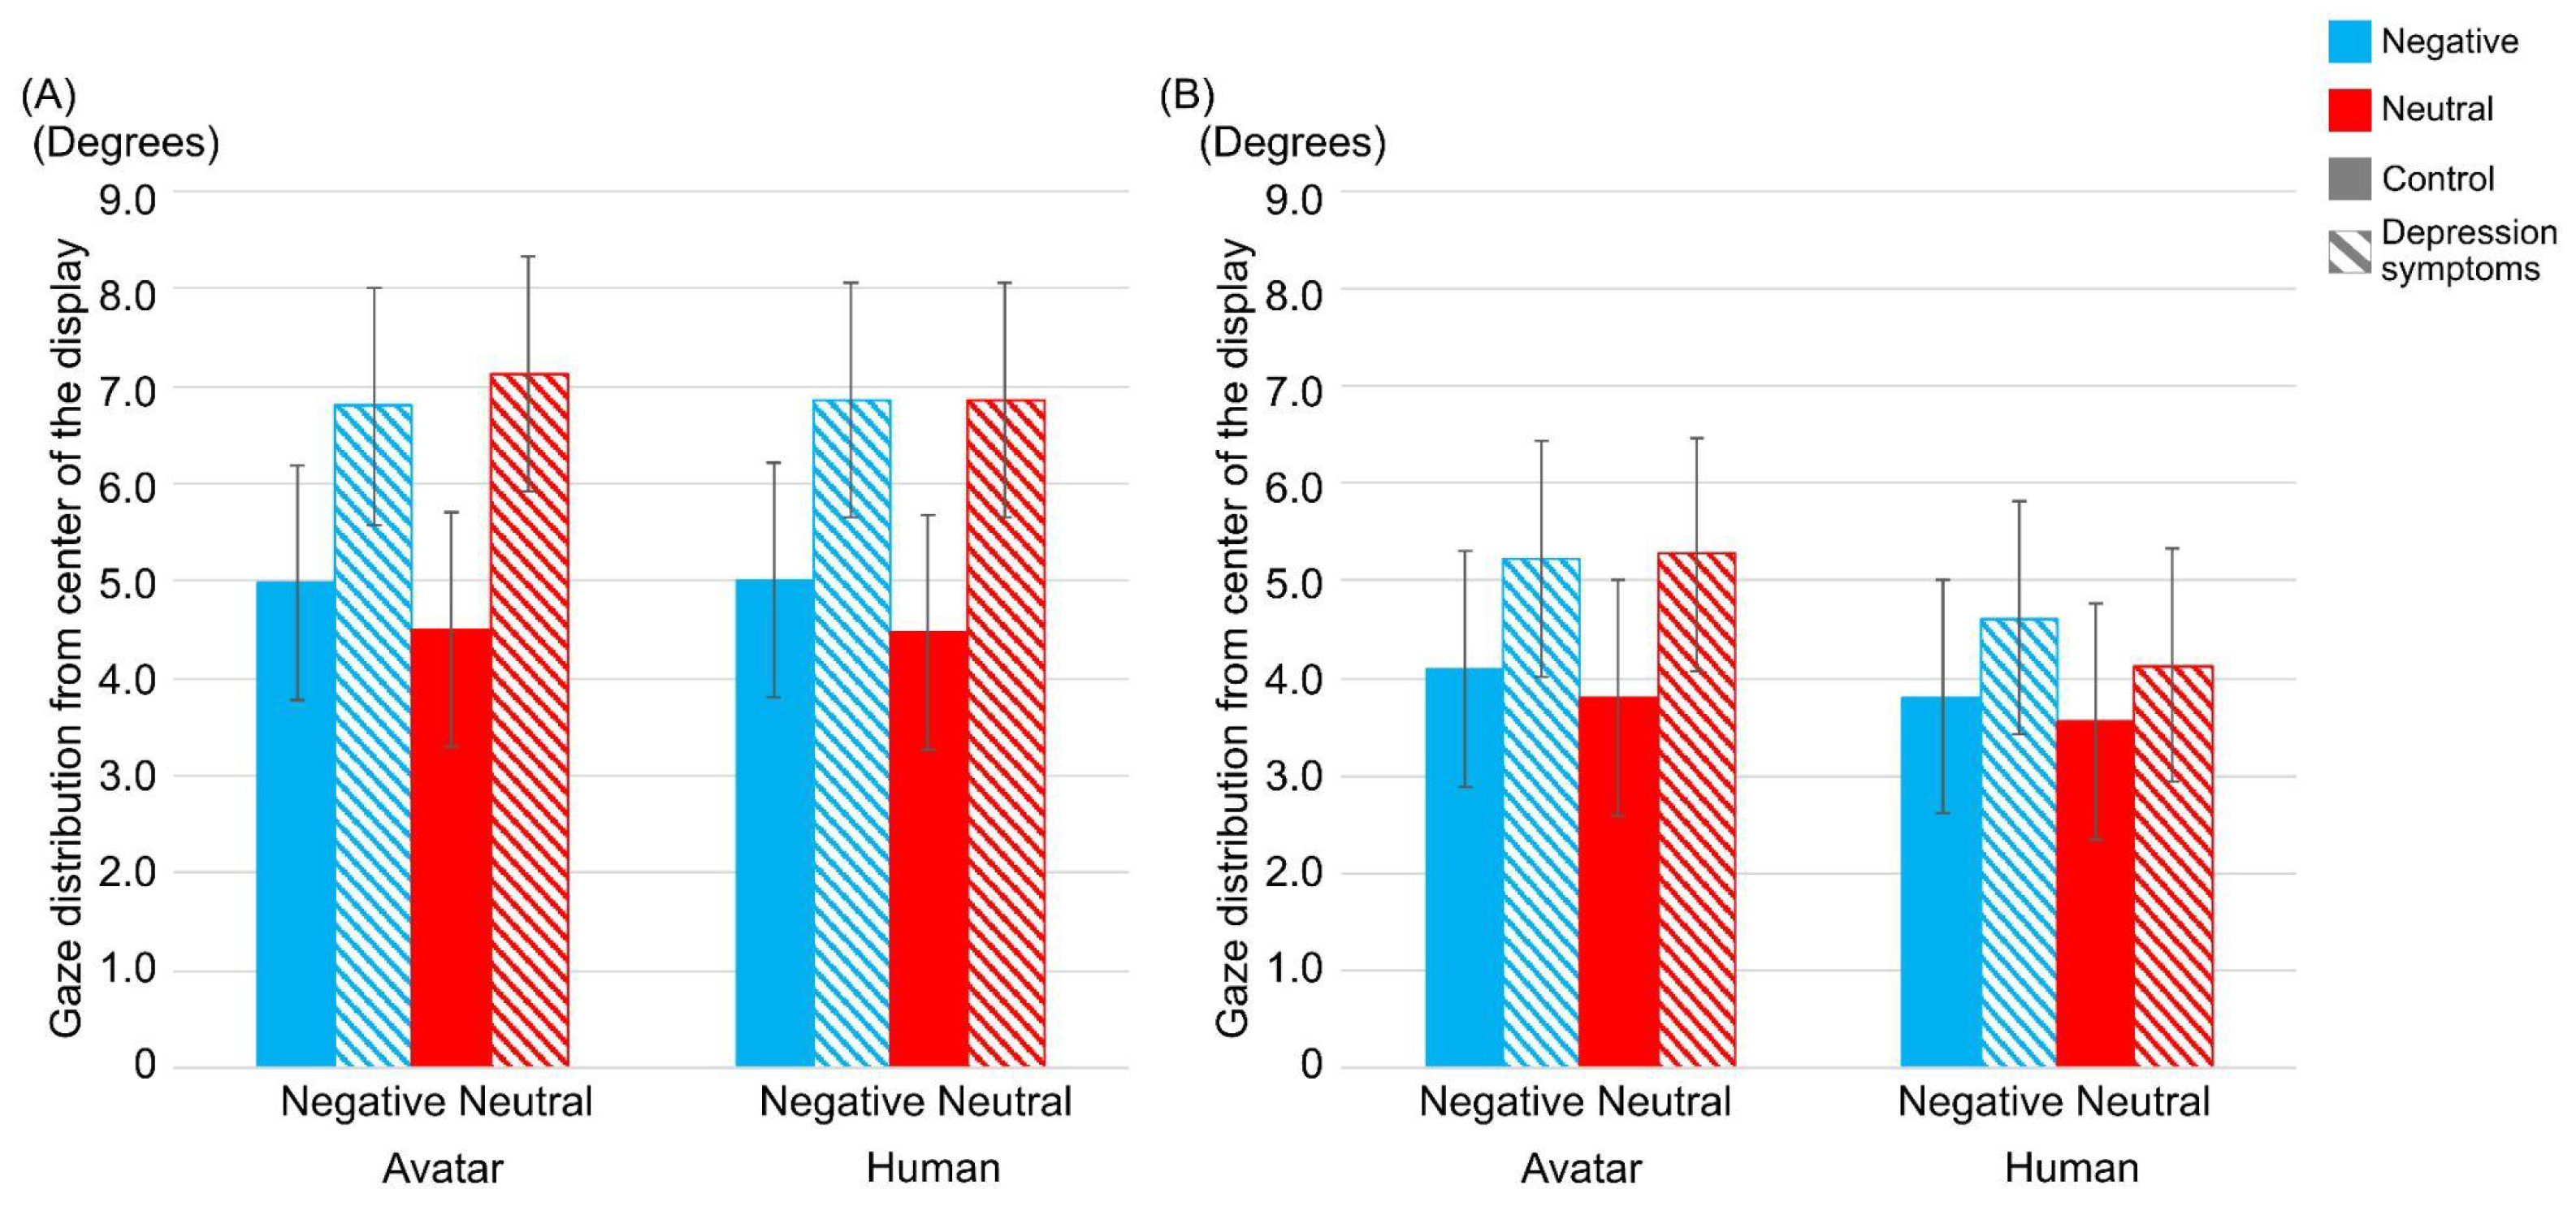
Gaze distribution
Discussion
- Human and virtual avatar interviewers’ effect on eye gaze patterns
- Negative and neutral conversation topics’ effects on eye gaze patterns
- Comparison of eye movements between control and depression symptoms groups
Ethics and Conflict of Interest
Acknowledgments
References
- Bailly, G., S. Raidt, and F. Elisei. 2010. Gaze, conversational agents and face-to-face communication. Speech Communication 52: 598–612428. [Google Scholar] [CrossRef]
- Bojdani, E., A. Rajagopalan, A. Chen, P. Gearin, W. Olcott, V. Shankar, and et al. 2020. Covid-19 pandemic: impact on psychiatric care in the united states. Psychiatry research 289: 113069432. [Google Scholar] [CrossRef]
- Cameron, R. P., and D. Gusman. 2003. The primary care ptsd screen (pc-ptsd): development and operating characteristics. Primary care psychiatry 9: 9–14434. [Google Scholar] [CrossRef]
- Cohn, J. F., T. S. Kruez, I. Matthews, Y. Yang, M. H. Nguyen, M. T. Padilla, and et al. 2009. Detecting depression from facial actions and vocal prosody. In 2009 3rd International Conference on Affective Computing and Intelligent Interaction and Workshops (IEEE); pp. 1–7437. [Google Scholar] [CrossRef]
- Costanza, R. S., V. J. Derlega, and B. A. Winstead. 1988. Positive and negative forms of social support: Effects of conversational topics on coping with stress among same-sex friends. Journal of experimental social psychology 24: 182–193. [Google Scholar] [CrossRef]
- Crawford, T. J., B. Haeger, C. Kennard, M. A. Reveley, and L. Henderson. 1995. Saccadic abnormalities in psychotic patients. I. Neuroleptic-free psychotic patients. Psychological medicine 25, 3: 461–471. [Google Scholar] [CrossRef]
- Cummins, N., S. Scherer, J. Krajewski, S. Schnieder, J. Epps, and T. F. Quatieri. 2015. A review of depression and suicide risk assessment using speech analysis. Speech communication 71: 10–49. [Google Scholar] [CrossRef]
- Dahiru, T. 2008. P-value, a true test of statistical significance? a cautionary note. Annals of Ibadan postgraduate medicine 6: 21–26. [Google Scholar] [CrossRef]
- Daly, M., and E. Robinson. 2022. Depression and anxiety during covid-19. The Lancet 399: 518. [Google Scholar] [CrossRef]
- Díaz-García, A., A. González-Robles, S. Mor, A. Mira, S. Quero, A. García-Palacios, and C. Botella. 2020. Positive and Negative Affect Schedule (PANAS): Psychometric properties of the online Spanish version in a clinical sample with emotional disorders. BMC psychiatry 20: 1–13. [Google Scholar]
- Edition, F., and et al. 2013. Diagnostic and statistical manual of mental disorders. Am Psychiatric Assoc 21: 591–643. [Google Scholar] [CrossRef]
- Ding, X., X. Yue, R. Zheng, C. Bi, D. Li, and G. Yao. 2019. Classifying major depression patients and healthy controls using EEG, eye tracking and galvanic skin response data. Journal of affective Disorders 251: 156–161. [Google Scholar] [CrossRef]
- Edition, F., and et al. 2013. Diagnostic and statistical manual of mental disorders. Am Psychiatric Assoc 21: 591–643. [Google Scholar] [CrossRef]
- Elmer, T., and C. Stadtfeld. 2020. Depressive symptoms are associated with social isolation in face-to-face interaction networks. Scientific reports 10: 1–12. [Google Scholar] [CrossRef] [PubMed]
- Faul, F., E. Erdfelder, A. Buchner, and A.-G. Lang. 2009. Statistical power analyses using g* power 3.1: Tests for correlation and regression analyses. Behavior research methods 41: 1149–1160. [Google Scholar] [CrossRef]
- Fiquer, J. T., P. S. Boggio, and C. Gorenstein. 2013. Talking bodies: Nonverbal behavior in the assessment of depression severity. Journal of affective disorders 150: 1114–1119. [Google Scholar] [CrossRef] [PubMed]
- Giannis, D., G. Geropoulos, E. Matenoglou, and D. Moris. 2021. Impact of coronavirus disease 2019 on healthcare workers: beyond the risk of exposure. Postgraduate Medical Journal 97: 326–328. [Google Scholar] [CrossRef]
- Girons, S. M., A. Mudali, M. Coble, and C. D. Richardson. 2013. Gaze as a social tool: the case of depression and eye contact. In Holmqvist, K., Mulvey, F., & Johannson, R. (2013). Abstracts of the 17th European Conference on Eye Movements 2013. Journal of Eye Movement Research 6, 3: 174. [Google Scholar] [CrossRef]
- Goldberg, L. R., and et al. 1999. A broad-bandwidth, public domain, personality inventory measuring the lower-level facets of several five-factor models. Personality psychology in Europe 7: 7–28. Available online: http://projects.ori.org/lrg/PDFs_papers/A%20broad-bandwidth%20inventory.pdf.
- Gratch, J., R. Artstein, G. Lucas, G. Stratou, S. Scherer, A. Nazarian, and et al. 2014. The distress analysis interview corpus of human and computer interviews. In Proceedings of the Ninth International Conference on Language Resources and Evaluation (LREC’14); pp. 3123–3128. Available online: http://www.lrec-conf.org/proceedings/lrec2014/pdf/508_Paper.pdf.
- Gratch, J., N. Wang, A. Okhmatovskaia, F. Lamothe, M. Morales, and R. J. van der Werf. 2007. Can virtual humans be more engaging than real ones? In International Conference on Human-Computer Interaction. Springer: pp. 286–297. [Google Scholar] [CrossRef]
- Guhn, A., B. Steinacher, A. Merkl, P. Sterzer, and S. K öhler. 2019. Negative mood induction: Affective reactivity in recurrent, but not persistent depression. Plos one 14: e0208616. [Google Scholar] [CrossRef]
- Guohou, S., Z. Lina, and Z. Dongsong. 2020. What reveals about depression level? the role of multimodal features at the level of interview questions. Information & Management 57: 103349. [Google Scholar] [CrossRef]
- Harrison, A. G., M. J. Edwards, and K. C. Parker. 2007. Identifying students faking adhd: Preliminary findings and strategies for detection. Archives of Clinical Neuropsychology 22: 577–588. [Google Scholar] [CrossRef]
- Hautala, J., O. Loberg, J. K. Hietanen, L. Nummenmaa, and P. Astikainen. 2016. Effects of conversation content on viewing dyadic conversations. Journal of Eye Movement Research 9, 7. [Google Scholar] [CrossRef]
- Hone, K. 2006. Empathic agents to reduce user frustration: The effects of varying agent characteristics. Interacting with computers 18: 227–245. [Google Scholar] [CrossRef]
- Ioannidis, J. P. 2018. The proposal to lower p value thresholds to. 005. Jama 319: 1429–1430. [Google Scholar] [CrossRef] [PubMed]
- James, S. L., D. Abate, K. H. Abate, S. M. Abay, C. Abbafati, N. Abbasi, and et al. 2018. Global, regional, and national incidence, prevalence, and years lived with disability for 354 diseases and injuries for 195 countries and territories, 1990–2017: a systematic analysis for the global burden of disease study 2017. The Lancet 392: 1789–1858. [Google Scholar] [CrossRef]
- John, O. P., E. M. Donahue, and R. L. Kentle. 1991. Big five inventory. Journal of Personality and Social Psychology. [Google Scholar] [CrossRef]
- Jones, I. H., and M. Pansa. 1979. Some nonverbal aspects of depression and schizophrenia occurring during the interview. Journal of Nervous and Mental Disease. [Google Scholar] [CrossRef]
- Kerr, B. A., M. Birdnow, J. D. Wright, and S. Fiene. 2021. They saw it coming: Rising trends in depression, anxiety, and suicidality in creative students and potential impact of the covid-19 crisis. Frontiers in Psychology, 485. [Google Scholar] [CrossRef]
- Krassanakis, V., V. Filippakopoulou, and B. Nakos. 2014. Eyemmv toolbox: An eye movement post-analysis tool based on a two-step spatial dispersion threshold for fixation identification. Journal of Eye Movement Research 7. [Google Scholar] [CrossRef]
- Krejtz, I., P. Holas, M. Rusanowska, and K. Krejtz. 2013. Visual search for facial emotion in anxious patients: eye-tracking evidence for a therapeutic change. In Holmqvist, K., Mulvey, F., & Johannson, R. (2013). Abstracts of the 17th European Conference on Eye Movements 2013 . Journal of Eye Movement Research 6, 3: 179. [Google Scholar] [CrossRef]
- Kroenke, K., R. L. Spitzer, and J. B. Williams. 2001. The phq-9: validity of a brief depression severity measure. Journal of general internal medicine 16: 606–613. [Google Scholar] [CrossRef]
- Kroll, A., D. Ewa, M. Szelepajlo, and M. Mak. 2019. Eye movements characteristics as a potential indicator of psychopathology. Experiences from clinical practice. In Martinez-Conde, S., Martinez-Otero, L., Compte, A., & Groner, R. (2019). Abstracts of the 20th European Conference on Eye Movements, 18-22 August 2019, in Alicante (Spain). Journal of Eye Movement Research 12, 7: 332. [Google Scholar] [CrossRef]
- Latvian state administration language technology platform (2020). hugo.lv. Available online: https://hugo.lv/en/About.
- Li, Y., Y. Xu, M. Xia, T. Zhang, J. Wang, X. Liu, and et al. 2016. Eye movement indices in the study of depressive disorder. Shanghai Archives of Psychiatry 28: 326. [Google Scholar] [CrossRef] [PubMed]
- Maheshwari, S., V. Tuladhar, T. Thargay, P. Sarmah, P. Sarmah, and K. Rai. 2021. Do our eyes mirror our thought patterns? a study on the influence of convergent and divergent thinking on eye movement. Psychological Research, 1–11. [Google Scholar] [CrossRef]
- Manea, L., S. Gilbody, and D. McMillan. 2012. Optimal cut-off score for diagnosing depression with the patient health questionnaire (phq-9): a meta-analysis. Cmaj 184: E191–E196. [Google Scholar] [CrossRef]
- Manor, B. R., and E. Gordon. 2003. Defining the temporal threshold for ocular fixation in free-viewing visuocognitive tasks. Journal of neuroscience methods 128: 85–93. [Google Scholar] [CrossRef]
- Monster, A., H. Chan, and D. O’Connor. 1978. Long-term trends in human eye blink rate. Biotelemetry and patient monitoring 5: 206–222. [Google Scholar]
- [Dataset] NCH Software. 2020. Voxal voice changer. Available online: Https://www.nchsoftware.com/voicechanger/.
- Ooms, K., and V. Krassanakis. 2018. Measuring the spatial noise of a low-cost eye tracker to enhance fixation detection. Journal of Imaging 4, 8: 96. [Google Scholar] [CrossRef]
- Perepjolkina, V., and V. Reņģe. 2013. Psychometric Properties of the Final Version of a Latvian Personality Inventory. In 12 th European Conference on Psychological Assessment, San Sebastian, Spain, July; Book of Abstracts. pp. 354–355. [Google Scholar]
- [Dataset] Pfizer. 2014. Patient health questionnaire-9 in latvian. Available online: https://www.phqscreeners.com/select-screener.
- Pratt, J. A., K. Hauser, Z. Ugray, and O. Patterson. 2007. Looking at human–computer interface design: Effects of ethnicity in computer agents. Interacting with Computers 19: 512–523. [Google Scholar] [CrossRef]
- Pērkona, K., and A. Koļesovs. 2019. Personības aptaujas “Starptautiskā personības pantu kopuma (IPIP-50) Lielā Piecinieka marķieri” adaptācija latviešu valodā.
- Rantala, M. J., S. Luoto, I. Krams, and H. Karlsson. 2018. Depression subtyping based on evolutionary psychiatry: proximate mechanisms and ultimate functions. Brain, Behavior, and Immunity 69: 603–617. [Google Scholar] [CrossRef]
- Richards, D., B. Alsharbi, and A. Abdulrahman. 2020. Can i help you? preferences of young adults for the age, gender and ethnicity of a virtual support person based on individual differences including personality and psychological state. In Proceedings of the Australasian Computer Science Week Multiconference; pp. 1–10. [Google Scholar] [CrossRef]
- Rudich-Strassler, A., N. Hertz-Palmor, and A. Lazarov. 2022. Looks interesting: Attention allocation in depression when using a news website–an eye tracking study. Journal of Affective Disorders. [Google Scholar] [CrossRef]
- Santomauro, D. F., A. M. M. Herrera, J. Shadid, P. Zheng, C. Ashbaugh, D. M. Pigott, and et al. 2021. Global prevalence and burden of depressive and anxiety disorders in 204 countries and territories in 2020 due to the covid-19 pandemic. The Lancet 398: 1700–1712. [Google Scholar] [CrossRef]
- Sasangohar, F., M. R. Bradshaw, M. M. Carlson, J. N. Flack, J. C. Fowler, D. Freeland, and et al. 2020. Adapting an outpatient psychiatric clinic to telehealth during the covid-19 pandemic: a practice perspective. Journal of medical Internet research 22: e22523. [Google Scholar] [CrossRef] [PubMed]
- Schmitt, D. P., J. Allik, R. R. McCrae, and V. Benet-Mart ínez. 2007. The geographic distribution of big five personality traits: Patterns and profiles of human self-description across 56 nations. Journal of cross-cultural psychology 38: 173–212. [Google Scholar] [CrossRef]
- Sobin, C., and H. A. Sackeim. 1997. Psychomotor symptoms of depression. American Journal of Psychiatry 154: 4–17. [Google Scholar] [CrossRef] [PubMed]
- Sollman, M. J., J. D. Ranseen, and D. T. Berry. 2010. Detection of feigned adhd in college students. Psychological assessment 22: 325. [Google Scholar] [CrossRef]
- Stolicyn, A., J. D. Steele, and P. Seriès. 2022. Prediction of depression symptoms in individual subjects with face and eye movement tracking. Psychological medicine 52, 9. [Google Scholar] [CrossRef]
- Strus, W., J. Cieciuch, and T. Rowínski. 2014. The circumplex of personality metatraits: A synthesizing model of personality based on the big five. Review of General Psychology 18: 273–286. [Google Scholar] [CrossRef]
- Sun, Y., Z. Fu, Q. Bo, Z. Mao, X. Ma, and C. Wang. 2020. The reliability and validity of PHQ-9 in patients with major depressive disorder in psychiatric hospital. BMC psychiatry 20: 1–7. [Google Scholar] [CrossRef]
- Suslow, T., A. Husslack, A. Kersting, and C. M. Bodenschatz. 2020. Attentional biases to emotional information in clinical depression: a systematic and meta-analytic review of eye tracking findings. Journal of Affective Disorders 274: 632–642. [Google Scholar] [CrossRef]
- Sweeney, J. A., M. H. Strojwas, J. J. Mann, and M. E. Thase. 1998. Prefrontal and cerebellar abnormalities in major depression: evidence from oculomotor studies. Biological psychiatry 43, 8: 584–594. [Google Scholar] [CrossRef]
- Takemoto, A., I. Aispuriete, L. Niedra, and L. F. Dreimane. 2023. Differentiating depression using facial expressions in a virtual avatar communication system. Frontiers in Digital Health 5. [Google Scholar] [CrossRef]
- Tsubota, K., and K. Nakamori. 1993. Dry eyes and video display terminals. New England Journal of Medicine 328: 584–584. [Google Scholar] [CrossRef] [PubMed]
- [Dataset] Unity. 2021. Toon people ver 3.1. Available online: http://jb3d.es/marketplace/.
- Wang, Y., H.-L. Lyu, X.-H. Tian, B. Lang, X.-Y. Wang, D. St Clair, and et al. 2022. The similar eye movement dysfunction between major depressive disorder, bipolar depression and bipolar mania. The World Journal of Biological Psychiatry, 1–14. [Google Scholar] [CrossRef]
- Watson, D., L. A. Clark, and A. Tellegen. 1988. Development and validation of brief measures of positive and negative affect: the panas scales. Journal of personality and social psychology 54: 1063. [Google Scholar] [CrossRef]
- Waxer, P. 1974. Nonverbal cues for depression. Journal of Abnormal Psychology 83: 319. [Google Scholar] [CrossRef] [PubMed]
- Ypofanti, M., V. Zisi, N. Zourbanos, B. Mouchtouri, P. Tzanne, Y. Theodorakis, and et al. 2015. Psychometric properties of the international personality item pool big-five personality questionnaire for the greek population. Health psychology research 3. [Google Scholar] [CrossRef]
- Zhang, D., X. Liu, L. Xu, Y. Li, Y. Xu, M. Xia, and J. Wang. 2022. Effective differentiation between depressed patients and controls using discriminative eye movement features. Journal of Affective Disorders 307: 237–243. [Google Scholar] [CrossRef]
- Zheng, L., L. R. Goldberg, Y. Zheng, Y. Zhao, Y. Tang, and L. Liu. 2008. Reliability and concurrent validation of the ipip big-five factor markers in china: Consistencies in factor structure between internet-obtained heterosexual and homosexual samples. Personality and individual differences 45: 649–654. [Google Scholar] [CrossRef]


 |
Copyright © 2023. This article is licensed under a Creative Commons Attribution 4.0 International License.
Share and Cite
Takemoto, A.; Aispuriete, I.; Niedra, L.; Dreimane, L.F. Depression Detection Using Virtual Avatar Communication and Eye Tracking. J. Eye Mov. Res. 2023, 16, 1-17. https://doi.org/10.16910/jemr.16.2.6
Takemoto A, Aispuriete I, Niedra L, Dreimane LF. Depression Detection Using Virtual Avatar Communication and Eye Tracking. Journal of Eye Movement Research. 2023; 16(2):1-17. https://doi.org/10.16910/jemr.16.2.6
Chicago/Turabian StyleTakemoto, Ayumi, Inese Aispuriete, Laima Niedra, and Lana Franceska Dreimane. 2023. "Depression Detection Using Virtual Avatar Communication and Eye Tracking" Journal of Eye Movement Research 16, no. 2: 1-17. https://doi.org/10.16910/jemr.16.2.6
APA StyleTakemoto, A., Aispuriete, I., Niedra, L., & Dreimane, L. F. (2023). Depression Detection Using Virtual Avatar Communication and Eye Tracking. Journal of Eye Movement Research, 16(2), 1-17. https://doi.org/10.16910/jemr.16.2.6