The State of the Art of Diagnostic Multiparty Eye Tracking in Synchronous Computer-Mediated Collaboration
Abstract
:Introduction
Methods
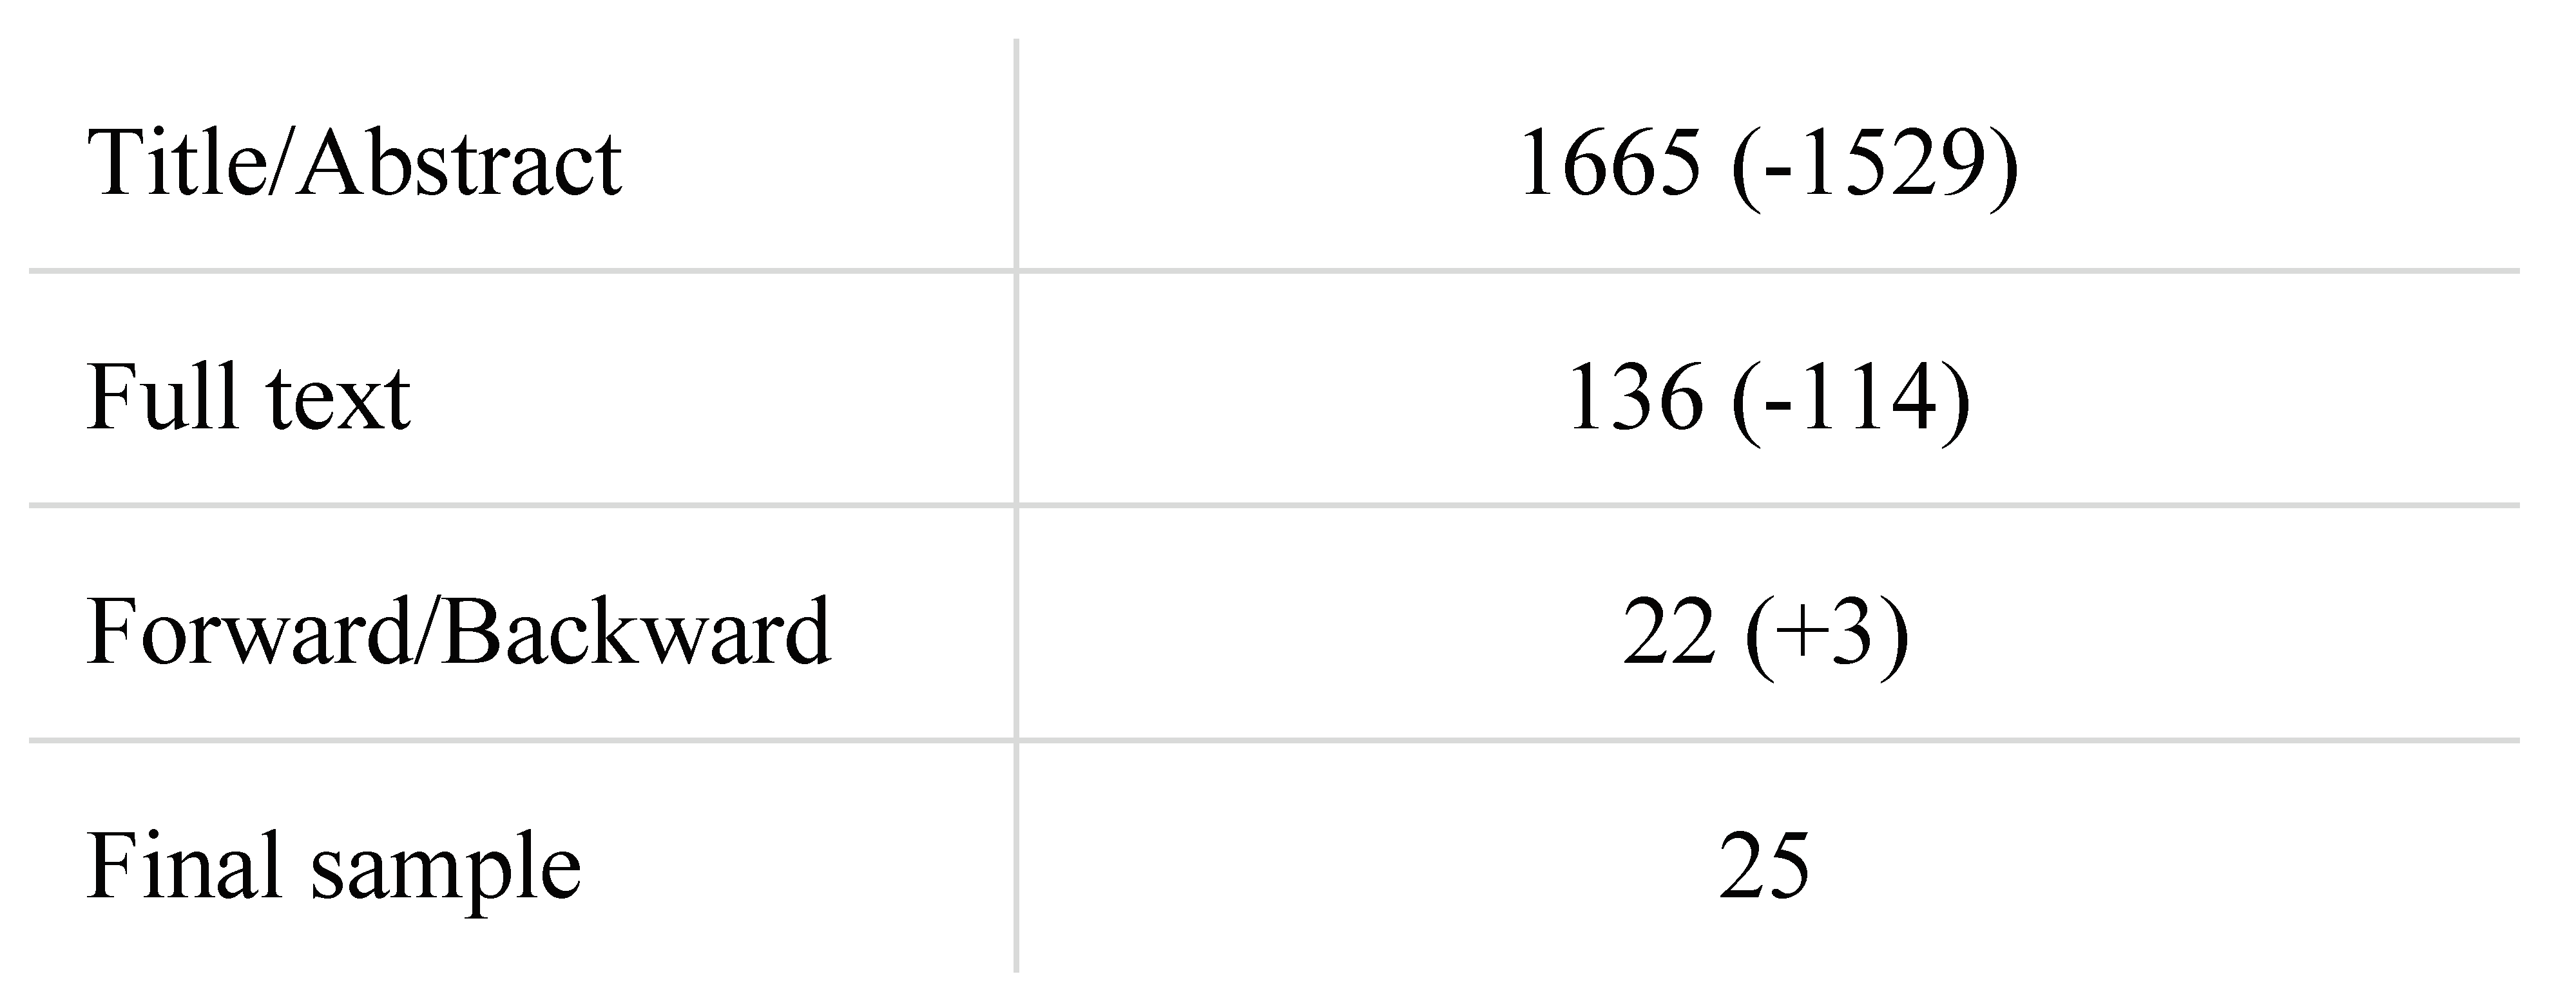
Search Strategy
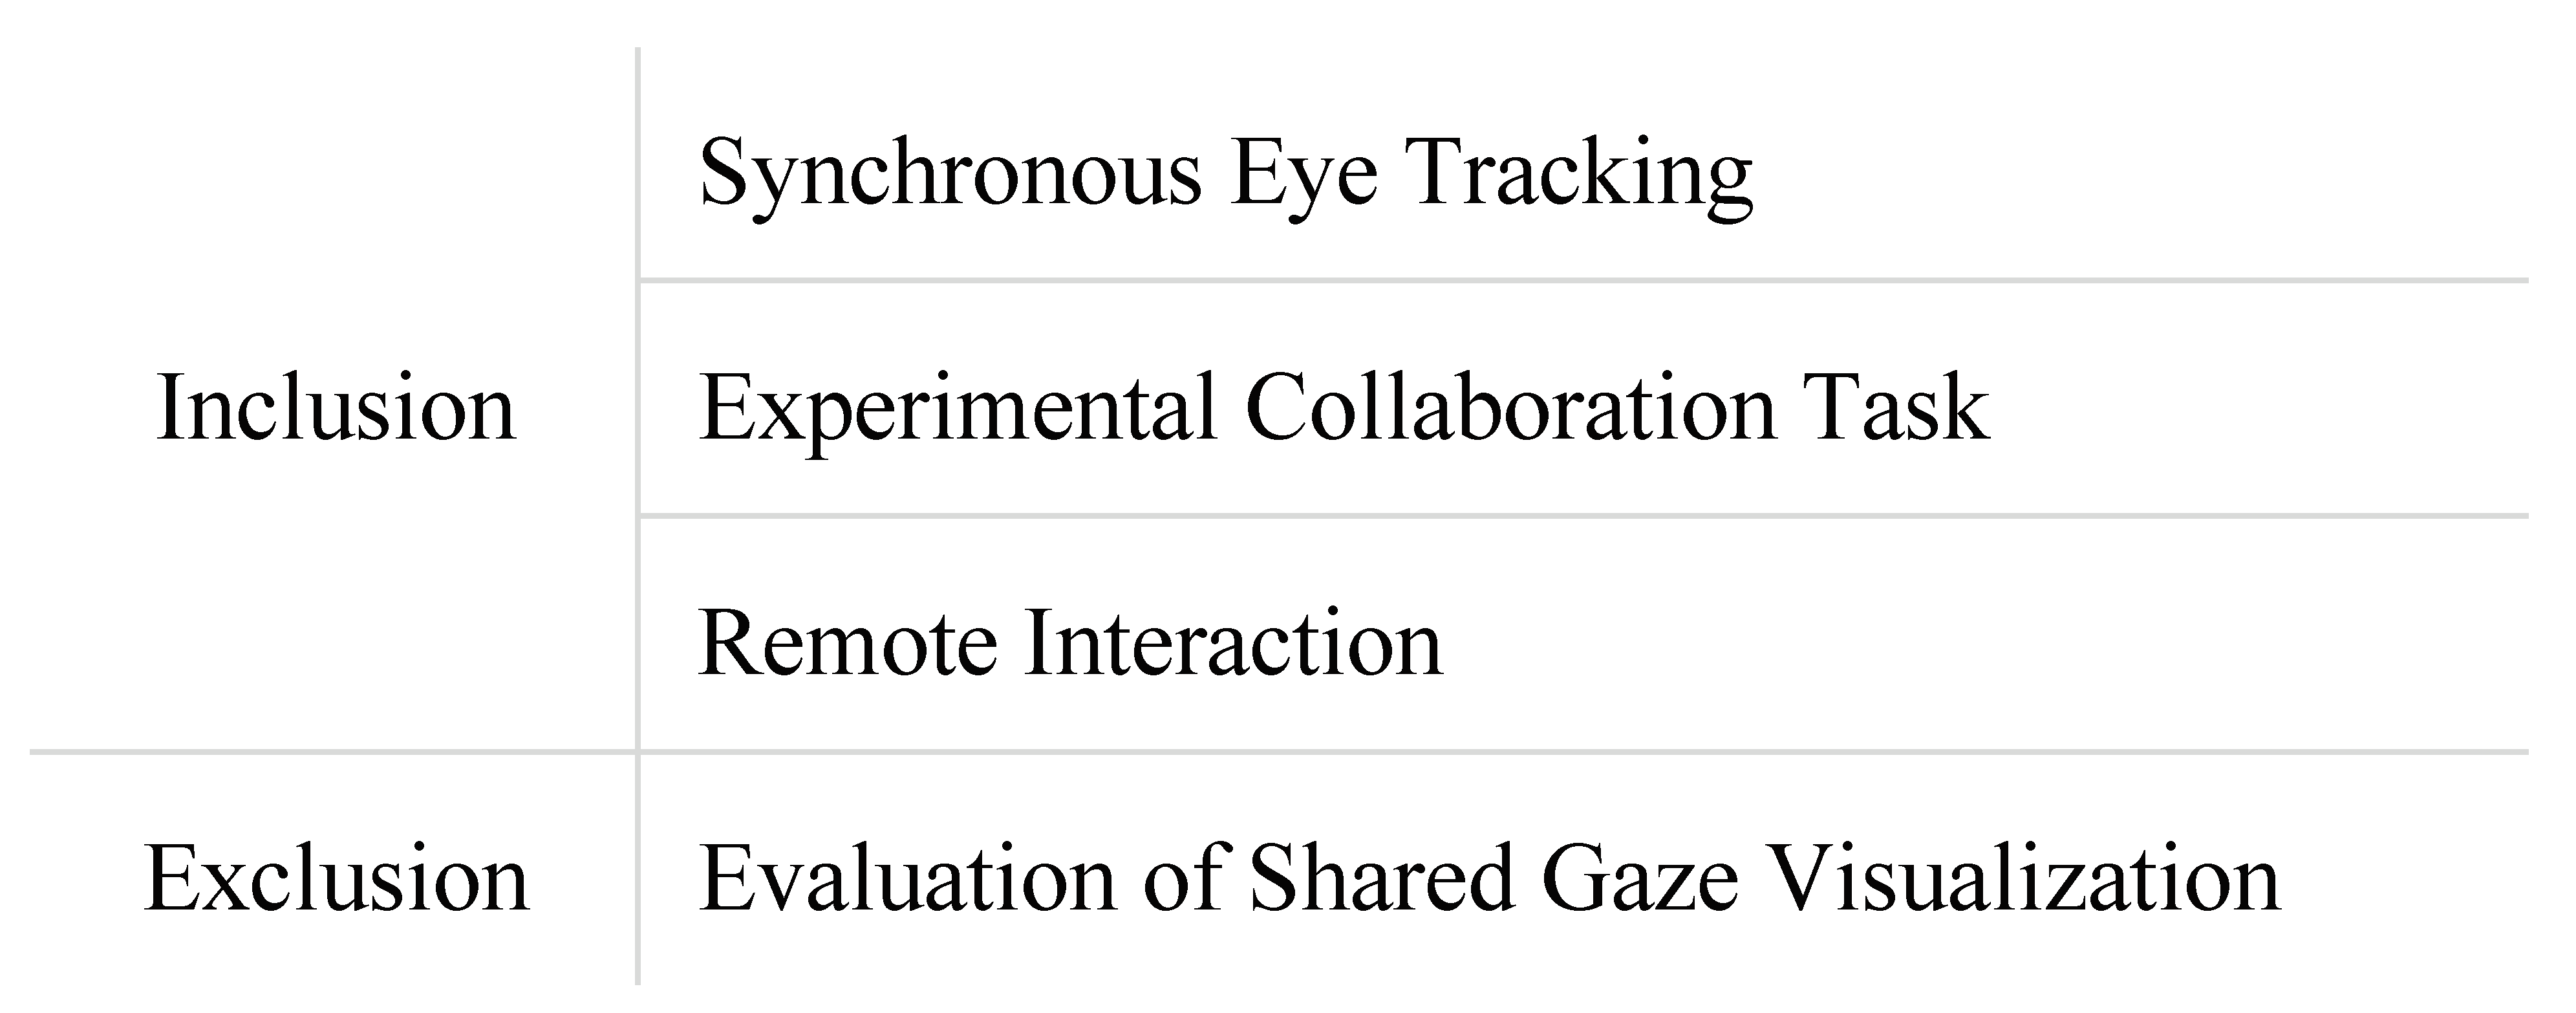
Selection Criteria
Data Extraction
Results
Review Process
Conceptual Framework
Discussion
Synchronized Collaboration
Computer-Mediated Interaction
Multiparty Eye Tracking Setup
Computation Methods
Eye-Based Constructs
Conclusion
Ethics and Conflict of Interest
Acknowledgments
References
- Abdullah, A., J. Kolkmeier, V. Lo, and M. Neff. 2021. Videoconference and Embodied VR: Communication Patterns across Task and Medium. In Proceedings of the ACM on Human-Computer Interaction 5, 2: 1–29. [Google Scholar] [CrossRef]
- Baltes, B. B., M. W. Dickson, M. P. Sherman, C. C. Bauer, and J. S. LaGanke. 2002. Computer-Mediated Communication and Group Decision Making: A Meta-Analysis. Organizational Behavior and Human Decision Processes 87, 1: 156–179. [Google Scholar] [CrossRef]
- Bednarik, R., and M. Kauppinen. 2013. Unrawelling the interaction strategies and gaze in collaborative learning with online video lectures. In Proceedings of the 6th Workshop on Eye Gaze in Intelligent Human Machine Interaction: Gaze in Multimodal Interaction–GazeIn ‘13. ACM: pp. 57–62. [Google Scholar] [CrossRef]
- Belenky, D., M. Ringenberg, J. Olsen, V. Aleven, and N. Rummel. 2014. Using Dual Eye-Tracking to Evaluate Students' Collaboration with an Intelligent Tutoring System for Elementary-Level Fractions. In Proceedings of the 36th Annual Meeting of the Cognitive Science Society–CogSci ‘14; ERIC: pp. 1–6. Available online: https://files.eric.ed.gov/fulltext/ED556498.pdf.
- Çakır, M. P., and S. D. Uzunosmanoğlu. 2014. An Interactional Analysis of Gaze Coordination during Online Collaborative Problem Solving Activities. In Proceedings of the 11th International Conference of the Learning Sciences–ICLS ‘14. ISLS: pp. 1112–1116. Available online: https://repository.isls.org//handle/1/945.
- Cherubini, M., M. A. Nüssli, and P. Dillenbourg. 2008. Deixis and gaze in collaborative work at a distance (over a shared map): a computational model to detect misunderstandings. In Proceedings of the 2008 Symposium on Eye Tracking Research & Applications–ETRA ‘08. ACM: pp. pp. 173–180. [Google Scholar] [CrossRef]
- Cherubini, M., M. A. Nüssli, and P. Dillenbourg. 2010. This is it!: Indicating and looking in collaborative work at distance. Journal of Eye Movement Research 3, 5: 1–20. [Google Scholar] [CrossRef]
- Coco, M. I., and R. Dale. 2014. Cross-recurrence quantification analysis of categorical and continuous time series: an R package. Frontiers in Psychology 5: e510. [Google Scholar] [CrossRef]
- Dale, R., N. Z. Kirkham, and D. C. Richardson. 2011. The dynamics of reference and shared visual attention. Frontiers in Psychology 2: e355. [Google Scholar] [CrossRef]
- D’Angelo, S., and B. Schneider. 2021. Shared Gaze Visualizations in Collaborative Interactions: Past, Present and Future. Interacting with Computers 33, 2: 115–133. [Google Scholar] [CrossRef]
- Emery, N. J. 2000. The eyes have it: the neuroethology, function and evolution of social gaze. Neuroscience & Biobehavioral Reviews 24, 6: 581–604. [Google Scholar] [CrossRef]
- Fındık-Coşkunçay, D., and M. P. Çakır. 2022. An investigation of the relationship between joint visual attention and product quality in collaborative business process modeling: a dual eye-tracking study. Software and Systems Modeling 21: 2429–2460. [Google Scholar] [CrossRef]
- Frischen, A., A. P. Bayliss, and S. P. Tipper. 2007. Gaze cueing of attention: visual attention, social cognition, and individual differences. Psychological Bulletin 133, 4: 694–724. [Google Scholar] [CrossRef]
- Hessels, R. S. 2020. How does gaze to faces support face-to-face interaction? A review and perspective. Psychonomic Bulletin & Review 27, 5: 856–881. [Google Scholar] [CrossRef]
- Isikdag, U., and J. Underwood. 2010. Two design patterns for facilitating Building Information Modelbased synchronous collaboration. Automation in Construction 19, 5: 544–553. [Google Scholar] [CrossRef]
- Jermann, P., and M. A. Nüssli. 2012. Effects of sharing text selections on gaze cross-recurrence and interaction quality in a pair programming task. In Proceedings of the ACM 2012 Conference on Computer Supported Cooperative Work–CSCW ‘12. ACM: pp. 1125–1134. [Google Scholar] [CrossRef]
- Jermann, P., M. A. Nüssli, and W. Li. 2010. Using dual eye-tracking to unveil coordination and expertise in collaborative Tetris. In Proceedings of the 24th British Computer Society Conference on Human-Computer Interaction–HCI ’12. ACM: pp. 36–44. [Google Scholar] [CrossRef]
- Jermann, P., and K. Sharma. 2018. Gaze as a Proxy for Cognition and Communication. In Proceedings of the 2018 IEEE 18th International Conference on Advanced Learning Technologies–ICALT ‘18. IEEE: pp. 152–154. [Google Scholar] [CrossRef]
- Kitchenham, B., and S. Charters. 2007. Guidelines for performing Systematic Literature Reviews in Software Engineering, 2nd ed. EBSE: Available online: https://www.researchgate.net/publication/302924724.
- Kuriyama, N., A. Terai, M. Yasuhara, T. Tokunaga, K. Yamagishi, and T. Kusumi. 2011. Gaze matching of referring expressions in collaborative problem solving. In Proceedings of International Workshop on Dual Eye Tracking in CSCW–DUET ‘11. ECSCW: pp. 1–8. Available online: https://www.cl.c.titech.ac.jp/_media/publication/668.pdf.
- Langner, M., P. Toreini, and A. Maedche. 2022. EyeMeet: A Joint Attention Support System for Remote Meetings. In Extended Abstracts of the 2022 CHI Conference on Human Factors in Computing Systems–CHI ‘22. ACM: pp. 1–7. [Google Scholar] [CrossRef]
- Molinari, G. 2017. From learners’ concept maps of their similar or complementary prior knowledge to collaborative concept map: Dual eye-tracking and concept map analyses. Psychologie Française 62, 3: 293–311. [Google Scholar] [CrossRef]
- Molinari, G., M. Sangin, M. A. Nüssli, and P. Dillenbourg. 2008. Effects of Knowledge Interdependence with the Partner on Visual and Action Transactivity in Collaborative Concept Mapping. In Proceedings of the 8th International Conference of the Learning Sciences–ICLS ‘08. ISLS: pp. 91–98. Available online: https://repository.isls.org//handle/1/3203.
- Olsen, J. K., M. Ringenberg, V. Aleven, and N. Rummel. 2015. Dual Eye Tracking as a Tool to Assess Collaboration. In Proceedings of the 4th Workshop on Intelligent Support for Learning in Groups–ISLG ‘15. CEUR: pp. 25–30. Available online: http://ceur-ws.org/Vol-1432/islg_proc.pdf#page=29.
- Olsen, J., K. Sharma, V. Aleven, and N. Rummel. 2018. Combining Gaze, Dialogue, and Action from a Collaborative Intelligent Tutoring System to Inform Student Learning Processes. In Proceedings of the 13th International Conference of the Learning Sciences–ICLS ‘18. ISLS: pp. 689–696. Available online: https://repository.isls.org//handle/1/484.
- Pfeiffer, U. J., K. Vogeley, and L. Schilbach. 2013. From gaze cueing to dual eye-tracking: Novel approaches to investigate the neural correlates of gaze in social interaction. Neuroscience & Biobehavioral Reviews 37, 10: 2516–2528. [Google Scholar] [CrossRef]
- Richardson, D. C., and R. Dale. 2005. Looking to Understand: The Coupling Between Speakers’ and Listeners’ Eye Movements and its Relationship to Discourse Comprehension. Cognitive Science 29, 6: 1045–1060. [Google Scholar] [CrossRef] [PubMed]
- Sharma, K., D. Caballero, H. Verma, P. Jermann, and P. Dillenbourg. 2015. Looking AT versus looking THROUGH: A Dual Eye-Tracking Study in MOOC Context. In Proceedings of the 11th International Conference on Computer Supported Collaborative Learning–CSCL ‘15. ISLS: pp. 260–267. Available online: https://repository.isls.org//handle/1/416.
- Sharma, K., P. Jermann, M. A. Nüssli, and P. Dillenbourg. 2012. Gaze Evidence for Different Activities in Program Understanding. In Proceedings of 24th Annual conference of Psychology of Programming Interest Group–PPIG ‘12. EPFL: pp. 1–12. Available online: https://infoscience.epfl.ch/record/184006.
- Sharma, K., P. Jermann, M. A. Nüssli, and P. Dillenbourg. 2013. Understanding Collaborative Program Comprehension: Interlacing Gaze and Dialogues. In Proceedings of the 10th International Conference on Computer Supported Collaborative Learning–CSCL ‘13. ISLS: pp. 430–437. Available online: https://repository.isls.org/handle/1/1944.
- Sharma, K., J. K. Olsen, V. Aleven, and N. Rummel. 2021a. Measuring causality between collaborative and individual gaze metrics for collaborative problem-solving with intelligent tutoring systems. Journal of Computer Assisted Learning 37, 1: 51–68. [Google Scholar] [CrossRef]
- Sharma, K., J. K. Olsen, H. Verma, D. Caballero, and P. Jermann. 2021b. Challenging Joint Visual Attention as a Proxy for Collaborative Performance. In Proceedings of the 14th International Conference on Computer-Supported Collaborative Learning–CSCL ‘21. ISLS: pp. 91–98. Available online: https://repository.isls.org//handle/1/7364.
- Tchanou, A. Q., P. M. Léger, J. Boasen, S. Senecal, J. A. Taher, and M. Fredette. 2020. Collaborative Use of a Shared System Interface: The Role of User Gaze—Gaze Convergence Index Based on Synchronous Dual-Eyetracking. Applied Sciences 10, 13: e4508. [Google Scholar] [CrossRef]
- Valtakari, N. V., I. T. Hooge, C. Viktorsson, P. Nyström, T. Falck-Ytter, and R. S. Hessels. 2021. Eye tracking in human interaction: Possibilities and limitations. Behavior Research Methods 53, 4: 1592–1608. [Google Scholar] [CrossRef] [PubMed]
- Villamor, M., and M. M. Rodrigo. 2017. Characterizing Collaboration Based on Prior Knowledge in a Pair Programming and Debugging Eye-Tracking Experiment. In Proceedings of the 15th National Conference on Information Technology Education–NCITE ‘17. PSITE: pp. 1–8. Available online: https://www.researchgate.net/publication/320893405.
- Villamor, M., and M. M. Rodrigo. 2018. Impact of Pair Programming Dynamics and Profiles to Pair Success. In Proceedings of the 26th International Conference on Computers in Education–ICCE ‘18. APSCE: pp. 123–132. Available online: https://www.researchgate.net/publication/329390104.
- Vrzakova, H., M. J. Amon, M. Rees, M. Faber, and S. D’Mello. 2021. Looking for a Deal? Visual Social Attention during Negotiations via Mixed Media Videoconferencing. In Proceedings of the ACM on Human-Computer Interaction 4, 3: 1–35. [Google Scholar] [CrossRef]
- Vrzakova, H., M. J. Amon, A. E. Stewart, and S. K. D’Mello. 2019. Dynamics of Visual Attention in Multiparty Collaborative Problem Solving using Multidimensional Recurrence Quantification Analysis. In Proceedings of the 2019 CHI Conference on Human Factors in Computing Systems–CHI ‘19. ACM: pp. 1–14. [Google Scholar] [CrossRef]
- Wallot, S., A. Roepstorff, and D. Mønster. 2016. Multidimensional Recurrence Quantification Analysis (MdRQA) for the Analysis of Multidimensional Time-Series: A Software Implementation in MATLAB and Its Application to Group-level Data in Joint Action. Frontiers in Psychology 7: e1835. [Google Scholar] [CrossRef]


 |
 |
 |
 |
Copyright © 2023. This article is licensed under a Creative Commons Attribution 4.0 International License.
Share and Cite
Reuscher, T.F.; Toreini, P.; Maedche, A. The State of the Art of Diagnostic Multiparty Eye Tracking in Synchronous Computer-Mediated Collaboration. J. Eye Mov. Res. 2023, 16, 1-14. https://doi.org/10.16910/jemr.16.2.4
Reuscher TF, Toreini P, Maedche A. The State of the Art of Diagnostic Multiparty Eye Tracking in Synchronous Computer-Mediated Collaboration. Journal of Eye Movement Research. 2023; 16(2):1-14. https://doi.org/10.16910/jemr.16.2.4
Chicago/Turabian StyleReuscher, Tom Frank, Peyman Toreini, and Alexander Maedche. 2023. "The State of the Art of Diagnostic Multiparty Eye Tracking in Synchronous Computer-Mediated Collaboration" Journal of Eye Movement Research 16, no. 2: 1-14. https://doi.org/10.16910/jemr.16.2.4
APA StyleReuscher, T. F., Toreini, P., & Maedche, A. (2023). The State of the Art of Diagnostic Multiparty Eye Tracking in Synchronous Computer-Mediated Collaboration. Journal of Eye Movement Research, 16(2), 1-14. https://doi.org/10.16910/jemr.16.2.4