Teachers’ Gaze over Space and Time in a Real-World Classroom
Abstract
:Introduction
Teachers’ gaze distribution
Why study eye contact in the classroom?
Research questions
Methods
Participants
Lessons
Apparatus and data collection
Coding and data processing
Eye movement measure considerations
Analysis of data
Results
Variety in the teachers’ gaze distribution
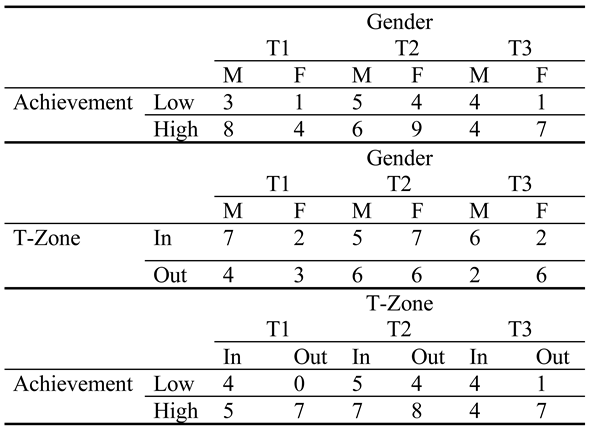
Gaze distribution with respect to the three characteristics of the students
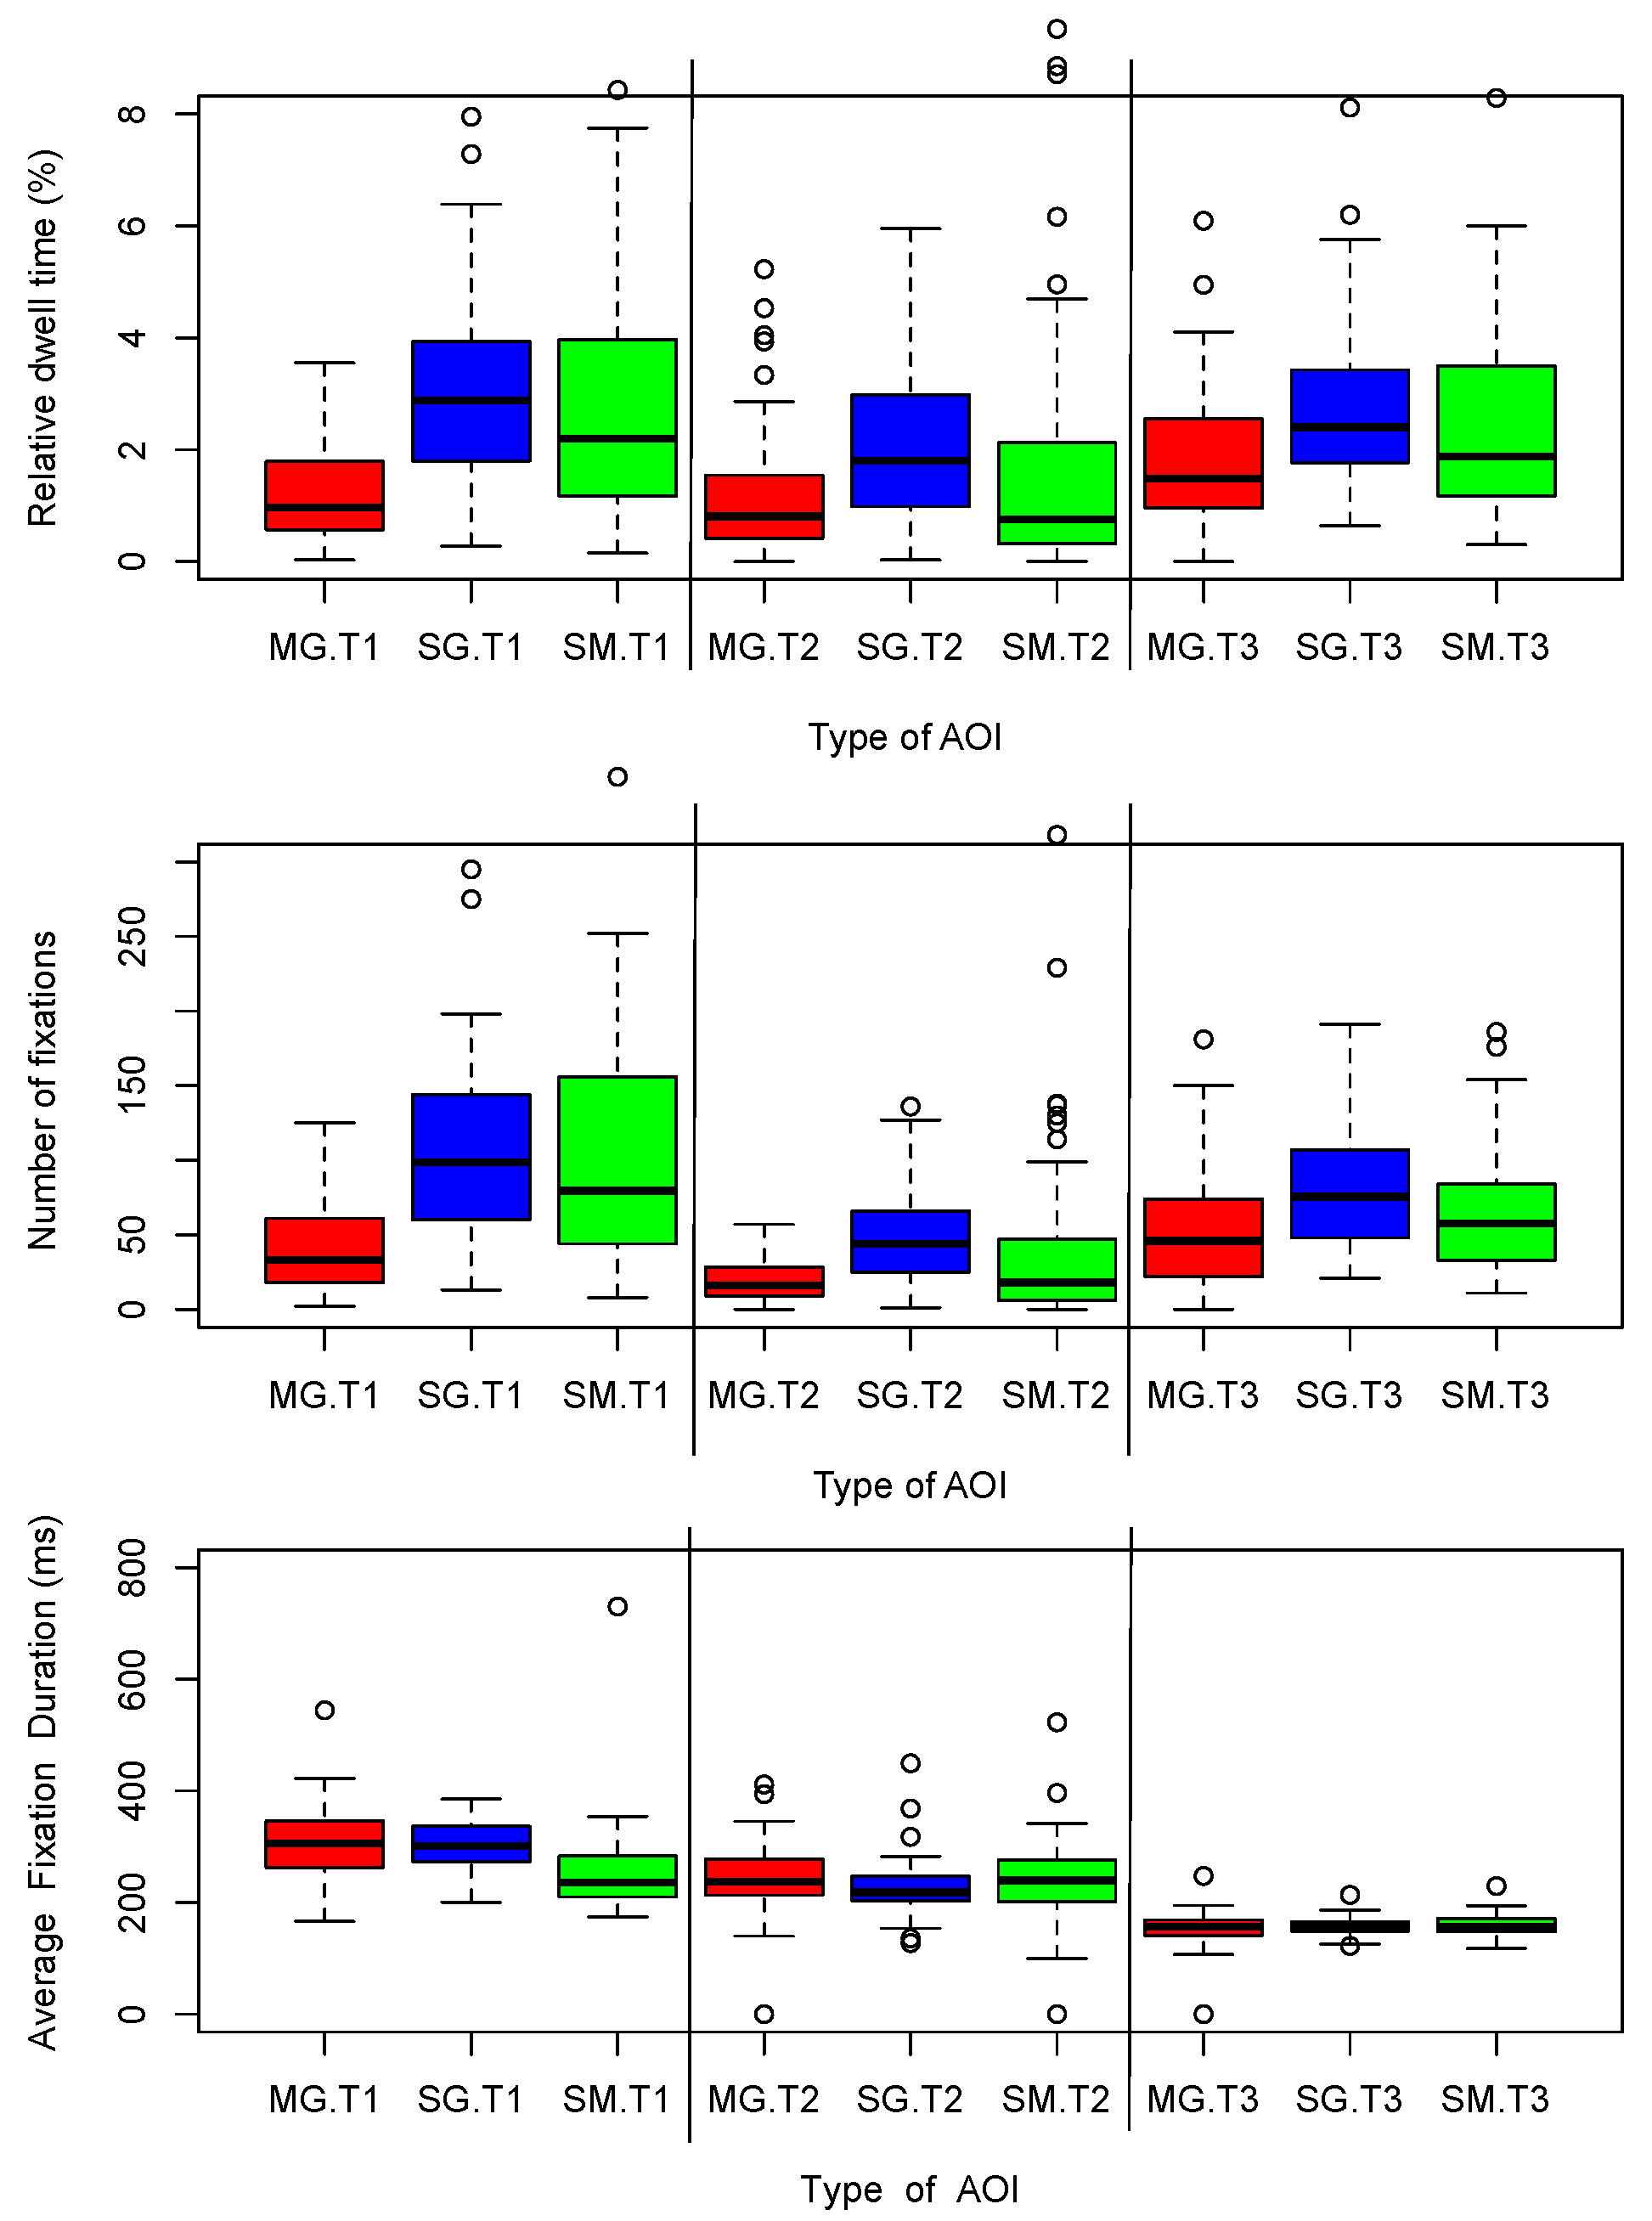
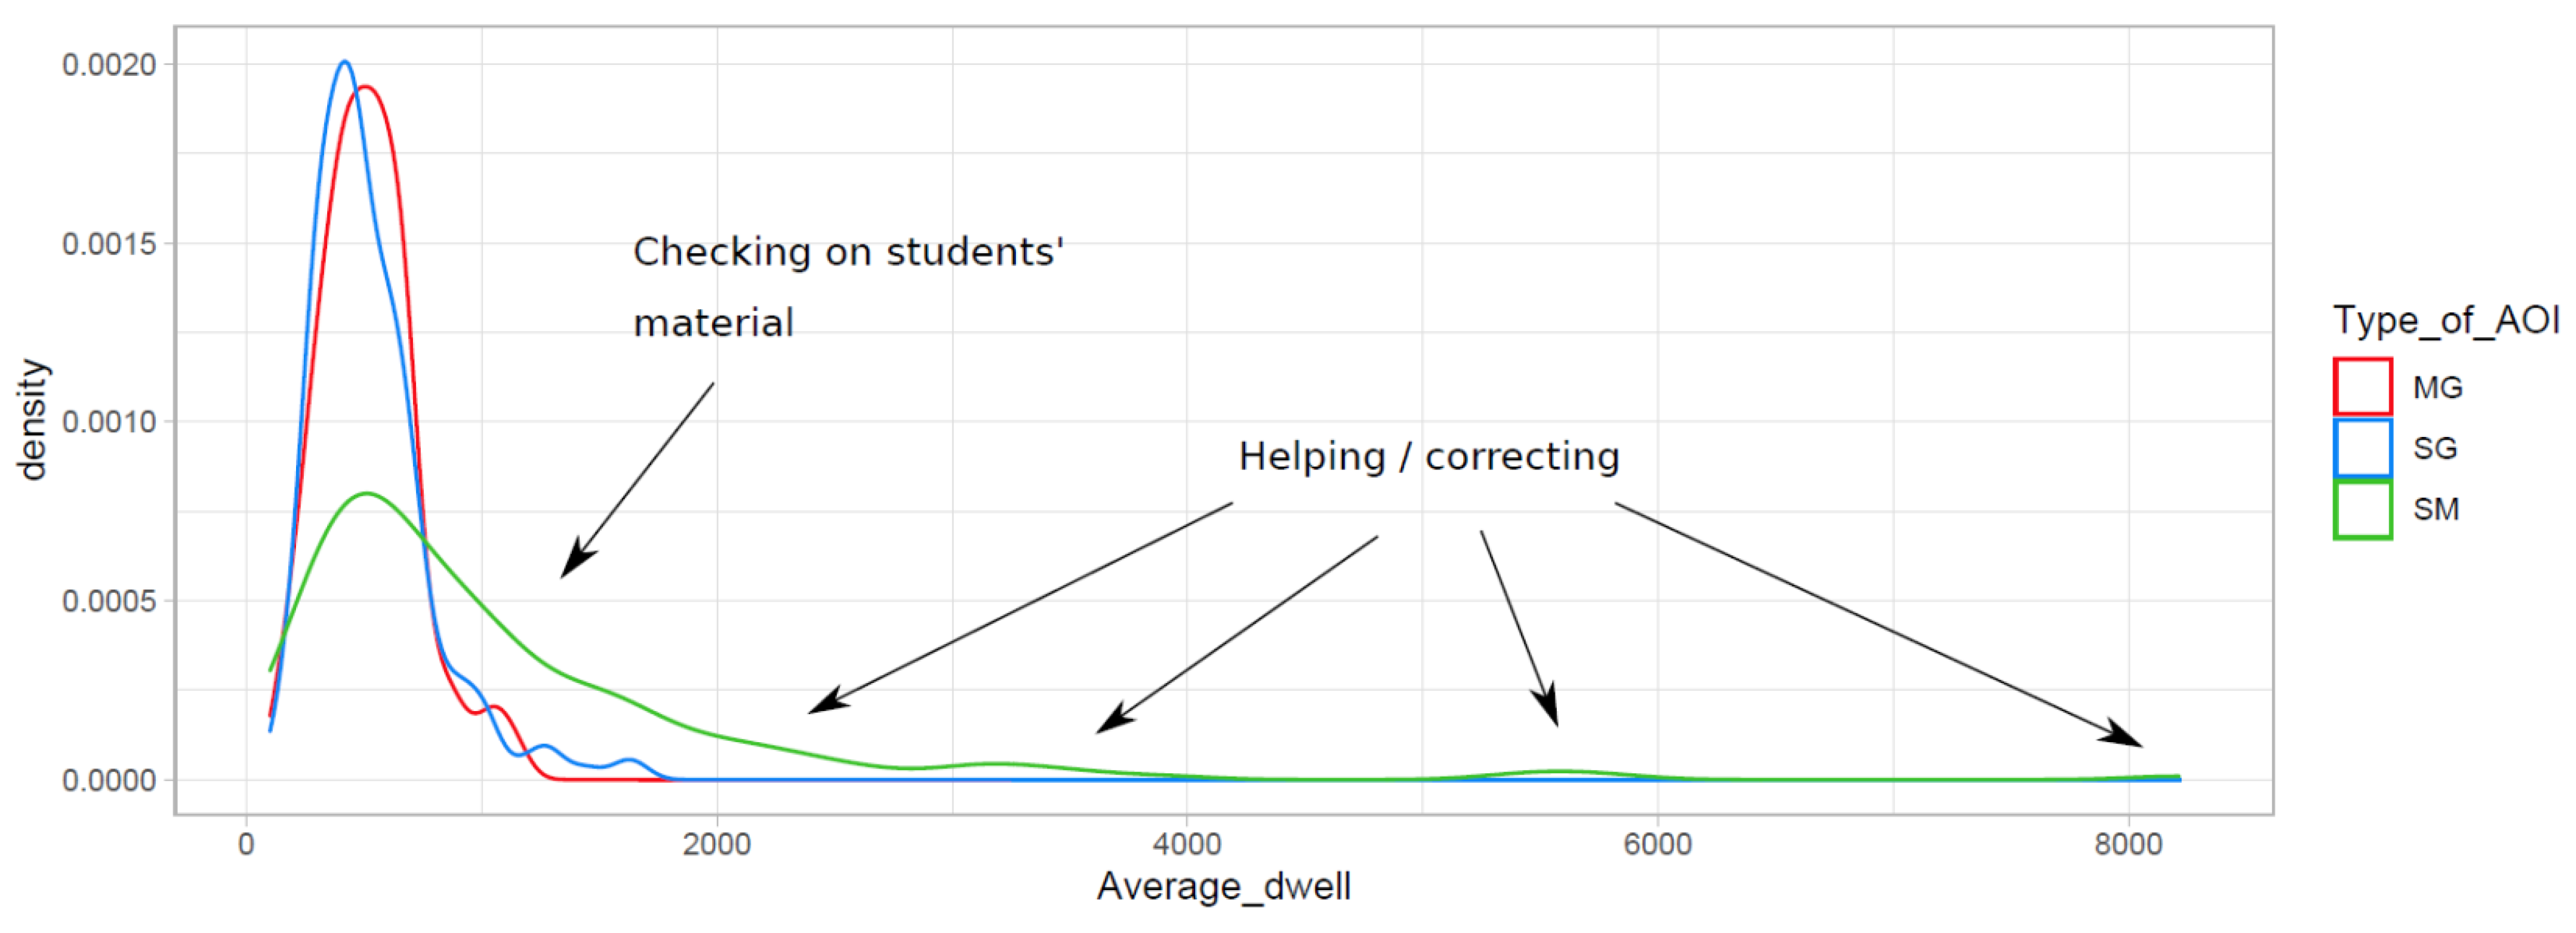
Frequency and duration of mutual gaze, single gaze, and gaze on student material
Proportions of dwell time of mutual gaze, single gaze, and student material
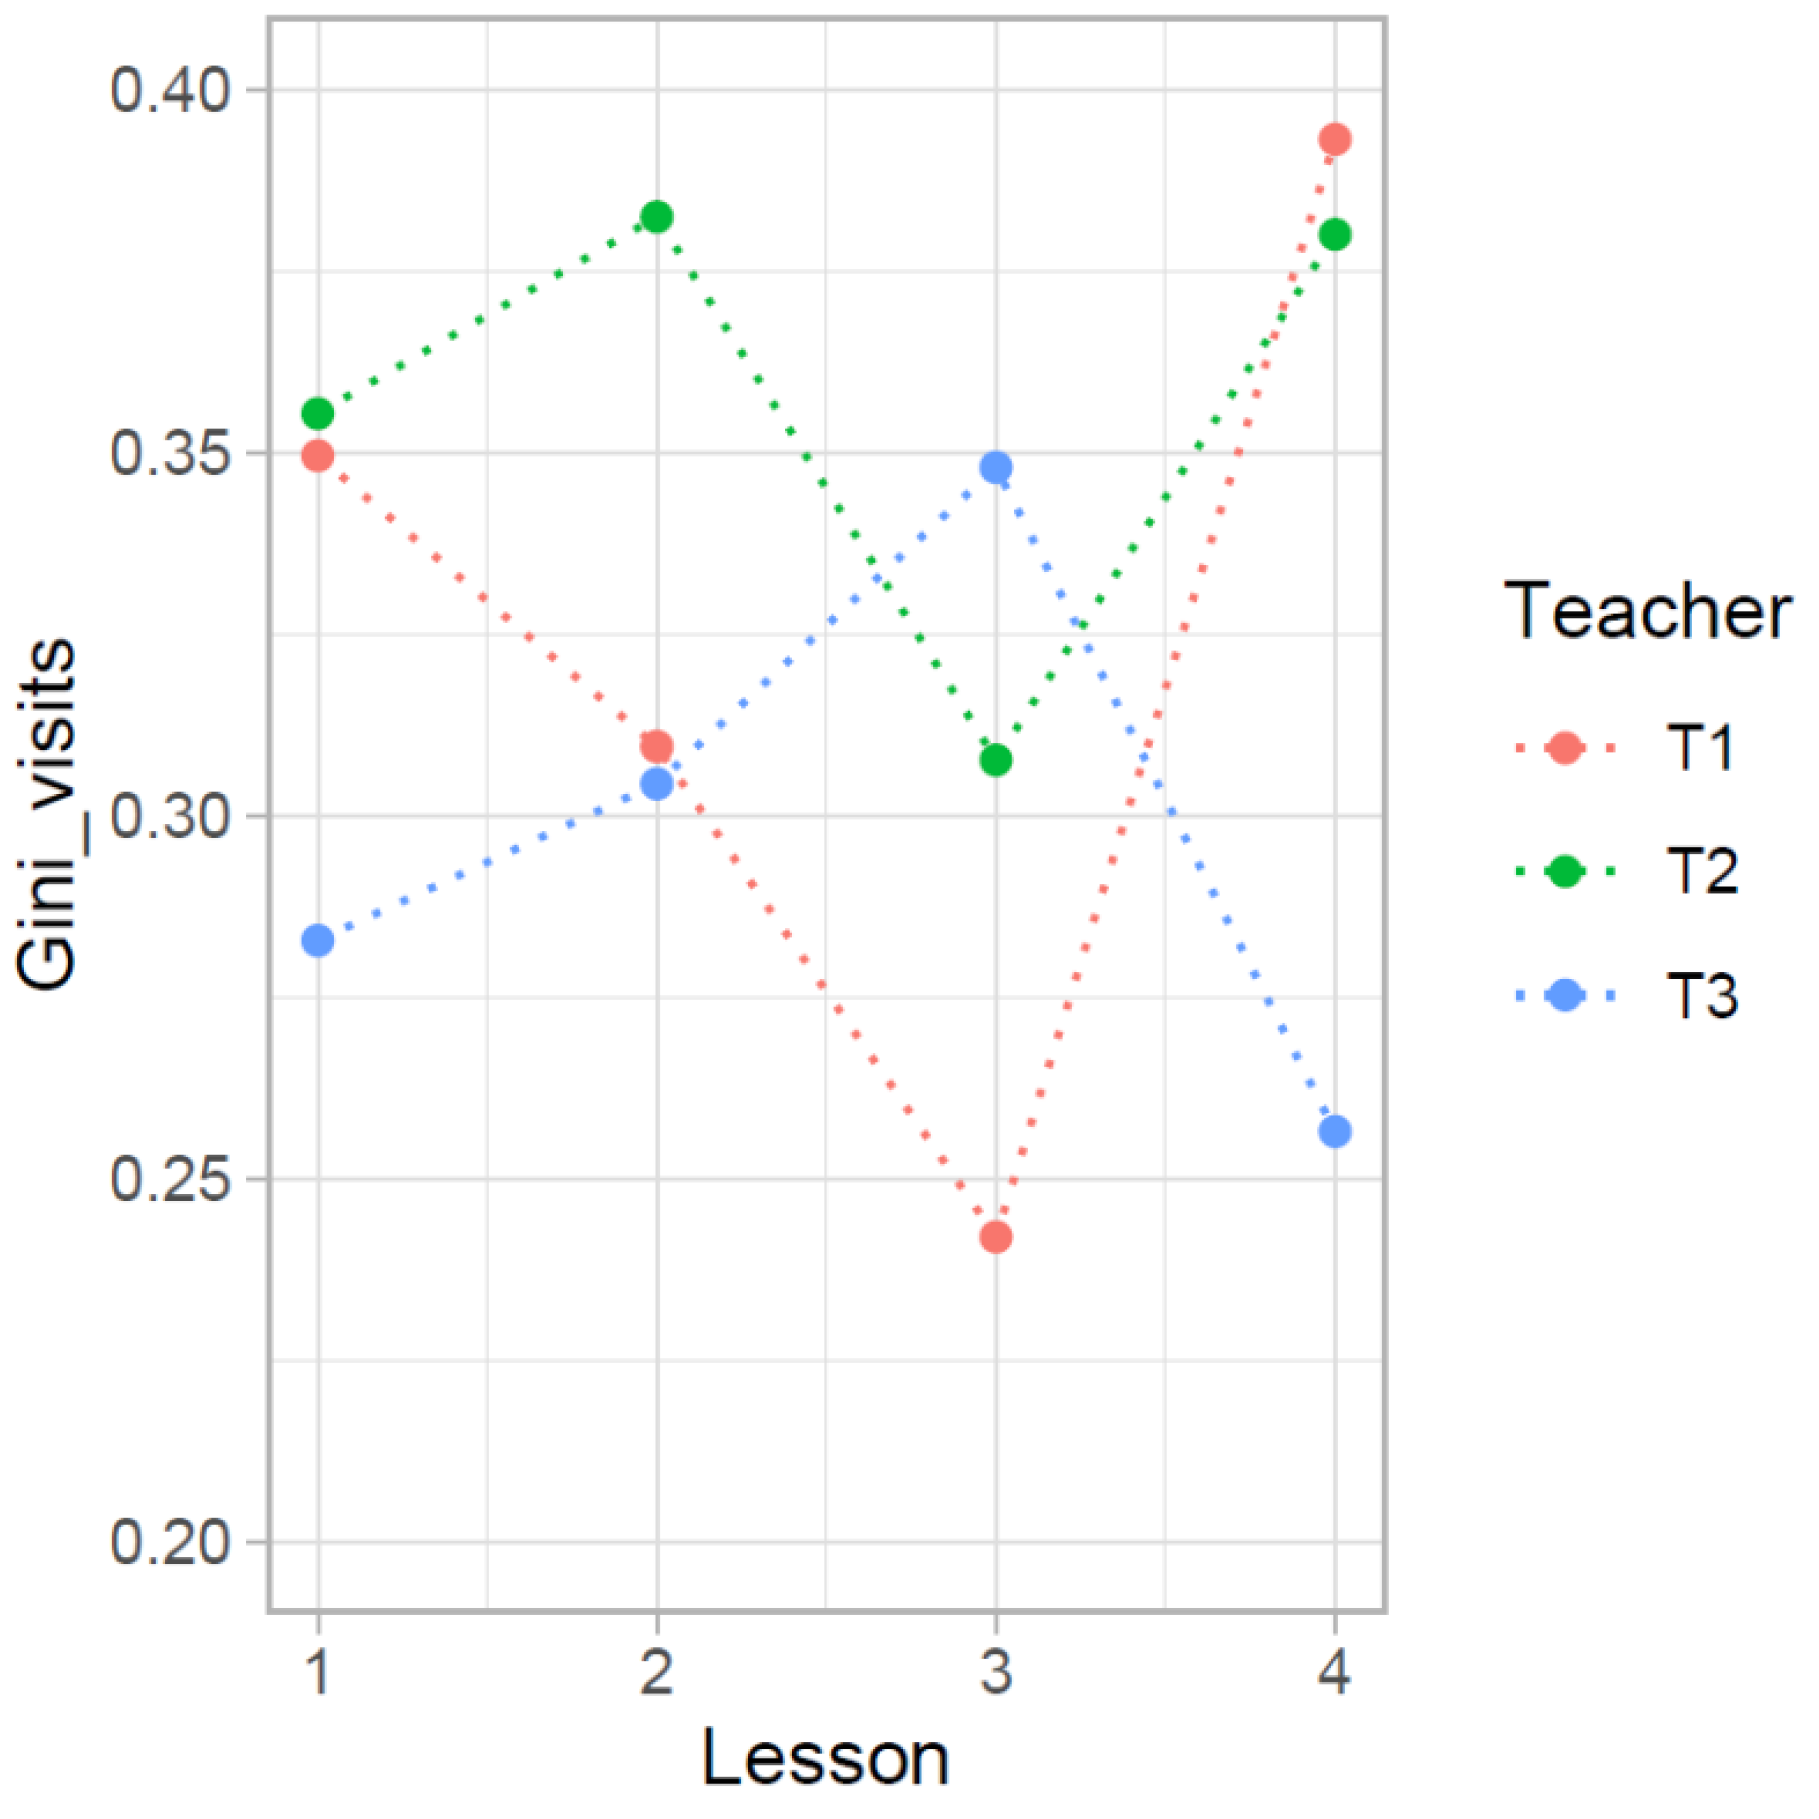
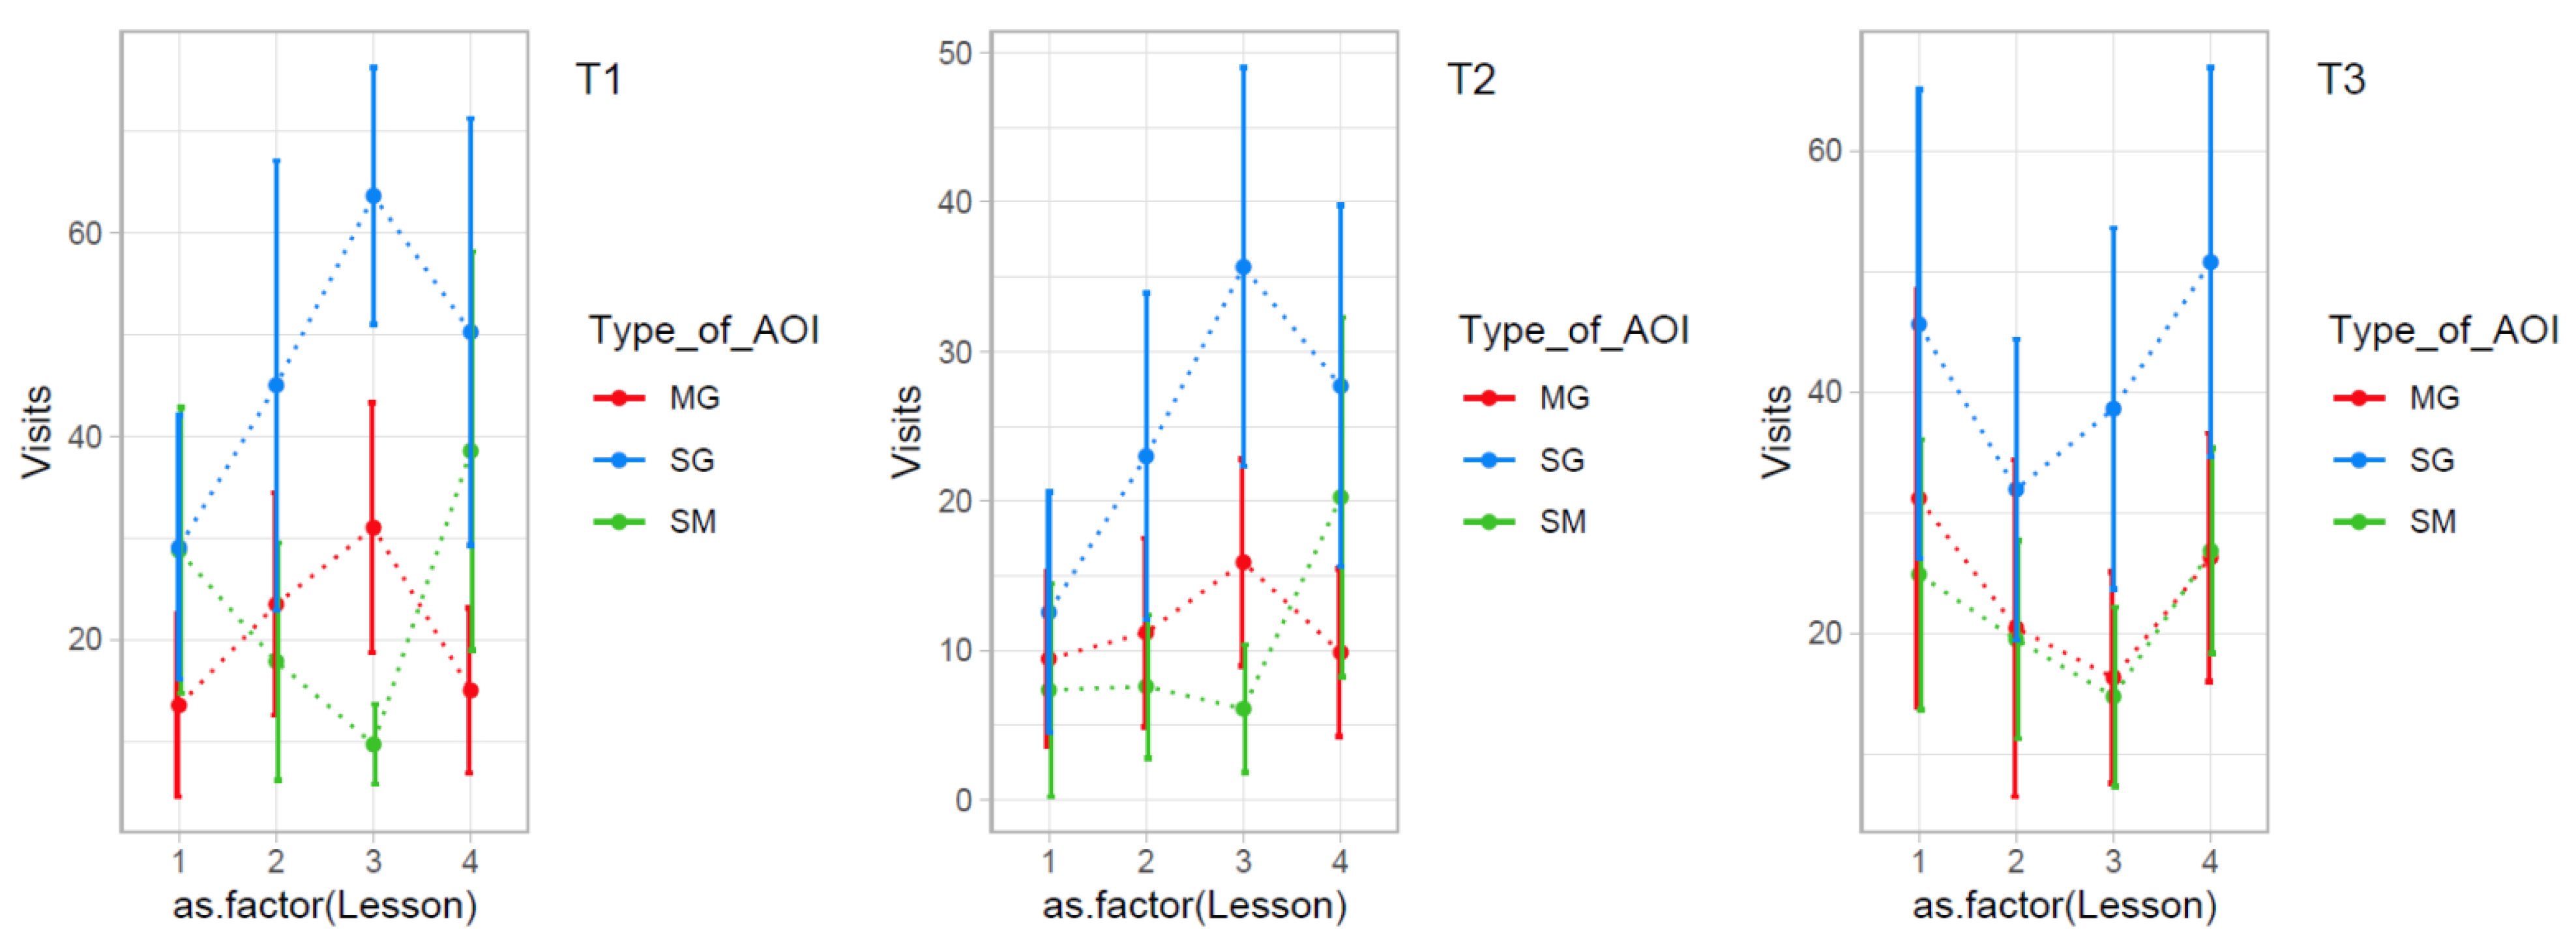
Variety in single gaze, mutual gaze and student material gaze over the 4 lessons
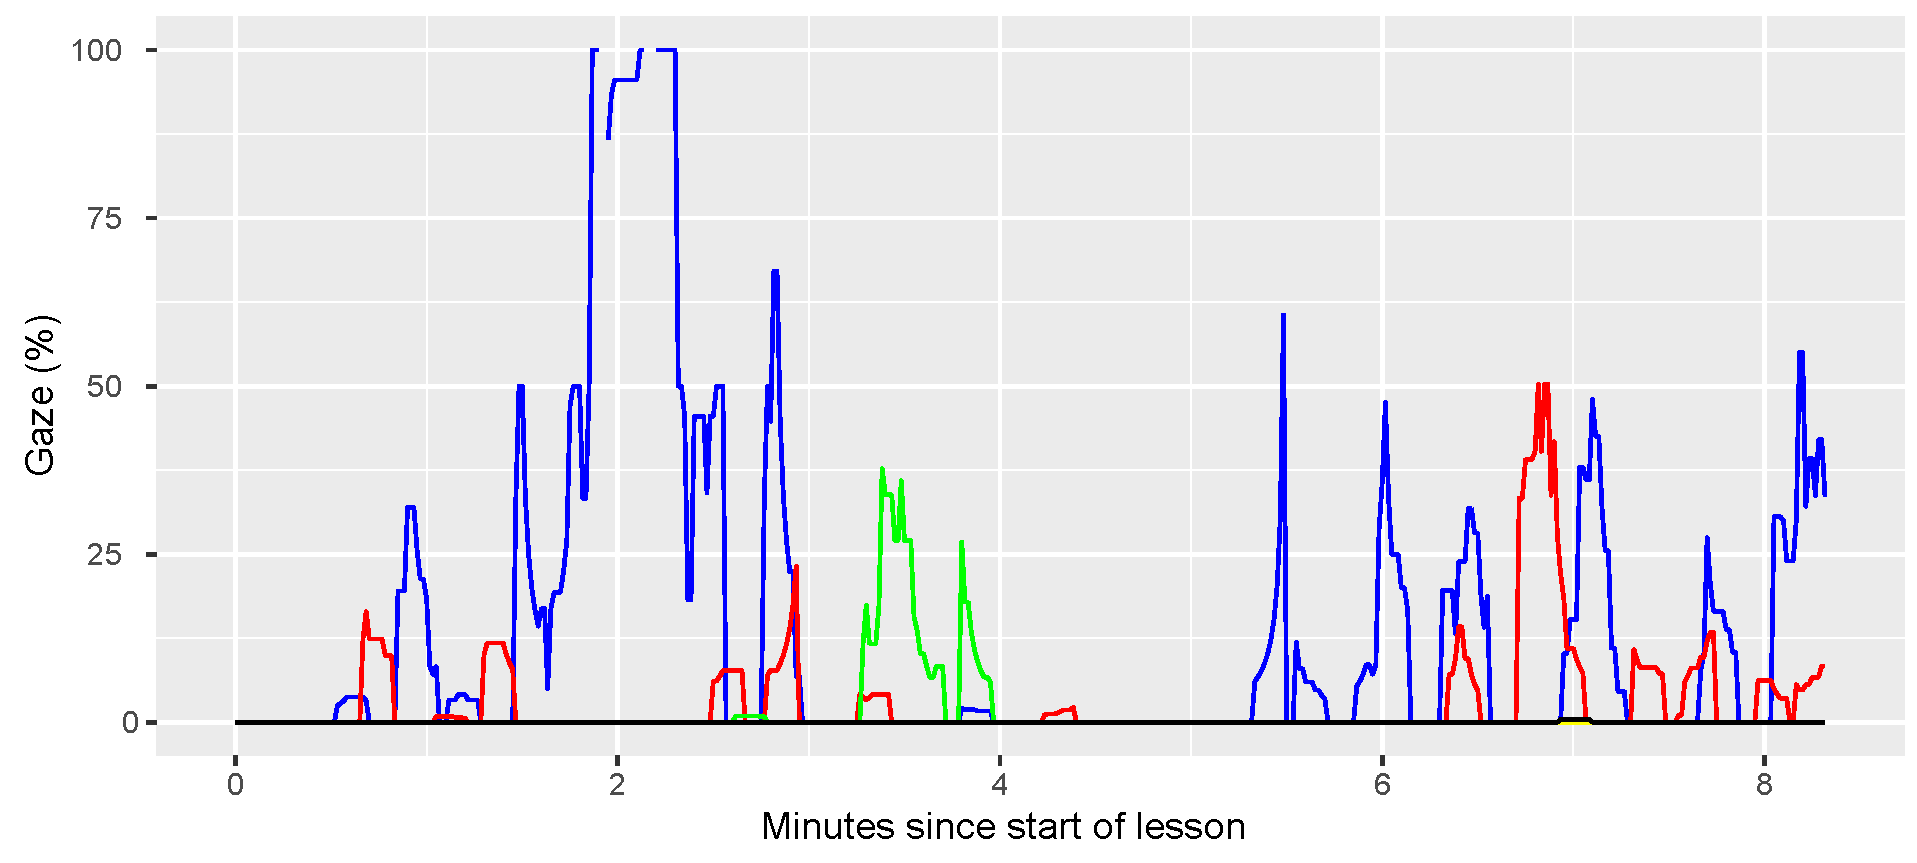
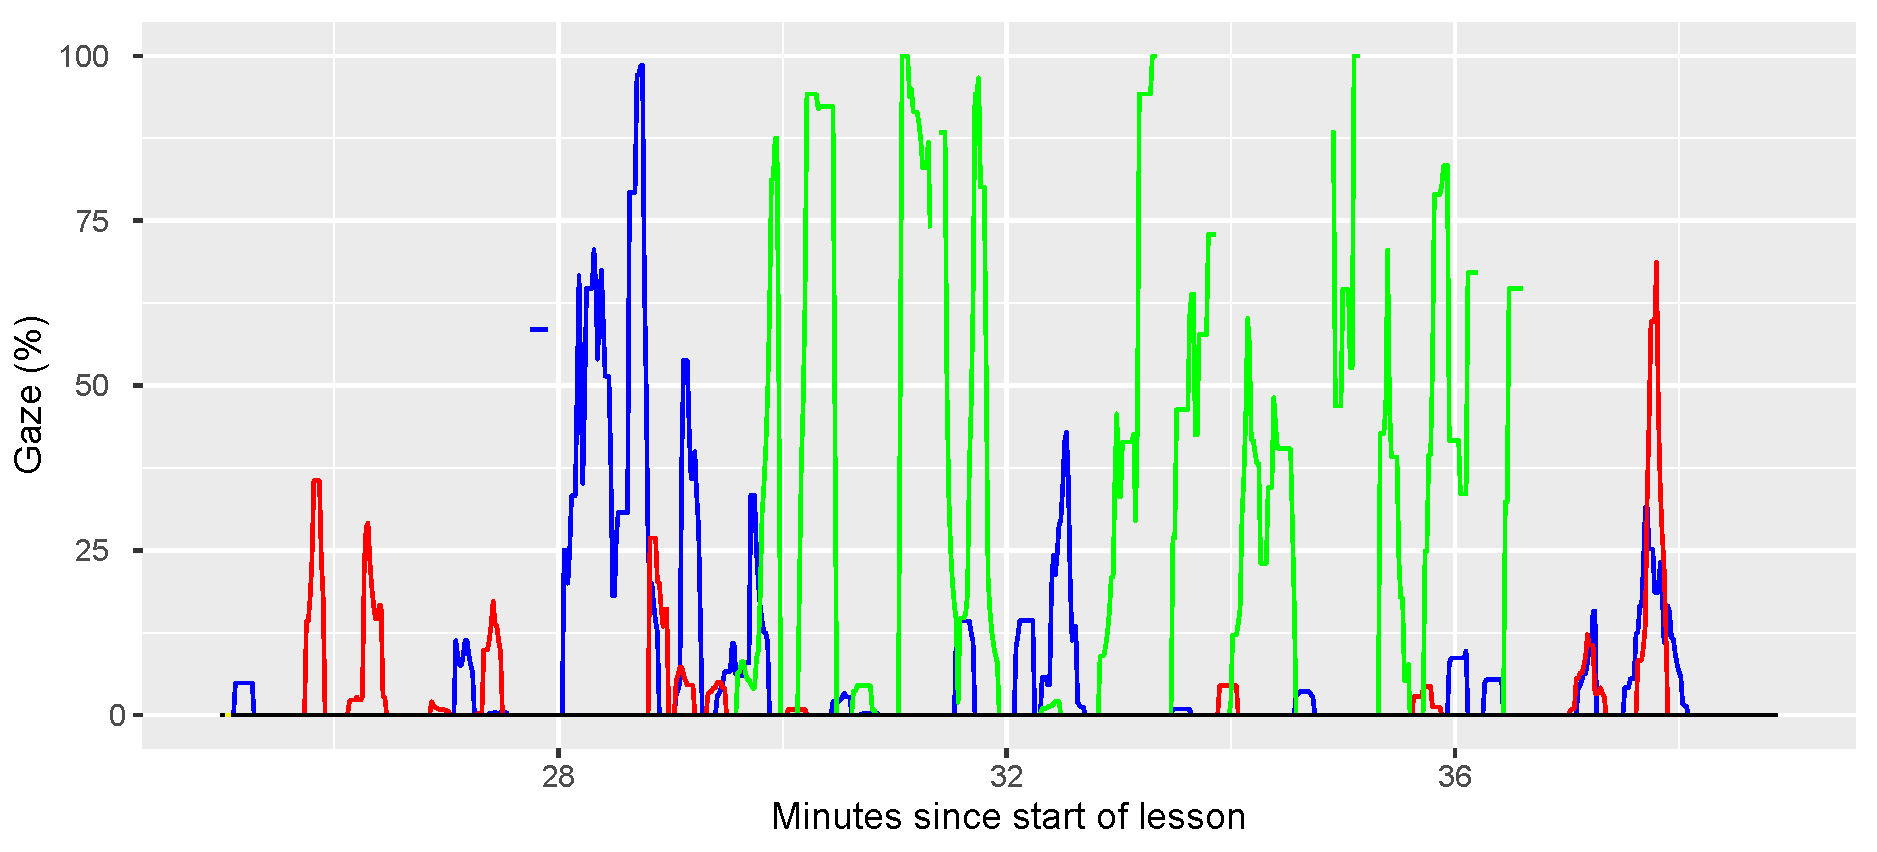
Data exploration for follow-up research
Discussion
Variety in the teachers' gaze distribution
Gaze distribution with respect to the three characteristics of the students
Frequency and duration of mutual gaze, single gaze, and gaze on student material
Variety in single gaze, mutual gaze and student material gaze over the 4 lessons
Future work
Ethics and Conflict of Interest
Acknowledgements
References
- Adams, R., and B. Biddle. 1970. The classroom scene. Realities of teaching. New York: Holt, Rinehart & Winston, Inc. [Google Scholar]
- Andersen, J. F. 1979. Teacher immediacy as a predictor of teacher effectiveness. In Communication yearbook 3. Edited by D. Nimmo. New Brunswick, NJ: Transaction Books: pp. 543–559. [Google Scholar]
- Aukrust, V. G. 2008. Boys’ and girls’ conversational participation across four grade levels in Norwegian classrooms: Taking the floor or being given the floor? Gender and Education 20, 3: 237–252. [Google Scholar] [CrossRef]
- Bellù, L. G., and P. Liberati. 2006. Describing income inequality: Theil index and entropy class indexes. FAO EASYPol, 051. Available online: http://www.fao.org/docs/up/easypol/445/theil_in- dex_051en.pdf.
- Birmingham, E., W. F. Bischof, and A. Kingstone. 2009. Get real! Resolving the debate about equivalent social stimuli. Visual Cognition 17, 6–7: 904–924. [Google Scholar] [CrossRef]
- Blomberg, G., K. Stürmer, and T. Seidel. 2011. How pre-service teachers observe teaching on video: Effects of viewers’ teaching subjects and the subject of the video. Teaching and Teacher Education 27: 1131–1140. [Google Scholar] [CrossRef]
- Breed, G., and V. Colaiuta. 1974. Looking, blinking, and sitting: Nonverbal dynamics in the classroom. Journal of Communication 24, 2: 75–81. [Google Scholar] [CrossRef] [PubMed]
- Brophy, J., and T. Good. 1970. Teachers' communication of differential expectations for children's classroom performance: Some behavioral data. Journal of Educational Psychology 61: 365–374. [Google Scholar] [CrossRef]
- Caproni, V., D. Levine, E. O'Neal, P. McDonald, and G. Garwood. 1977. Seating position, instructor’s eye contact availability, and student participation in a small seminar. The Journal of Social Psychology 103, 2: 315–316. [Google Scholar] [CrossRef]
- Cary, M. 1978. The role of gaze in the initiation of conversation. Social Psychology 41, 3: 269–271. [Google Scholar] [CrossRef]
- Chaikin, A., E. Sigler, and V. Derlega. 1974. Nonverbal mediators of teacher expectancy effects. Journal of Personality and Social Psychology 30, 1: 144–149. [Google Scholar] [CrossRef]
- Chen, F. S., J. A. Minson, M. Schöne, and M. Heinrichs. 2013. In the eye of the beholder: Eye contact increases resistance to persuasion. Psychological Science 24, 11: 2254–2261. [Google Scholar] [CrossRef]
- Cortina, K. S., K. F. Miller, R. McKenzie, and A. Epstein. 2015. Where low and high inference data converge: Validation of CLASS assessment of mathematics instruction using mobile eye tracking with expert and novice teachers. International Journal of Science and Mathematics Education 13, 2: 389–403. [Google Scholar] [CrossRef]
- Csibra, G., and G. Gergely. 2009. Natural pedagogy. Trends in Cognitive Sciences 13: 148–153. [Google Scholar] [CrossRef] [PubMed]
- Dessus, P., O. Cosnefroy, and V. Luengo. 2016. “Keep your eyes on ’em all!”: A mobile eye-tracking analysis of teachers ’sensitivity to students. Lecture Notes in Computer Science, 72–84. [Google Scholar] [CrossRef]
- DeWall, C. N., and J. K. Maner. 2008. High Status Men (but Not Women) Capture the Eye of the Beholder. Evolutionary Psychology 6, 2: 328–341. [Google Scholar] [CrossRef]
- Doherty-Sneddon, G., V. Bruce, L. Bonner, S. Longbotham, and C. Doyle. 2002. Development of gaze aversion as disengagement from visual information. Developmental Psychology 38: 438–445. [Google Scholar] [CrossRef] [PubMed]
- Doyle, W. 1977. Learning the classroom environment: an ecological analysis. Journal of Teacher Education 28, 6: 51–55. [Google Scholar] [CrossRef]
- Erden, F., and C. Wolfgang. 2004. An exploration of the differences in prekindergarten, kindergarten, and first grade teachers’ beliefs related to discipline when dealing with male and female students. Early Child Development and Care 174, 1: 3–11. [Google Scholar] [CrossRef]
- Ergin, A., and C. Birol. 2005. Egitimde Iletisim. Anı Yayıncılık. Ankara. Ankara. [Google Scholar]
- Exline, R. V., and L. C. Winters. 1965. Affective relations and mutual glances in dyads. In Affect, Cognition and Personality. Edited by S. Tomkins and C. Izzard. New York: Springer: pp. 319–330. [Google Scholar]
- Falck-Ytter, T., E. Thorup, and S. Bölte. 2015. Brief report: Lack of processing bias for the objects other people attend to in 3-year-olds with autism. Journal of autism and developmental disorders 45, 6: 1897–1904. [Google Scholar] [CrossRef]
- Feldman, R. S. 1976. Nonverbal disclosure of teacher deception and interpersonal affect. Journal of Educational Psychology 68, 6: 807–816. [Google Scholar] [CrossRef]
- Foulsham, T., J. T. Cheng, J. L. Tracy, J. Henrich, and A. Kingstone. 2010. Gaze allocation in a dynamic situation: Effects of social status and speaking. Cognition 117, 3: 319–331. [Google Scholar] [CrossRef]
- Francis, B. 2000. Boys, girls and achievement: Addressing the classroom issues. London: Routledge. [Google Scholar]
- Fry, R., and G. F. Smith. 1975. The effects of feedback and eye contact on performance of a digit-coding task. The Journal of Social Psychology 96, 1: 145–146. [Google Scholar] [CrossRef]
- Frymier, A. B. 1994. A model of immediacy in the classroom. Communication Quarterly 42, 2: 133–144. [Google Scholar] [CrossRef]
- Gallup, A. C., J. J. Hale, D. J. Sumpter, S. Garnier, A. Kacelnik, J. R. Krebs, and I. D. Couzin. 2012. Visual attention and the acquisition of information in human crowds. Proceedings of the National Academy of Sciences 109, 19: 7245–7250. [Google Scholar] [CrossRef]
- Garrahy, D. A. 2001. Three third-grade teachers' gender-related beliefs and behavior. The Elementary School Journal 102, 1: 81–94. [Google Scholar] [CrossRef]
- Gerpott, F. H., N. Lehmann-Willenbrock, J. D. Silvis, and M. Van Vugt. 2018. In the eye of the beholder? An eye-tracking experiment on emergent leadership in team interactions. Leadership Quarterly 29, 4: 523–532. [Google Scholar] [CrossRef]
- Gibson, J., and A. Pick. 1963. Perception of another person’s looking behavior. The American Journal of Psychology 76, 3: 386–394. [Google Scholar] [CrossRef]
- Glenberg, A., J. L. Schroeder, and D. A. Robertson. 1998. Averting the gaze disengages the environment and facilitates remembering. Memory and Cognition 26, 4: 651–658. [Google Scholar] [CrossRef]
- Good, T. L., and M. J. Findley. 1985. Sex role expectations and achievement. In Teacher expectations. Edited by J. B. Dusek. Hillsdale, NJ: Erlbaum: pp. 32–56. [Google Scholar]
- Good, T., and J. Brophy. 1987. Looking in classrooms, 4th ed. New York: Harper & Row. [Google Scholar]
- Good, T., H. Cooper, and S. Blakey. 1980. Classroom interaction as a function of teacher expectations, student sex, and time of year. Journal of Educational Psychology 72, 3: 378–385. [Google Scholar] [CrossRef]
- Good, T., J. Sikes, and J. Brophy. 1973. Effects of teacher sex and student sex on classroom interaction. Journal of Educational Psychology 65, 1: 74–87. [Google Scholar] [CrossRef]
- Gower, R., and S. Walters. 1983. Teaching practice handbook: a reference book for EFL teachers in training. Oxford: Heinemann. [Google Scholar]
- Hamlet, C. C., S. Axelrod, and S. Kuerschner. 1984. Eye contact as an antecedent to compliant behavior. Journal of Applied Behavior Analysis 17, 4: 553–557. [Google Scholar] [CrossRef]
- Hartley, G., and M. Karinch. 2007. I can read you like a book: How to spot the messages and emotions people are really sending with their body language. Franklin Lakes, NJ: Career Press. [Google Scholar]
- Hawkins, D. 2002. I, thou, and it. In The informed vision: essay on learning and human nature. Edited by D. Hawkins. New York: Algora Publishing. [Google Scholar]
- Helminen, T. M., S. M. Syriala, and J. K. Hietanen. 2011. Eye contact and arousal: The effects of stimulus duration. Biological Psychology 88, 1: 124–130. [Google Scholar] [CrossRef]
- Hietanen, J., J. Leppänen, M. Peltola, K. Linna-Aho, and H. Ruuhiala. 2008. Seeing direct and averted gaze activates the approach–avoidance motivational brain systems. Neuropsychologia 46, 9: 2423–2430. [Google Scholar] [CrossRef] [PubMed]
- Holland, E., E. B. Wolf, C. Looser, and A. Cuddy. 2017. Visual attention to powerful postures: People avert their gaze from nonverbal dominance displays. Journal of Experimental Social Psychology 68: 60–67. [Google Scholar] [CrossRef]
- Holmqvist, K., and R. Andersson. 2017. Eye-tracking: A comprehensive guide to methods, paradigms and measures. Lund: Lund Eye-Tracking Research Institute. [Google Scholar]
- Howe, C., and M. Abedin. 2013. Classroom dialogue: A systematic review across four decades of research. Cambridge Journal of Education 43, 3: 325–356. [Google Scholar] [CrossRef]
- Huang, L. 2011. Nonverbal communication in college English classroom teaching. Journal of Language Teaching and Research 2, 4: 903–908. [Google Scholar] [CrossRef]
- Irvine, J. J. 1986. Teacher–student interactions: Effects of student race, sex, and grade level. Journal of Educational Psychology 78, 1: 14–21. [Google Scholar] [CrossRef]
- Jones, S. M., and K. Dindia. 2004. A meta-analytic perspective on sex equity in the classroom. Review of Educational Research 74, 4: 443–471. [Google Scholar] [CrossRef]
- Jong, C. 2017. Extending equitable practices in teacher noticing: Commentary. In Teacher noticing: Bridging and broadening perspectives, contexts, and frameworks. Edited by E. O. Schack, M. H. Fisher and J. A. Wilhelm. Cham: Springer: pp. 207–214. [Google Scholar] [CrossRef]
- Just, M. A., and P. A. Carpenter. 1980. A theory of reading: From eye fixations to comprehension. Psychological Review 87: 329–354. [Google Scholar] [CrossRef]
- Kelley, D. H., and J. Gorham. 1988. Effects of immediacy on recall of information. Communication Education 37, 3: 198–207. [Google Scholar] [CrossRef]
- Kelly, A. 1988. Gender differences in teacher–pupil interactions: A meta-analytic review. Research in Education 39, 1: 1–23. [Google Scholar] [CrossRef]
- Kerssen-Griep, J., and P. Witt. 2012. Instructional feedback II: How do instructor immediacy cues and facework tactics interact to predict student motivation and fairness perceptions? Communication Studies 63, 4: 498–517. [Google Scholar] [CrossRef]
- Kim, W.-J., J.-H. Byeon, I.-S. Lee, and Y.-J. Kwon. 2012. Gaze differences between expert and novice teachers in science classes. 한국과학교육학회지 32, 9: 1443–1451. [Google Scholar] [CrossRef]
- Kingstone, A., D. Smilek, and J. D. Eastwood. 2008. Cognitive ethology: A new approach for studying human cognition. British Journal of Psychology 99, 3: 317–340. [Google Scholar] [CrossRef]
- Kirshner, D., and J. A. Whitson. 1998. Obstacles to understanding cognition as situated. Educational researcher 27, 8: 22–28. [Google Scholar] [CrossRef]
- Kleinke, C. L. 1986. Gaze and eye contact: A research review. Psychological Bulletin 100, 1: 78–100. [Google Scholar] [CrossRef]
- Knapp, M. L., and J. A. Hall. 1992. Nonverbal communication in human interaction. Fort Worth: Harcourt, Brace, Jovanovich. [Google Scholar]
- Laidlaw, K. E. W., T. Foulsham, G. Kuhn, and A. Kingstone. 2011. Potential social interactions are important to social attention. Proceedings of the National Academy of Sciences of the United States of America 108, 14: 5548–5553. [Google Scholar] [CrossRef] [PubMed]
- Ledbury, R., I. White, and S. Darn. 2004. The importance of eye contact in the classroom. The Internet TESL Journal 10, 8: 11–21. [Google Scholar]
- Maner, J. K., C. N. Dewall, and M. T. Gailliot. 2008. Selective attention to signs of success: Social dominance and early stage interpersonal perception. Personality and Social Psychology Bulletin 34, 4: 488–501. [Google Scholar] [CrossRef]
- Marx, A., U. Fuhrer, and T. Hartig. 1999. Effects of classroom seating arrangements on children’s question-asking. Learning Environments Research 2, 3: 249–263. [Google Scholar] [CrossRef]
- McCorskey, J. C., and R. W. McVetta. 1978. Classroom seating arrangements: Instructional communication theory versus student preferences. Communication Education 27, 2: 99–111. [Google Scholar] [CrossRef]
- McCroskey, J. C., V. P. Richmond, A. Sallinen, J. M. Fayer, and R. A. Barraclough. 1995. A cross-cultural and multi-behavioral analysis of the relationship between nonverbal immediacy and teacher evaluation. Communication Education 44, 4: 281–291. [Google Scholar] [CrossRef]
- McIntyre, N. A., and T. Foulsham. 2018. Scanpath analysis of expertise and culture in teacher gaze in realworld classrooms. Instructional Science 46, 3: 435–455. [Google Scholar] [CrossRef]
- McIntyre, N. A., H. Jarodzka, and R. M. Klassen. 2019. Capturing teacher priorities: Using real-world eyetracking to investigate expert teacher priorities across two cultures. Learning and Instruction 60: 215–224. [Google Scholar] [CrossRef]
- McIntyre, N. A., M. T. Mainhard, and R. M. Klassen. 2017. Are you looking to teach? Cultural, temporal and dynamic insights into expert teacher gaze. Learning and Instruction 49: 41–53. [Google Scholar] [CrossRef]
- McIntyre, N. A., K. T. Mulder, and M. T. Mainhard. 2020. Looking to relate: teacher gaze and culture in student-rated teacher interpersonal behaviour. Social Psychology of Education 23: 411–431. [Google Scholar] [CrossRef]
- Measor, L., and P. Sykes. 1992. Gender and schools. New York: Cassell. [Google Scholar]
- Mitchell, R. N., and K. A. Marin. 2015. Examining the use of a structured analysis framework to support prospective teacher noticing. Journal of Mathematics Teacher Education 18, 6: 551–575. [Google Scholar] [CrossRef]
- Montello, D. R. 1988. Classroom seating location and its effect on course achievement, participation, and attitudes. Journal of Environmental Psychology 8, 2: 149–157. [Google Scholar] [CrossRef]
- Mussard, S., F. Seyte, and M. Terraza. 2003. Decomposition of Gini and the Generalized Entropy Inequality Measures. Economics Bulletin 4, 7: 1–6. [Google Scholar]
- Myhill, D. 2002. Bad boys and good girls? Patterns of interaction and response in whole class teaching. British Educational Research Journal 28, 3: 339–352. [Google Scholar] [CrossRef]
- Neill, S. R., and C. Caswell. 1993. Body language for competent teachers. London; New York: Routledge. [Google Scholar]
- Noddings, N. 2003. Happiness and education. Cambridge: Cambridge University Press. [Google Scholar] [CrossRef]
- Ohrn, E. 1993. Gender, influence and resistance in school. British Journal of Sociology of Education 14, 2: 147–158. [Google Scholar] [CrossRef]
- Otteson, J. P., and C. R. Otteson. 1980. Effect of teacher’s gaze on children’s story recall. Perceptual and Motor Skills 50, 1: 35–42. [Google Scholar] [CrossRef]
- Pease, A., and B. Pease. 2006. The definitive book of body language (Bantam hardcover ed.): The hidden meaning behind people's gestures and expressions. New York: Bantam. [Google Scholar]
- Pedersen, D. M. 1977. Relationship of ratings of classroom performance and enjoyment with seat selection. Perceptual and Motor Skills 45, 2: 601–602. [Google Scholar] [CrossRef]
- Pedersen, D. M. 1994. Personality and classroom seating. Perceptual and Motor Skills 78, 3: 1355–1360. [Google Scholar] [CrossRef]
- Phelps, F., G. Doherty-Sneddon, and H. Warnock. 2006. Helping children think: Gaze aversion and teaching. British Journal of Developmental Psychology 24, 3: 577–588. [Google Scholar] [CrossRef]
- Píšová, M., S. Hanušová, K. Kostková, V. Janíková, P. Najvar, and F. Tůma. 2013. Učitel expert: jeho charakteristiky a determinanty profesního rozvoje (na pozadí výuky cizích jazyků). Brno: Masarykova univerzita. [Google Scholar]
- Pollitt, L. 2006. Classroom Management. Tesol Course Articles. Available online: http://www.tesolcourse.com.
- Prieto, L. P., K. Sharma, and P. Dillenbourg. 2015. Studying teacher orchestration load in technology-enhanced classrooms. In Design for teaching and learning in a networked world. Edited by G. Conole, T. Klobučar, Ch. Rensing, J. Konert, E. Lavoué and et al. Heidelberg: Springer International Publishing: pp. 268–281. [Google Scholar] [CrossRef]
- Raider-Roth, M. B., M. K. Albert, I. Bircann-Barkey, E. Gidseg, and T. Murray. 2008. Teaching boys: A relational puzzle. Teachers College Record 110, 2: 443–481. [Google Scholar] [CrossRef]
- Richmond, V. P., J. S. Gorham, and J. C. McCroskey. 1987. The relationship between selected immediacy behaviors and cognitive learning. In Communication yearbook 10. Edited by M. L. Mclaughlin. Newbury Park, CA: Sage: pp. 574–590. [Google Scholar]
- Risko, E. F., D. C. Richardson, and A. Kingstone. 2016. Breaking the fourth wall of cognitive science realworld social attention and the dual function of gaze. Current Directions in Psychological Science 25, 1: 70–74. [Google Scholar] [CrossRef]
- Rosenthal, R., and L. Jacobson. 1966. Teachers’ expectancies: Determinants of pupils’ IQ gains. Psychological Reports 19, 1: 115–118. [Google Scholar] [CrossRef] [PubMed]
- Sadker, M., D. Sadker, and K. R. Zittleman. 2009. Still failing at fairness: How gender bias cheats girls and boys in school and what we can do about it. New York, NY: Simon and Schuster. [Google Scholar]
- Santagata, R. 2011. From teacher noticing to a framework for analyzing and improving classroom lessons. In Mathematics teacher noticing. Edited by M. S. Sherin, V. R. Jacobs and R. A. Philipp. New York: Routledge: pp. 152–168. [Google Scholar]
- Schnitzerová, E., and E. Račková. 1995. Niektoré kvantitatívne charakteristiky pedagogickej interakcie. Psychológia a patopsychológia dieťaťa 3: 293–301. [Google Scholar]
- Schwebel, A. I., and D. L. Cherlin. 1972. Physical and social distancing in teacher-pupil relationships. Journal of Educational Psychology 63, 6: 543–550. [Google Scholar] [CrossRef]
- Segrin, C. 1993. The effects of nonverbal behavior on outcomes of compliance gaining attempts. Communication Studies 44, 3–4: 169–187. [Google Scholar] [CrossRef]
- Senju, A., and M. A. Johnson. 2009. The eye contact effect: Mechanisms and development. Trends in Cognitive Sciences 13, 3: 127–134. [Google Scholar] [CrossRef]
- Mathematics teacher noticing. Seeing through teachers’ eyes. 2011. Sherin, M. G., V. R. Jacobs, and R. A. Philipp, eds. New York: Routledge. [Google Scholar]
- Sherin, M. G., R. S. Russ, B. L. Sherin, and A. Colestock. 2008. Professional vision in action: An exploratory study. Issues in Teacher Education 17, 2: 27–46. [Google Scholar]
- Sherwood, J. V. 1987. Facilitative effects of gaze upon learning. Perceptual and Motor Skills 64, 3c: 1275–1278. [Google Scholar] [CrossRef]
- Smith, T. J., and P. K. Mital. 2013. Attentional synchrony and the influence of viewing task on gaze behavior in static and dynamic scenes. Journal of Vision 13, 8: 16. [Google Scholar] [CrossRef]
- Snyder, D. W. 1998. Classroom management for student teachers. Music Educators Journal 84, 4: 37–40. [Google Scholar] [CrossRef]
- Sommer, R. 1967. Classroom ecology. Journal of Applied Behavioral Science 3, 4: 489–503. [Google Scholar] [CrossRef]
- Sommer, R. 1969. Personal Space. Englewood Cliffs, New Jersey: Prentice-Hall. [Google Scholar]
- Spender, D. 1982. Invisible women. The schooling scandal. Trowbridge: Writers and Readers Publishing. [Google Scholar]
- Stake, J. E., and J. F. Katz. 1982. Teacher–pupil relationships in the elementary school classroom: Teachergender and pupil-gender differences. American Educational Research Journal 19, 3: 465–471. [Google Scholar] [CrossRef]
- Stires, L. 1980. Classroom seating location, student grades, and attitudes: Environment or self-selection? Environment and Behavior 12, 2: 241–254. [Google Scholar] [CrossRef]
- Stürmer, K., T. Seidel, K. Mueller, J. Häusler, and K. S. Cortina. 2017. What is in the eye of preservice teachers while instructing? An eye-tracking study about attention processes in different teaching situations. Zeitschrift für Erziehungswissenschaft 20, 1: 75–92. [Google Scholar] [CrossRef]
- Totusek, P. F., and A. Q. Staton-Spicer. 1982. Classroom seating preference as a function of student personality. The Journal of Experimental Education 50, 3: 159–163. [Google Scholar] [CrossRef]
- Tsouroufli, M. 2002. Gender and teachers’ classroom practice. Gender and Education 14, 2: 135–147. [Google Scholar] [CrossRef]
- van Manen, M. 2013. The call of pedagogy as the call of contact. Phenomenology & Practice 6, 8: 8–34. [Google Scholar] [CrossRef]
- Walkoe, J. 2015. Exploring teacher noticing of student algebraic thinking in a video club. Journal of Mathematics Teacher Education 18, 6: 523−550. [Google Scholar] [CrossRef]
- Warrington, M., and M. Younger. 2000. The Other Side of the Gender Gap. Gender and Education 12, 4: 493–508. [Google Scholar] [CrossRef]
- Waxer, P. H. 1974. Therapist training in nonverbal communication I: Nonverbal cues for depression. Journal of clinical psychology 30, 2: 215–218. [Google Scholar] [CrossRef]
- Witt, P. L., R. L. Wheeless, and M. Allen. 2004. A meta-analytical review of the relationship between teacher immediacy and student learning. Communication Monographs 71, 2: 184–207. [Google Scholar] [CrossRef]
- Wolff, C. E., H. Jarodzka, N. van den Bogert, and H. P. Boshuizen. 2016. Teacher vision: Expert and novice teachers’ perception of problematic classroom management scenes. Instructional Science 44, 3: 243–265. [Google Scholar] [CrossRef]
- WoolFolk, R. L., and A. E. WoolFolk. 1974. Nonverbal teacher behaviors: A rejoinder. American Educational Research Journal 11, 3: 307–309. [Google Scholar] [CrossRef]
- Younger, M., and M. Warrington. 1996. Differential achievement of girls and boys at GCSE: Some observations from the perspective of one school. British journal of Sociology of Education 17, 3: 299–313. [Google Scholar] [CrossRef]
- Younger, M., M. Warrington, and R. McLellan. 2005. Raising boys’ achievements in secondary school: Issues, dilemmas and opportunities. Maidenhead: Open University Press. [Google Scholar]
- Younger, M., M. Warrington, and J. Williams. 1999. The gender gap and classroom interactions: Reality and rhetoric? British Journal of Sociology of Education 20, 3: 327–343. [Google Scholar] [CrossRef]


 |
 |
| T1 | T2 | T3 | ||||
| Abs. | Rel. | Abs. | Rel. | Abs. | Rel. | |
| diff. | diff. | diff. | diff. | diff. | diff. | |
| Visits | Visits | Visits | Visits | Visits | Visits | |
| Lesson 1 | 71 | 6.5 | 38 | 7.6 | 136 | 9.1 |
| Lesson 2 | 99 | 3.7 | 62 | 10.3 | 87 | 3.9 |
| Lesson 3 | 57 | 0.8 | 81 | 6.8 | 73 | 3.2 |
| Lesson 4 | 83 | 2.8 | 66 | 16.5 | 87 | 2.5 |
| MEAN | 78 | 3.5 | 62 | 10.3 | 96 | 4.5 |
| T1 | T2 | T3 | MEAN | |
| Visits | 0.36 | 0.37 | 0.31 | 0.35 |
| T1 | T2 | T3 | MEAN | |
| Average dwells | 0.19 | 0.21 | 0.19 | 0.20 |
| Number of fixations | 0.41 | 0.43 | 0.33 | 0.39 |
| Relative dwell time | 0.41 | 0.44 | 0.34 | 0.40 |
| Fixation durations | 0.10 | 0.12 | 0.08 | 0.10 |
| VISITS | T1 | T2 | T3 | MEAN |
| MG | 0.188 | 0.094 | 0.304 | 0.195 |
| SG | 0.295 | 0.203 | 0.184 | 0.227 |
| SM | 0.527 | 0.501 | 0.184 | 0.404 |
| F | 0.275 | 0.279 | 0.185 | 0.247 |
| M | 0.150 | 0.353 | 0.262 | 0.255 |
| High | 0.204 | 0.324 | 0.190 | 0.240 |
| Low | 0.133 | 0.247 | 0.286 | 0.222 |
| IN | 0.173 | 0.301 | 0.237 | 0.237 |
| OUT | 0.310 | 0.370 | 0.227 | 0.303 |
| MEAN | 0.251 | 0.297 | 0.229 |
Copyright © 2020. This article is licensed under a Creative Commons Attribution 4.0 International License.
Share and Cite
Smidekova, Z.; Janik, M.; Minarikova, E.; Holmqvist, K. Teachers’ Gaze over Space and Time in a Real-World Classroom. J. Eye Mov. Res. 2020, 13, 1-20. https://doi.org/10.16910/jemr.13.4.1
Smidekova Z, Janik M, Minarikova E, Holmqvist K. Teachers’ Gaze over Space and Time in a Real-World Classroom. Journal of Eye Movement Research. 2020; 13(4):1-20. https://doi.org/10.16910/jemr.13.4.1
Chicago/Turabian StyleSmidekova, Zuzana, Miroslav Janik, Eva Minarikova, and Kenneth Holmqvist. 2020. "Teachers’ Gaze over Space and Time in a Real-World Classroom" Journal of Eye Movement Research 13, no. 4: 1-20. https://doi.org/10.16910/jemr.13.4.1
APA StyleSmidekova, Z., Janik, M., Minarikova, E., & Holmqvist, K. (2020). Teachers’ Gaze over Space and Time in a Real-World Classroom. Journal of Eye Movement Research, 13(4), 1-20. https://doi.org/10.16910/jemr.13.4.1