Improving the Pilot Selection Process by Using Eye-Tracking Tools
Abstract
:1. Introduction
2. Background
2.1. Psychological selection test
2.2. Flight screening selection
2.3. Traditional EM measure and its application in pilot selection process
2.4. Network-based EM analysis


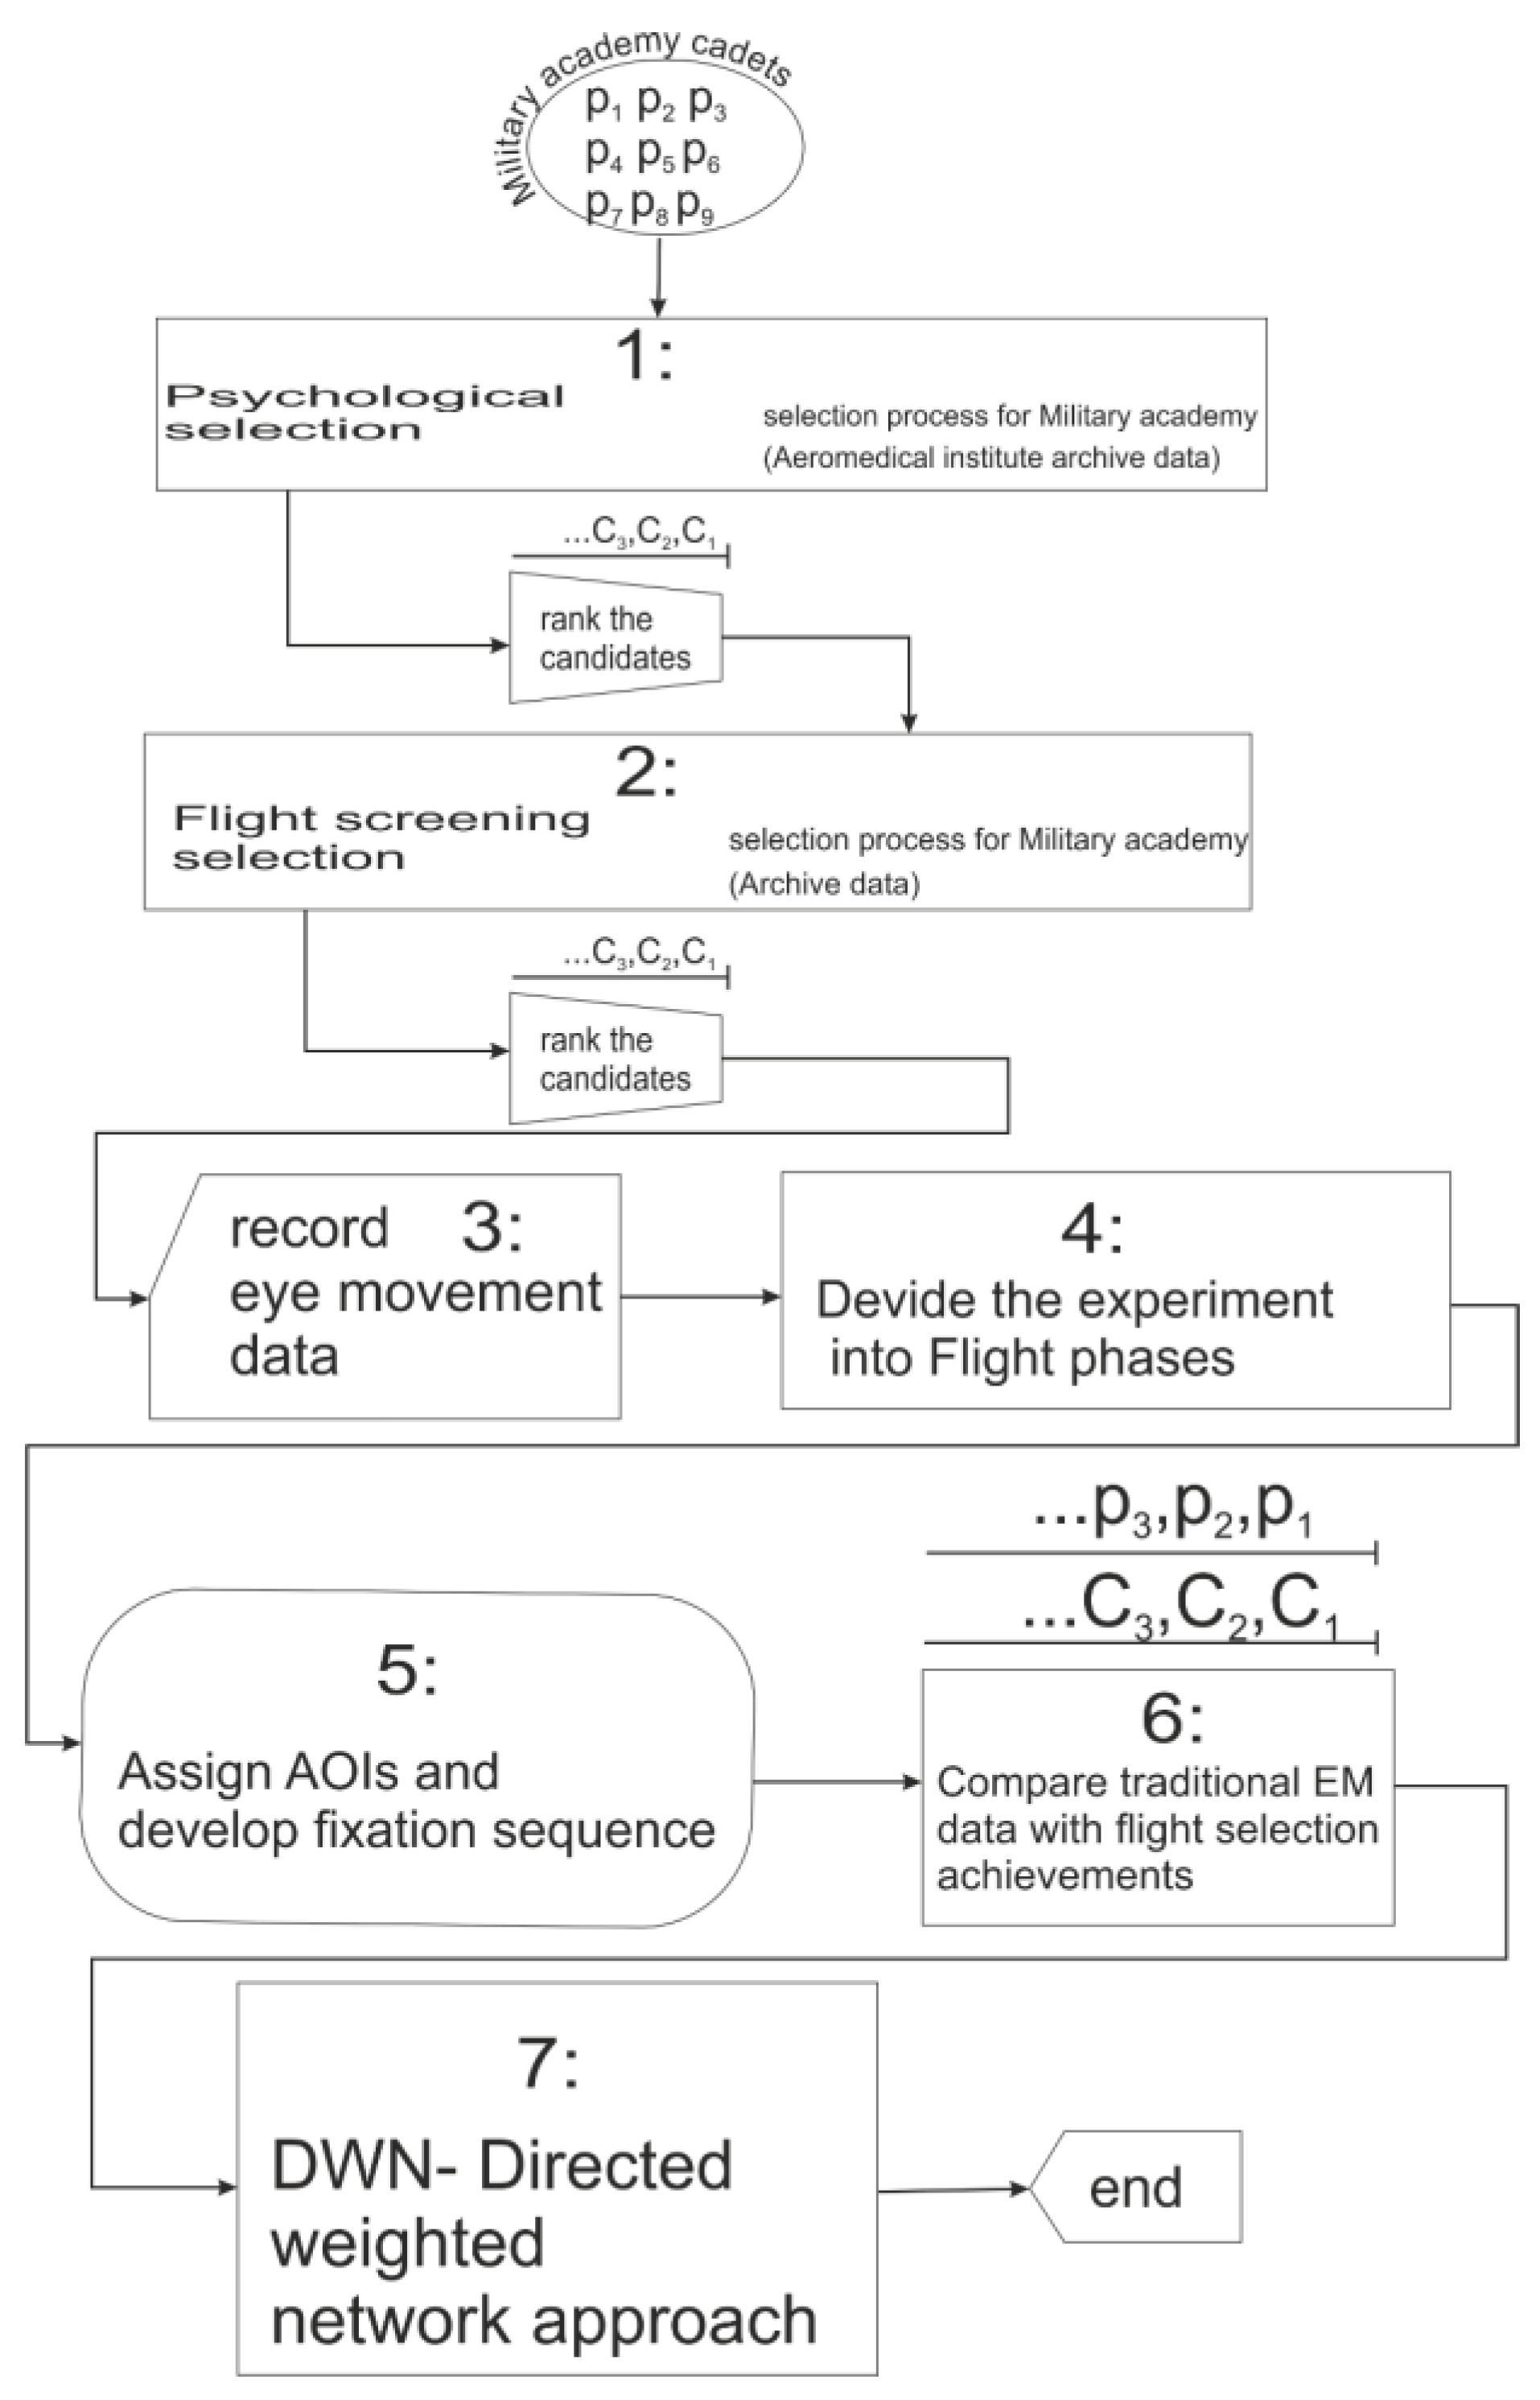
3. Proposed Methodology
3.1. Step 1. Collecting the results from the psychological selection
3.2. Step 2. Collecting the results from the Flight screening
3.3. Step 3. Collecting the participant’s EM data
3.4. Step 4. Dividing the experiment into the time intervals (flight phases)
3.5. Step 5. Defining the AOIs and developing AOI fixation sequence
3.6. Step 6. Comparison of traditional EM data with flight selection achievements
3.7. Step 7. Application of directed weighted network approach
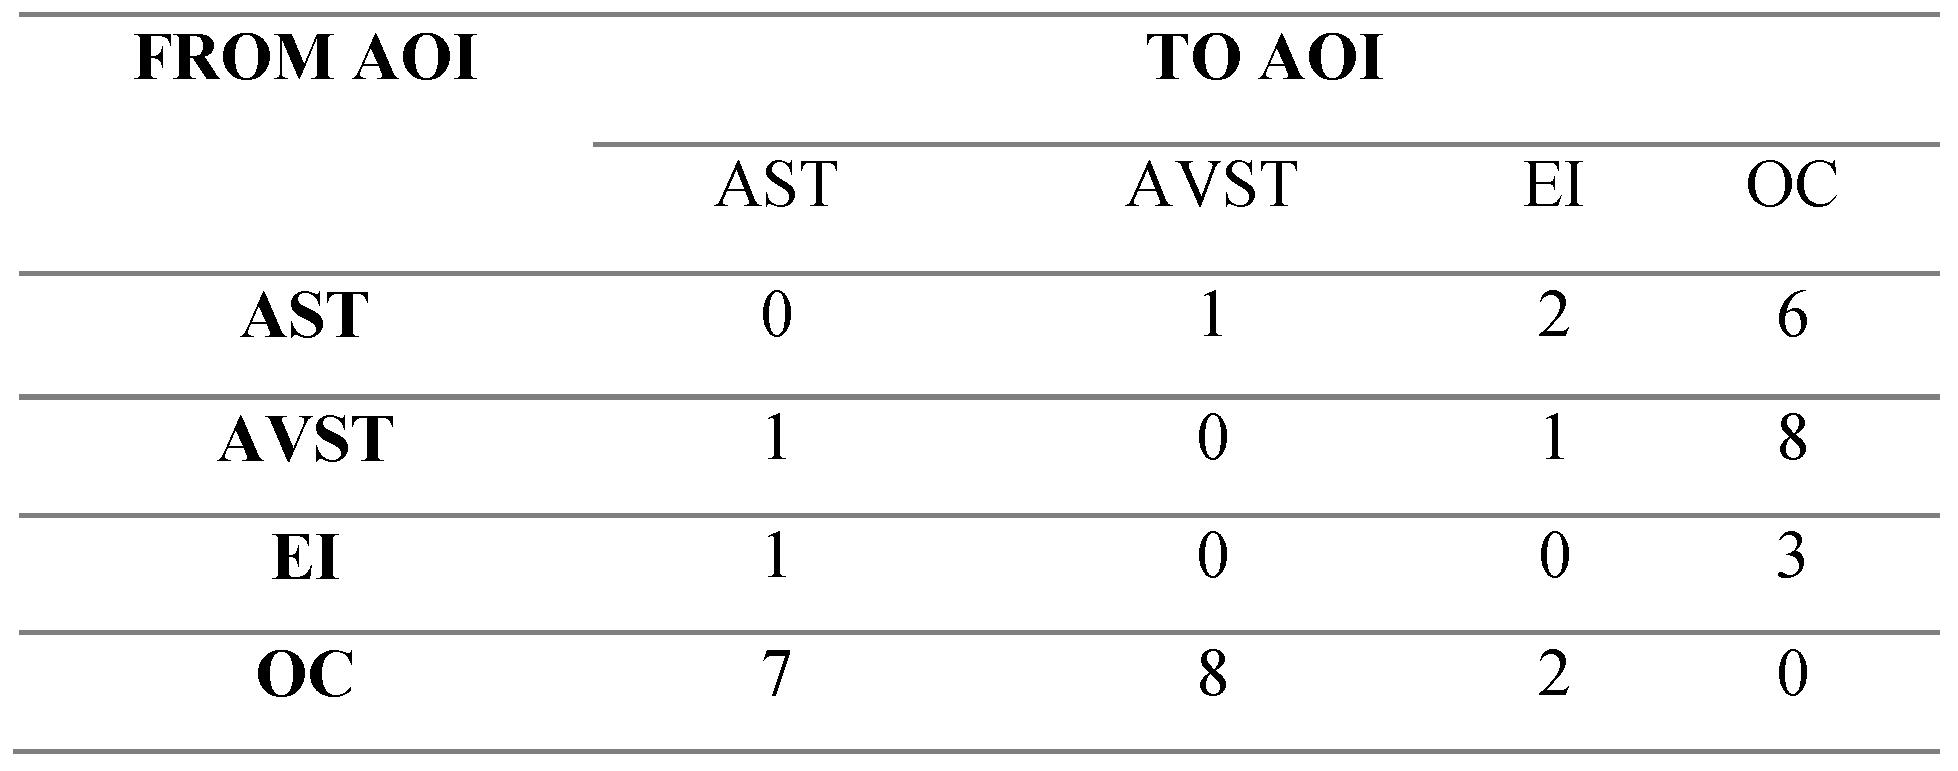
3.7.1. Developing the AOI transition matrices for the selected time intervals
3.7.2. Developing the DWN visualizations
3.7.3. Calculate and visualize target (or AOI) importance measures

4. Experiment
4.1. Scenario
4.2. Tasks
4.3. Participants
4.4. Apparatus
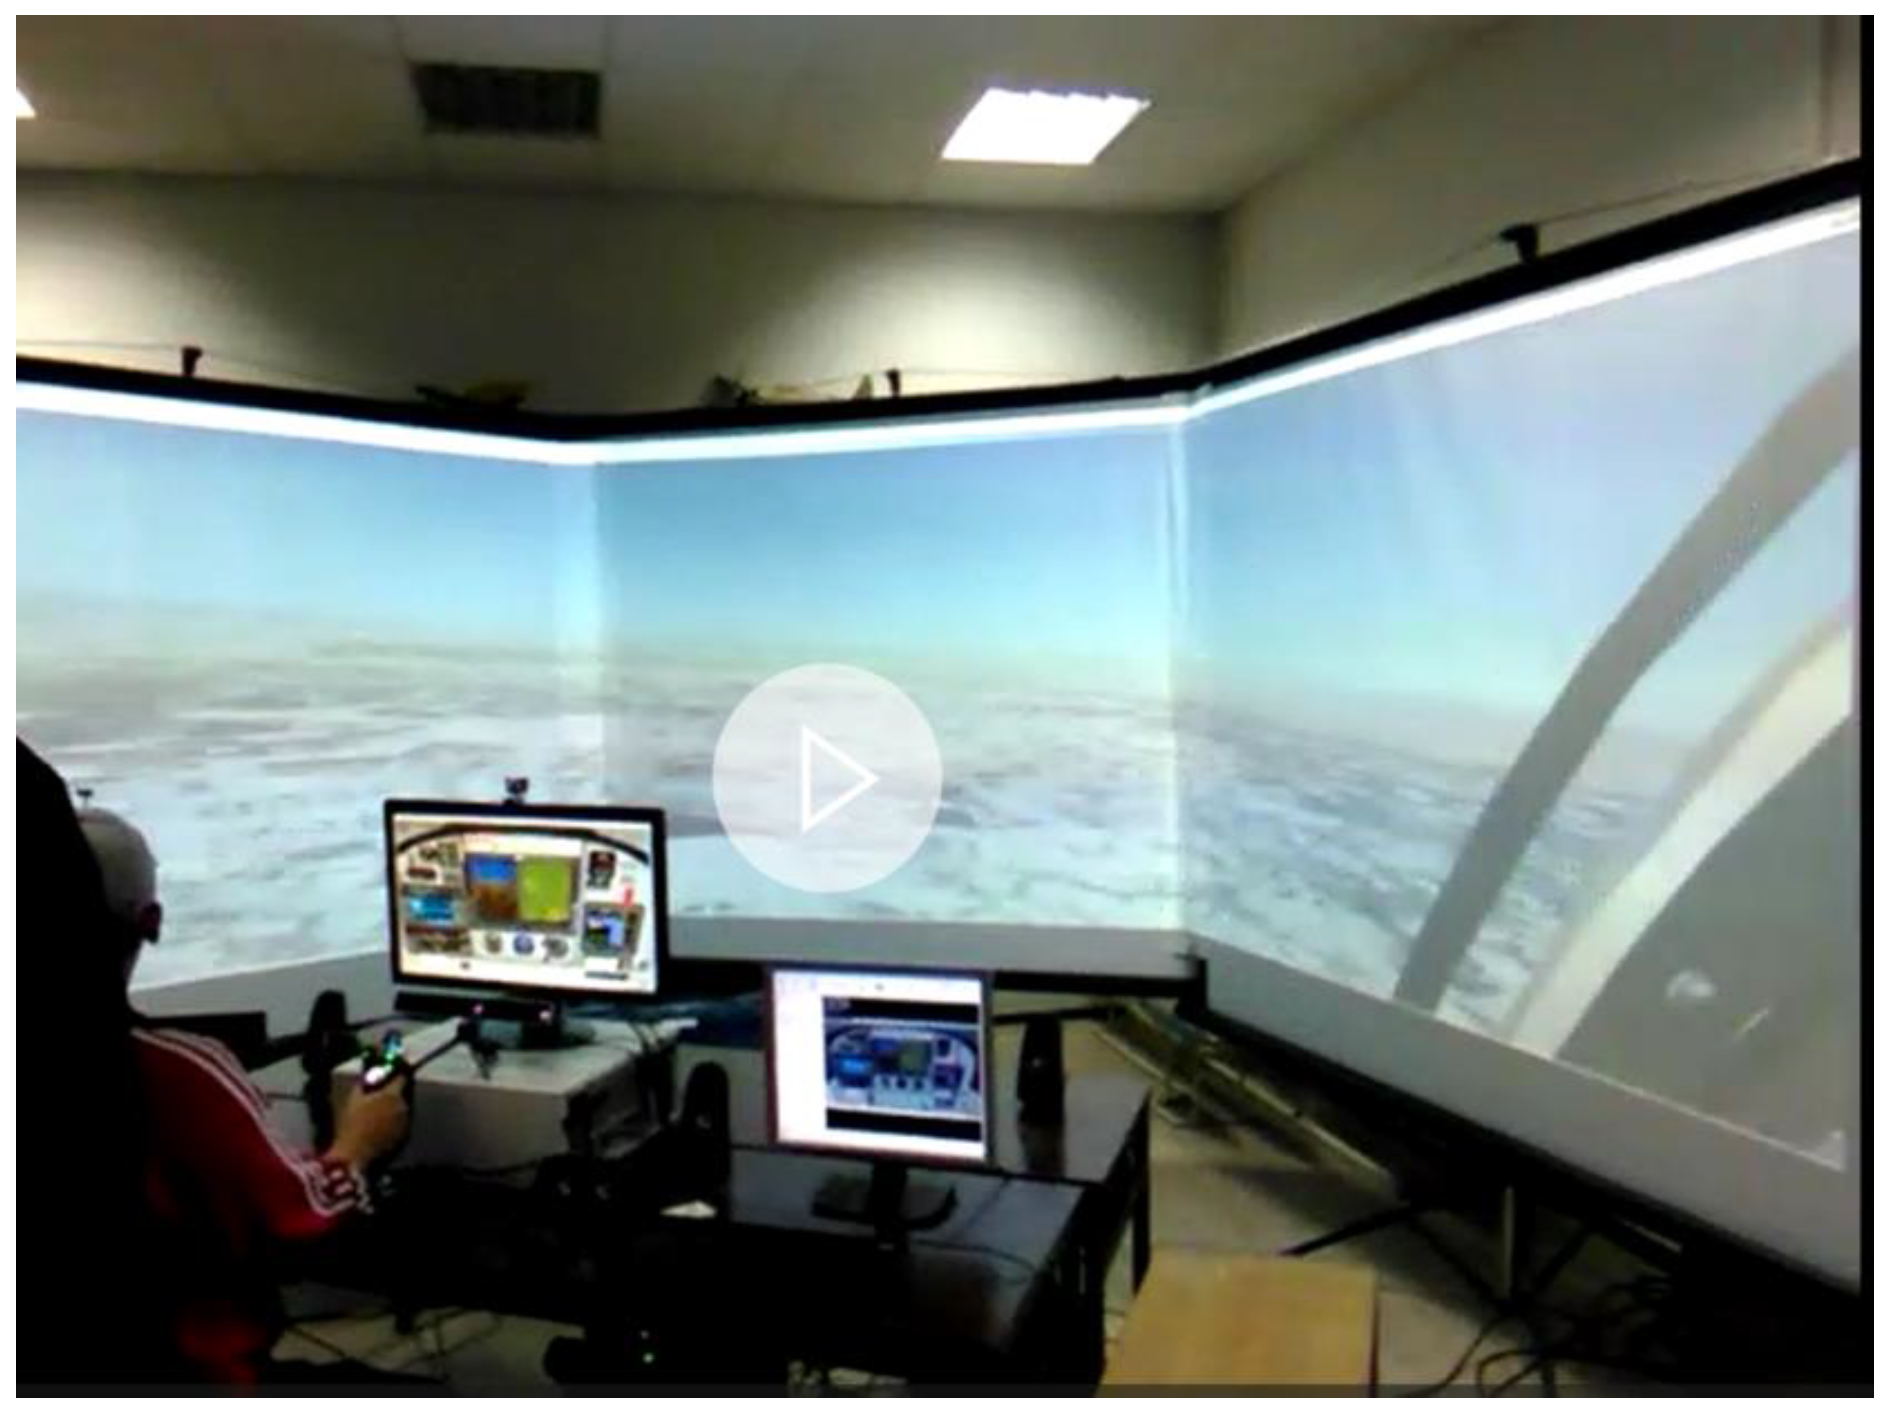
4.4.1. Hardware
4.4.1.1. Flight simulator
4.4.1.2. Eye Tracking Tools
4.4.2. Software
4.5. Data analysis
4.5.1. Traditional EM metric data analysis
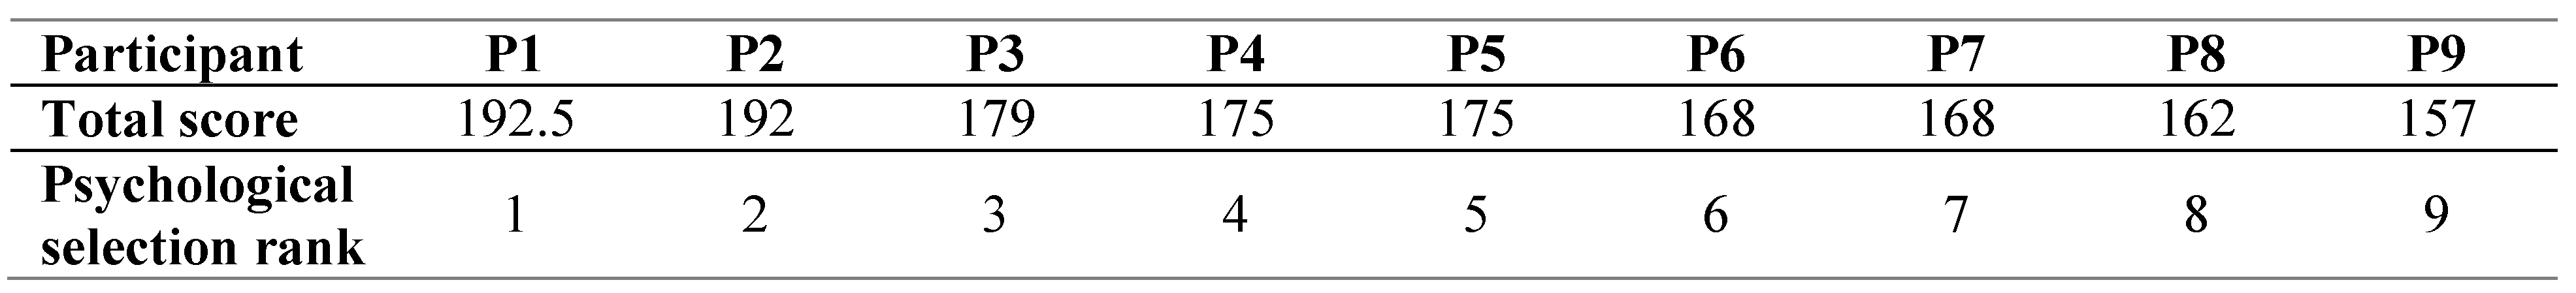
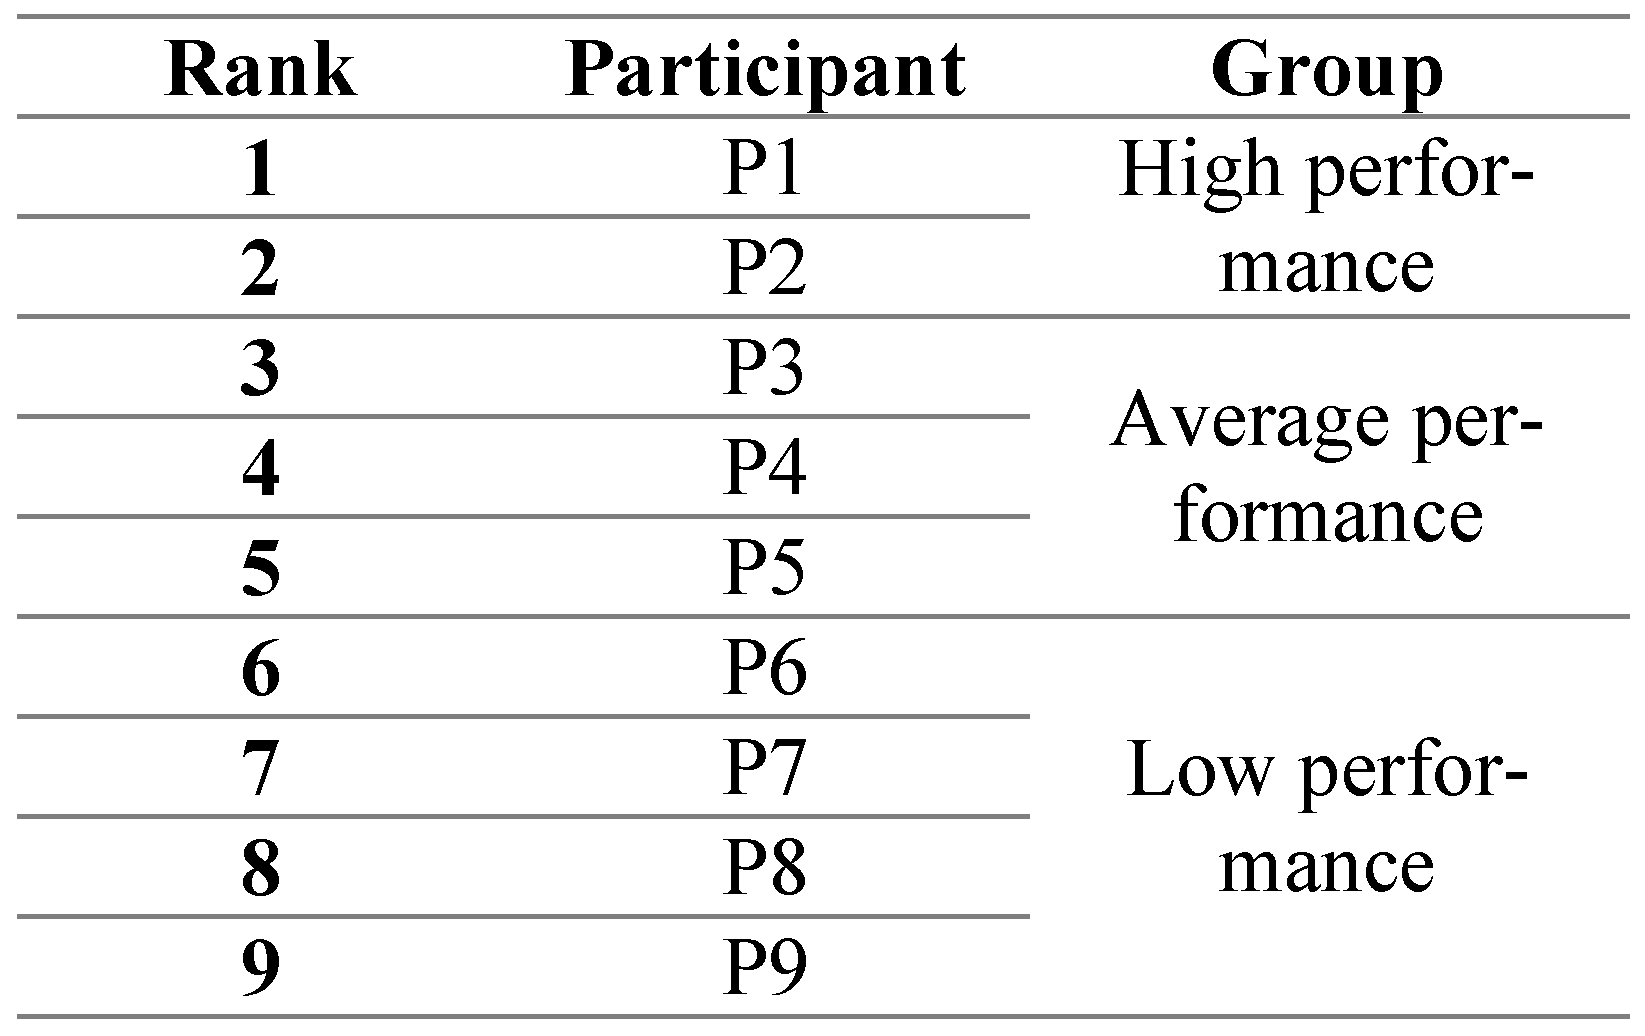
- Psychological tests (Figure 8, and Table 4– We named this step of grouping candidates using psychological test scores as ‘psychological selection stream’)
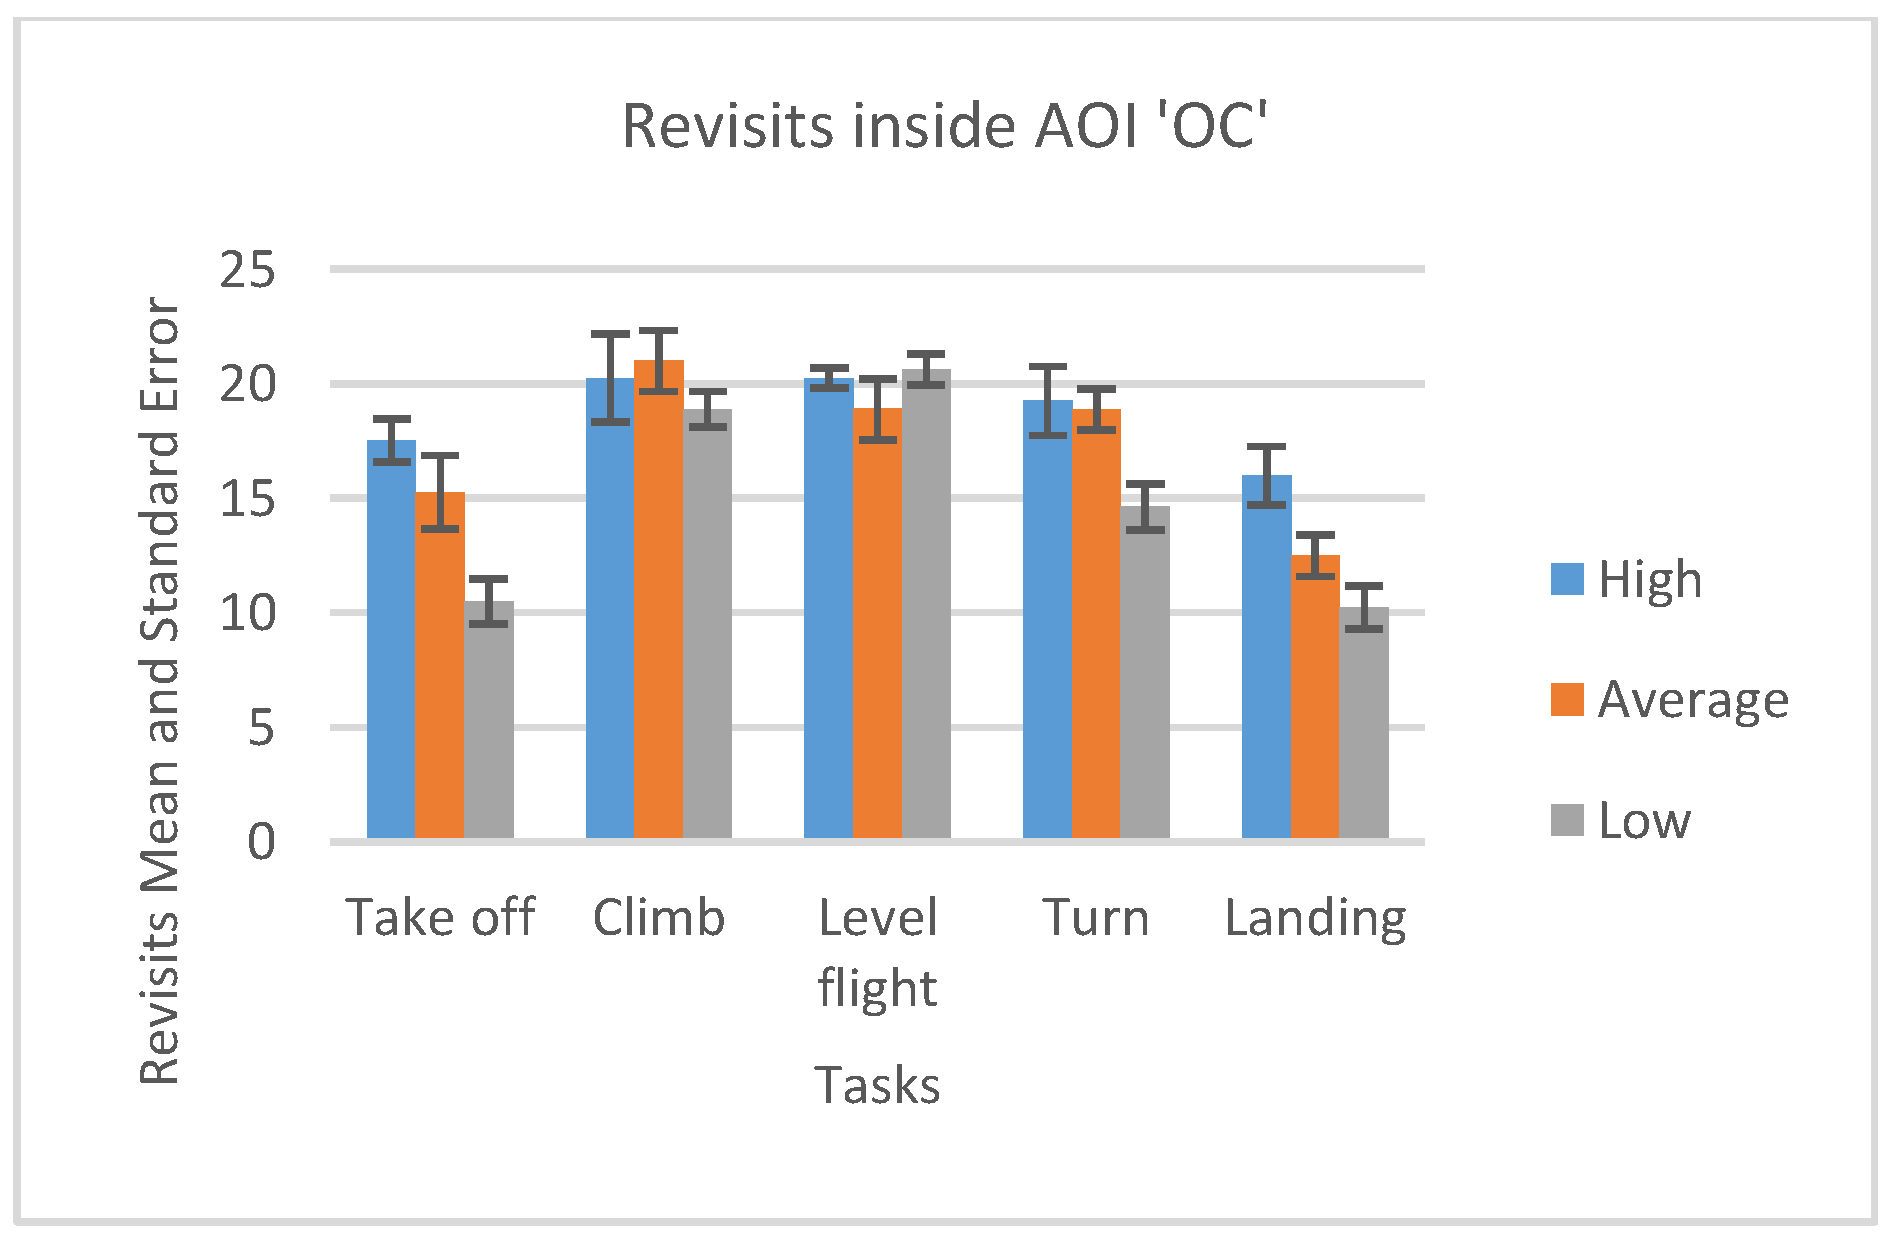
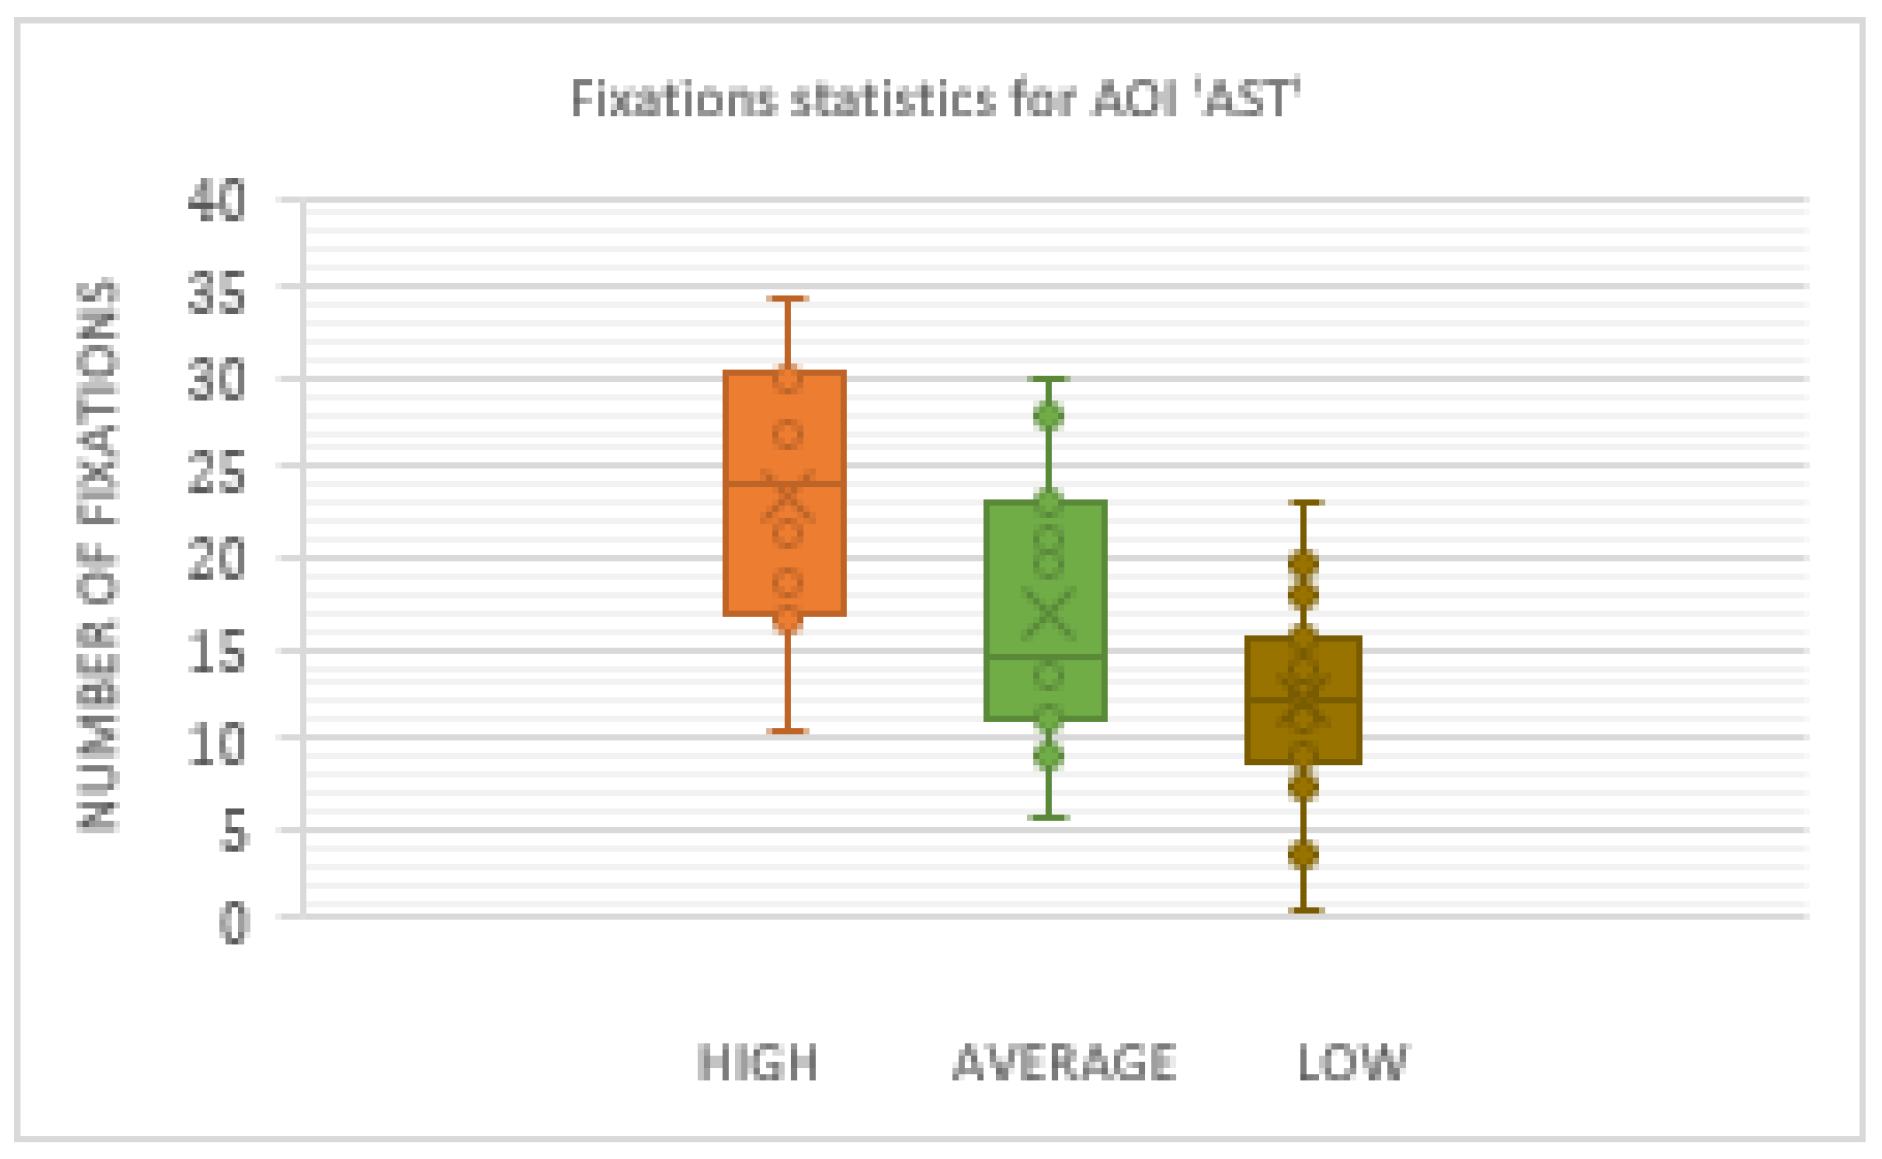
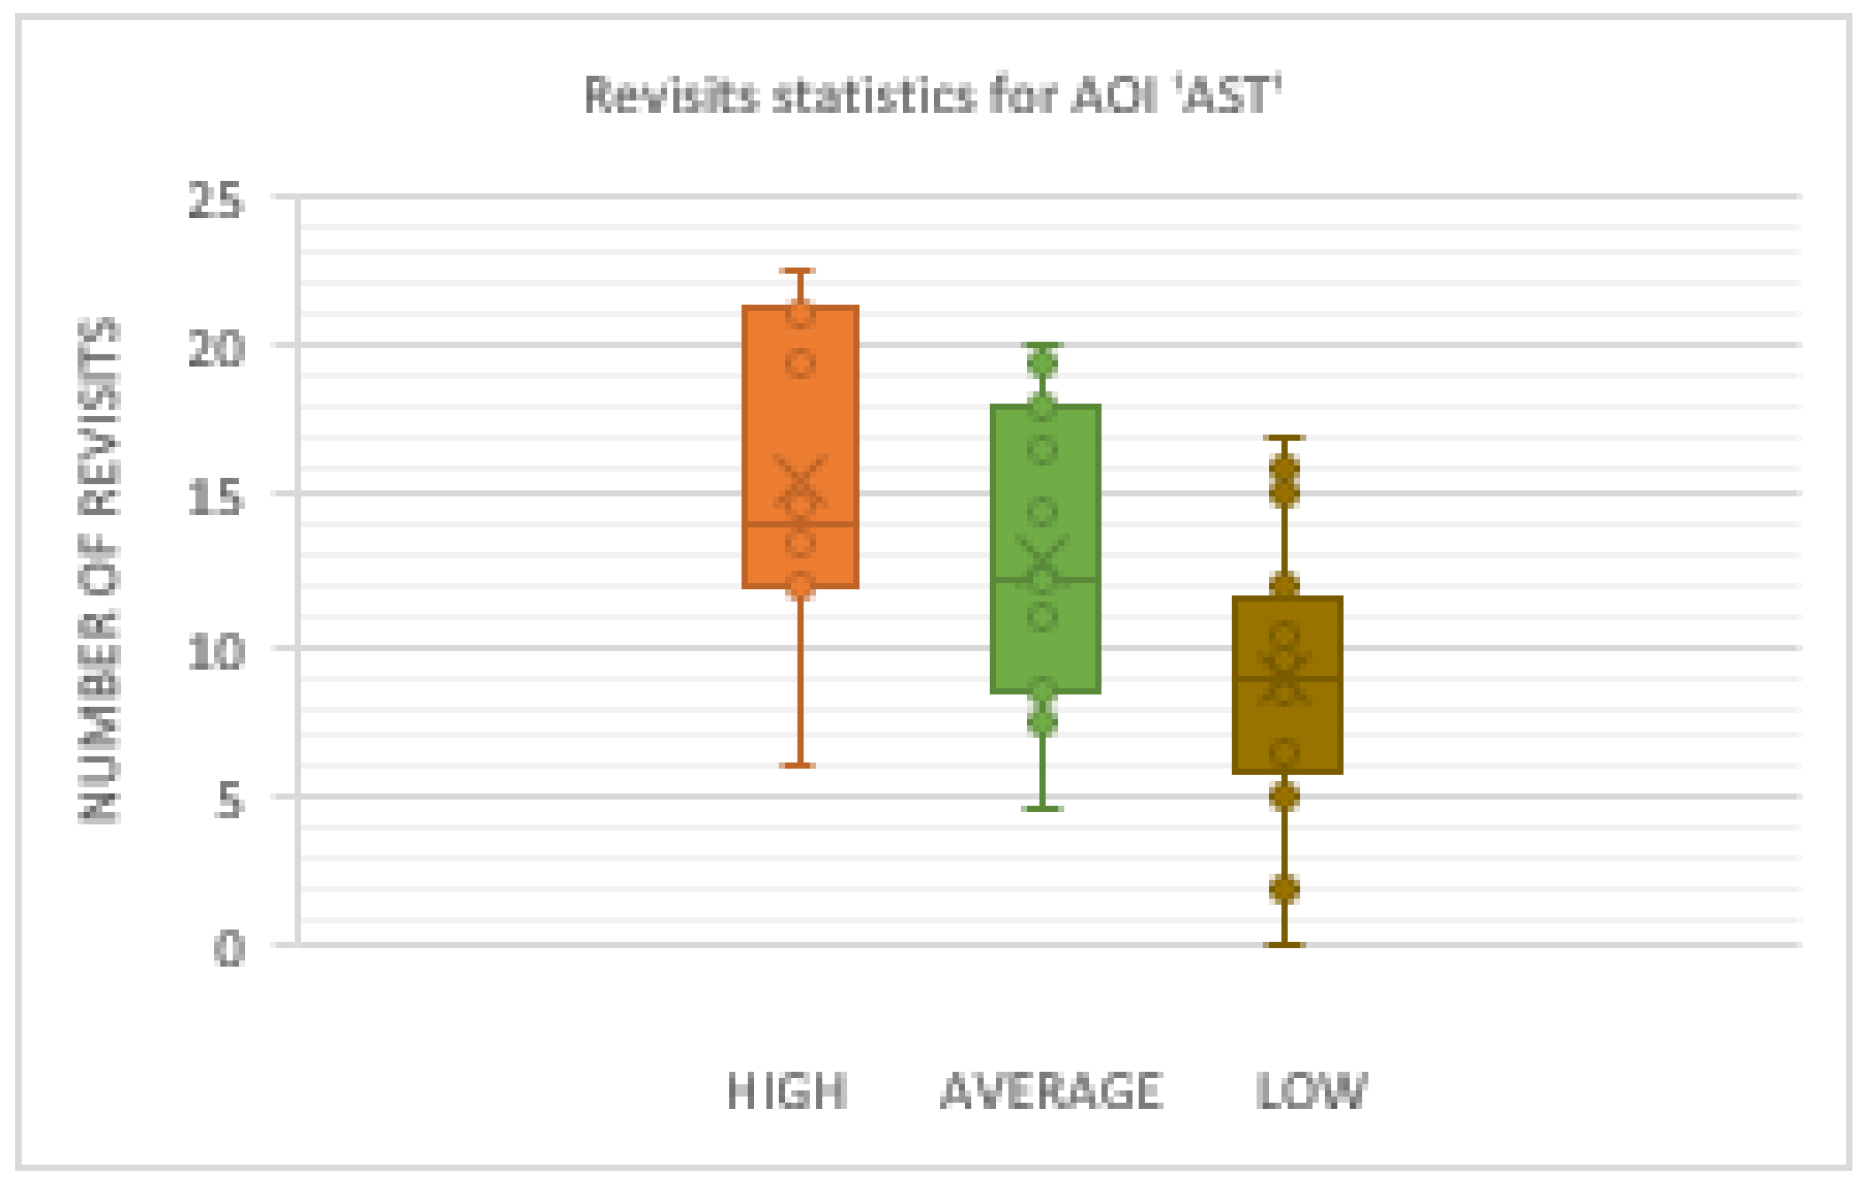
- Eye-tracking tests (Figures 10–12, Tables 3 and 4)
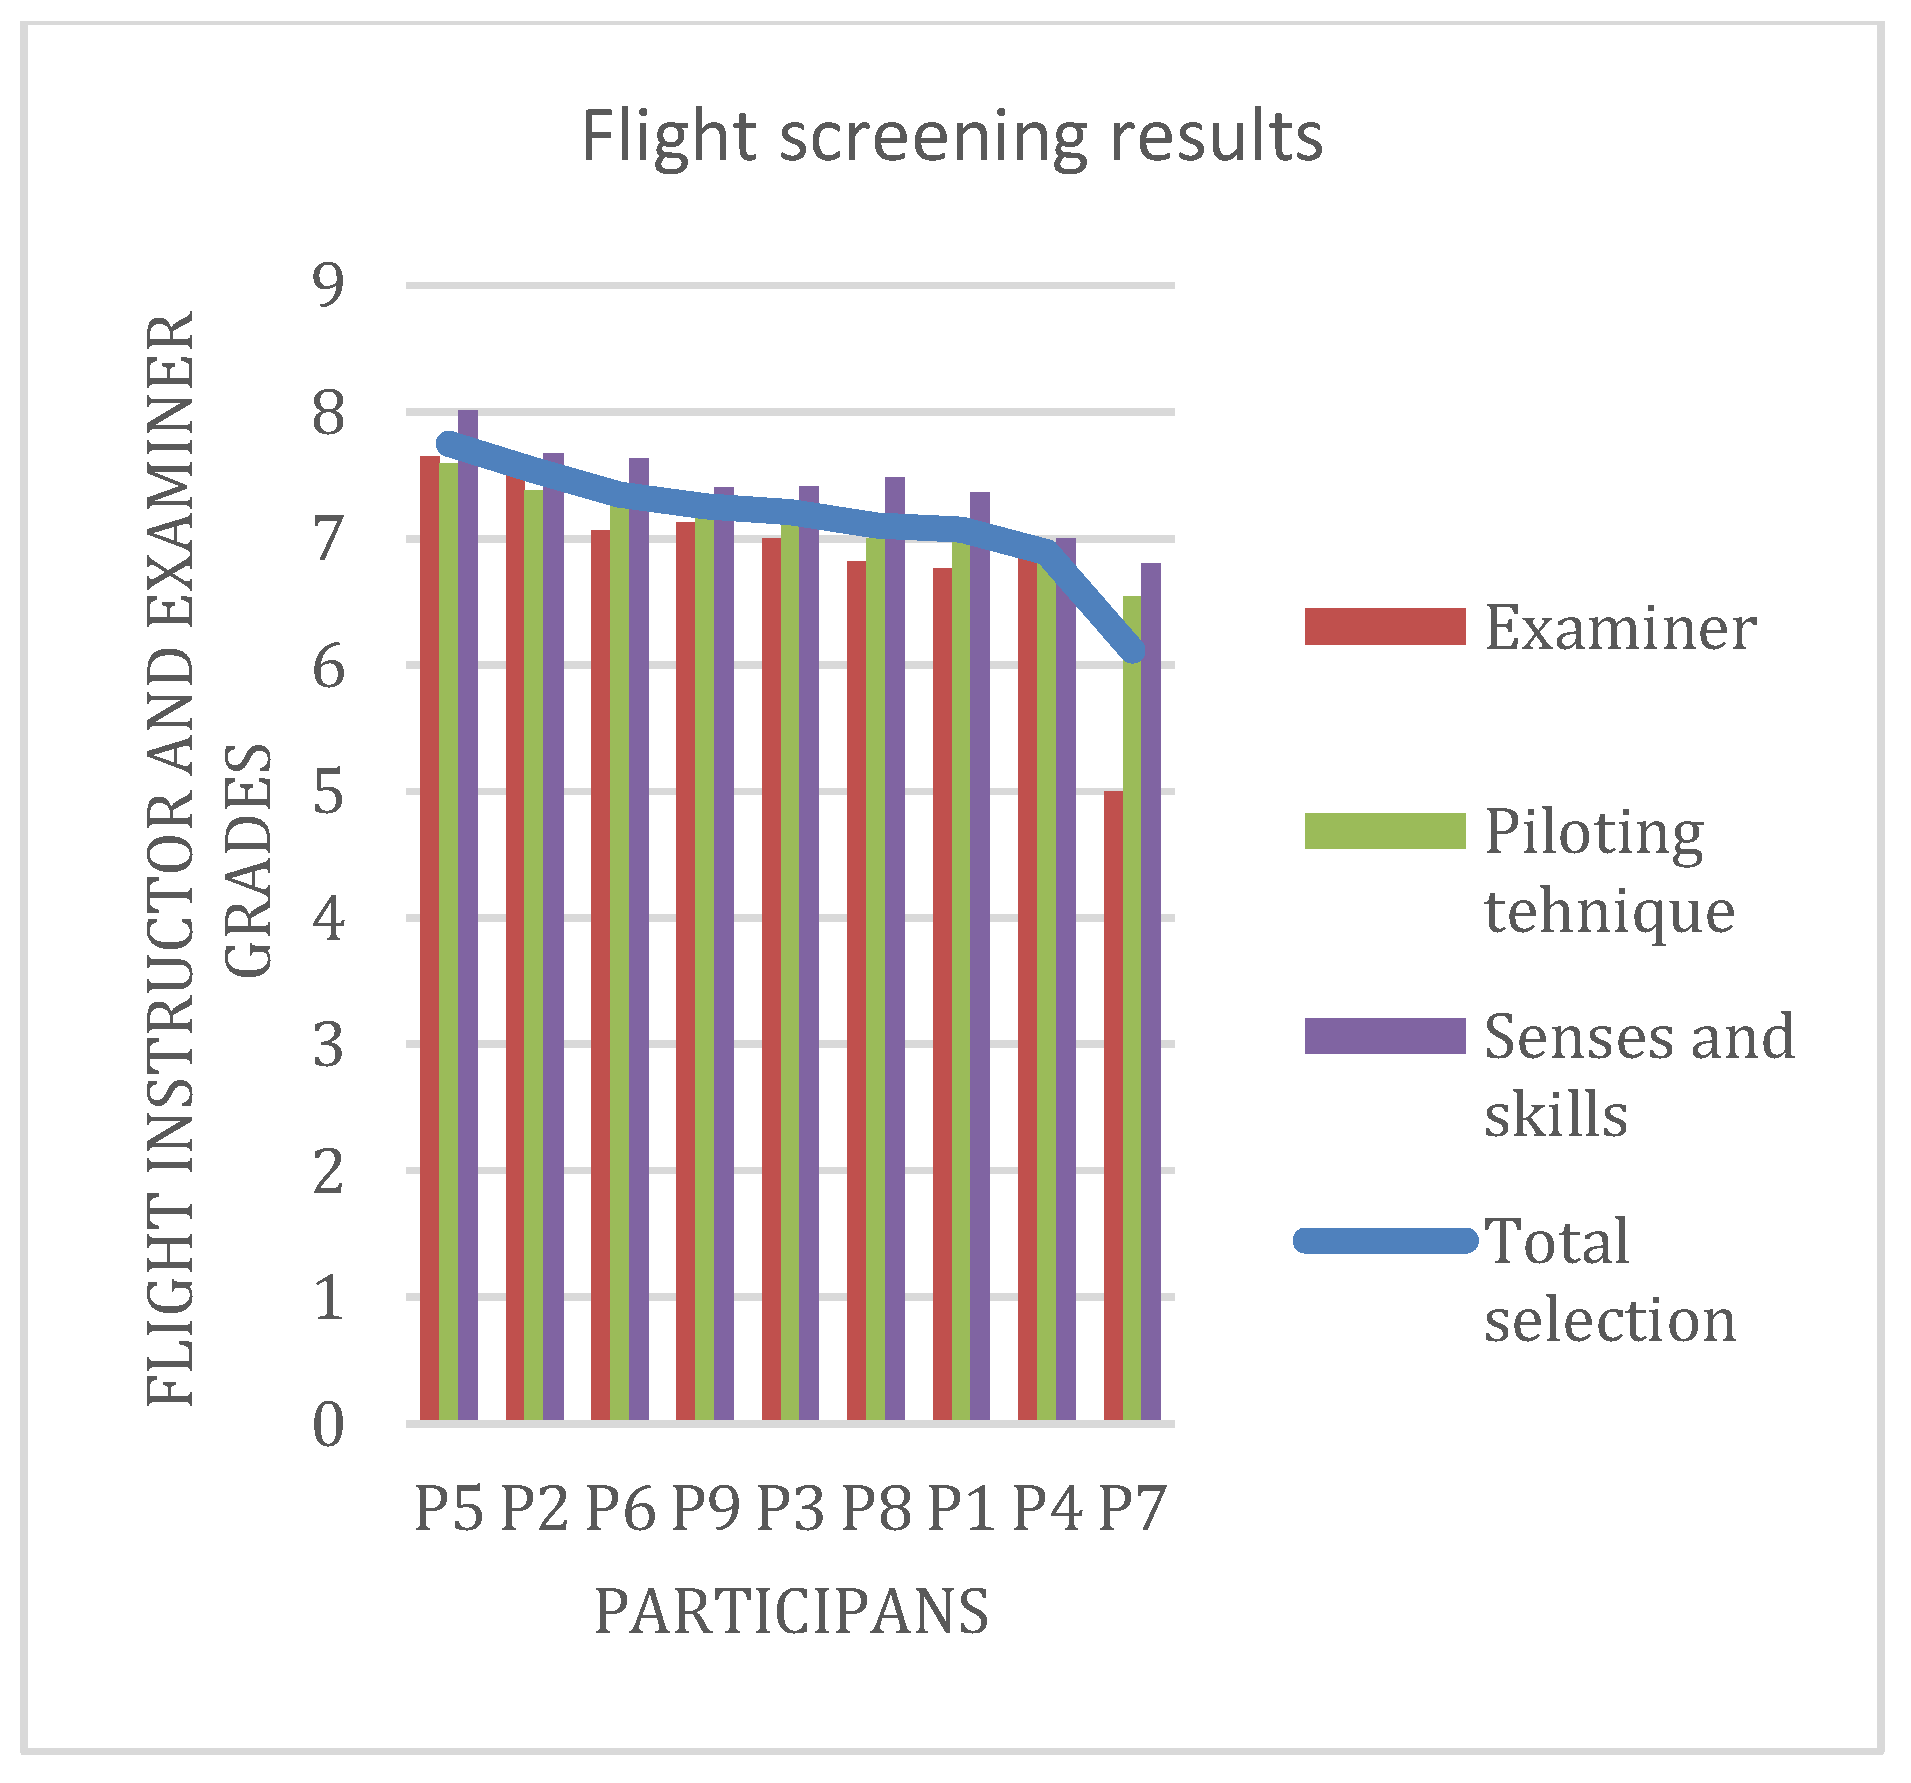
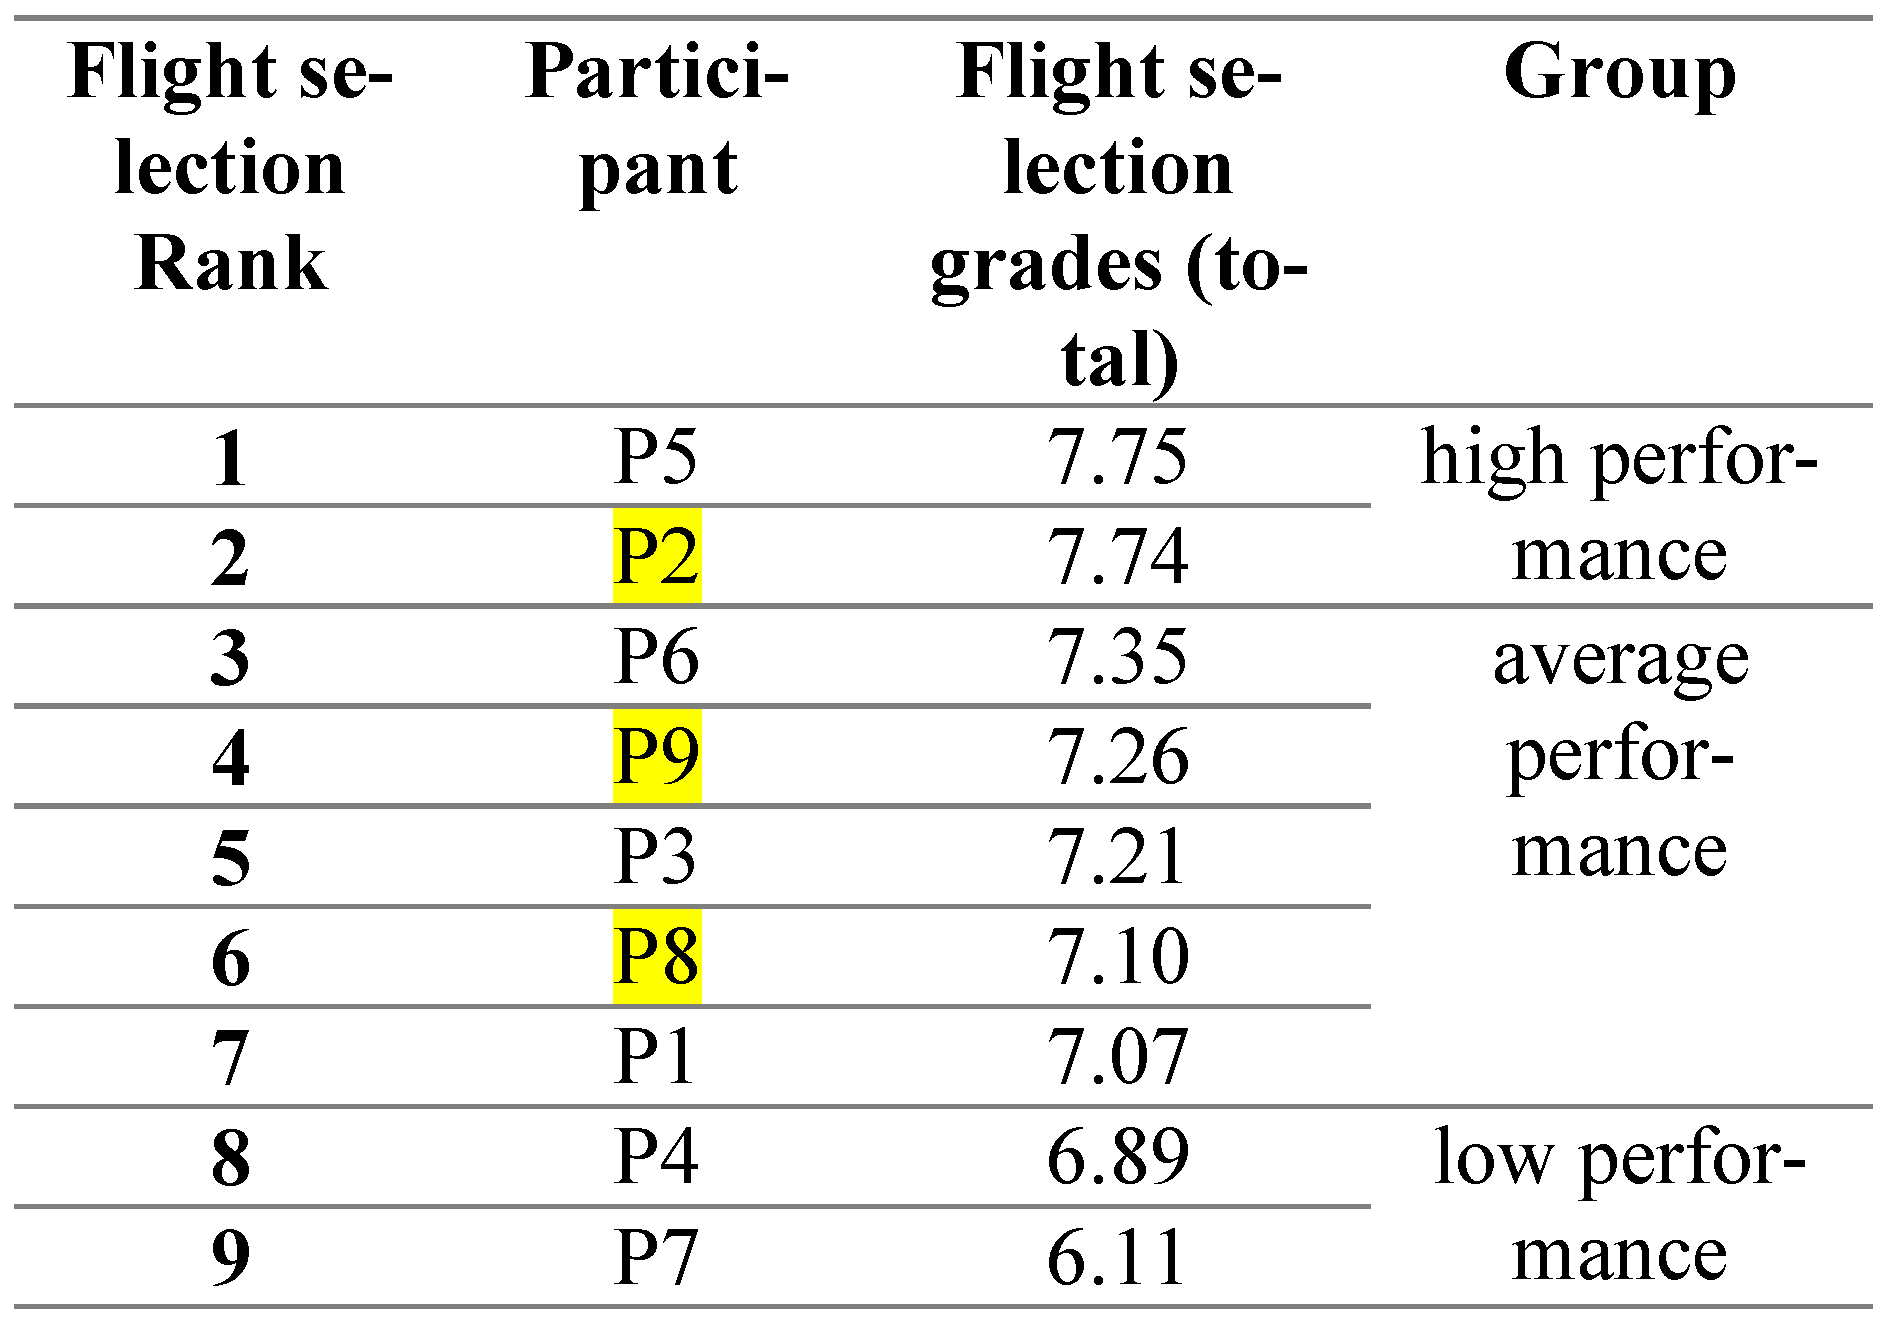
- Flight-screening results (Figure 9 and Table 5 - We named this step of grouping candidates using flight screening scores as ‘flight screening selection stream’).
4.5.2. Network based data analysis
5. Results
5.1. Psychological selection stream analysis
5.2. Flight selection stream analysis
5.3. Traditional EM metric result analysis
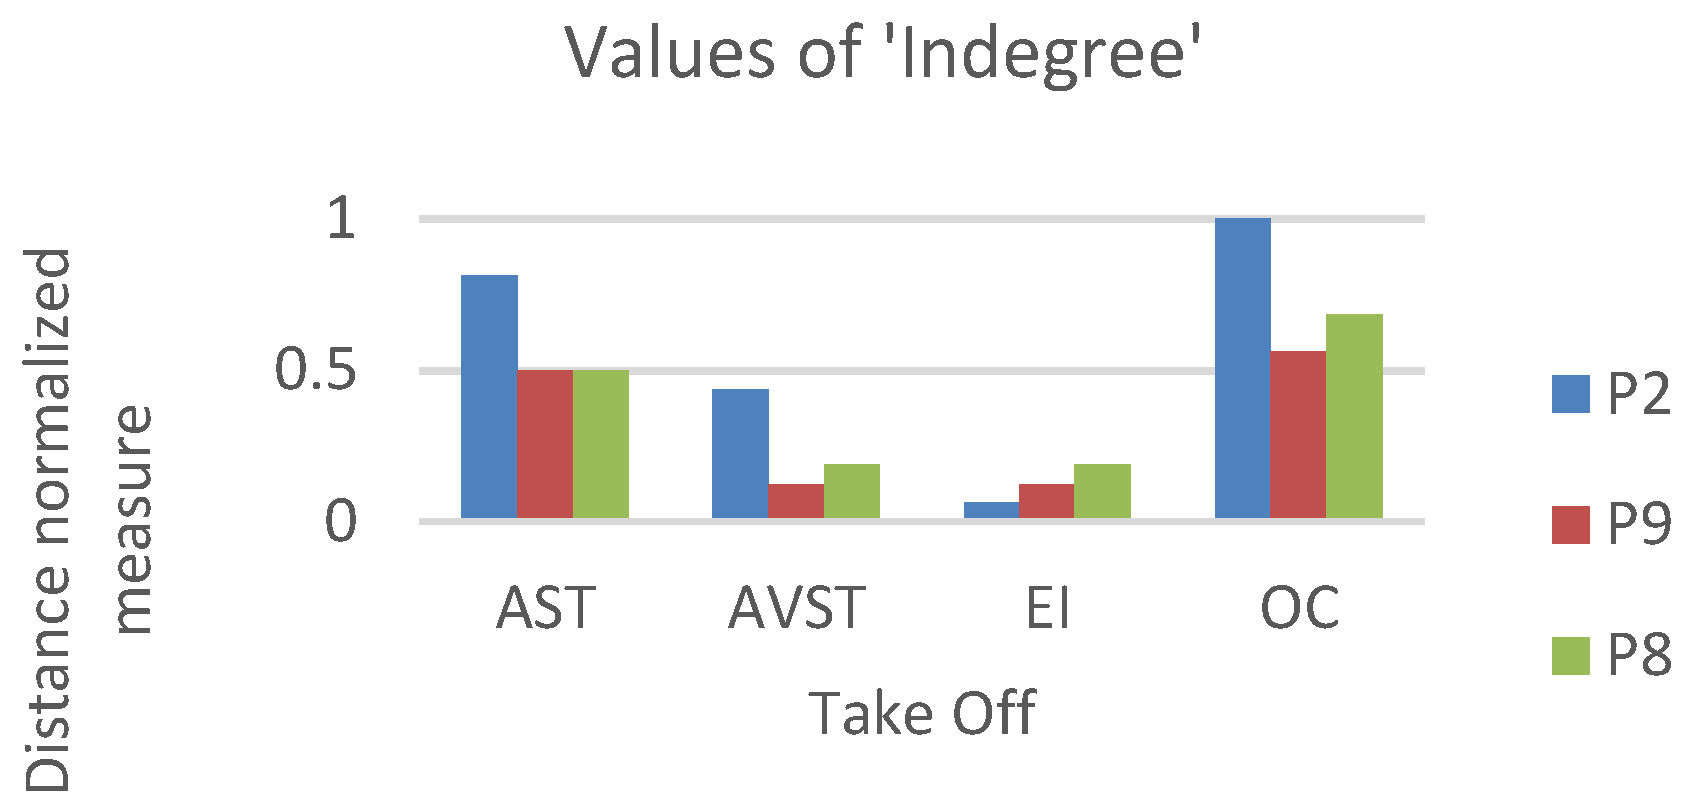
5.4. Network based EM metrics results analysis
6. Discussion
7. Conclusion
8. Limitations and future work
Acknowledgments
Ethics and Conflict of Interest
References
- Carretta, T.R.U.S. Air Force Pilot Selection and Training Methods. Aviat Sp Environ Med. 2000, 71(9), 950–956. [Google Scholar]
- Pavlovic, B. Instructions for monitoring, assesment and evaluation of Military Academy cadets; Vojnoizdavacki zavod: Belgrade, Serbia, 2009. [Google Scholar]
- Wang, T.-C.; Chang, T.-H. Application of TOPSIS in evaluating initial training aircraft under a fuzzy environment. Expert Syst Appl [Internet] 2007, 33(4), 870–880. [Google Scholar] [CrossRef]
- AOPA. Technologicaly Advanced Aircraft, Safety and Training. Frederick, Maryland, 2007. [Google Scholar]
- Ferri, A.; Kenney, J.T.; Webb, L.M. Methods and Criteria for the selection of flying personnel. In Advisory Group for Aeronautical Research and Development; AGARD: Paris, France, 1960, 1953; p. 107. [Google Scholar]
- VANWULFFTENPALTHEPM Remarks on psychological and psychiatric methods of selection and assessment of flying personnel. Aeromed Acta [Internet] 1954, 3(1), 41–44.
- VANWULFFTENPALTHEPM Some observations on the psychology of the aviator. Aeromed Acta [Internet] 1952, 1(1), 23–42. Available online: http://www.ncbi.nlm.nih.gov/pubmed/13124138.
- Blascheck, T.; Kurzhals, K.; Raschke, M.; Burch, M.; Weiskopf, D.; Ertl, T. State-ofthe-Art of Visualization for Eye Tracking Data. Eurographics Conf Vis. 2014, 1–20. [Google Scholar]
- Wang, L.; Li, H.; Dong, D.; Shu, X. Relationship between the technical skills and eye-movement indicators of pilots. In Proceedings of the 19th Trienn Congr IEA, August 2015; pp. 1–8. [Google Scholar]
- FAA. Instrument Flying Handbook [Internet]; Federal Aviaition Adminstration, 2001; 281p. [Google Scholar]
- Diaz, J.M.; Bil, C.; Dyer, A.G.; Garcia, J.E. Visual scan patterns of expert and cadet pilots in VFR landing. In Proceedings of the 17th AIAA Aviat Technol Integr Oper Conf 2017, June 2017. [Google Scholar]
- Robinski, M.; Stein, M. Tracking visual scanning techniques in training simulation for helicopter landing. J Eye Mov Res. 2013, 6(2), 1–17. [Google Scholar] [CrossRef]
- Yu, C.S.; Wang, E.M.Y.; Li, W.C.; Braithwaite, G.; Greaves, M. Pilots’ visual scan patterns and attention distribution during the pursuit of a dynamic target. Aerosp Med Hum Perform. 2016, 87(1), 40–47. [Google Scholar] [CrossRef]
- Yu, F.; Liu, L.W.; Zhang, W.G.; Xu, H. Evaluation of commercial trainer effectiveness based on DEA cross-efficiency model. Int Conf Logist Eng Manag Comput Sci LEMCS 2014, 2014, 588–591. [Google Scholar]
- Mackenzie Glahot, G. Eye tracking in the cockpit: A review of the relationships between eye movements and the aviator’s cognitive state. Drdc-Rddc-2014-R153. 2014. [Google Scholar]
- Maxime, R.; Yvanne, C.; André, V.F.D. Pilot flying vs. pilot monitoring during the approach phase: An eye-tracking study. In Proceedings of the International Conference on Human-Computer Interaction in Aerospace; ACM: New York, NY, USA, 2016; pp. 1–7. [Google Scholar]
- Rudi, D.; Kiefer, P.; Raubal, M. Visualizing pilot eye movements for flight instructors. Proc ETVIS 2018 Eye Track Vis. 2018. [Google Scholar]
- Mandal, S.; Kang, Z.; Millan, A. Data Visualization of complex eye movements using directed weighted networks: A case study on a multielement target tracking task. Proc Hum Factors Ergon Soc. 2016, 106–110. [Google Scholar] [CrossRef]
- Mandal, S.; Kang, Z. Using eye movement data visualization to enhance training of air traffic controllers: A dynamic network approach. J Eye Mov Res. 2018, 11(4). [Google Scholar] [CrossRef] [PubMed]
- Pavlovic, B. Zavod, V., Ed.; Flight Screening on V-53 airplane; Belgrade, 2009. [Google Scholar]
- Lijing, W.; Lin, C. Eye movement comparison of professional and novice pilots in key actions of takeoff phase. AUS 2016 2016 IEEE/CSAA Int Conf Aircr Util Syst. 2016, 703–706. [Google Scholar]
- McCarley, J.S.; Kramer, A.F. Eye movements as a window on perception and cognition. In Neuroergonomics: The brain at work; Oxford University Press: New York, NY, USA, 2007; pp. 95–112, (Series in human-technology interaction). [Google Scholar]
- Rayner, K. Eye movements in reading and information processing: 20 years of research; Psychological Bulletin; American Psychological Association: US, 1998; Volume 124, pp. 372–422. [Google Scholar]
- Di Nocera, F.; Camilli, M.; Terenzi, M. A Random Glance at the Flight Deck: Pilots’ Scanning Strategies and the Real-Time Assessment of Mental Workload. J Cogn Eng Decis Mak. 2007, 1. [Google Scholar] [CrossRef]
- Yu, C.S.; Wang, E.M.Y.; Li, W.C.; Braithwaite, G. Pilots’ visual scan patterns and situation awareness in flight operations. Aviat Sp Environ Med. 2014, 85(7), 708–714. [Google Scholar] [CrossRef]
- Kilingaru, K.; Nedic, Z.; Tweedale, J.; Thatcher, S. Smart Evaluation of Instrument Scan Pattern Using State Transition Model During Flight Simulator Training. 2018, pp. 292–301. Available online: http://link.springer.com/10.1007/9783-319-59451-4_29.
- Lefrancois, O.; Matton, N.; Gourinat, Y.; Peysakhovich, V.; Causse, M. The role of Pilots’ monitoring strategies in flight performance. In European Association for Aviation Psychology Conference EAAP32, [Internet]; European Association for Aviation Psychology: Cascais, Portugal, 2016; Available online: http://oatao.univ-toulouse.fr/%0D.
- Pieters, R. A Review of Eye-Tracking Research in Marketing. Rev Mark Res. 2008, 4, 123–147. [Google Scholar]
- Comstock, J.R.; Coates, G.D.; Kirby, R.H. Eye-Scan Behavior in a Flight Simulation Task as a Function of Level of Training. Proc Hum Factors Soc Annu Meet. 1985, 29(4), 391–395. [Google Scholar] [CrossRef]
- Dixon, K.W.; Krueger, G.M.; Rojas, V.A.; Martin, E.L. Visual Behavior in the F-15 simulator for air-to-air combat; Williams Air force Base: Arizona, 1990. [Google Scholar]
- Kasarskis, P.; Stehwien, J.; Hickox, J.; Aretz, A.; Wickens, C. Comparison of Expert and Novice Scan Behaviors During VFR Flight. In Proceedings of the 11th Int Symp Aviat Psychol., 1 January 2001. [Google Scholar]
- Burch, M.; Beck, F.; Raschke, M.; Blascheck, T.; Weiskopf, D. A dynamic graph visualization perspective on eye movement data. Eye Track Res Appl Symp. 2014, 1, 151–158. [Google Scholar]
- Newman, M.E.J. Analysis of weighted networks. Phys Rev E Stat Physics, Plasmas, Fluids, Relat Interdiscip Top. 2004, 70(5), 9. [Google Scholar] [CrossRef]
- Opsahl, T.; Agneessens, F.; Skvoretz, J. Node centrality in weighted networks: Generalizing degree and shortest paths. Soc Networks [Internet] 2010, 32(3), 245–251. [Google Scholar] [CrossRef]
- Csardi, G.; Nepusz, T. The Igraph Software Package for Complex Network Research. InterJournal 2005. Complex Sy:1695. [Google Scholar]
- Dudas, A. Basic Flying Training [Internet]. First Edit. 2014. Available online: http://www.lulu.com/shop/arpaddudas/basic-flyingtraining/ebook/product21455592.html?ppn=1.
- VVA Tehnika pilotiranja-osnovno letenje avionom V-53 [Flying techniqueV-53 Basic Flying training manual]. Zemunik, 1980; 70p.
- Anders, G. Pilot’s attention allocation during approach and landingEye-andhead-tracking research in an A 330 full flight simulator. In Proceedings of the 11th International Symposium on Aviation Psychologythe 11th International Symposium on Aviation Psychology; 2001. [Google Scholar]
- Vlacic, S.; Knezevic, A.; Milutinovic, M. Application of commercial available hardware in the making of flight trainer. In Proceedings of the International Conference on Information Technology and Development of Education Itro 2015 Proceedings; Techbnical Faculty Mihajlo Pupin: Zrenjanin, Serbia, 2014; pp. 284–287. [Google Scholar]
- Gazepoint. gazept.com/product [Internet]. 2020. Available online: https://www.gazept.com/product/gazepoint-gp3-eye-tracker/.
- Katoh, Z. Saccade amplitude as a discriminator of flight types. Aviat Space Environ Med [Internet] 1997, 68(3), 205–208. Available online: http://www.ncbi.nlm.nih.gov/pubmed/9056028. [PubMed]


 |
 |
 |
 |
 |
 |
Copyright © 2020. This article is licensed under a Creative Commons Attribution 4.0 International License.
Share and Cite
Vlačić, S.; Knežević, A.; Mandal, S.; Rođenkov, S.; Vitsas, P.A. Improving the Pilot Selection Process by Using Eye-Tracking Tools. J. Eye Mov. Res. 2019, 12, 1-26. https://doi.org/10.16910/jemr.12.3.4
Vlačić S, Knežević A, Mandal S, Rođenkov S, Vitsas PA. Improving the Pilot Selection Process by Using Eye-Tracking Tools. Journal of Eye Movement Research. 2019; 12(3):1-26. https://doi.org/10.16910/jemr.12.3.4
Chicago/Turabian StyleVlačić, Slaviša, Aleksandar Knežević, Saptarshi Mandal, Sanja Rođenkov, and Panos A. Vitsas. 2019. "Improving the Pilot Selection Process by Using Eye-Tracking Tools" Journal of Eye Movement Research 12, no. 3: 1-26. https://doi.org/10.16910/jemr.12.3.4
APA StyleVlačić, S., Knežević, A., Mandal, S., Rođenkov, S., & Vitsas, P. A. (2019). Improving the Pilot Selection Process by Using Eye-Tracking Tools. Journal of Eye Movement Research, 12(3), 1-26. https://doi.org/10.16910/jemr.12.3.4