Visual Multi-Metric Grouping of Eye-Tracking Data
Abstract
:Introduction
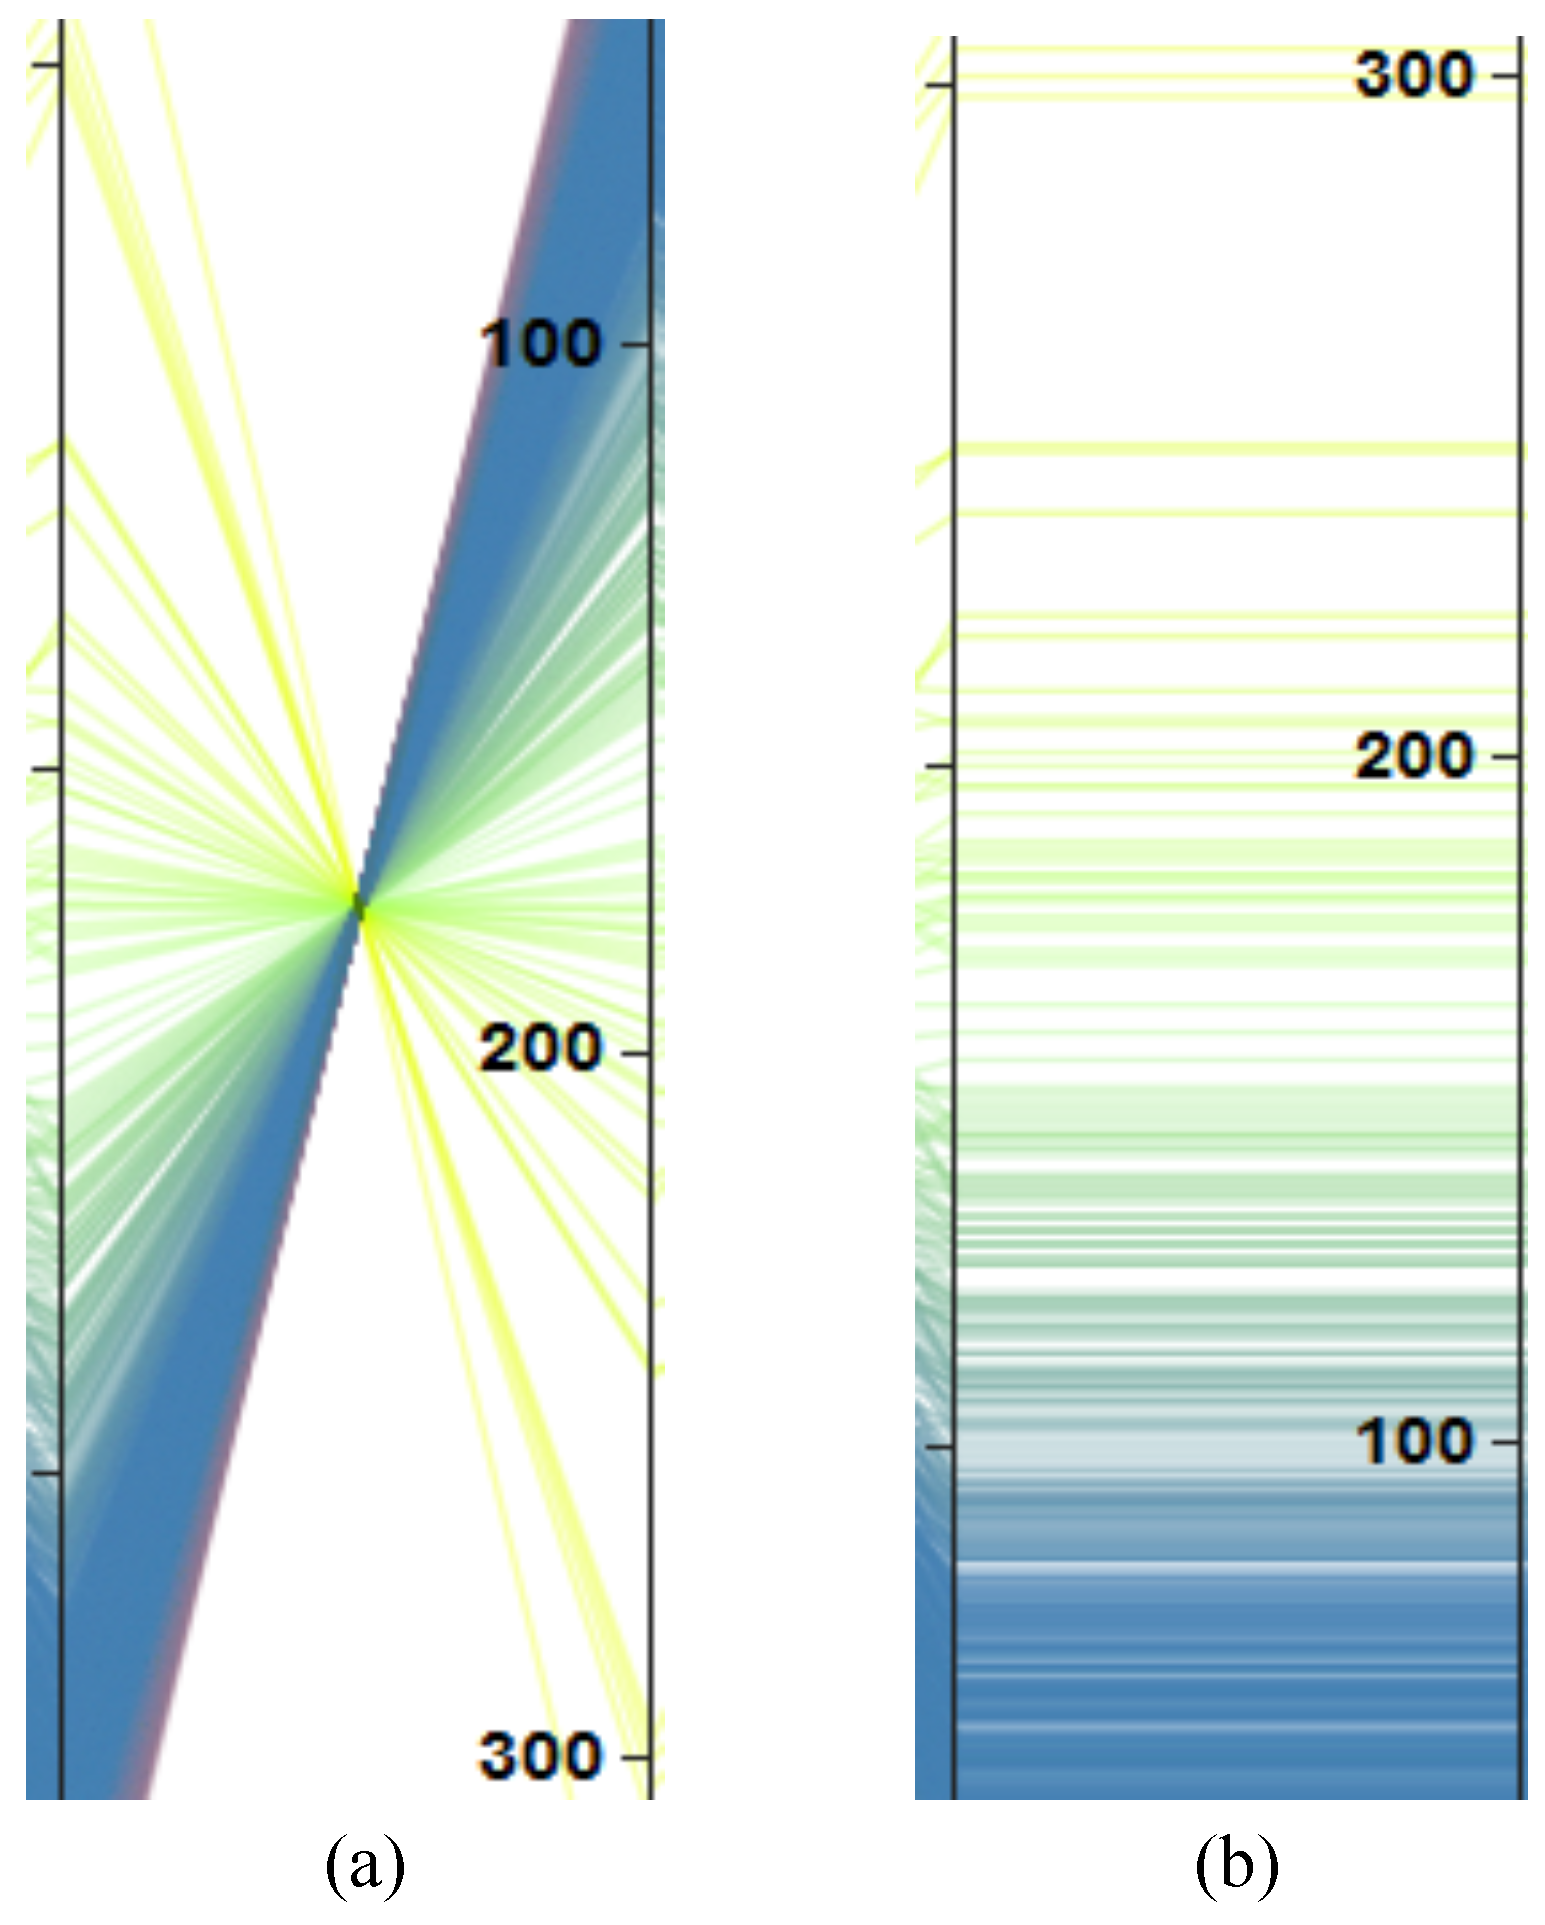
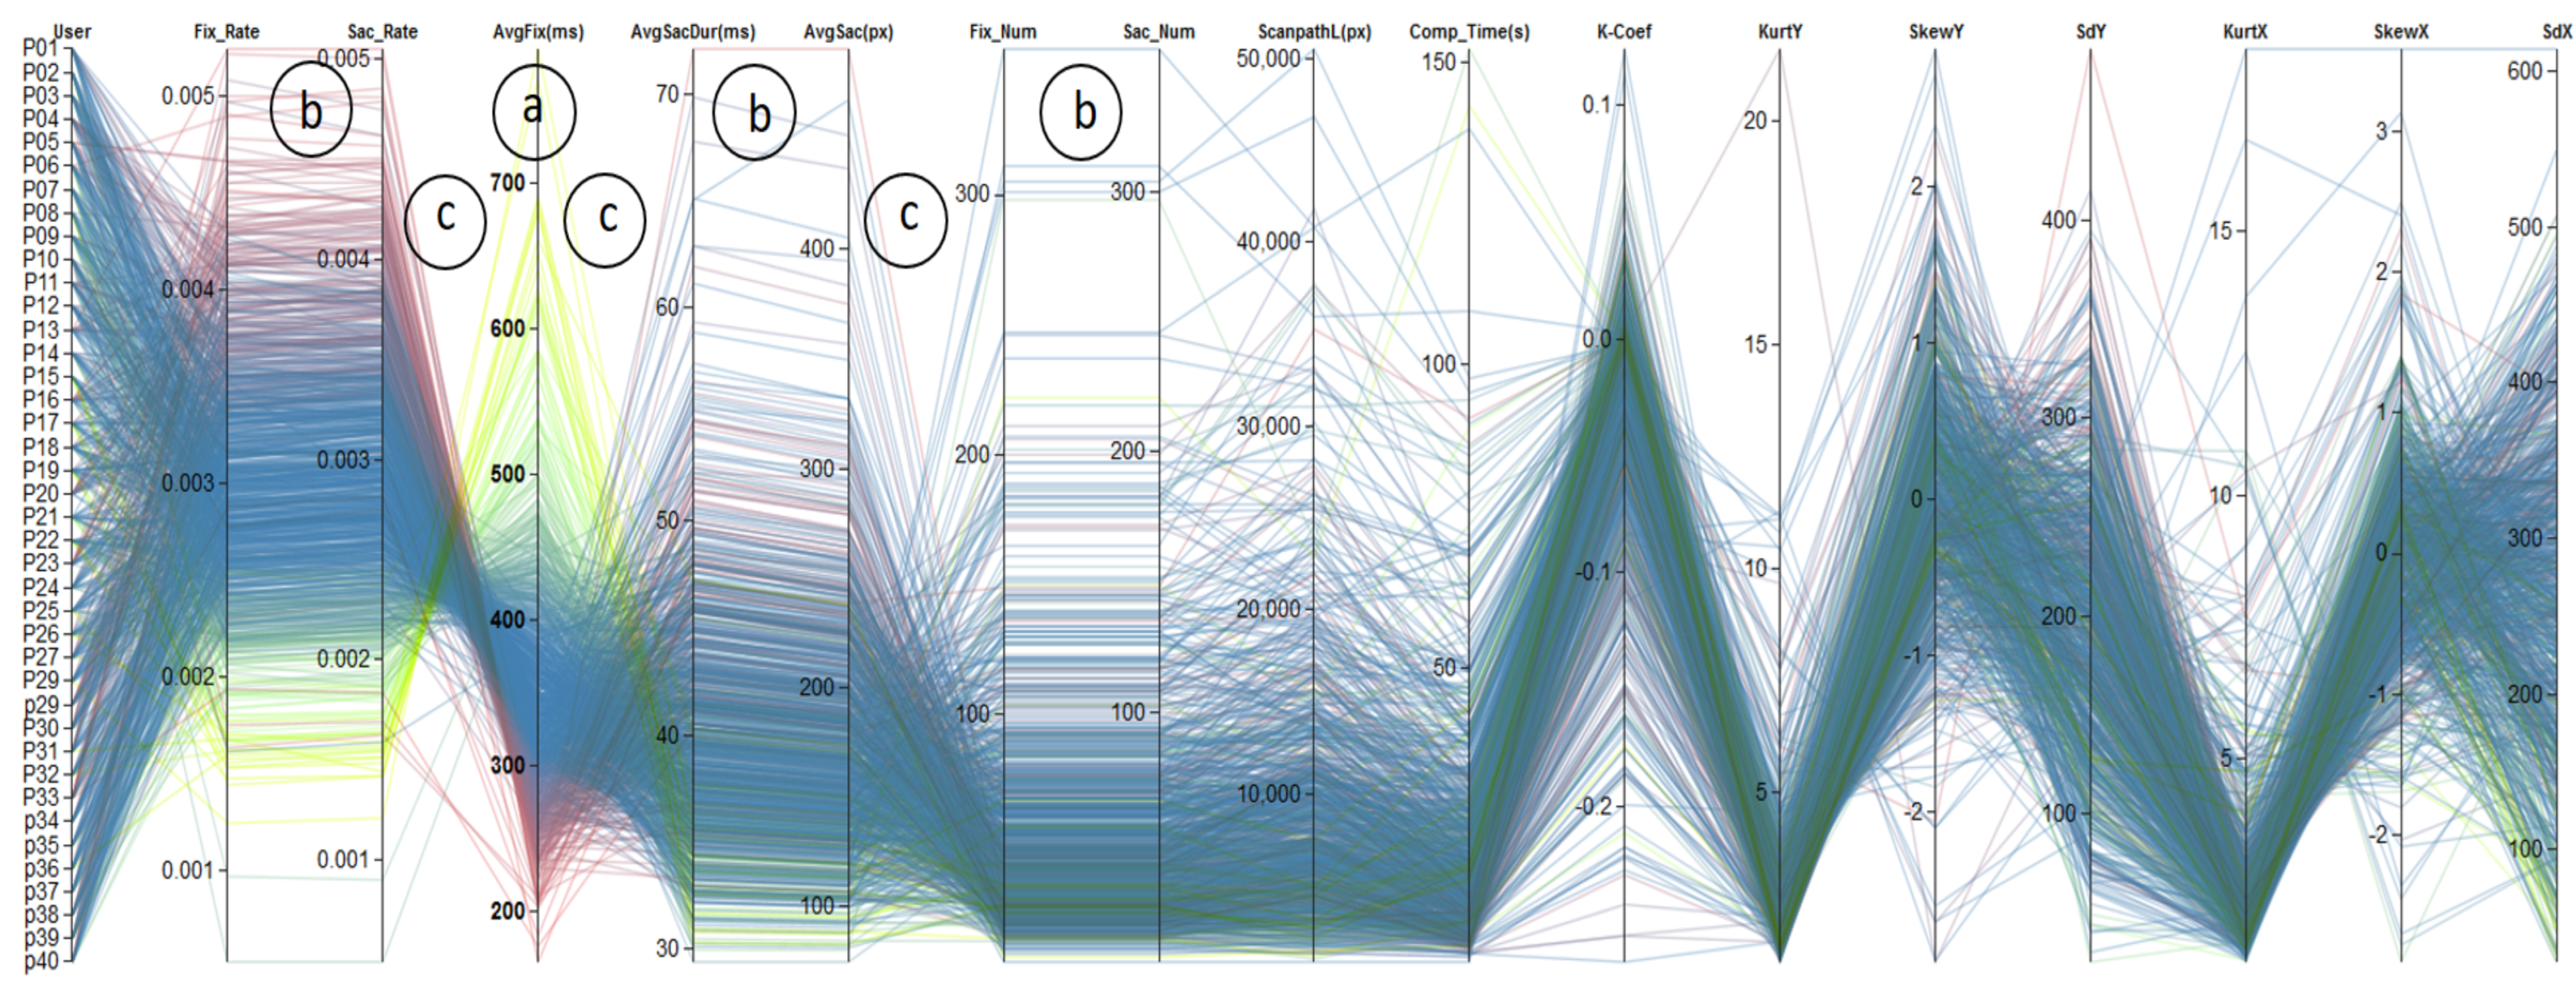
- Parallel coordinates: To get an overview, we have formulated eye-tracking data as multivariate eye-tracking metrics. To show correlations between the metrics, we provide parallel coordinates plots enhanced by interaction techniques like brushing and linking, value range selections, weighted metric combination, and participant group color coding.
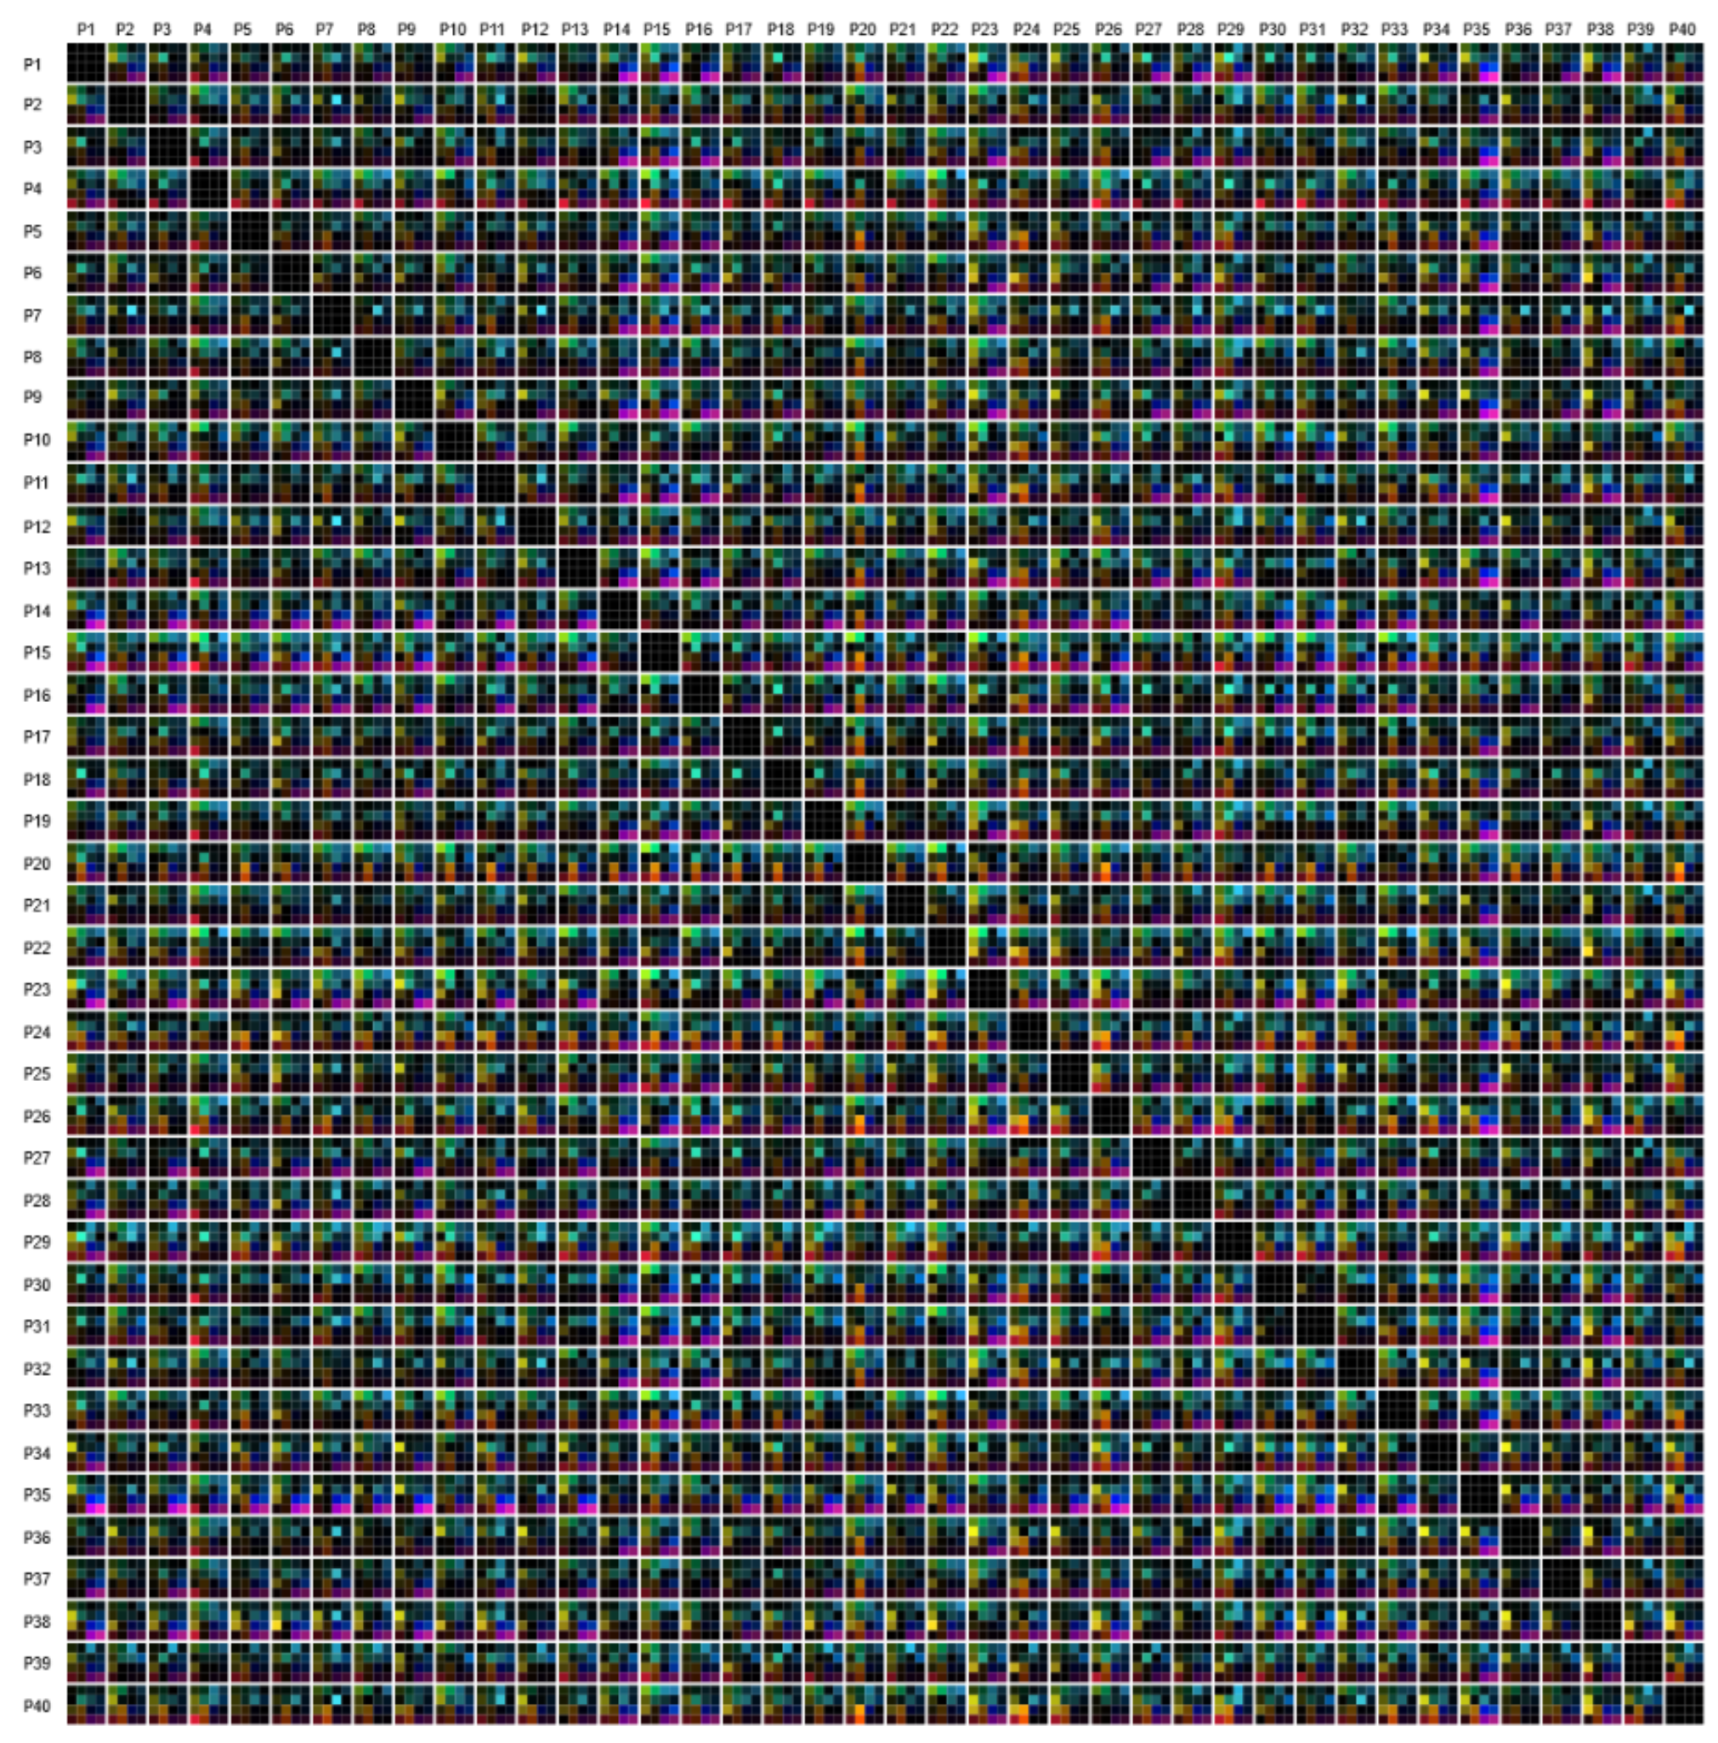
- Matrix visualization: A complementary view on the multivariate eye-tracking metrics is provided by a matrix visualization that encodes the metrics in the matrix cells as a pairwise comparison between the participants. The similarity values for the pair of participants are then ordered based on correlation coefficients and a Hilbert space-filling curve to preserve locality.
- Interaction techniques: Further interactions are integrated that connect both visual representations, i.e., the parallel coordinates reflecting metrics correlations, but also the matrix visualization, depicting participants groups with similar behaviors based on multiple eye-tracking metrics.
Methods
Data Model and Preprocessing
Visualization and Visual Analytics
Results
Utilizing Our Framework
Discussion
Conclusion and Future Work
Ethics and Conflict of Interest
Acknowledgments
References
- Anderson, N. C., F. Anderson, A. Kingstone, and W. F. Bischof. 2015. A comparison of scanpath comparison methods. Behavior Research Methods 47, 4: 1377–1392. [Google Scholar] [CrossRef] [PubMed]
- Blascheck, T., M. Burch, M. Raschke, and D. Weiskopf. 2015. Challenges and perspectives in big eye movement data visual analytics. In Proceedings of Symposium on Big Data Visual Analytics, BDVA. pp. 17–24. [Google Scholar] [CrossRef]
- Bouguettaya, A., Q. Yu, X. Liu, X. Zhou, and A. Song. 2015. Efficient agglomerative hierarchical clustering. Expert Systems with Applications 42, 5: 2785–2797. [Google Scholar] [CrossRef]
- Burch, M., L. Chuang, B. Fisher, A. Schmidt, and D. Weiskopf. 2017. Eye Tracking and Visualization: Foundations, Techniques, and Applications. In ETVIS. Springer. [Google Scholar] [CrossRef]
- Burch, M., A. Kumar, K. Mueller, and D. Weiskopf. 2016. Color bands: Visualizing dynamic eye movement patterns. In IEEE Second Workshop on Eye Tracking and Visualization. pp. 40–44. [Google Scholar] [CrossRef]
- Chen, H.-C., and A. L. Chen. 2001. A music recommendation system based on music data grouping and user interests. In Proceedings of the Tenth International Conference on Information and Knowledge Management. pp. 231–238. [Google Scholar] [CrossRef]
- Cleveland, W. S., and R. McGill. 1986. An experiment in graphical perception. International Journal of Man-Machine Studies 25, 5: 491–501. [Google Scholar] [CrossRef]
- d’Ocagne, M. Coordonnées parallèles & axiales: Méthode de transformation géométrique et proceed nouveau de calcul graphique déduits de la considération des coordonnées parallèles. Gauthier-Villars.
- Fua, Y.-H., M. O. Ward, and E. A. Rundensteiner. 1999. Hierarchical parallel coordinates for exploration of large datasets. In Proceedings of the Conference on Visualization’ 99. vol. 99, pp. 43–50. [Google Scholar] [CrossRef]
- Graham, M., and J. Kennedy. 2003. Using curves to enhance parallel coordinate visualisations. In Seventh International Conference on Information Visualization. pp. 10–16. [Google Scholar] [CrossRef]
- Hauser, H., F. Ledermann, and H. Doleisch. 2002. Angular brushing of extended parallel coordinates. In IEEE Symposium on Information Visualization. pp. 127–130. [Google Scholar] [CrossRef]
- Heinrich, J., Y. Luo, A. E. Kirkpatrick, H. Zhang, and D. Weiskopf. 2011. Evaluation of a bundling technique for parallel coordinates. arXiv arXiv:1109.6073. [Google Scholar]
- Heinrich, J., and D. Weiskopf. 2013. State of the art of parallel coordinates. In Eurographics 2013—State of the Art Reports. pp. 95–116. [Google Scholar] [CrossRef]
- Holmqvist, K., M. Nyström, R. Andersson, R. Dewhurst, J. Halszka, and J. van de Weijer. 2011. Eye tracking: A Comprehensive Guide to Methods and Measure. Oxford University Press. [Google Scholar]
- Inselberg, A. 1985. The plane with parallel coordinates. The Visual Computer 1, 2: 69–91. [Google Scholar] [CrossRef]
- Krejtz, K., A. Coltekin, A. Duchowski, and A. Niedzielska. 2017. Using coefficient k to distinguish ambient/focal visual attention during map viewing. Journal of Eye Movement Research 10, 2. [Google Scholar] [CrossRef]
- Kumar, A., R. Netzel, M. Burch, D. Weiskopf, and K. Mueller. 2016. Multi-similarity matrices of eye movement data. In IEEE Second Workshop on Eye Tracking and Visualization. pp. 26–30. [Google Scholar] [CrossRef]
- Kurzhals, K., M. Burch, T. Pfeiffer, and D. Weiskopf. 2015. Eye tracking in computer-based visualization. Computing in Science and Engineering 17, 5: 64–71. [Google Scholar] [CrossRef]
- Kurzhals, K., F. Heimerl, and D. Weiskopf. 2014. IseeCube: Visual analysis of gaze data for video. In Proceedings of the Symposium on Eye Tracking Research and Applications. pp. 43–50. [Google Scholar] [CrossRef]
- LeBlanc, J., M. O. Ward, and N. Wittels. 1990. Exploring n-dimensional databases. In Proceedings of the 1st Conference on Visualization. pp. 230–237. [Google Scholar] [CrossRef]
- Li, X., A. Çöltekin, and M.-J. Kraak. 2010. Visual exploration of eye movement data using the spacetimecube. In International Conference on Geographic Information Science. pp. 295–309. [Google Scholar] [CrossRef]
- Moon, B., H. V. Jagadish, C. Faloutsos, and J. H. Saltz. 2001. Analysis of the clustering properties of the Hilbert space-filling curve. IEEE Transactions on Knowledge and Data Engineering 13, 1: 124–141. [Google Scholar] [CrossRef]
- Netzel, R., B. Ohlhausen, K. Kurzhals, R. Woods, M. Burch, and D. Weiskopf. 2017. User performance and reading strategies for metro maps: An eye tracking study. Spatial Cognition & Computation 17, 1–2: 39–64. [Google Scholar] [CrossRef]
- Pajer, S., M. Streit, T. Torsney-Weir, F. Spechtenhauser, T. Möller, and H. Piringer. 2017. Weightlifter: Visual weight space exploration for multicriteria decision making. IEEE Transactions on Visualization and Computer Graphics 23, 1: 611–620. [Google Scholar] [CrossRef] [PubMed]
- Paliouras, G., C. Papatheodorou, V. Karkaletsis, and C. D. Spyropoulos. 2002. Discovering user communities on the internet using unsupervised machine learning techniques. Interacting with Computers 14, 6: 761–791. [Google Scholar] [CrossRef]
- Raschke, M., X. Chen, and T. Ertl. 2012. Parallel scanpath visualization. In Proceedings of the 2012 Symposium on Eye Tracking Research and Applications. pp. 165–168. [Google Scholar] [CrossRef]
- Rosenholtz, R., Y. Li, J. Mansfield, and Z. Jin. 2005. Feature congestion: A measure of display clutter. In Proceedings of the 2005 Conference on Human Factors in Computing Systems. pp. 761–770. [Google Scholar] [CrossRef]
- Shi, X., J. Zhu, R. Cai, and L. Zhang. 2009. User grouping behavior in online forums. In Proceedings of the 15th ACM SIGKDD International Conference on Knowledge Discovery and Data Mining. pp. 777–786. [Google Scholar] [CrossRef]
- Vernone, A., P. Berchialla, and G. Pescarmona. 2013. Human protein cluster analysis using amino acid frequencies. PLoS ONE 8, 4: e60220. [Google Scholar] [CrossRef]
- Ware, C. 2012. Information Visualization: Perception for Design. Elsevier. [Google Scholar]
- Wegman, E. J. 1990. Hyperdimensional data analysis using parallel coordinates. Journal of the American Statistical Association 85, 411: 664–675. [Google Scholar] [CrossRef]
- West, J. M., A. R. Haake, E. P. Rozanski, and K. S. Karn. 2006. eyepatterns: Software for identifying patterns and similarities across fixation sequences. In Proceedings of the 2006 Symposium on Eye Tracking Research & Applications. pp. 149–154. [Google Scholar] [CrossRef]


| Eye-Tracking Metric | Definition |
| Average fixation duration | It is often used as an indicator for the cognitive processing depth. High values typically mean that a participant spent more time thinking about an area, for example, due to high complexity of the scene or an absence of intuitiveness in it. Low values in a local area can be the result of stress. |
| The average saccade length | Also called saccade amplitude. A long saccade length can be interpreted as an explorative eye movement, whereas short saccade lengths may occur when the task difficulty increases as short eye movements are used to collect information from a restricted area to support the current cognitive process. |
| Average saccade duration | Average time to move from one fixation to another and therefore the average time with no visual intake. Average saccade duration is decreasing for more difficult tasks, as well as with a decreased processing capacity. |
| Ҡ coefficient | Characterizes dynamics of ambient and focal attention per individual scanpath (Krejtz, Coltekin, Duchowski, & Niedzielska, 2017). Positive values indicate longer fixation durations and shorter saccades: focal attention. Negative values indicate the opposite: longer saccades and shorter fixations, therefore ambient attention. In the ambiguous case, where the coefficient is zero, subjects could have made either long saccades followed by long fixations or short saccades followed by short fixations. Therefore, distinguishing ambient and focal attention is not possible in this case |
| Number of fixations | General measure that can be applied to specifically defined areas or the whole stimulus, and it is correlated to the time spent in an associated area. The combination of spent time and number of fixations could be used to find different kinds of behavior, e.g., areas that exhibit the same number of fixations, but different spent time indicate a different behavior, possibly influenced by the content of the associated area. |
| Fixation rate | Is roughly proportional to the inverse of the average fixation duration. This metric can be used to interpret task difficulty. Furthermore, it is used to predict target density and therefore an indicator for measuring mental workload. |
| Number of saccades | Proportional to the number of fixations and related to the fixation duration. If the number of saccades is increasing, in a fixed amount of time, the fixation duration is decreasing. |
| Saccade rate | In general, almost identical to the fixation rate. It is an indicator for mental workload, arousal, and fatigue. The saccade rate is decreasing with an increase of task difficulty, mental workload, or fatigue. An arousal leads to an increase of the saccade rate. |
| Scanpath length | It is the sum of the length of all saccades. |
| Completion time | Time measured between the start of displaying a stimulus and the participant finishing the task. |
| Standard deviation (x & y) | Used to quantify the amount of variation or dispersion of a distribution. Lower values indicate that the values of the distribution are closer to the mean value, whereas larger values of the distribution indicate a higher dispersion. |
| Skewness (x & y) | Measures the asymmetry of a distribution, i.e., whether the left tail of a unimodal distribution (negative skewness) or the right tail (positive skewness) is longer or fatter. |
| Kurtosis (x & y) | Like skewness, it describes the shape of a distribution. It is the moment of the distribution and tells an analyst the reasons for the variance within the data. Higher kurtosis indicates infrequent extreme deviations, whereas lower kurtosis indicates frequent modestly sized deviations. |
Copyright © 2018. This article is licensed under a Creative Commons Attribution 4.0 International License.
Share and Cite
Kumar, A.; Netzel, R.; Burch, M.; Weiskopf, D.; Mueller, K. Visual Multi-Metric Grouping of Eye-Tracking Data. J. Eye Mov. Res. 2017, 10, 1-17. https://doi.org/10.16910/jemr.10.5.10
Kumar A, Netzel R, Burch M, Weiskopf D, Mueller K. Visual Multi-Metric Grouping of Eye-Tracking Data. Journal of Eye Movement Research. 2017; 10(5):1-17. https://doi.org/10.16910/jemr.10.5.10
Chicago/Turabian StyleKumar, Ayush, Rudolf Netzel, Michael Burch, Daniel Weiskopf, and Klaus Mueller. 2017. "Visual Multi-Metric Grouping of Eye-Tracking Data" Journal of Eye Movement Research 10, no. 5: 1-17. https://doi.org/10.16910/jemr.10.5.10
APA StyleKumar, A., Netzel, R., Burch, M., Weiskopf, D., & Mueller, K. (2017). Visual Multi-Metric Grouping of Eye-Tracking Data. Journal of Eye Movement Research, 10(5), 1-17. https://doi.org/10.16910/jemr.10.5.10