Less Users More Confidence: How AOIs Don't Affect Scanpath Trend Analysis
Abstract
:Open Data
Introduction
Related Work
Methodology
STA: Scanpath Trend Analysis

Eye Tracking Study
Page Segmentation Approaches
Analysis Procedure

Results
Discussion
Conclusion
Ethics and Conflict of Interest
Acknowledgments
Appendix A


References
- Akpınar, M. E., and Y. Yeşilada. 2013. Edited by Q. Z. Sheng and J. Kjeldskov. Vision Based Page Segmentation Algorithm: Extended and Perceived Success. In Current Trends in Web Engineering: ICWE 2013 International Workshops ComposableWeb, QWE, MDWE, DMSSW, EMotions, CSE, SSN, and PhD Symposium, Aalborg, Denmark, July 8-12, 2013. Revised Selected Papers. Springer International Publishing: pp. 238–252. [Google Scholar] [CrossRef]
- Akpınar, M. E., and Y. Yeşilada. 2015. “Old Habits Die Hard!”: Eyetracking Based Experiential Transcoding: A Study with Mobile Users. Paper presented at the Proceedings of the 12th Web for All Conference, New York, NY, USA. [Google Scholar] [CrossRef]
- Alroobaea, R., and P. J. Mayhew. 2014. How many participants are really enough for usability studies? Presented at the 2014 Science and Information Conference. [Google Scholar] [CrossRef]
- Bevan, N., C. Barnum, G. Cockton, J. Nielsen, J. Spool, and D. Wixon. 2003. The “Magic Number 5”: Is It Enough for Web Testing? presented at the CHI ’03 Extended Abstracts on Human Factors in Computing Systems, New York, NY, USA. [Google Scholar] [CrossRef]
- Bing, L., R. Guo, W. Lam, Z.-Y. Niu, and H. Wang. 2014. Web Page Segmentation with Structured Prediction and Its Application in Web Page Classification. Paper presented at the 37th International ACM SIGIR Conference on Research & Development in Information Retrieval, New York, NY, USA. [Google Scholar] [CrossRef]
- Brown, A., C. Jay, and S. Harper. 2010. Audio Access to Calendars. Paper presented at the Proceedings of the 2010 International Cross Disciplinary Conference on Web Accessibility (W4A), New York, NY, USA. [Google Scholar] [CrossRef]
- Caulton, D. A. 2001. Relaxing the homogeneity assumption in usability testing. Behaviour and Information Technology 20, 1: 1–7. [Google Scholar] [CrossRef]
- Cazañas, A., A. de San Miguel, and E. Parra. 2017. Estimating Sample Size for Usability Testing. Enfoqute, 172–185. Available online: http://ingenieria.ute.edu.ec/enfoqueute/index.php/revis.
- Collberg, C., and T. A. Proebsting. 2016. Repeatability in Computer Systems Research. Commun. ACM 59, 3: 62–69. [Google Scholar] [CrossRef]
- Cuzzolaa, J., J. Jovanović, E. Bagheri, and D. Gašević. 2015. Automated Classification and Localization of Daily Deal Content from the Web. Appl. Soft Comput. 31, C: 241–256. [Google Scholar] [CrossRef]
- Ehmke, C., and S. Wilson. 2007. Identifying Web Usability Problems from Eye-tracking Data. Paper presented at the Proceedings of the 21st British HCI Group Annual Conference on People and Computers: HCI...But Not As We Know It—Volume 1, Swinton, UK, Volume 1. Available online: http://dl.acm.org/citation.cfm?id=1531294.1531311.
- Eraslan, S., Y. Yesilada, and S. Harper. 2015. Eye tracking scanpath analysis techniques on web pages: A survey, evaluation and comparison. Journal of Eye Movement Research 9, 1. Available online: https://bop.unibe.ch/index.php/JEMR/article/view/2430.
- Eraslan, S., Y. Yesilada, and S. Harper. 2016a. Eye Tracking Scanpath Analysis on Web Pages: How Many Users? Paper presented at the Ninth Biennial ACM Symposium on Eye Tracking Research & Applications, New York, NY, USA. [Google Scholar] [CrossRef]
- Eraslan, S., Y. Yesilada, and S. Harper. 2016b. Scanpath Trend Analysis on Web Pages: Clustering Eye Tracking Scanpaths. ACM Trans. Web 10, 20: 20:21–20:35. [Google Scholar] [CrossRef]
- Eraslan, S., Y. Yesilada, and S. Harper. 2016c. Trends in Eye Tracking Scanpaths: Segmentation Effect? Paper presented at the 27th ACM Conference on Hypertext and Social Media, New York, NY, USA. [Google Scholar] [CrossRef]
- Faulkner, L. 2003. Beyond the five-user assumption: Benefits of increased sample sizes in usability testing. Behavior Research Methods, Instruments & Computers 35, 3: 379–383. [Google Scholar] [CrossRef]
- Feng, H., W. Zhang, H. Wu, and C. J. Wang. 2016. Web Page Segmentation and Its Application for Web Information Crawling. Paper presented at the 2016 IEEE 28th International Conference on Tools with Artificial Intelligence (ICTAI). [Google Scholar] [CrossRef]
- Hejmady, P., and N. H. Narayanan. 2012. Visual Attention Patterns During Program Debugging with an IDE. Paper presented at the Proceedings of the Symposium on Eye Tracking Research and Applications, New York, NY, USA. [Google Scholar] [CrossRef]
- Hwang, W., and G. Salvendy. 2010. Number of People Required for Usability Evaluation: The 10±2 Rule. Commun. ACM 53, 5: 130–133. [Google Scholar] [CrossRef]
- Jay, C., D. Lunn, and E. Michailidou. 2008. Edited by S. Harper and Y. Yesilada. End User Evaluations. In Web Accessibility: A Foundation for Research. Springer: pp. 107–126. [Google Scholar] [CrossRef]
- Johnson, J. 2010. Designing with the Mind in Mind: Simple Guide to Understanding User Interface Design Rules. Morgan Kaufmann Publishers Inc.: ISBN 9780123750303. [Google Scholar]
- Josephson, S., and M. E. Holmes. 2002. Visual Attention to Repeated Internet Images: Testing the Scanpath Theory on the World Wide Web. Paper presented at the Proceedings of the 2002 Symposium on Eye Tracking Research & Applications, New York, NY, USA. [Google Scholar] [CrossRef]
- Kohlschütter, C., P. Fankhauser, and W. Nejdl. 2010. Boilerplate Detection Using Shallow Text Features. Paper presented at the Proceedings of the Third ACM International Conference on Web Search and Data Mining, New York, NY, USA. [Google Scholar] [CrossRef]
- Kreuzer, R., J. Hage, and A. Feelders. 2015. Edited by P. Cimiano, F. Frasincar, G.-J. Houben and D. Schwabe. A Quantitative Comparison of Semantic Web Page Segmentation Approaches. In Engineering the Web in the Big Data Era: 15th International Conference, ICWE 2015, Rotterdam, The Netherlands, June 23–26, 2015, Proceedings. Springer International Publishing: vol. Proceedings, pp. 374–391. [Google Scholar] [CrossRef]
- Lewis, J. R. 1982. Testing small system customer set-up. Proceedings of the Human Factors and Ergonomics Society Annual Meeting 26: 718–720. [Google Scholar] [CrossRef]
- Michailidou, E. 2006. ViCRAM: Visual Complexity Rankings and Accessibility Metrics. SIGACCESS Access. Comput. (86): 24–27. [Google Scholar] [CrossRef]
- Michailidou, E., S. Harper, and S. Bechhofer. 2008. Visual Complexity and Aesthetic Perception of Web Pages. Paper presented at the Proceedings of the 26th Annual ACM International Conference on Design of Communication, New York, NY, USA. [Google Scholar] [CrossRef]
- Milic-Frayling, N., and R. Sommerer. 2002. SmartView: Flexible Viewing of Web Page Contents. Paper presented at the Poster Proceedings of the Eleventh International World Wide Web Conference; Available online: http://www2002.org/CDROM/poster/172/index.html.
- Needleman, S. B., and C. D. Wunsch. 1970. A General Method Applicable to the Search for Similarities in the Amino Acid Sequence of Two Proteins. Journal of Molecular Biology 48, 3: 443–453. [Google Scholar] [CrossRef] [PubMed]
- Nielsen, J., and T. K. Landauer. 1993. A Mathematical Model of the Finding of Usability Problems. Paper presented at the Proceedings of the INTERACT ’93 and CHI ’93 Conference on Human Factors in Computing Systems, New York, NY, USA. [Google Scholar] [CrossRef]
- Owens, J. W., B. S. Chaparro, and E. M. Palmer. 2011. Text Advertising Blindness: The New Banner Blindness? J. Usability Studies 6, 3: 112:172–112:197. Available online: http://dl.acm.org/citation.cfm?id=2007456.2007460.
- Pernice, K., and J. Nielsen. 2009. How to Conduct Eyetracking Studies. Available online: https://media.nngroup.com/media/reports/free/How_to_Conduct_Eyetracking_Studies.pdf.
- Sanoja, A., and S. Gançarski. 2013. Block-o-Matic: A Web Page Segmentation Tool and its Evaluation. In: 29‘eme journ’ees “Base de donn’ees avanc’ees”, BDA’13. Available online: https://hal.archives-ouvertes.fr/hal-00881693.
- Sanoja, A., and S. Gançarski. 2014. Block-o-Matic: A web page segmentation framework. Paper presented at the 2014 International Conference on Multimedia Computing and Systems (ICMCS). [Google Scholar] [CrossRef]
- Schmettow, M. 2012. Sample Size in Usability Studies. Commun. ACM 55, 4: 64–70. [Google Scholar] [CrossRef]
- Spool, J., and W. Schroeder. 2001. Testing Web Sites: Five Users is Nowhere Near Enough. In Paper presented at the CHI ’01 Extended Abstracts on Human Factors in Computing Systems. New York, NY, USA. [Google Scholar] [CrossRef]
- Spool, J. M., T. Scanlon, C. Snyder, W. Carolyn, and T. DeAngelo. 1999. Web Site Usability: A Designer’s Guide. Morgan Kaufmann Publishers Inc.: ISBN 1-55860-569-X. [Google Scholar]
- Takeuchi, H., and Y. Habuchi. 2007. A Quantitative Method for Analyzing Scan Path Data Obtained by Eye Tracker. Paper presented at the 2007 IEEE Symposium on Computational Intelligence and Data Mining. [Google Scholar] [CrossRef]
- Tobii Technology AB. 2010. Tobii StudioTM 2.X User Manual (Sep. 2010): Tobii Technology AB. [Google Scholar]
- Toh, H. J., and J. L. Hong. 2014. Edited by C. K. Loo, K. S. Yap, K. W. Wong, A. Teoh and K. Huang. Webpage Segmentation Using Ontology and Word Matching. In Neural Information Processing: 21st International Conference, ICONIP 2014, Kuching, Malaysia, November 3-6, 2014. Proceedings, Part II. Springer International Publishing: pp. 454–461. [Google Scholar] [CrossRef]
- Underwood, G., K. Humphrey, and T. Foulsham. 2008. Knowledge-Based Patterns of Remembering: Eye Movement Scanpaths Reflect Domain Experience. In Proceedings of the 4th Symposium of the Workgroup Human-Computer Interaction and Usability Engineering of the Austrian Computer Society on HCI and Usability for Education and Work. Springer-Verlag: pp. 125–144. [Google Scholar] [CrossRef]
- Wei, T., Y. Lu, X. Li, and J. Liu. 2015. Web page segmentation based on the hough transform and vision cues. Paper presented at the 2015 Asia-Pacific Signal and Information Processing Association Annual Summit and Conference (APSIPA). [Google Scholar] [CrossRef]
- Yesilada, Y. 2011. Web Page Segmentation: A Review. Available online: http://emine.ncc.metu.edu.tr/deliverables/emine_D0.p.
- Yesilada, Y., S. Harper, and S. Eraslan. 2013. Experiential Transcoding: An EyeTracking Approach. Paper presented at the Proceedings of the 10th International Cross-Disciplinary Conference on Web Accessibility, New York, NY, USA. [Google Scholar] [CrossRef]
- Zeleny, J., R. Burget, and J. Zendulka. 2017. Box clustering segmentation: A new method for vision-based web page preprocessing. Information Processing & Management 53, 3: 735–750. Available online: http://www.sciencedirect.com/science/article/pii/S030.


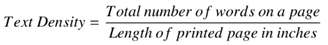
| Page | The Total Number of Words on a Page |
|---|---|
| Apple | 86 |
| Babylon | 156 |
| AVG | 162 |
| Yahoo | 353 |
| Godaddy | 163 |
| BBC | 300 |
| Page | Tasks |
|---|---|
| Apple | (a) Can you locate a link which allows watching the TV ads relating to iPad mini? (b) Can you locate a link labelled iPad on the main menu? |
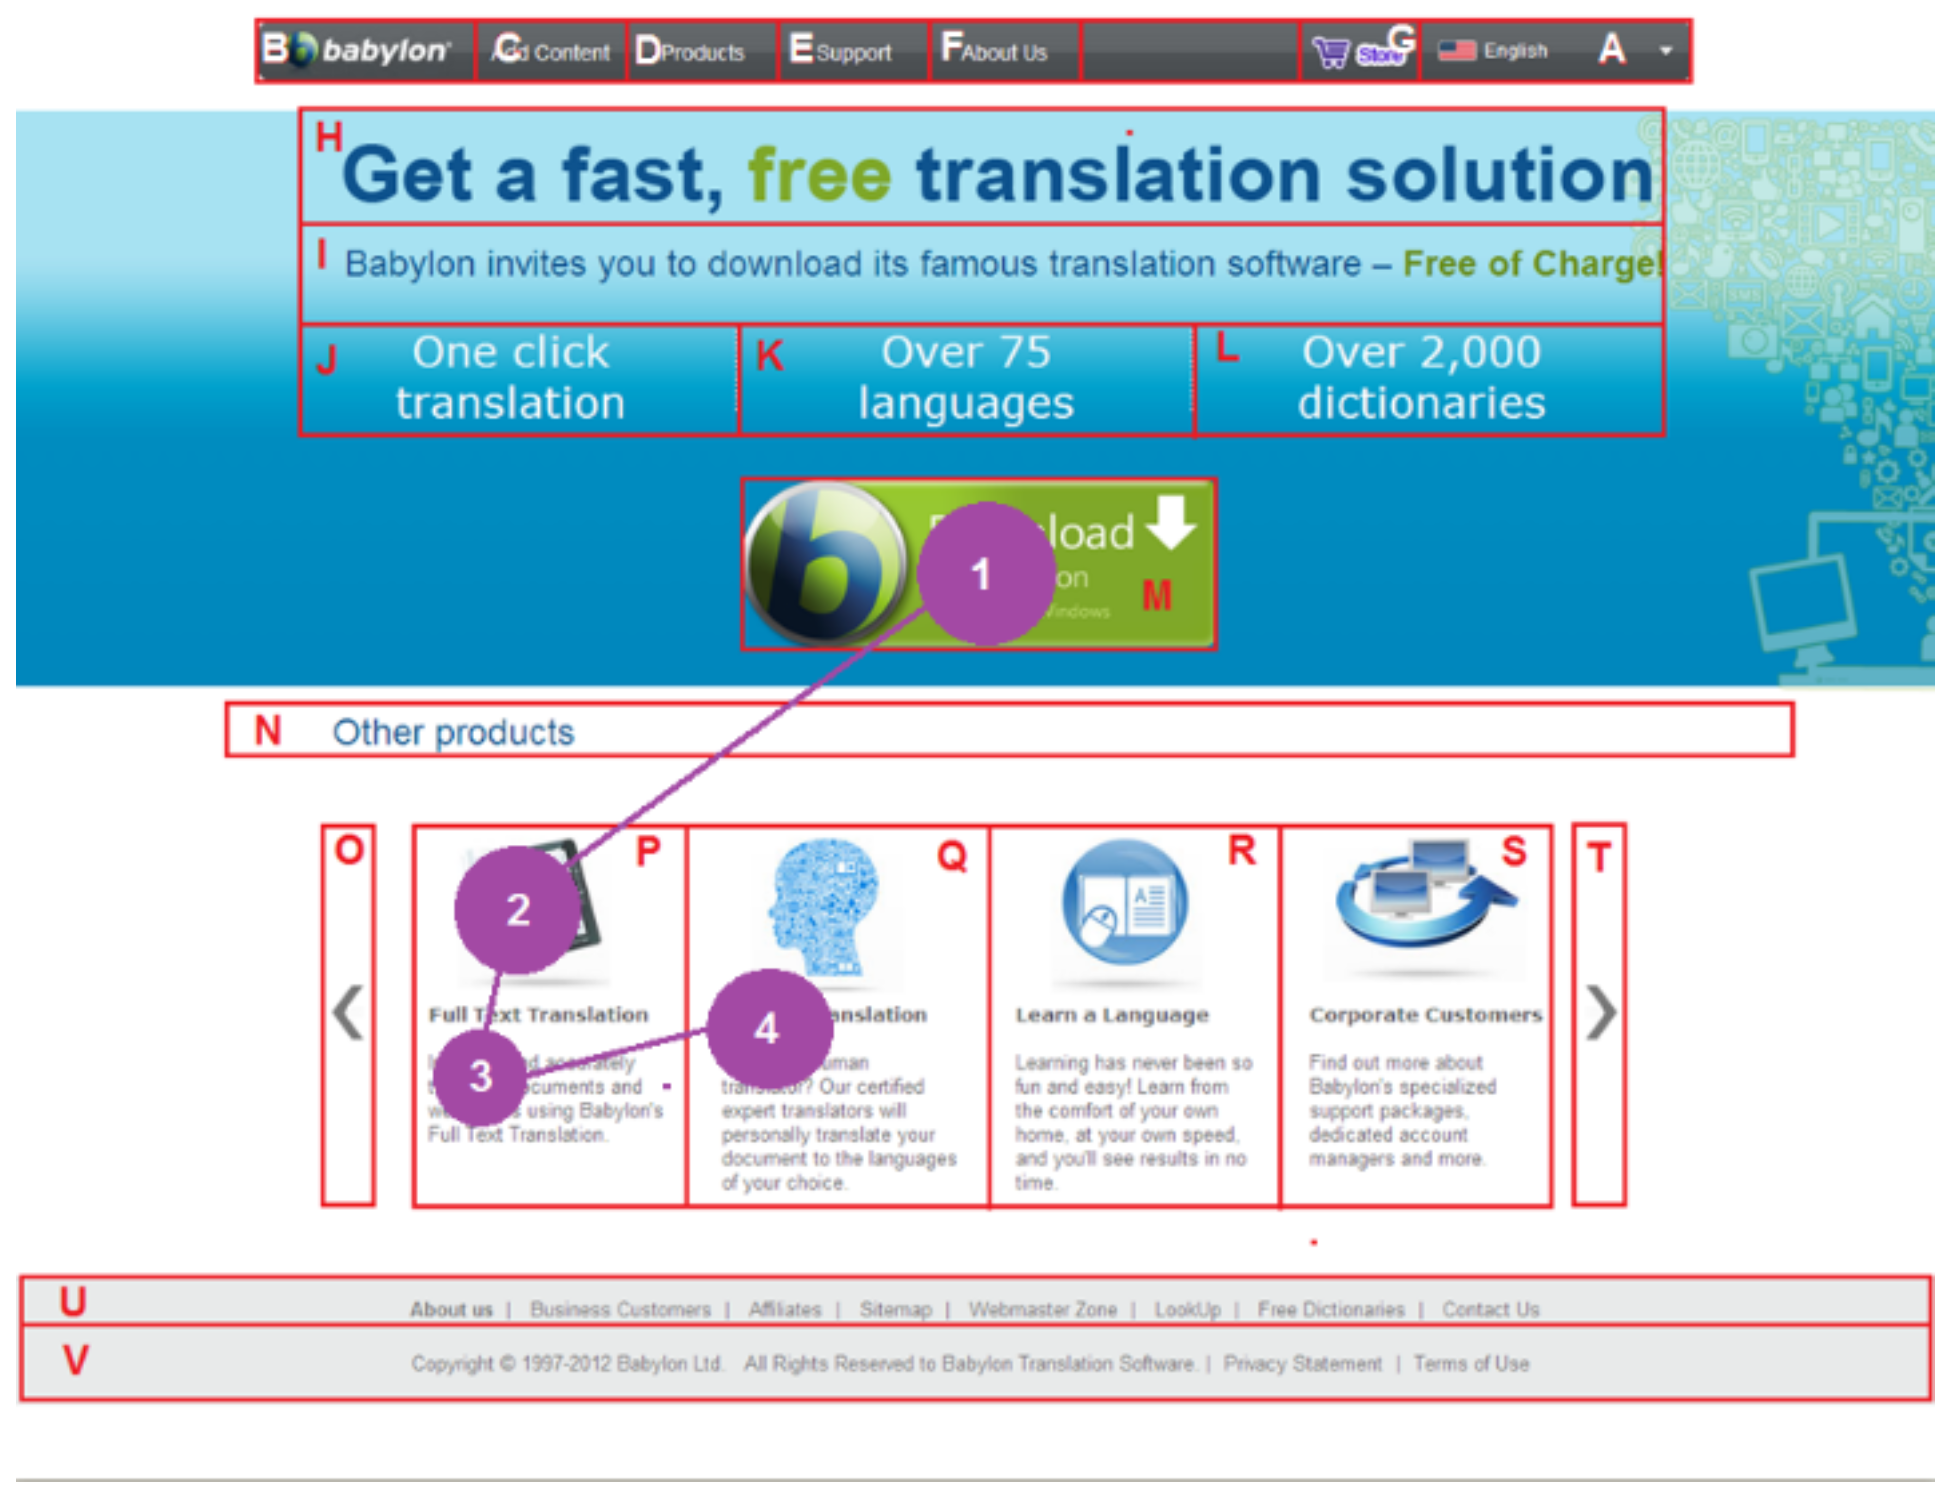
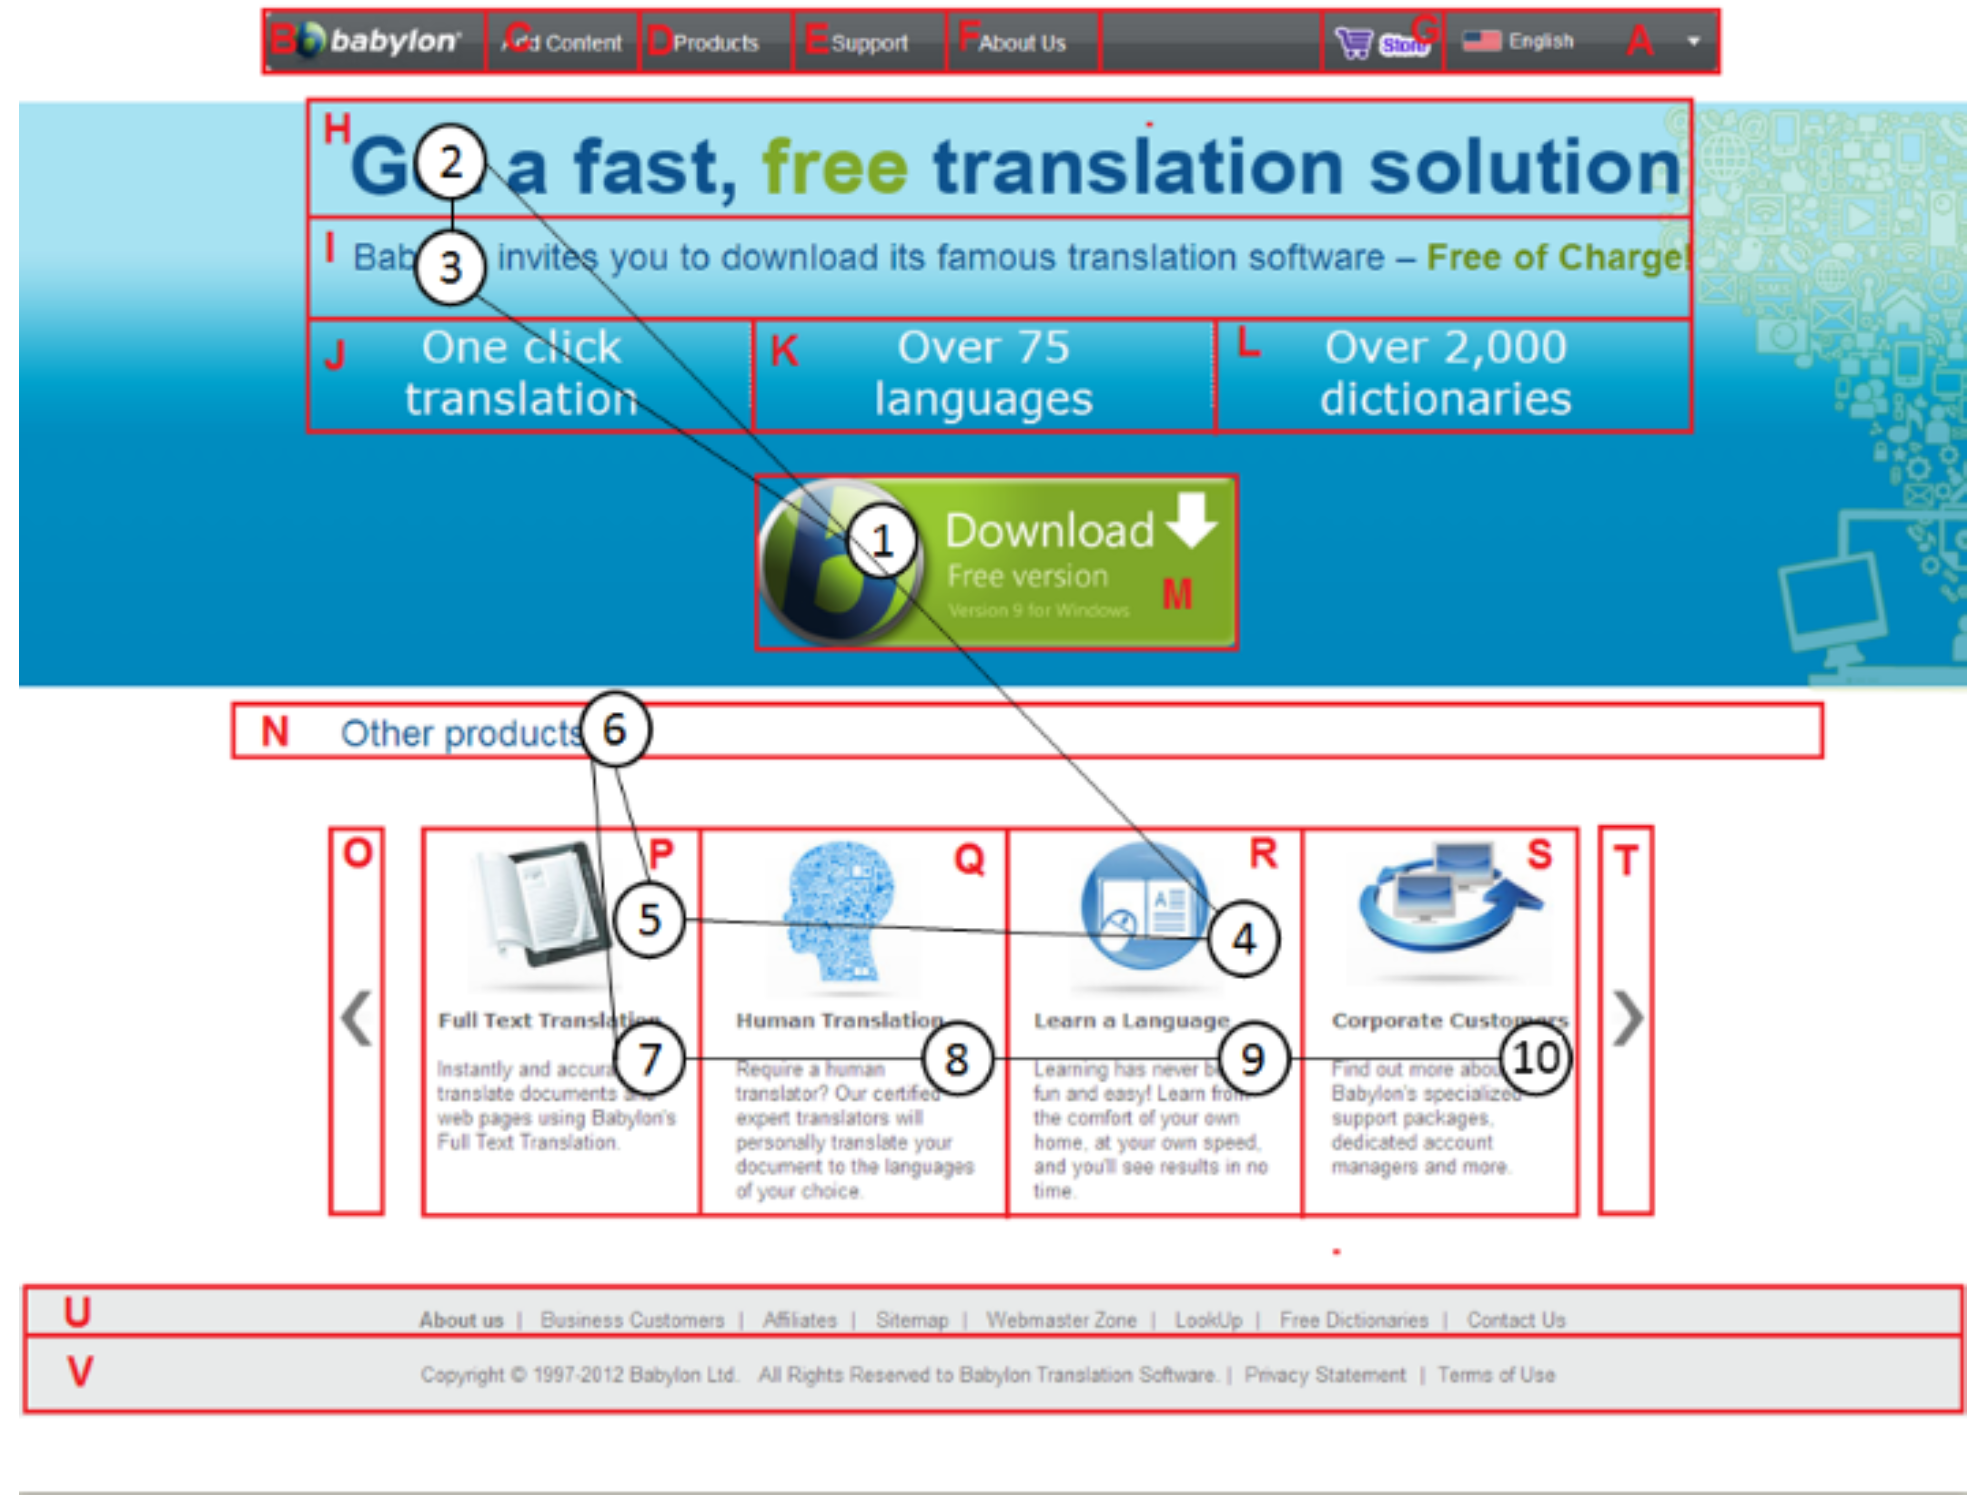
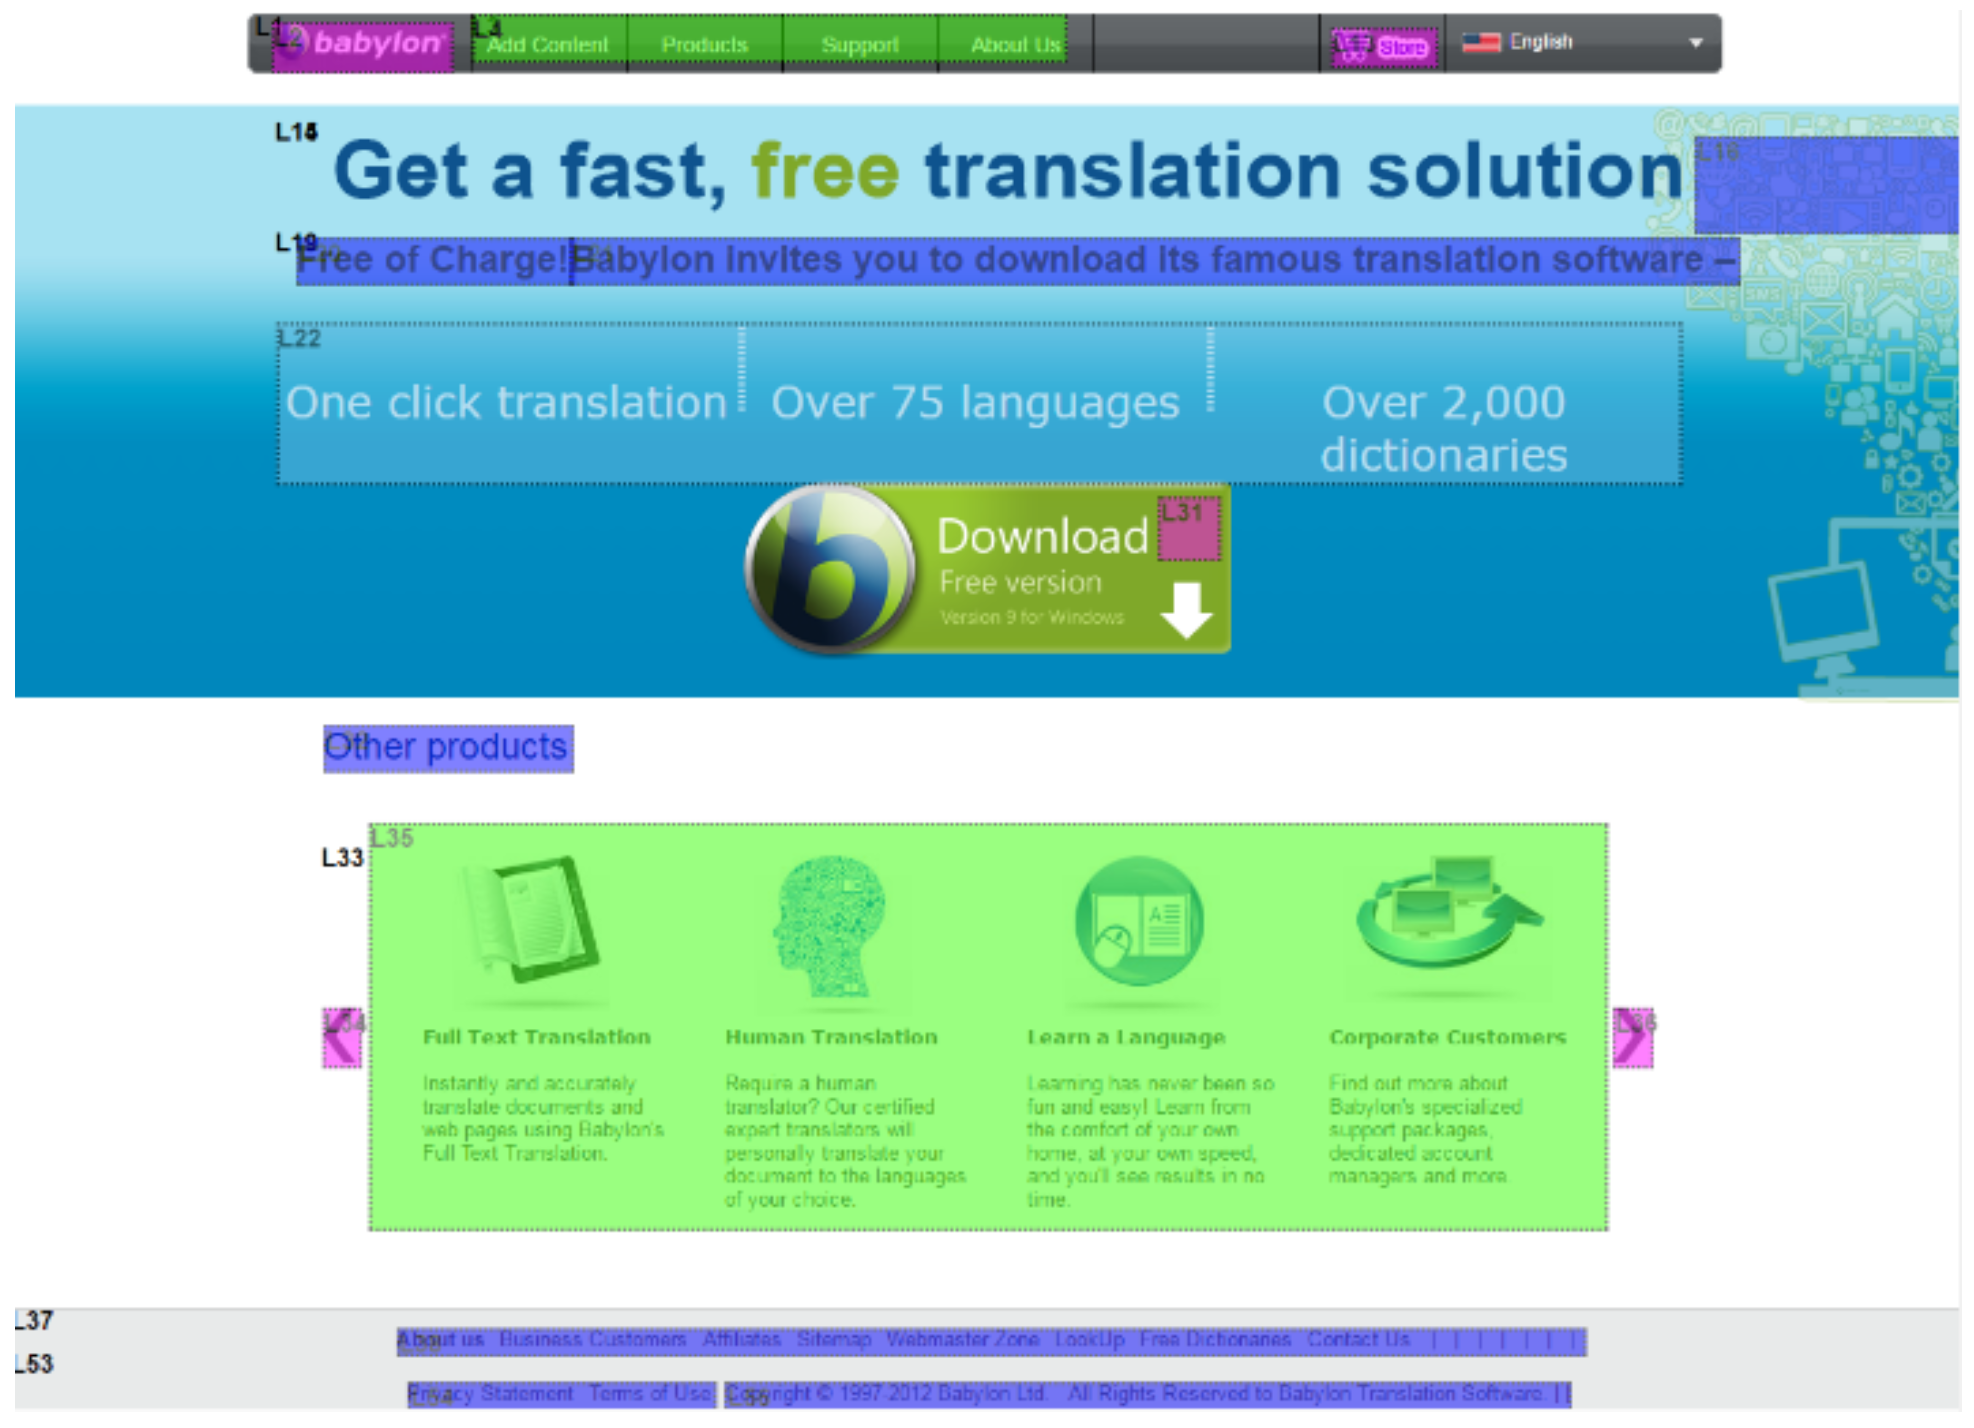
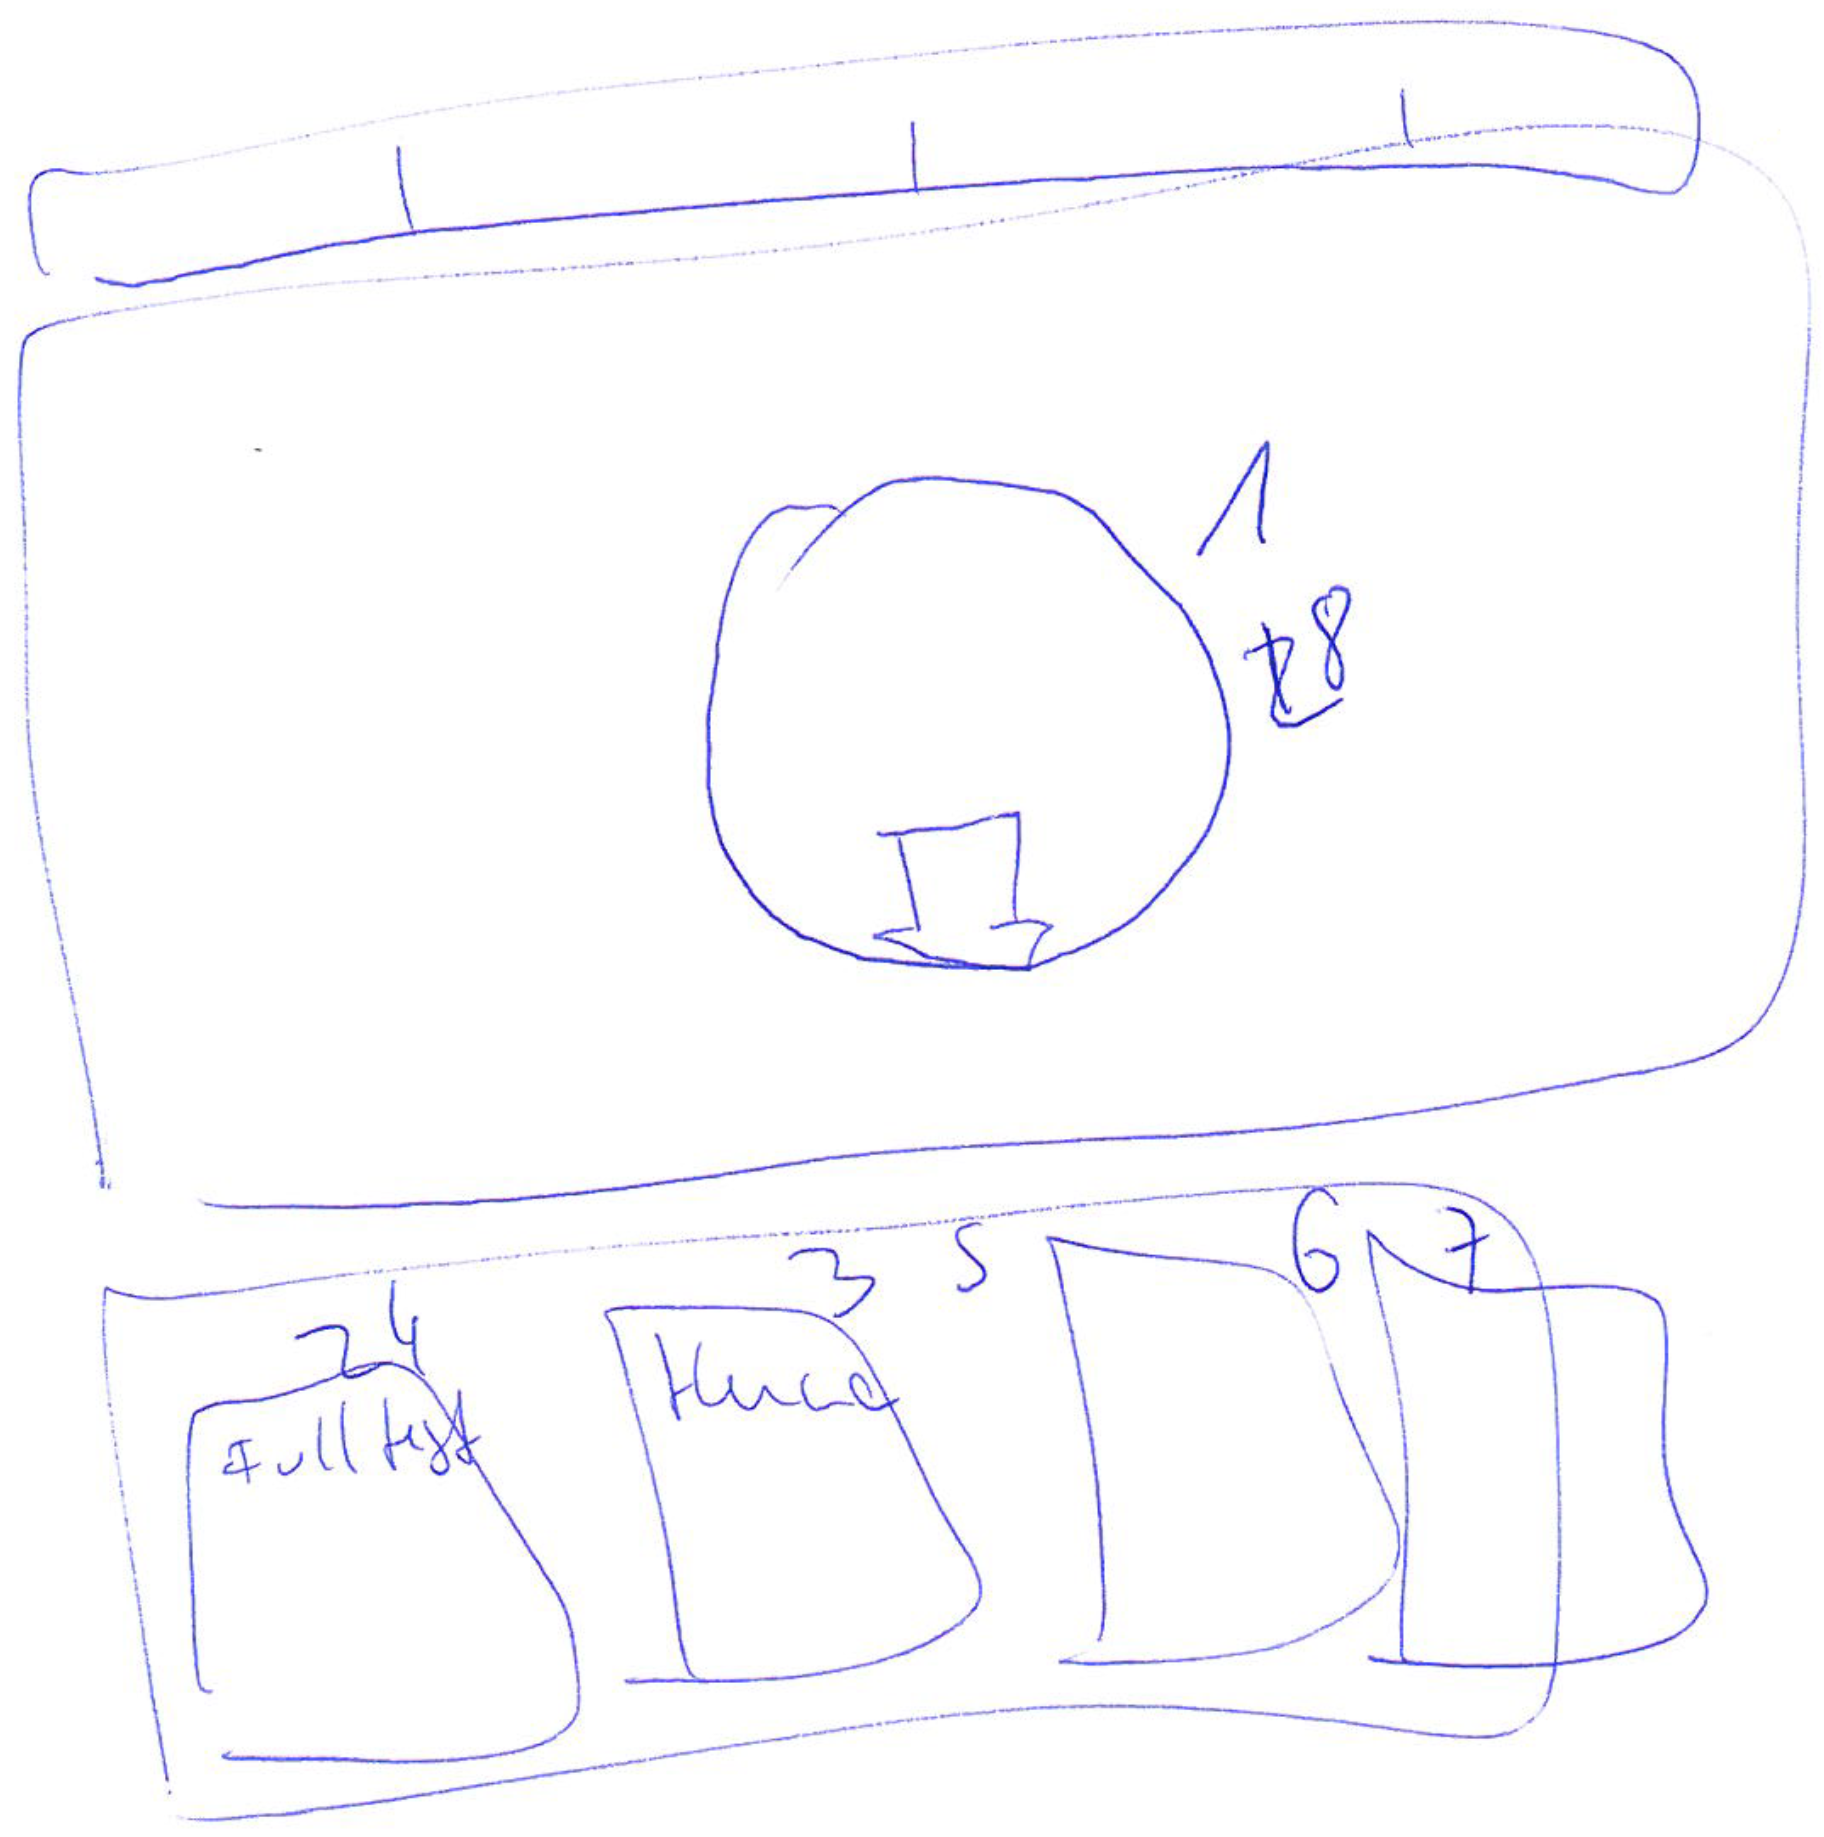
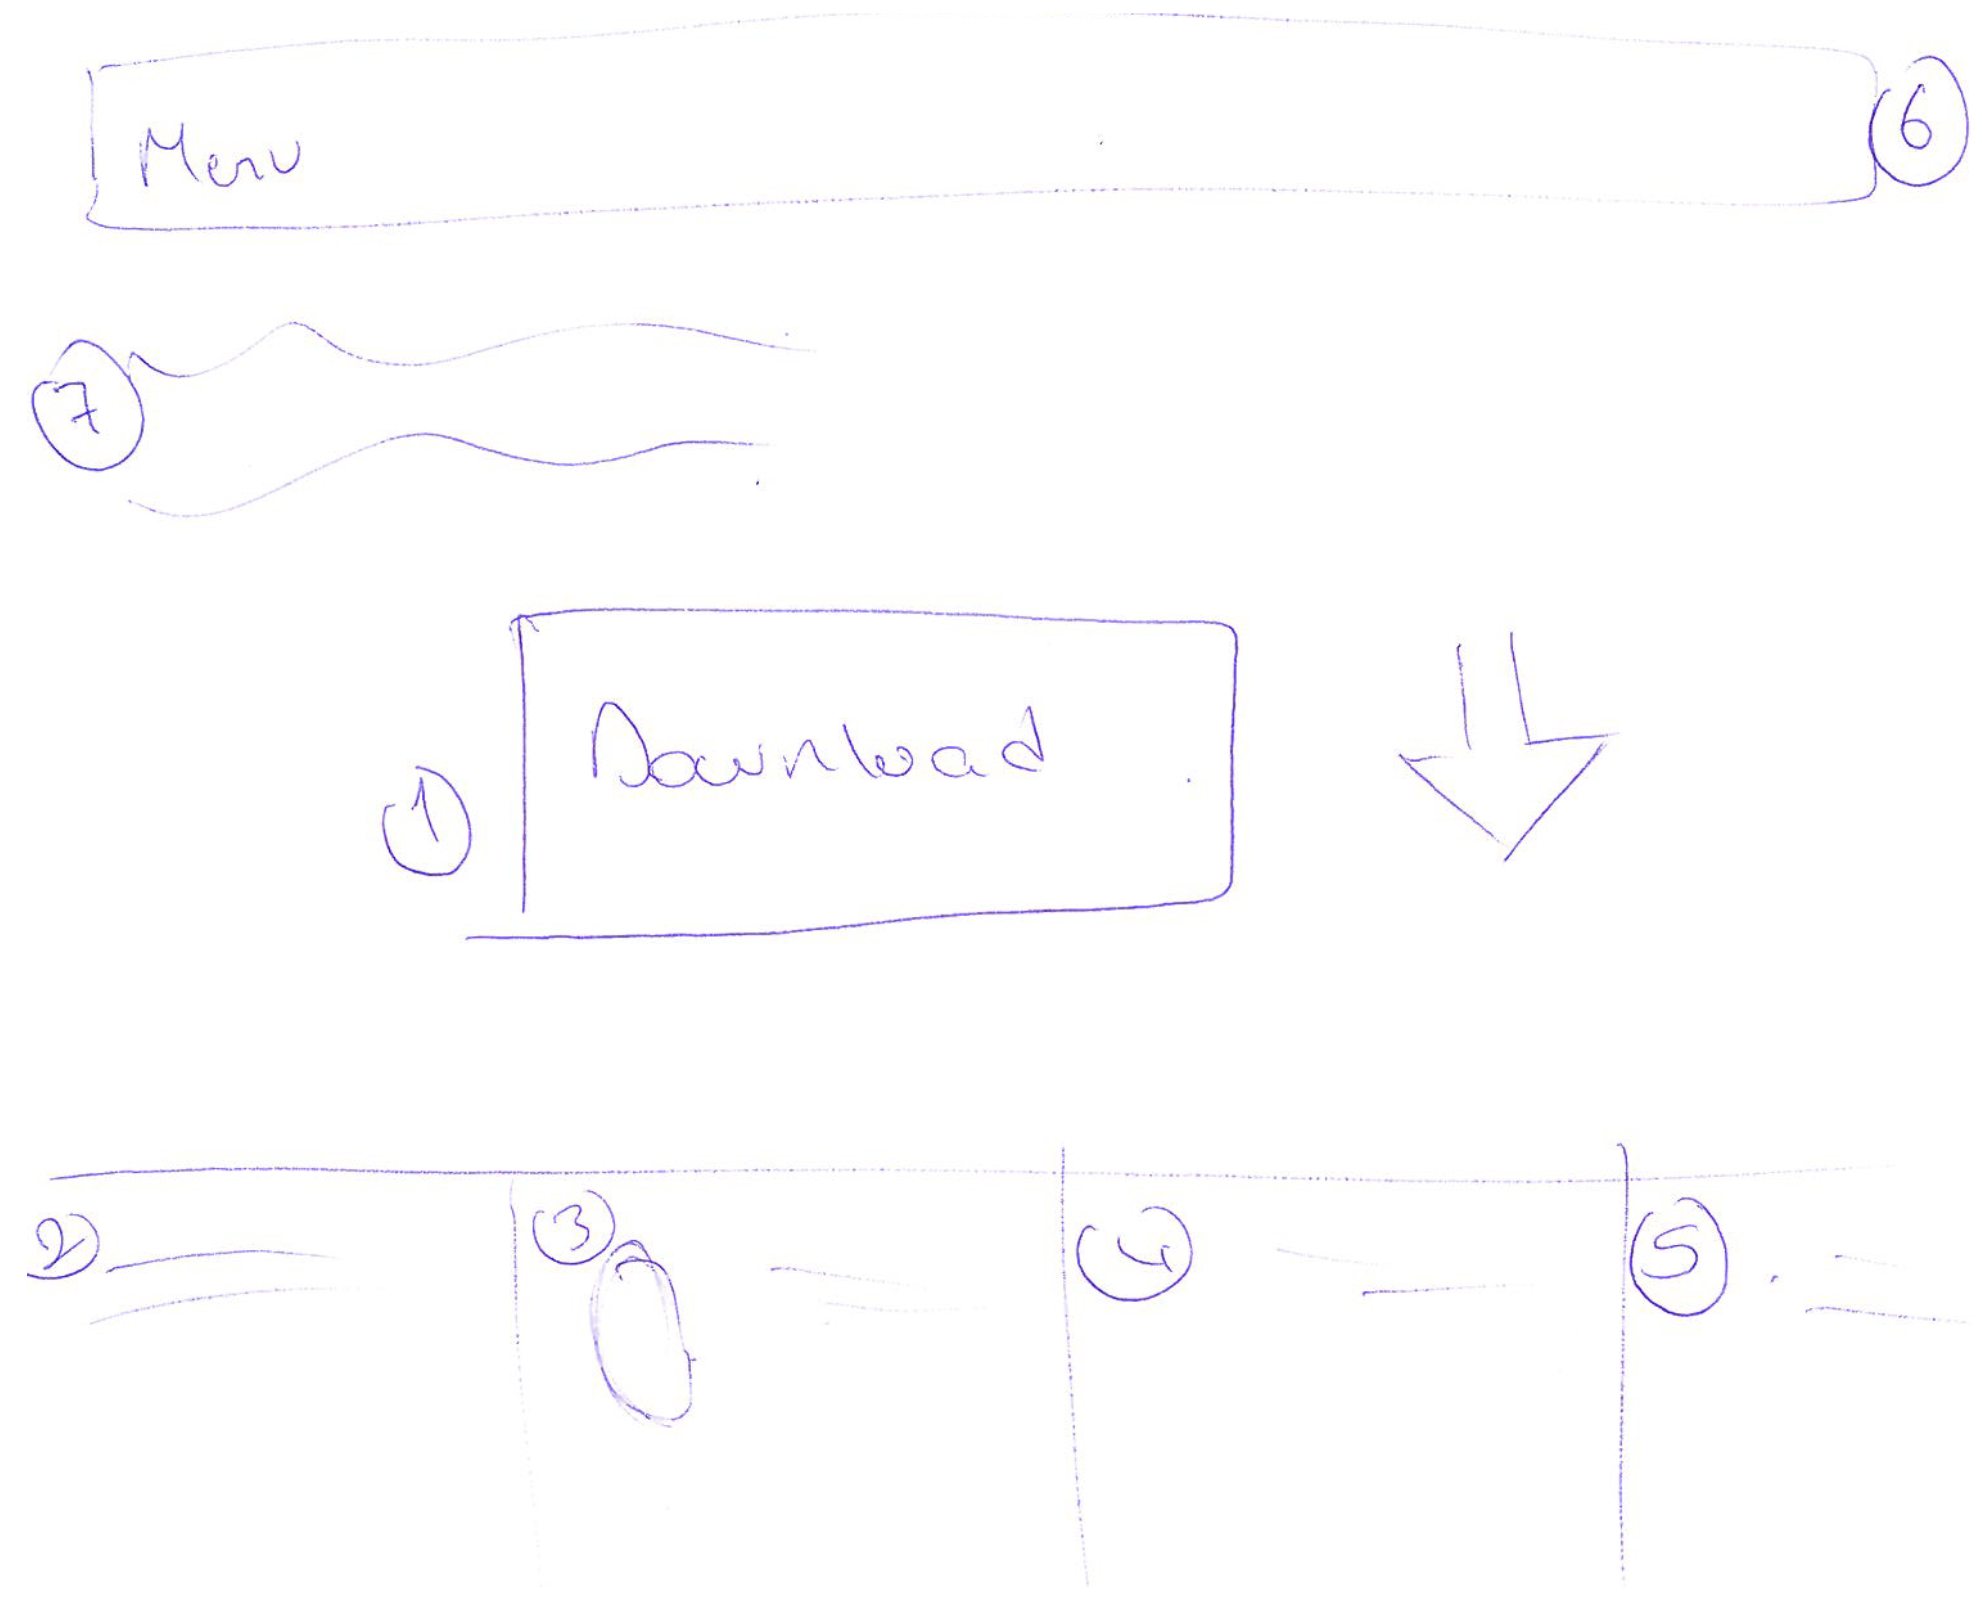
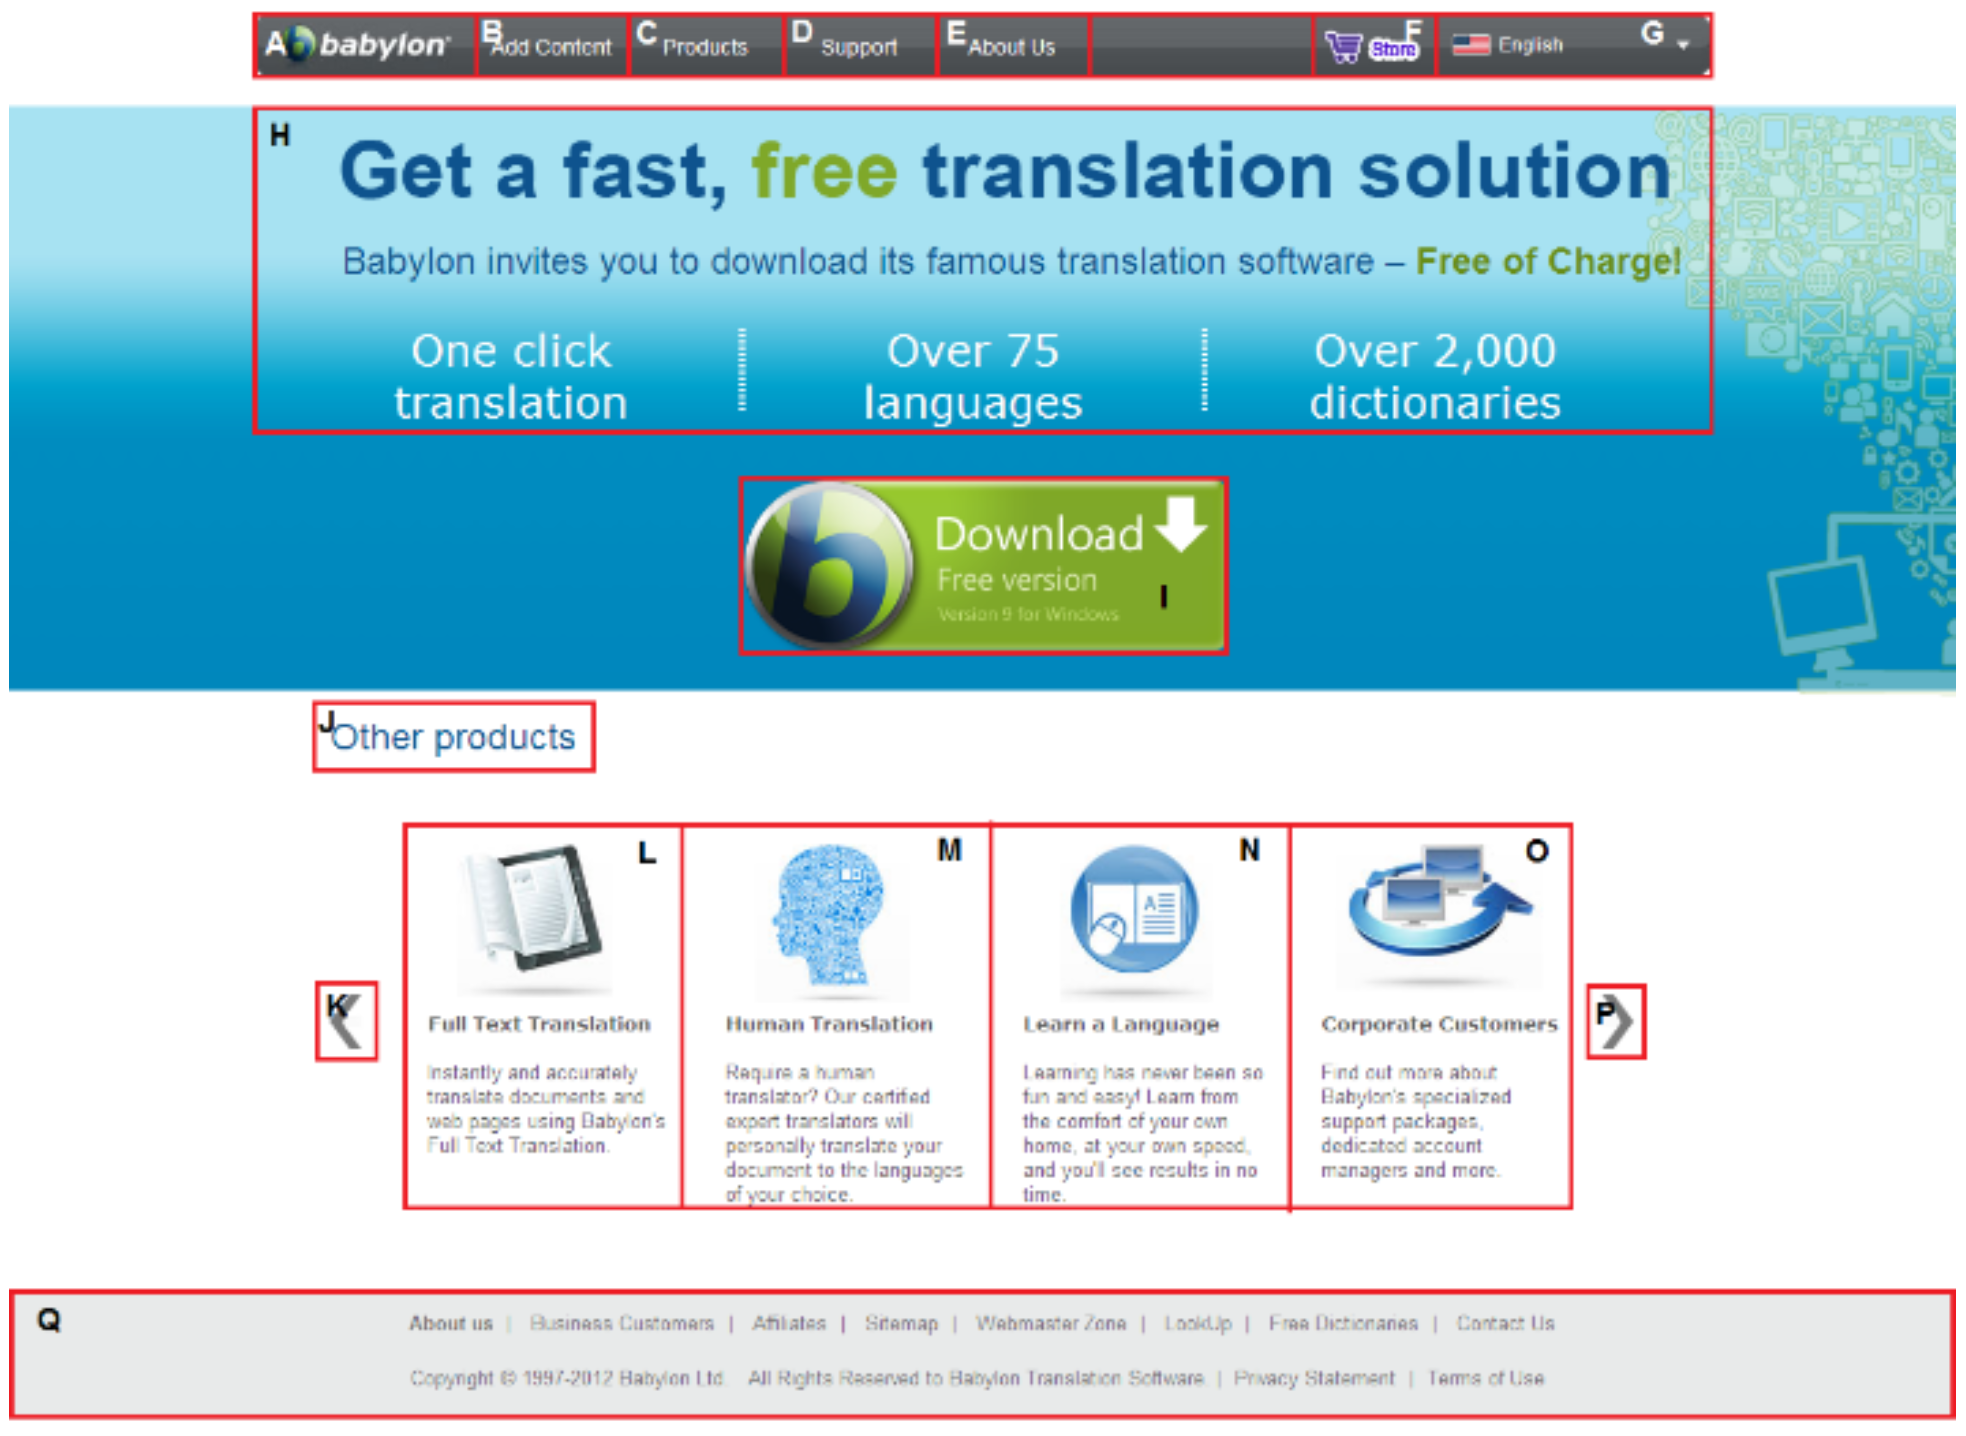
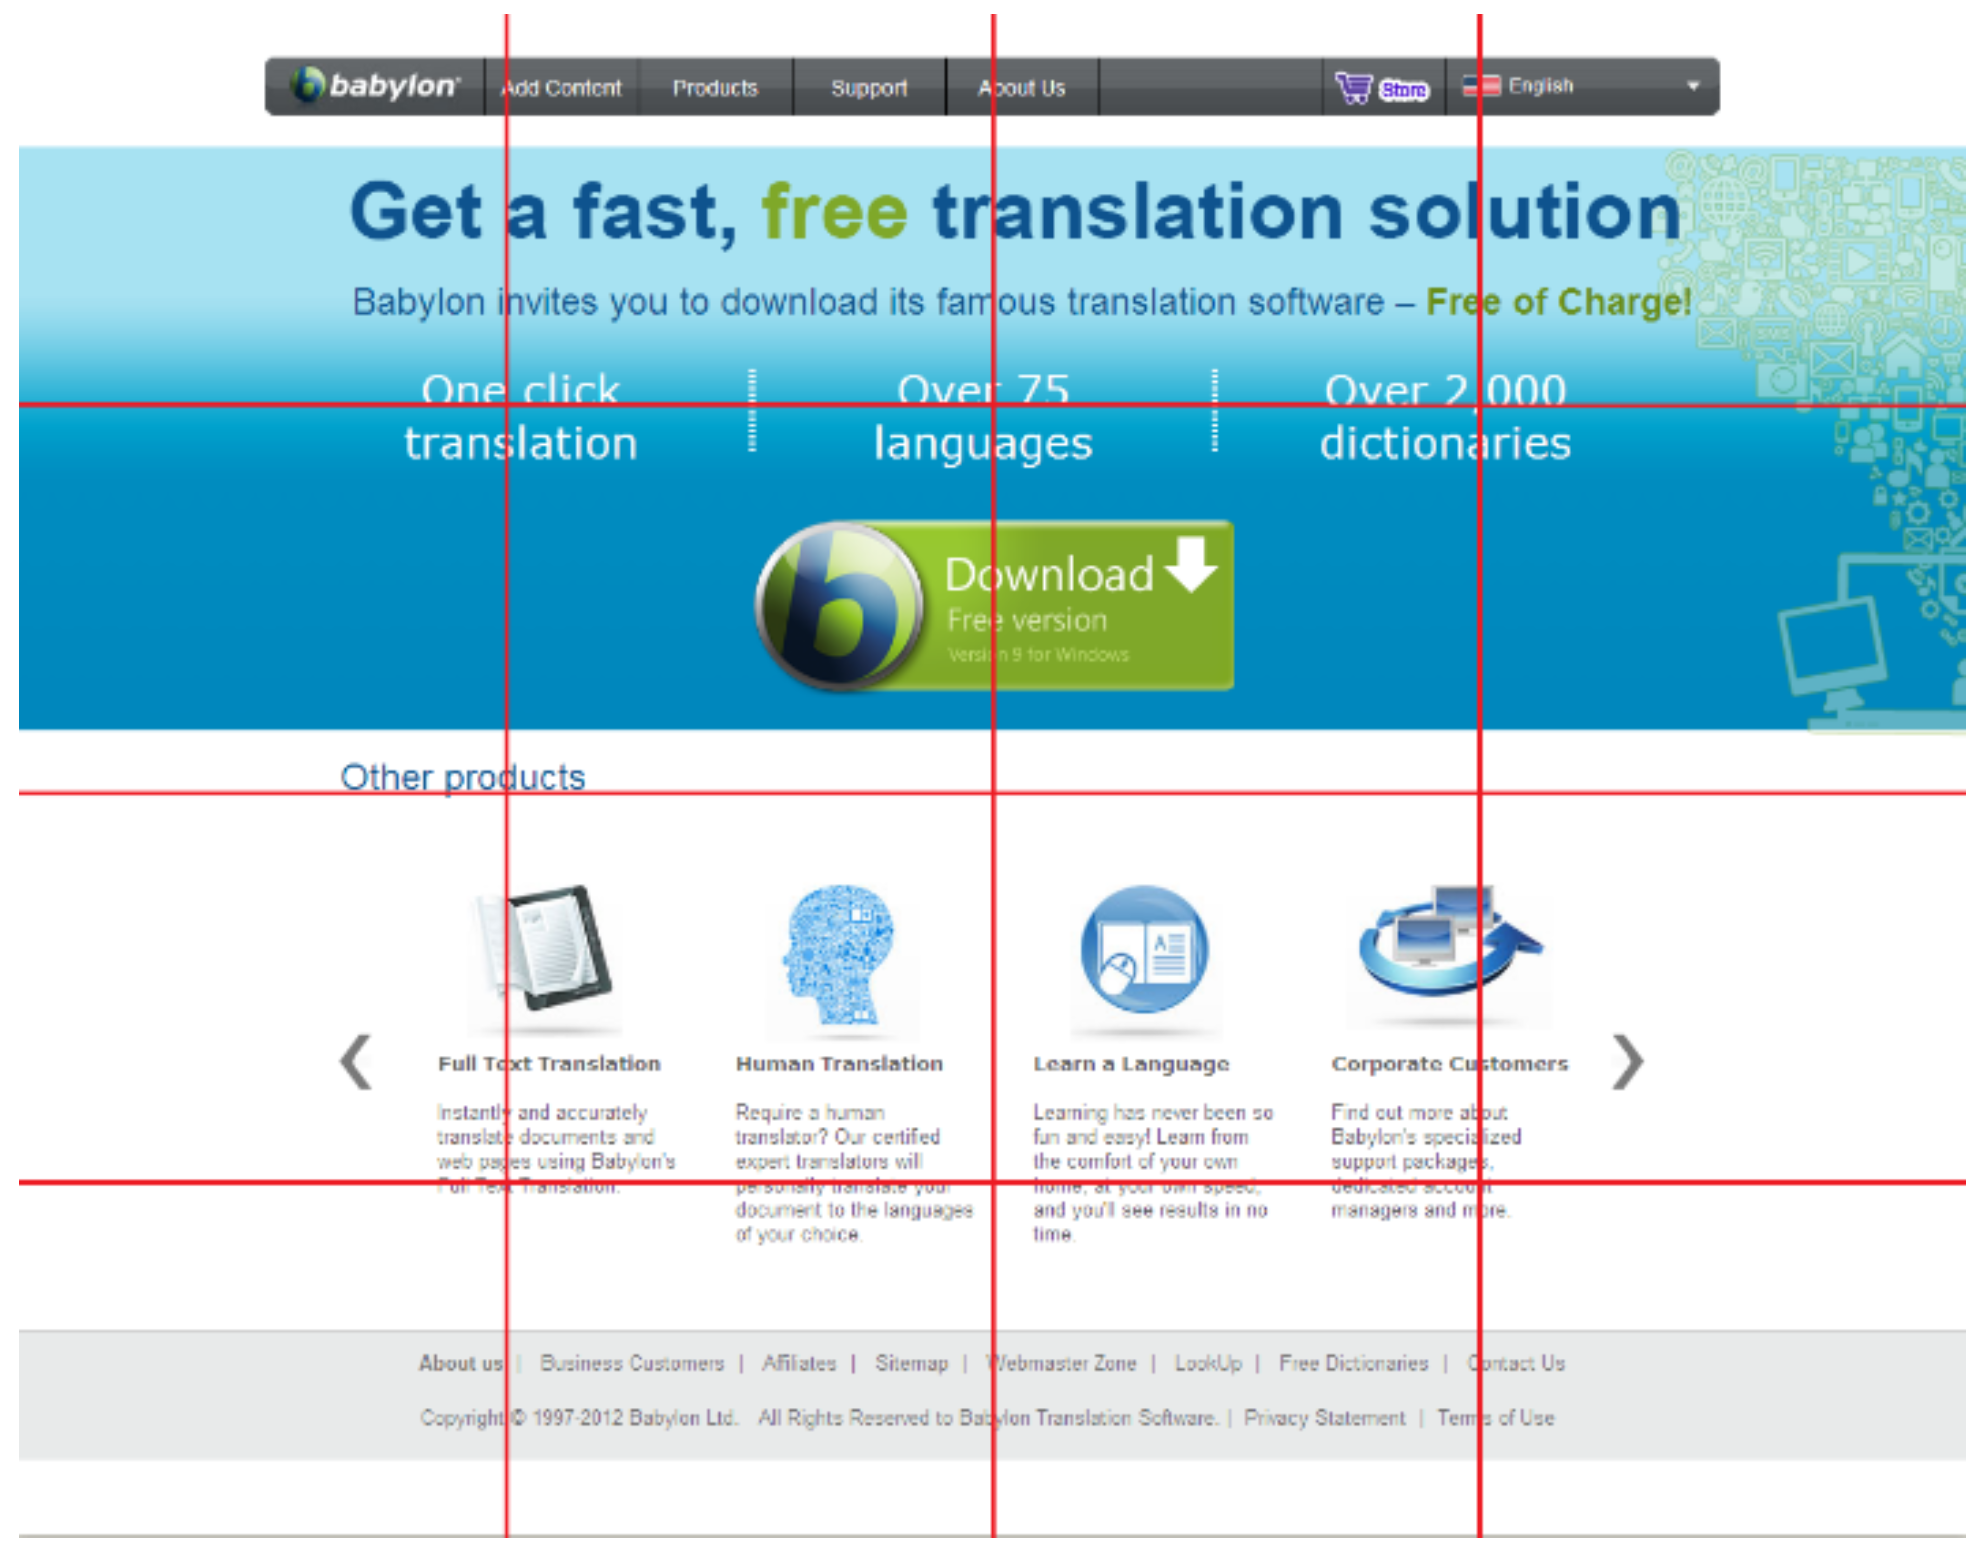
| Babylon | (a) Can you locate a link that you can download the free version of Babylon? (b) Can you find and read the names of other products of Babylon? |
| AVG | (a) Can you locate a link which you can download a free trial of AVG Internet Security 2013? (b) Can you locate a link which allows you to download AVG Anti-virus Free 2013? |
| Yahoo | (a) Can you read the titles of the main headlines which have smaller images? (b) Can you read the first item under the News title? |
| Godaddy | (a) Can you find a telephone number for technical support and read it? (b) Can you locate a text box where you can search for a new domain? |
| BBC | (a) Can you read the first item of the Sport News? (b) Can you locate the table that shows market data under the Business title? |
| Category | Source | Availability |
|---|---|---|
| Clustering | Alcic and Conrad (2011) | ✕ |
| Custom | Cheng and Gotz (2009) | NA |
| Yang and Shi (2009) & Xiang et al. (2007) | ✕ | |
| Guo et al. (2007) | ✕ | |
| Gupta et al. (2007) | NA | |
| Hattori et al. (2007) | ✕ | |
| Gu et al. (2002) | ✕ | |
| Chen et al. (2001) | NA | |
| Sanoja and Gançarski (2014) & Sanoja and Gançarski (2013) - BOM | ✕ | |
| Wei, Lu, Li, and Liu (2015) | ✕ | |
| Zeleny, Burget, and Zendulka (2017) | ✕ | |
| DOM-Based | Fauzi et al. (2009) | NA |
| Vineel (2009) | ✕ | |
| Xiao et al. (2008) | ✕ | |
| Chen et al. (2005, 2003) | ✕ | |
| Yin and Lee (2005) | ✕ | |
| Liu et al. (2004) | ✕ | |
| Lin and Ho (2002) | NA | |
| Heuristics | Toh and Hong (2014) | ✕ |
| Burget and Rudolfova (2009) Burget (2007) | NA | |
| Ahmadi and Kong (2008) | ✕ | |
| Michailidou et al. (2008) | ✓ | |
| Kreuzer, Hage, and Feelders (2015) | NA | |
| Debnath et al. (2005) | ✕ | |
| Kovacevic et al. (2002) | ✕ | |
| Milic-Frayling and Sommerer (2002) | NA | |
| Image Processing Algorithms | Cao et al. (2010) | ✕ |
| Machine Learning | Chakrabarti et al. (2008) | ✕ |
| Borodin et al. (2007) | NA | |
| Mahmud et al. (2007) | NA | |
| Baluja (2006) | ✕ | |
| Bing, Guo, Lam, Niu, and Wang (2014) | NA | |
| Feng, Zhang, Wu, and Wang (2016) | ✕ | |
| Pattern Matching | Xiang and Shi (2006) | ✕ |
| Nanno et al. (2004) | ✕ | |
| Cuzzolaa, Jovanović, Bagheri, and Gašević (2015) | ✕ | |
| Whang et al. (2001) & Hwang et al. (2003) | NA | |
| Ranking-Based | Yin and Lee (2004) | NA |
| Text-Based | Sun et al. (2011) | NA |
| Kohlschütter et al. (2010) | NA | |
| Kohlschütter (2009) | NA | |
| Kohlschütter and Nejdl (2008) | ✕ |
| Page | Approach | N | M | MD | SD | Max | Min |
|---|---|---|---|---|---|---|---|
| Apple | VIPS | 18 | 2.68 | 0.82 | 5.46 | 23.57 | 0.06 |
| BOM | 7 | 7.54 | 3.38 | 9.57 | 26.58 | 0.77 | |
| User driven | 18 | 2.58 | 0.76 | 4.84 | 21.03 | 0.30 | |
| Babylon | VIPS | 22 | 1.98 | 1.60 | 1.65 | 5.27 | 0.24 |
| BOM | 13 | 2.79 | 1.05 | 4.39 | 16.09 | 0.06 | |
| User driven | 17 | 2.62 | 0.56 | 3.98 | 15.58 | 0.14 | |
| AVG | VIPS | 25 | 1.97 | 0.45 | 4.65 | 20.93 | 0.07 |
| BOM | 7 | 6.99 | 1.82 | 8.16 | 21.05 | 0.32 | |
| User driven | 20 | 2.41 | 2.47 | 1.90 | 8.35 | 0.44 | |
| Yahoo | VIPS | 10 | 6.93 | 1.94 | 9.57 | 25.78 | 0.19 |
| BOM | 12 | 5.09 | 1.56 | 7.13 | 24.78 | 0.08 | |
| User driven | 24 | 2.57 | 0.92 | 2.88 | 9.14 | 0.10 | |
| Godaddy | VIPS | 16 | 4.16 | 0.52 | 9.44 | 35.15 | 0.10 |
| BOM | 11 | 5.64 | 1.46 | 7.21 | 18.42 | 0.11 | |
| User driven | 19 | 2.94 | 1.18 | 4.36 | 17.61 | 0.35 | |
| BBC | VIPS | 21 | 3.22 | 0.95 | 4.26 | 12.90 | 0.15 |
| BOM | 5 | 14.43 | 8.79 | 16.28 | 43.22 | 4.24 | |
| User driven | 10 | 6.72 | 6.62 | 3.85 | 14.45 | 0.17 |
| Task | i | With the BOM | With the VIPS | Difference |
|---|---|---|---|---|
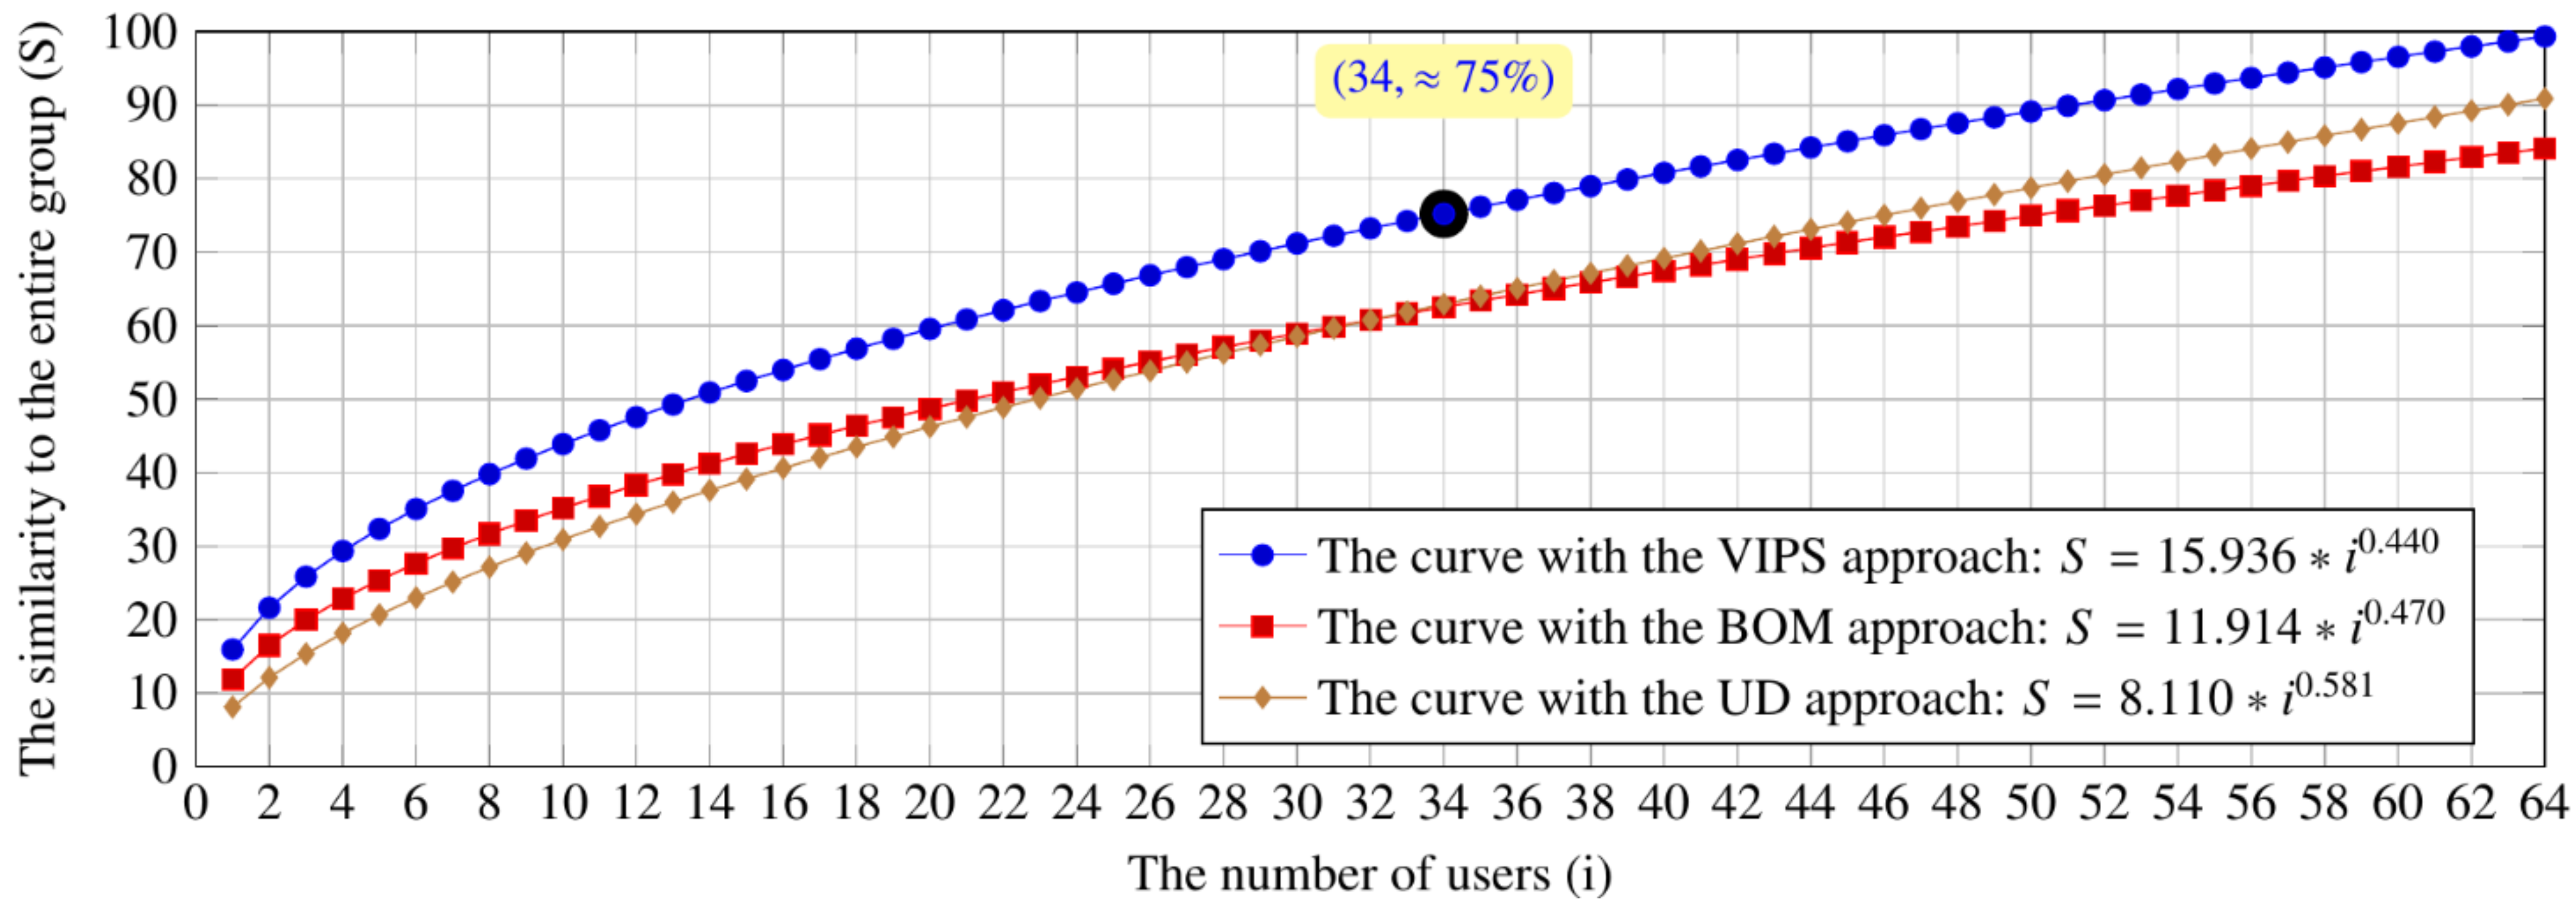
| Browsing | 1 | 11.91 | 15.94 | 4.02 |
| 2 | 16.50 | 21.62 | 5.12 | |
| 3 | 19.97 | 25.84 | 5.87 | |
| 4 | 22.86 | 29.33 | 6.47 | |
| 5 | 25.38 | 32.35 | 6.97 | |
| … | … | … | … | |
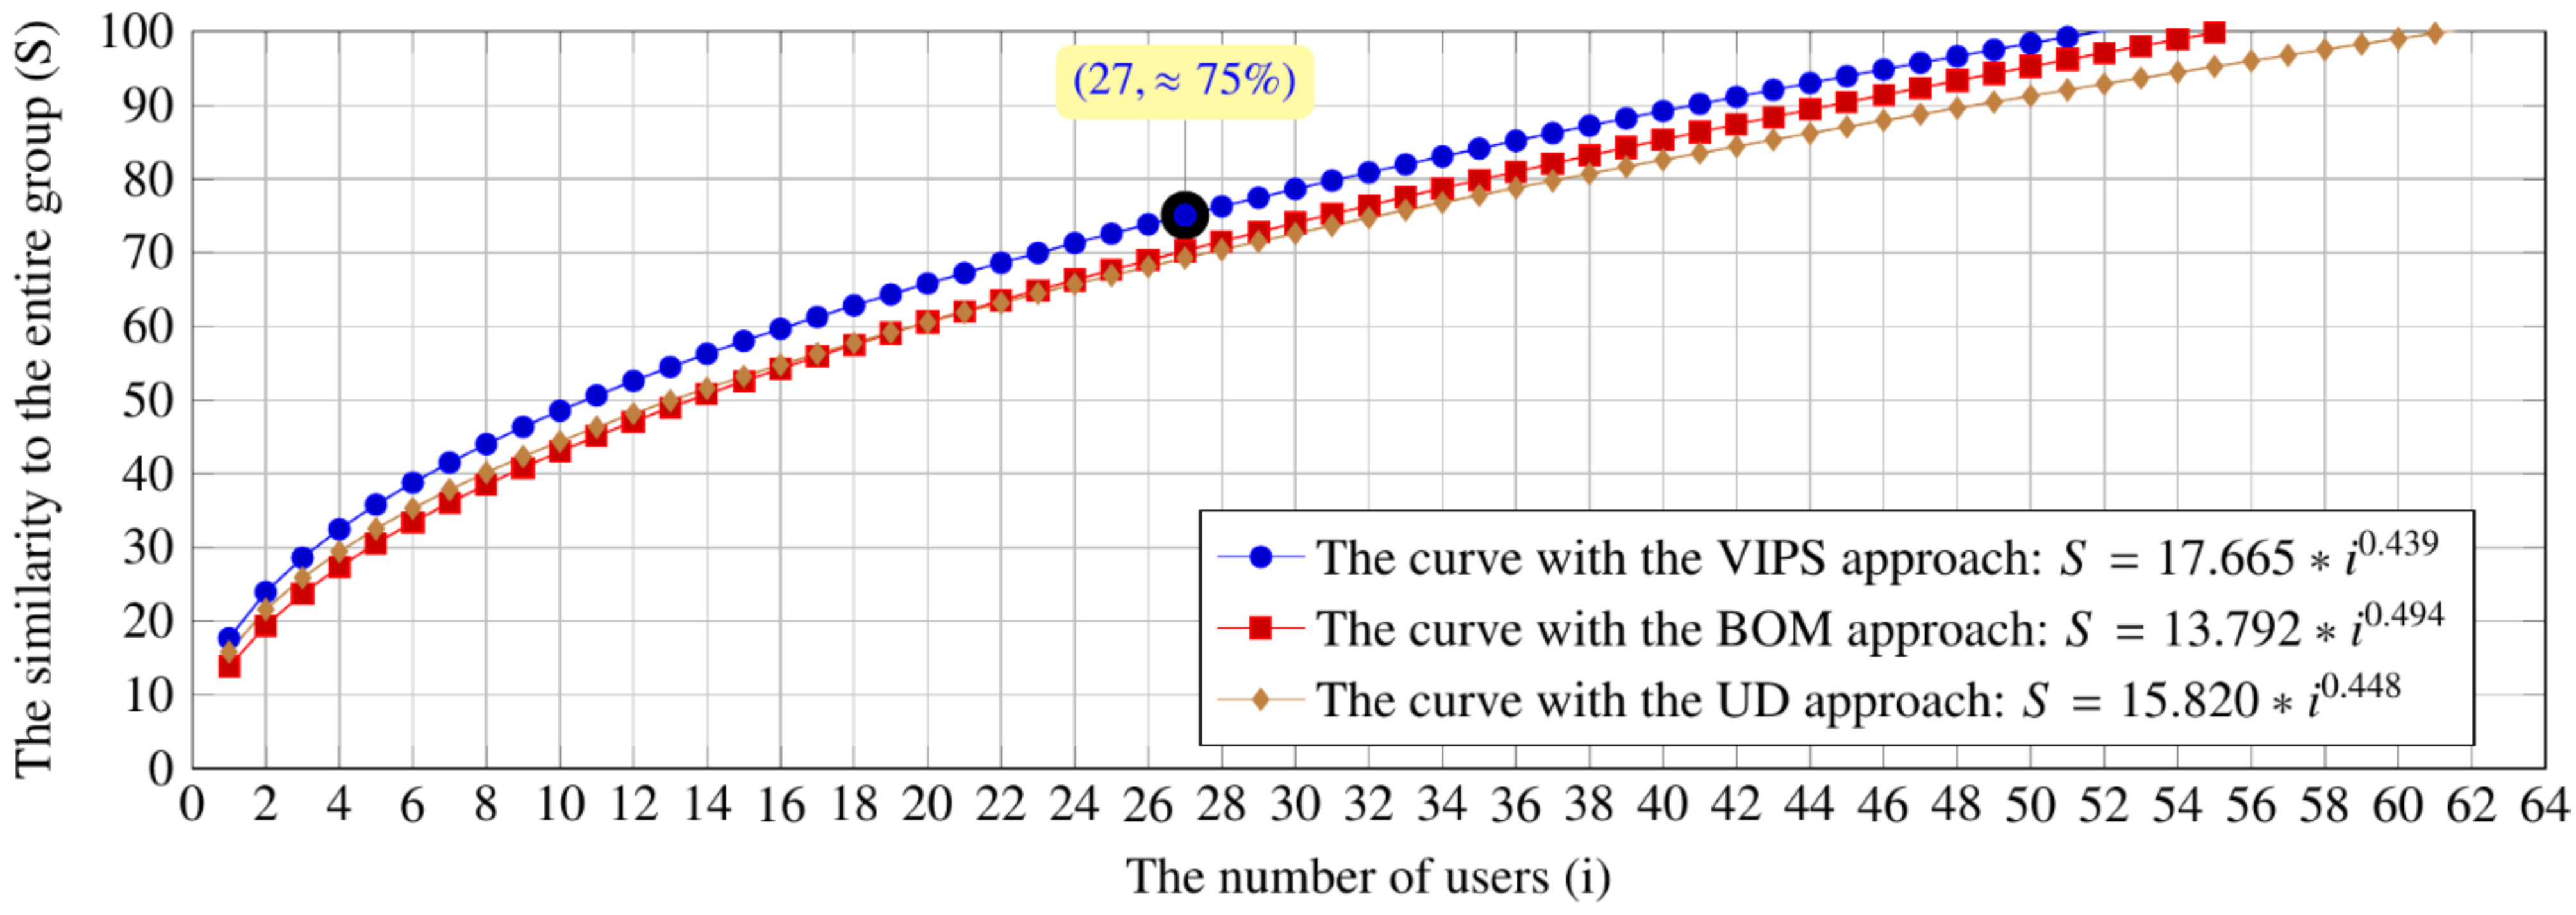
| Searching | 1 | 13.79 | 17.67 | 3.87 |
| 2 | 19.42 | 23.95 | 4.52 | |
| 3 | 23.73 | 28.61 | 4.88 | |
| 4 | 27.36 | 32.47 | 5.11 | |
| 5 | 30.54 | 35.81 | 5.26 | |
| … | … | … | … |
| Task | Approaches | M | MD | Max | Min | SD |
|---|---|---|---|---|---|---|
| Browse | VIPS-BOM | 11.90 | 12.60 | 15.27 | 4.02 | 2.76 |
| VIPS-User driven | 11.49 | 11.85 | 13.37 | 7.83 | 1.62 | |
| BOM-User driven | 3.23 | 3.39 | 6.94 | 0.00 | 1.83 | |
| Search | VIPS-BOM | 4.13 | 4.33 | 5.53 | 1.96 | 1.13 |
| VIPS-User driven | 5.88 | 6.22 | 7.75 | 1.85 | 1.47 | |
| BOM-User driven | 2.50 | 2.08 | 5.79 | 0.04 | 1.68 |
Copyright © 2017. This article is licensed under a Creative Commons Attribution 4.0 International License.
Share and Cite
Eraslan, S.; Yesilada, Y.; Harper, S. Less Users More Confidence: How AOIs Don't Affect Scanpath Trend Analysis. J. Eye Mov. Res. 2017, 10, 1-18. https://doi.org/10.16910/jemr.10.4.6
Eraslan S, Yesilada Y, Harper S. Less Users More Confidence: How AOIs Don't Affect Scanpath Trend Analysis. Journal of Eye Movement Research. 2017; 10(4):1-18. https://doi.org/10.16910/jemr.10.4.6
Chicago/Turabian StyleEraslan, Sukru, Yeliz Yesilada, and Simon Harper. 2017. "Less Users More Confidence: How AOIs Don't Affect Scanpath Trend Analysis" Journal of Eye Movement Research 10, no. 4: 1-18. https://doi.org/10.16910/jemr.10.4.6
APA StyleEraslan, S., Yesilada, Y., & Harper, S. (2017). Less Users More Confidence: How AOIs Don't Affect Scanpath Trend Analysis. Journal of Eye Movement Research, 10(4), 1-18. https://doi.org/10.16910/jemr.10.4.6