Abstract
The selection of fixation targets involves a combination of top-down and bottom-up processing. The role of bottom-up processing can be enhanced by using multistable stimuli because their constantly changing appearance seems to depend predominantly on stimulus-driven factors. We used this approach to investigate whether visual processing models based on V1 need to be extended to incorporate specific computations attributed to V4. Eye movements of 8 subjects were recorded during free viewing of the Marroquin pattern in which illusory circles appear and disappear. Fixations were concentrated on features arranged in concentric rings within the pattern. Comparison with simulated fixation data demonstrated that the saliency of these features can be predicted with appropriate weighting of lateral connections in existing V1 models.
Introduction
The human eye has a fovea where visual resolution is greatest. As the fovea subtends a visual angle of around 5 degrees, only a small portion of the scene can be seen in detail at any one time. Eye movements are made to centre the informative features of the scene on the fovea (Buswell, 1935; Mackworth & Morandi, 1967; Yarbus, 1967) and they can be used as an indicator of where attention is being directed. The selection of features for fixation involves a combination of bottom-up processing, which depends on the configuration of the stimulus, and top-down processing, which depends on the memory and goals of the observer.
Bottom-up processing has been given a biologically plausible implementation by using the known properties of the early visual system to generate a unique “saliency map” which identifies the informative features in a scene (Koch & Ullman, 1985), and such maps have been used to predict patterns of experimentally recorded fixations (Parkhurst, Law & Niebur, 2002). The success of this approach has been enhanced by the inclusion of additional biological features such as local lateral inhibition, long range facilitation and eccentricity-dependent scaling of visual resolution (Peters et al., 2005). Furthermore, a robust Matlab® version of the saliency map model has been made freely available (Walther & Koch, 2006; http://www.saliencytoolbox.net) which has led to it becoming the first choice for predicting expected patterns of fixation.
The saliency map model is based on the assumption that the cortex produces local estimates of image properties such as colour, contrast, orientation and movement (Marr, 1982). These properties may be extracted as early as V1 (Li, 2002) and it is possible that other cortical areas extract salient features which are not yet included in the saliency model (Henderson, 2003). For example, both neurophysiological and psychophysical evidence support the hypothesis that V4 is responsible for extracting oval features, which is an important task for the pre-processing of faces (Wilson, Krupa & Wilkinson, 2000). The question of whether or not this feature should be included in the saliency map model can only be settled by experimental testing of predicted fixation patterns.
A difficulty in testing the predictions of saliency models is that failure to predict particular patterns of fixation can be attributed either to a defect in the model of bottom-up processing or to the intervention of top-down processing. One possible method of reducing top-down involvement is to use stimuli that minimise factors based on memory or emotional reaction (Peters et al., 2005). Multistable images are a useful experimental tool in this regard. Their constantly changing appearance seems to capture and hold the attention of subjects without requiring such high-level processing, as implied by the ability of computational models without any top-down elements to accurately predict the percepts generated by these patterns (Wilson, Krupa & Wilkinson, 2000). This apparent reduced cognitive involvement means that the saliency model should be able to generate fixation patterns close to those found experimentally
In the case of the possible feature extraction in V4, a suitable multistable stimulus is provided by the Marroquin pattern. This is generated by overlaying 3 square arrays of dots which are rotated at –60/0/+60 degrees away from the vertical and is shown in Figure 2A. With free viewing of the pattern, subjects report seeing illusory circles that appear and disappear over time. The positions of the circles are predicted by a model of the early stages of cortical vision which includes a filter specifically designed to extract concentric features (Wilson, Wilkinson & Assad 1997; Wilson & Wilkinson, 1998; Wilson, Krupa & Wilkinson, 2000).
We began by using the previously verified V4 model of the human perception of the stimulus to predict the locations of the salient features of the pattern, and then confirmed experimentally that the subjects’ fixations were concentrated on these regions. Next, we compared the predictions of the saliency toolbox model with the experimentally recorded fixations and found that appropriate tuning of the lateral interactions in the model leads to predicted patterns of fixation comparable to those of the human visual system.
Methods
Modelling
The locations of the salient circular features in the Marroquin pattern were predicted by a model based on the known properties of the initial visual cortical areas (Wilson, Wilkinson & Assad, 1997). Psychophysical studies have shown that circles are perceived in the pattern around specific points at which the model generates peak responses (Wilson, Krupa & Wilkinson, 2000). The neuronal operations in cortical area V1 were modelled by applying oriented filters to the image at 8 different orientations, separated by 22.5 degrees. The characteristics of the filters were derived from masking studies (Wilson, 1991), and are specified by equation (1) below:
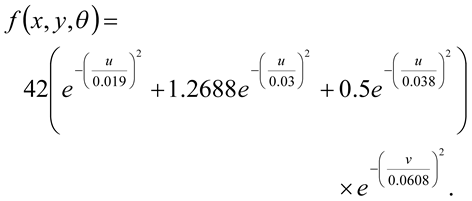
Here, (u,v) are coordinates in degrees obtained from the (x,y) coordinates, also in degrees, by a clockwise rotation through an angle θ.
The neuronal operations in V2 were modelled by fullwave rectifying the outputs of the filters in V1 and then applying pairs of offset filters which have orthogonal orientations to the V1 filters. The V2 filters’ characteristics were derived from psychophysical studies of the perception of concentric features in random dot stimuli (Wilson, Wilkinson & Assad, 1997). The filters are specified by equation (2):
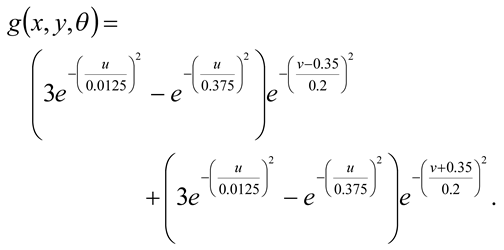
In this case the (u,v) coordinates were obtained from the (x,y) coordinates by a clockwise rotation through an angle (θ + 90) degrees. The final operation is assumed to occur in V4 and consists of a summation of the outputs of all 8 filters in V2, followed by half-wave rectification. The model is shown schematically in Figure 1.
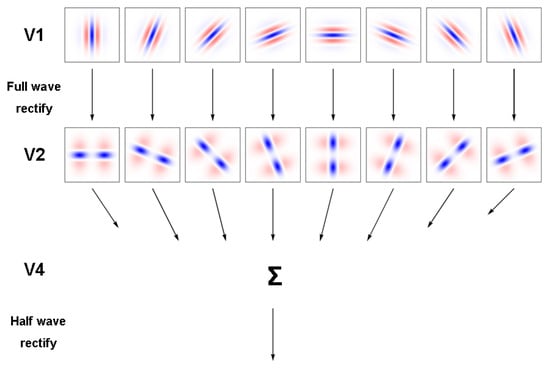
Figure 1.
Processing stages in the model for identification of circular features in a retinal image. Each of the receptive fields shown for areas V1 and V2 are represented by 0.25 x 0.25 and 1.5 x 1.5 degree patches of retina respectively.
Fixation patterns predicted by the saliency map model were generated using version 2.2 of the saliency toolbox. The model comprises 4 stages: 1) separation of the image into colour, intensity and orientation feature channels and linear filtering over several spatial scales; 2) application of centre-surround difference operators and normalisation of activity within each feature channel; 3) linear summation of the second stage maps to form a single topographic saliency map; 4) dynamic allocation of the focus of attention (FOA) through a winner-takes-all process in the saliency map. As we were aiming to minimise top-down attentional components, the FOA was taken to be a simple disk (Itti, Koch & Niebur, 1998; Itti & Koch, 2000). The size of the disk was decreased until consistent fixation patterns were obtained. Final simulations were carried out with the FOA size fixed at 1/10th of the image width. All other parameters were set to their default values, previously obtained through extensive testing of the model over a broad range of artificial images (Itti, Koch & Niebur, 1998).
Eye movement recording and analysis
Eye movements were recorded from eight volunteers (ages 23-49, 1 female). The experimental protocol was approved by the Riverside Research Ethics Committee and written, informed consent was obtained prior to the study. The instructions to the subjects explained that patterns (usually circles) would be visible in the images displayed and that the subjects were free to look at any pattern that captured their attention. Subjects viewed the Marroquin image with their head supported by a chin rest. A fixation cross was presented for 1 second followed by the image, which was displayed for 150s. The displayed image had a resolution of 1200 x 1200 pixels and subtended an angle of 28.5 x 28.5 degrees.
The eye movements were recorded by infrared oculography (250Hz Eyelink, SMI, Germany) and analysed offline. Eye velocities were estimated by convolution of the position signals with a digital filter. Saccades were identified by having a velocity greater than 30 degrees/second. Any portion of the recording which was longer than 60 ms and did not contain a saccade was marked as a fixation. If the eye position changed by more than 0.5 degrees from the position at the start of the fixation, then a refixation was considered to have occurred.
Results
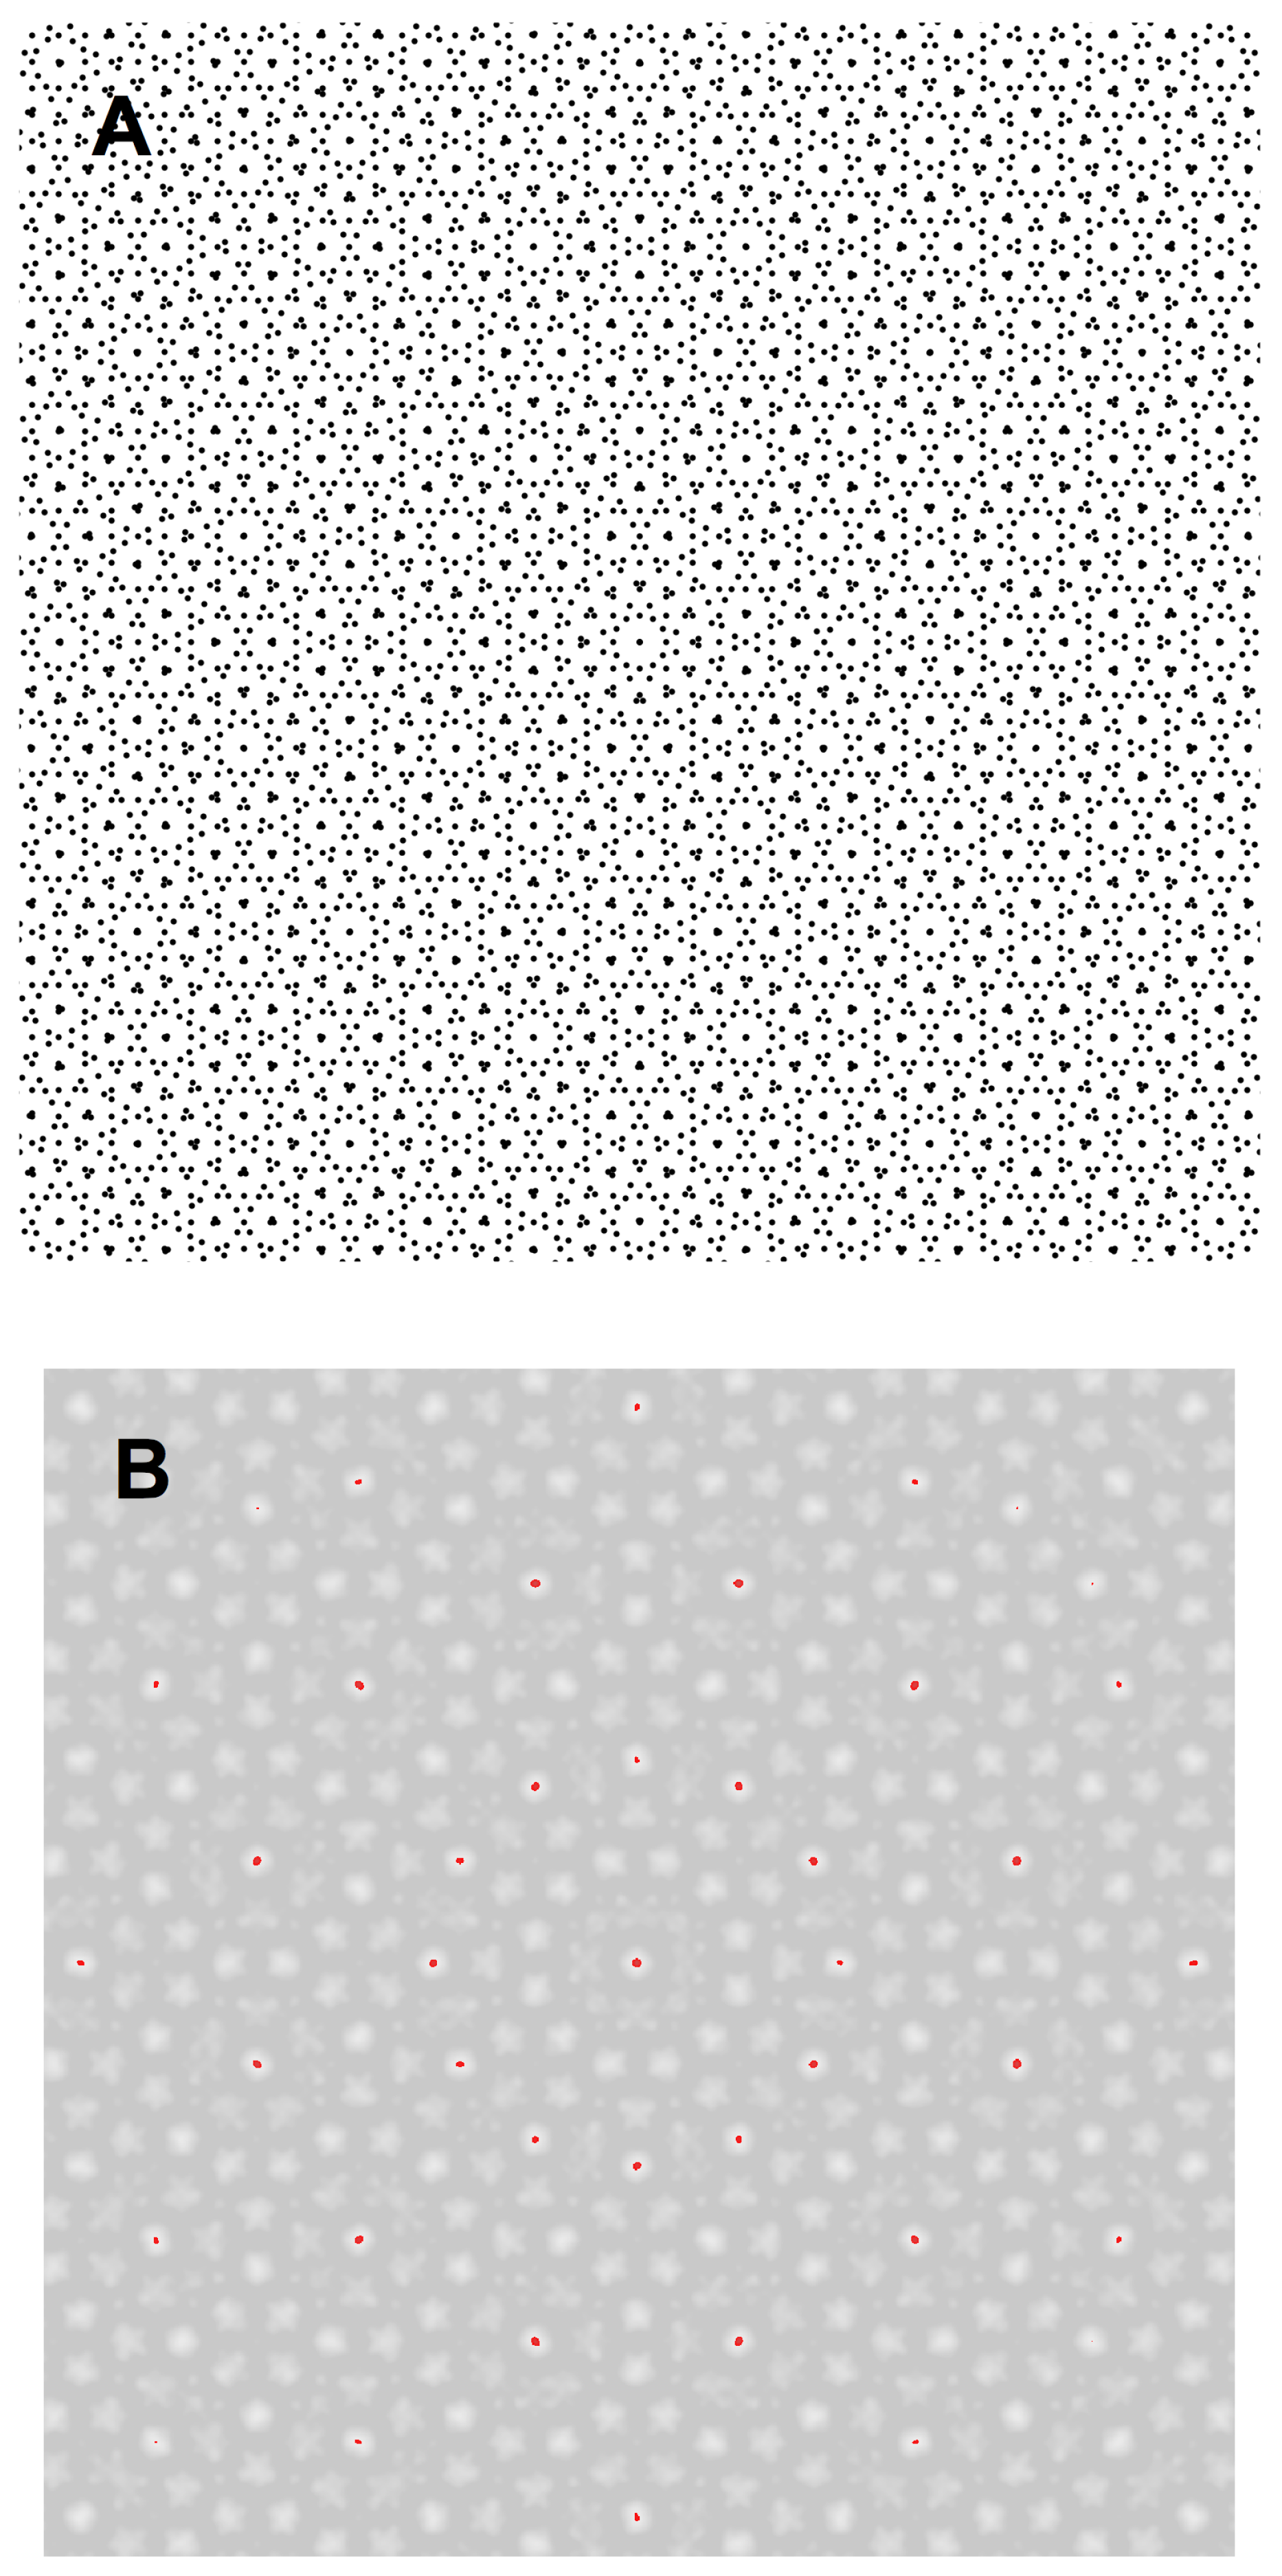
The pattern we used is shown in Figure 2A and the thresholded output of the V4 model is shown in Figure 2B. The red points in Figure 2B correspond to positions in the pattern where the response of the model was greater than 90% of its maximum. These points of high saliency are predicted at the centre of the pattern and in three concentric rings spaced 4.44 degrees apart.
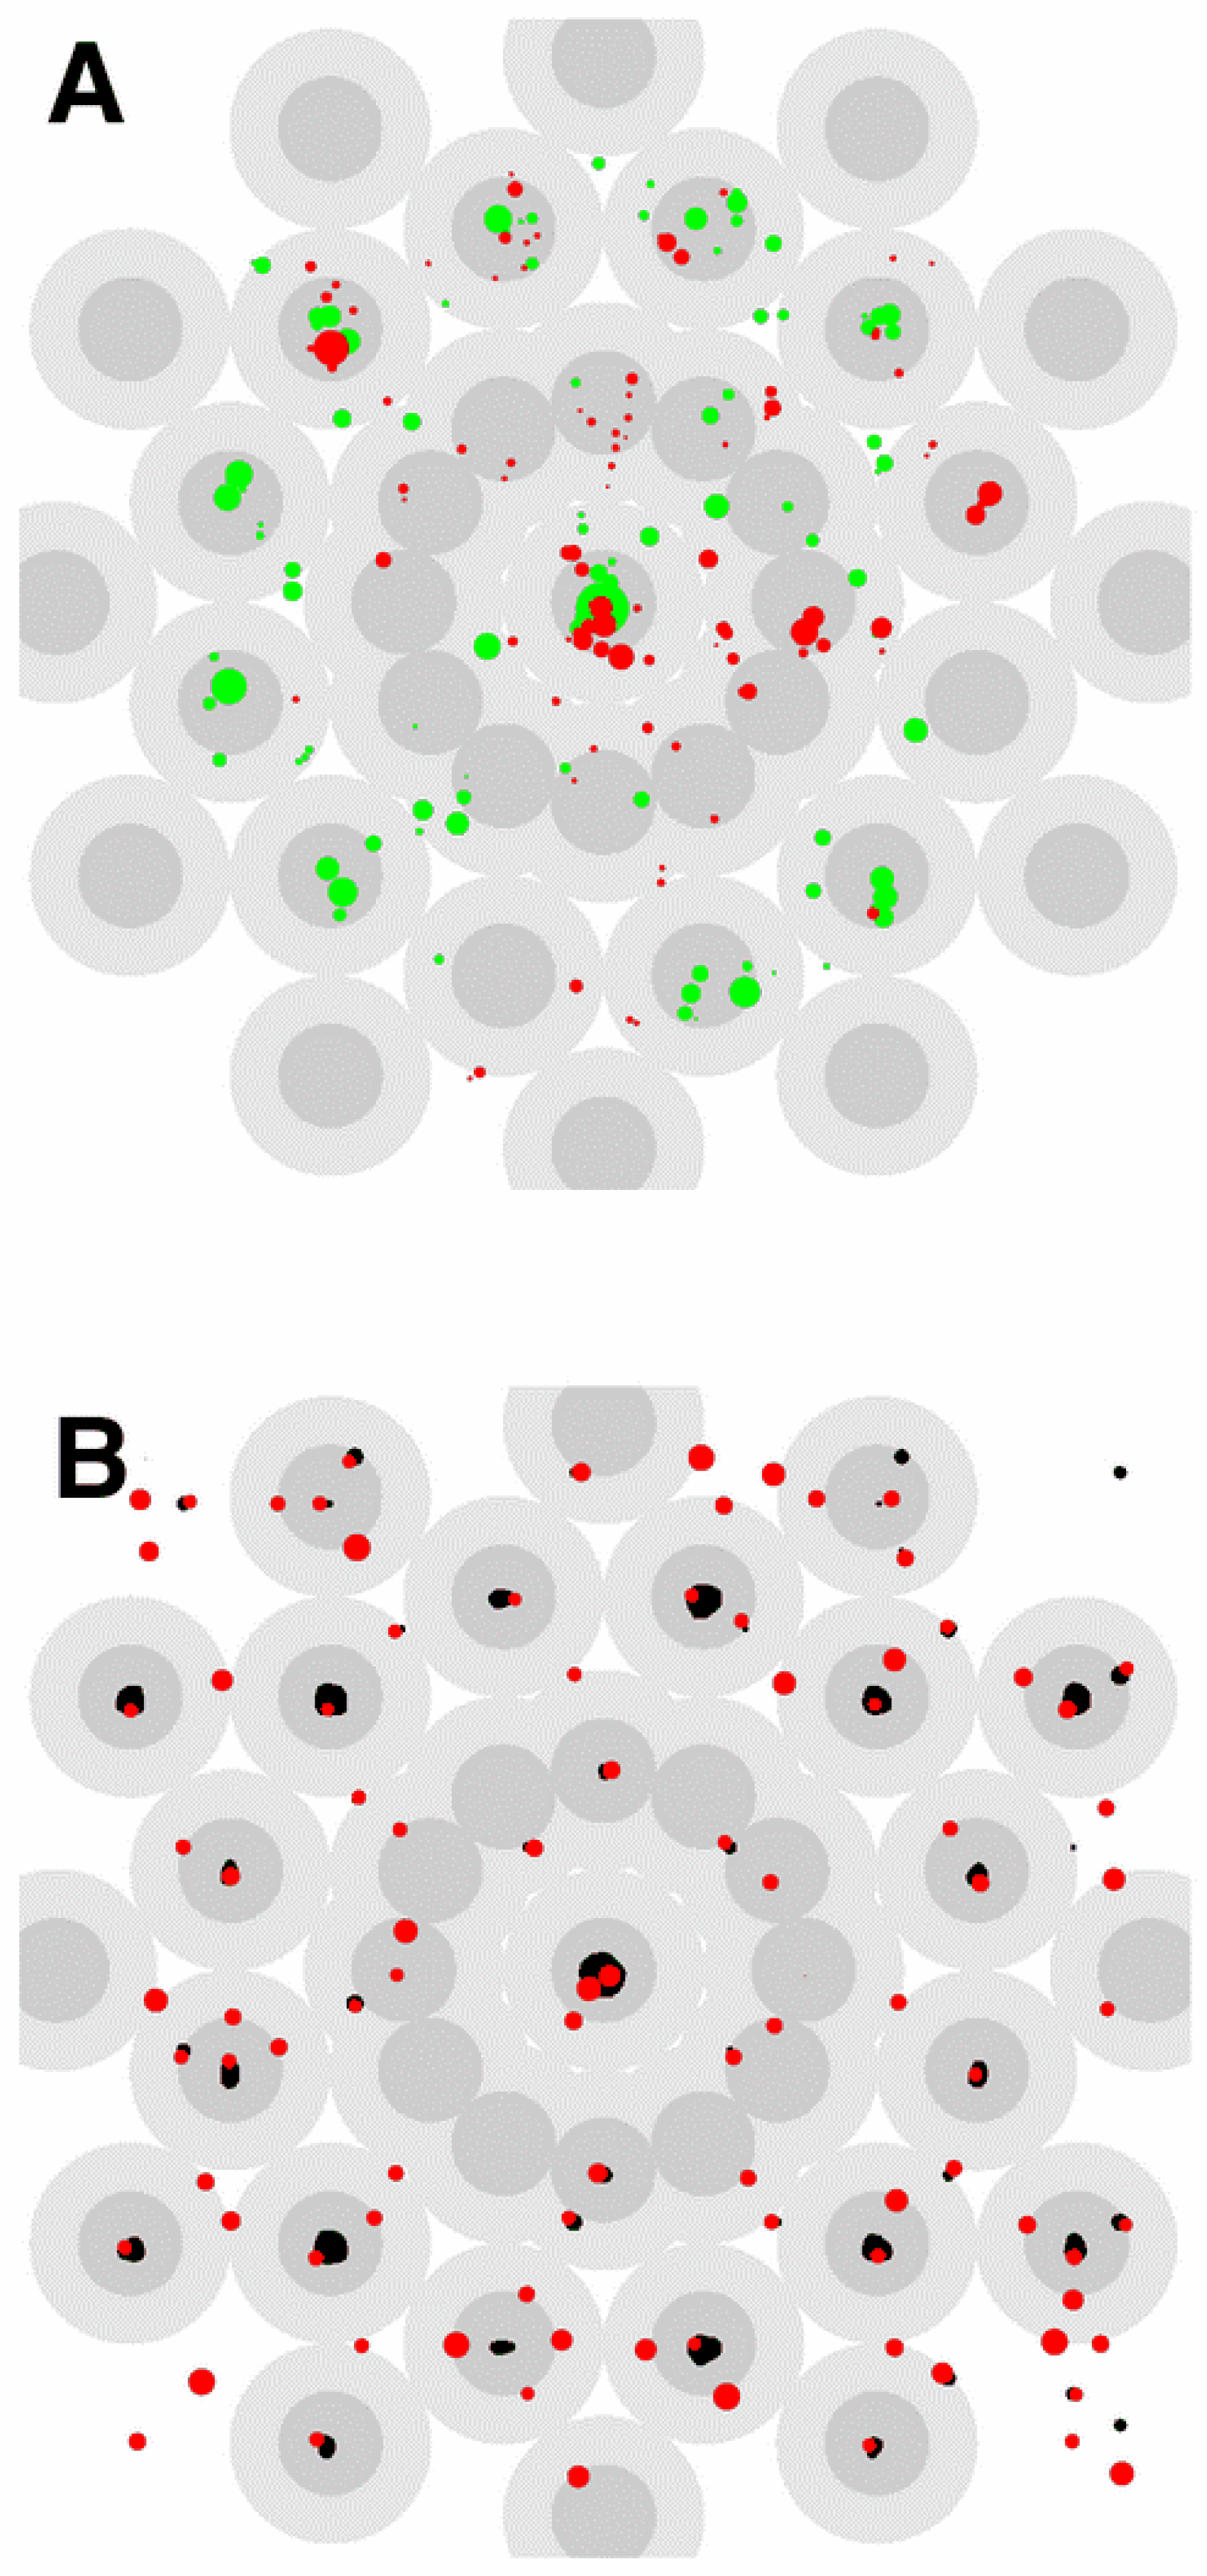
To test if the locations of the salient features estimated from eye movements matched the predicted locations the stimulus was divided into non-overlapping circular neighbourhoods, each of which was centred on a calculated salient feature. The fixations within the neighbourhoods were then analysed to assess whether they were concentrated around these features. A relative saliency measure was used for this purpose, to reduce the effects of central fixation bias. The maximum radius of each neighbourhood was set equal to half the distance to the next nearest salient feature, ensuring that adjoining neighbourhoods did not overlap. For the innermost ring of salient points this yielded a radius of 1.25° and for all other points the radius was 2.5°. Examples of where recorded fixations lie with respect to these neighbourhoods are shown in Figure 3A.
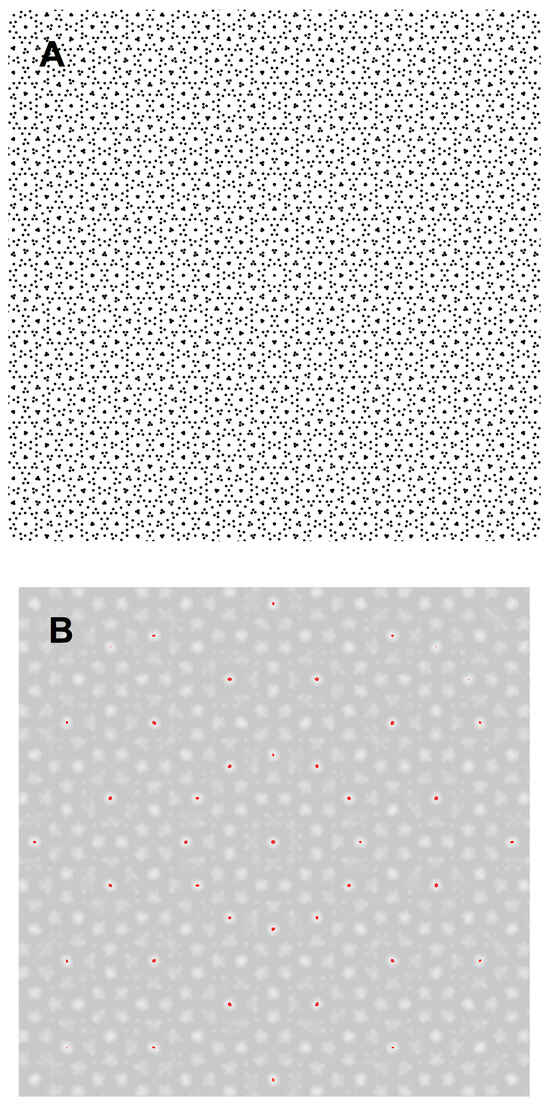
Figure 2.
Predicted locations of the salient features of the Marroquin pattern. A. The Marroquin pattern. B. Output of the V4 model. Above threshold peaks in the output have been over-plotted in red.
Figure 2.
Predicted locations of the salient features of the Marroquin pattern. A. The Marroquin pattern. B. Output of the V4 model. Above threshold peaks in the output have been over-plotted in red.
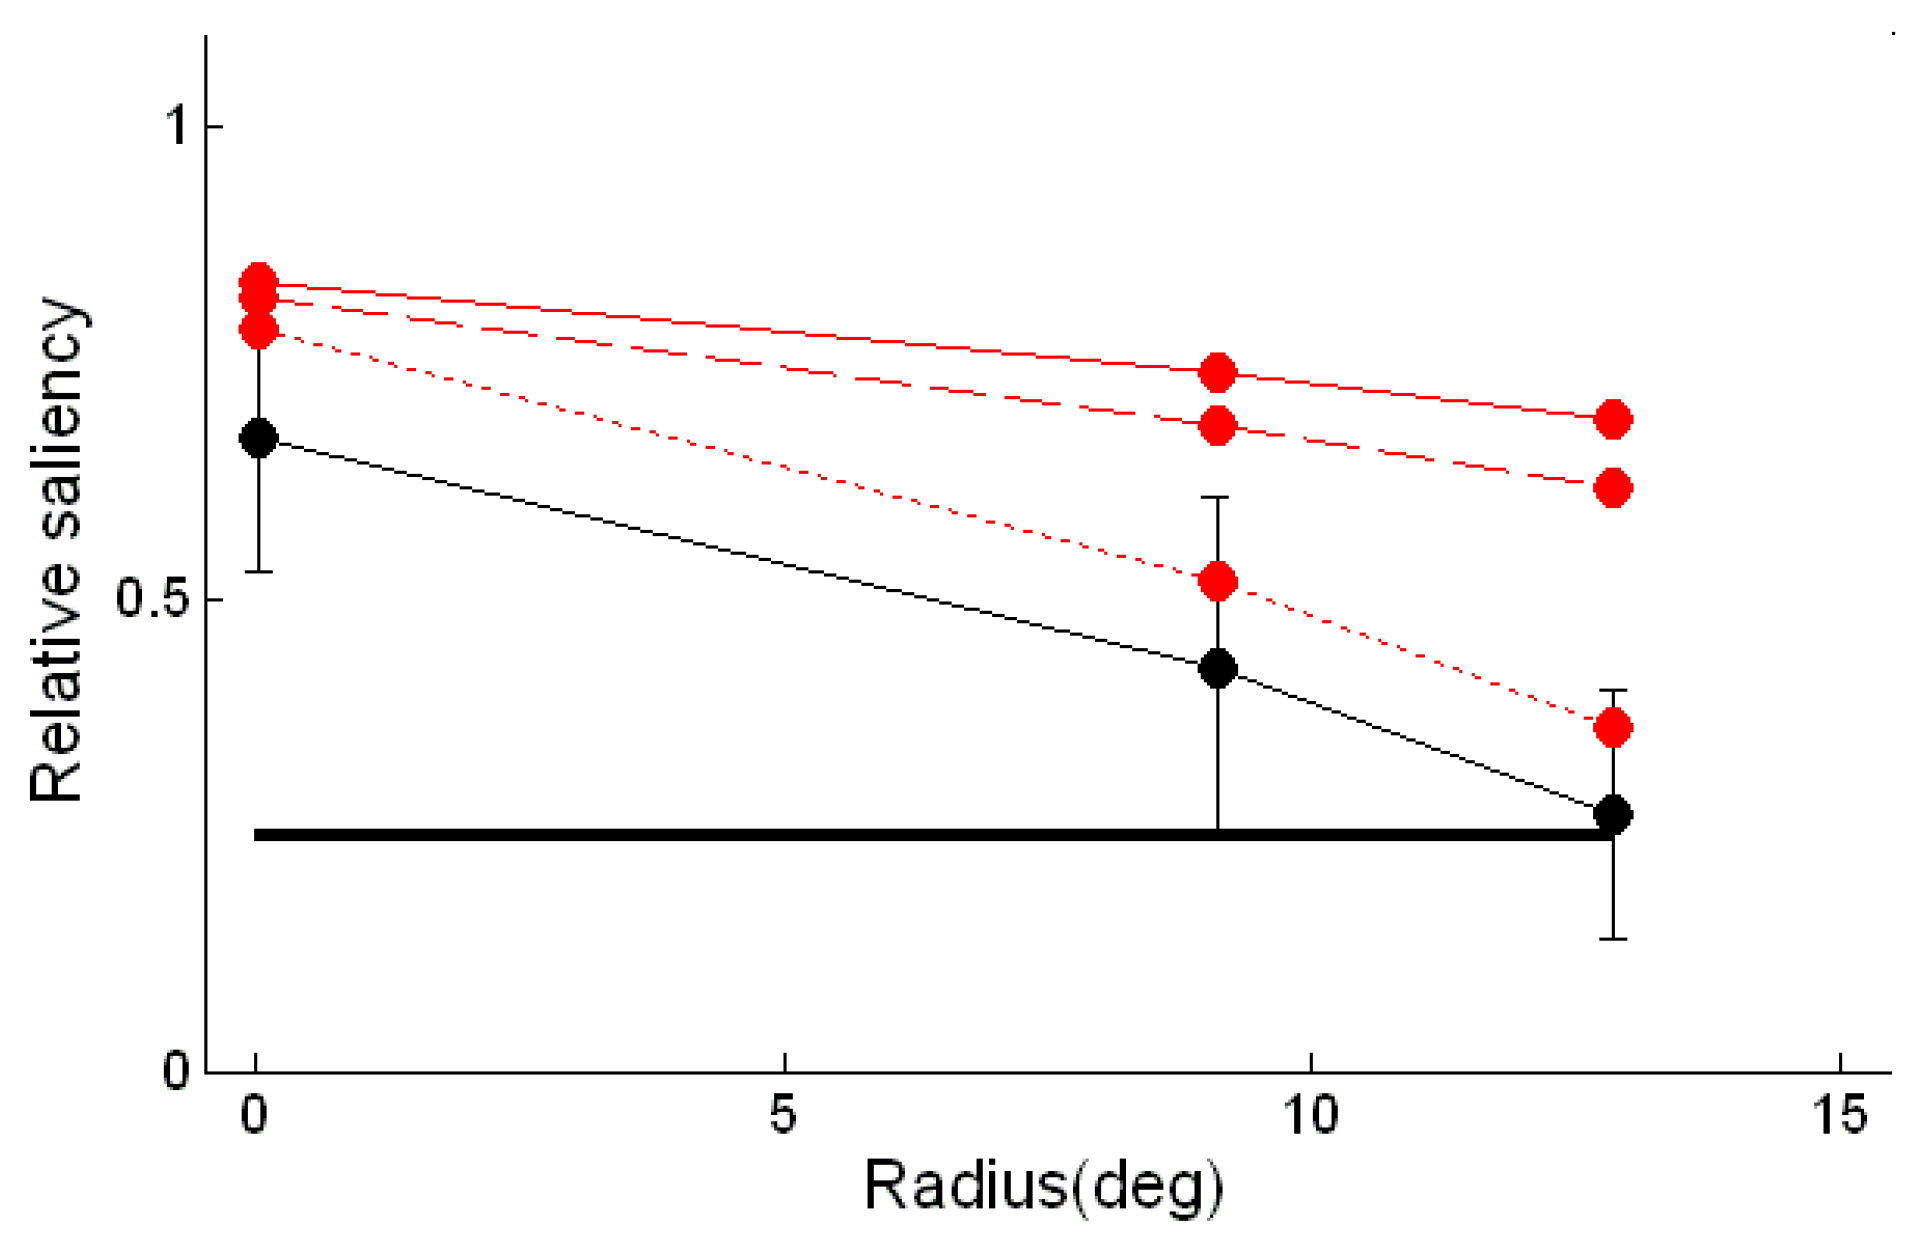
The saliency of a fixated position was assumed to be proportional to the duration of the fixation, and the saliency of a region was assumed to be proportional to the sum of the durations of the fixations within it. If the positions and durations of fixations were selected at random from uniform distributions, then the estimated saliency of the 1.25° radius neighbourhoods would be a quarter of that of the 2.5° radius neighbourhoods. So if the relative saliency of the neighbourhoods is different from a quarter, the distribution of fixations is not uniform within the larger neighbourhood. Figure 4 shows how the relative saliency varies across the concentric rings of predicted salient points. The relative saliency estimated from the fixations was significantly greater than a quarter at the centre of the pattern and for the second ring of predicted salient features, showing that the fixations are clustered around the predicted locations in these regions (one-tailed t-tests, p<0.025). The trend of decreasing relative salience with radial position in the pattern was tested with analysis of variance and was found to be highly significant (F(2,21) = 14.98, p < 0.001).
The relative saliency measure used in the above analysis provided a suitable quantitative index for comparing the fixation patterns generated by the saliency map model to those recorded experimentally. An identical analysis to that carried out on the subject data was therefore performed on fixations generated by the model. 406 simulated fixations were used, equal to the average number of fixations made by the subjects. The relative saliences calculated from the saliency toolbox data are plotted in Figure 4A, while the first 100 simulated fixations can be seen in Figure 3B. Also shown in Figure 3B are the regions of the stimulus for which the corresponding saliency map has a value greater than 25% of its maximum; these are principally concentrated at the centre of the pattern and in the two outermost rings of salient points predicted by the V4 model.
It can be seen in Figure 3B that the model yields relative saliences that are significantly larger than those estimated from the experimental data for the two outermost rings of calculated salient points. This prompted us to explore factors which might be influencing the performance of the model. It was found that the model was sensitive to the absolute size of the dots in the pattern. When the dot size was halved, fewer fixations were made to the periphery of the pattern and more to the central regions. This effect was enhanced when the dot size was reduced to a quarter of its original size, yielding relative saliences consistent with those obtained from the experimental fixation patterns.
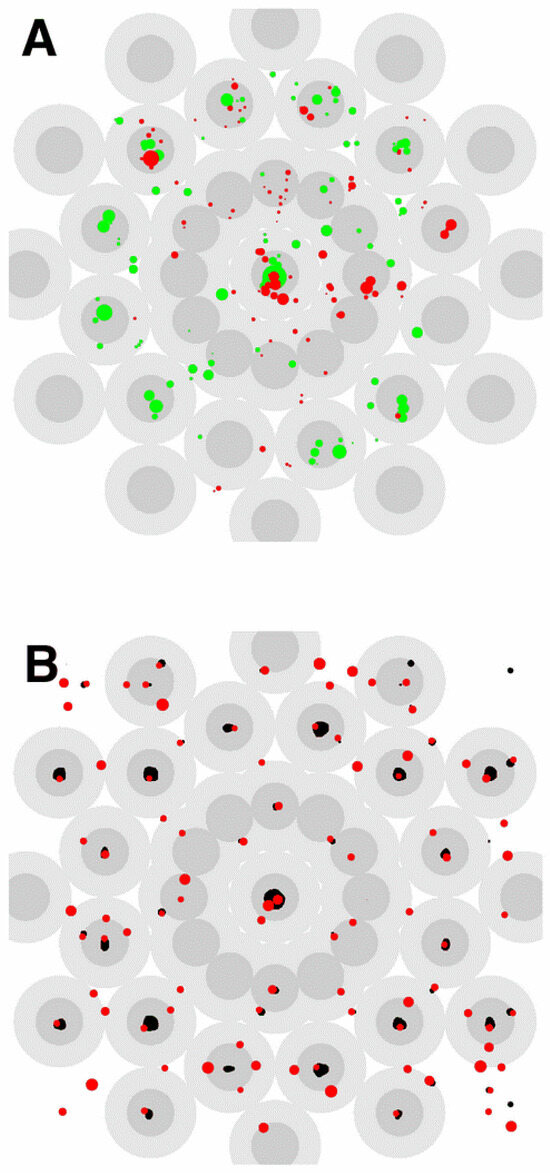
Figure 3.
Relation of fixation positions to the stimulus. The 1.25° radius neighbourhoods of the predicted salient features are shown in dark grey and the 2.5° radius neighbourhoods are shown in light grey. Fixation positions are plotted as coloured spots with the relative duration of each fixation indicated by the radius of the spot. A. Locations of the first 100 fixations recorded from 2 subjects. B. Locations of the first 100 fixations predicted by the saliency toolbox model. Above threshold peaks in the saliency map are plotted in black.
Given that the subjects’ fixations were concentrated at the predicted locations of the salient features, an additional comparison could be made between the experimentally estimated salience of the features and the saliences predicted by the model. The average saliences of the 1.25° radius neighbourhoods were computed for each of the concentric rings. These average saliences were normalised and then plotted in Figure 5. Analysis of variance of the normalised saliences of the three outer rings of features showed that the greater saliency of the 8.88° radius ring was significant (F(2,21) = 3.71, p < 0.05).
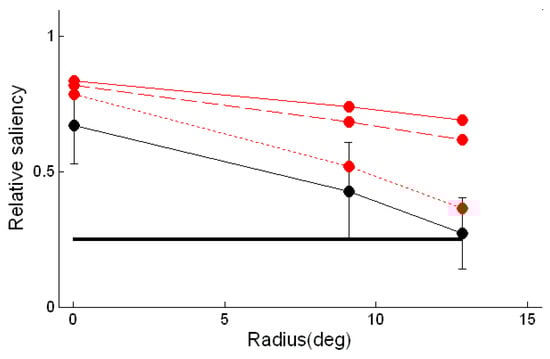
Figure 4.
Correspondence between saliency estimated from fixations and locations of predicted salient features. The relative salience is given by the ratio of the salience of the 1.25° radius neighbourhoods to that of the 2.5° radius neighbourhoods. For a uniform distribution of fixations this measure would be a quarter at all locations (thick black line). The relative saliency estimated from the subjects’ fixations is show by the thin black line. The error bars correspond to one standard deviation of the subjects’ distributions. A similar estimate based on fixations generated by the saliency toolbox model is shown by the continuous red line. The calculation was repeated with a Marroquin pattern in which the dot size was halved (dashed line) and quartered (dotted line).
In accordance with the findings on relative salience, the fixations generated by the saliency toolbox model gave an overestimate of the salience of the two outermost rings of features. However, the normalised saliences for the stimulus with quarter-sized dots had a similar distribution to that found with the experimental data.
Discussion
Our aim was to investigate whether computations which have been attributed to V4 need to be incorporated into existing models of bottom-up processing. In order to decrease the contribution of top-down processing to the selection of fixation targets we used a multistable image as a stimulus and demonstrated that the long viewing times (>1 minute) possible with this pattern facilitate the collection of extensive and reliable data on fixations.
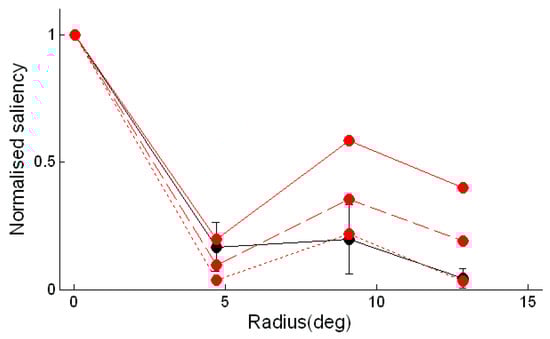
Figure 5.
Estimated dependence of the saliency of a feature on the radius from the centre of the pattern of the feature. As in Figure 4, the black line is a plot of the estimate obtained from the subjects’ fixations and the red lines are estimates obtained from fixations generated by the saliency toolbox for Marroquin patterns with different dot sizes.
A further advantage of the Marroquin pattern is that a quantitative model of where the circular features of the pattern will be seen has previously been developed and validated (Wilson, Wilkinson & Assad 1997; Wilson and Wilkinson, 1998; Wilson, Krupa & Wilkinson, 2000). Our findings provide additional support for this model because fixations were clustered around the locations where the response of the model was greatest.
With the raw Marroquin pattern as input, the saliency map model did not generate fixations in exact accordance with the saliency of the pattern determined from experimental measurements of fixations. This implies that in its default configuration, the model does not identify oval features as well as the human visual system. If, as has been argued (Wilson, Krupa & Wilkinson, 2000), the detection of oval features forms part of the pre-processing for face recognition then a reduced capability for this preprocessing will result in a reduced performance in face recognition. The fixations could, however, be made to match the experimental data by reducing the dot size in the pattern. The main effect of such a reduction is to reduce the level of feedforward input to the model, so that the lateral connections become more important. Thus, by effectively altering the relative weights of the feedforward and lateral connections of a model based on V1, it is possible to obtain performance comparable to that of the V4 model without introducing specific circular feature detectors.
In conclusion, the work presented here provides further evidence that multistable images tailored to activate particular cortical areas can be useful tools for investigating early visual processing. Recently, a quantitative model of V4 (Cadieu et al., 2007) has been proposed that is based directly on the responses of single V4 neurons (Pasupathy & Connor, 2001). Many of the units were found experimentally to be tuned to the curvature and angular position of boundary segments. These responses were reproduced by the model, which is based on feedforward connections from oriented units in V1. Since neural activity in V4 is implicated in the calculation of saliency (Mazer & Gallant, 2003), it would be interesting to extend this model to calculate a saliency map, and test the predicted fixations against those found with the Marroquin pattern.
Acknowledgments
John Findlay made a number of helpful suggestions after reading an early draft of this paper. Ansgar Koene and Zhaoping Li made useful comments on a more recent version. This work was supported by the Leverhulme Trust Grant F/07 427/A.
References
- Buswell, G. T. 1935. How people look at pictures. Chicago: University of Chicago Press. [Google Scholar]
- Cadieu, C., M. Kouk, A. Pasupathy, C. E. Connor, M. Riesenhuber, and T. Poggio. 2007. A model of V4 shape selectivity and invariance. J. Neurophysiol. 98: 1733–1750. [Google Scholar] [CrossRef] [PubMed]
- Henderson, J. M. 2003. Human gaze control in real world scene perception. Trends Cogn. Sci. 7: 498–504. [Google Scholar] [CrossRef] [PubMed]
- Itti, L., and C. Koch. 2000. A saliency-based mechanism for overt and covert shifts of visual attention. Vis. Res. 40: 1489–1506. [Google Scholar] [CrossRef] [PubMed]
- Itti, L., C. Koch, and E. Niebur. 1998. A model of saliency-based visual attention for rapid scene analysis. IEEE T. Pattern Anal. 20, 11: 1254–1259. [Google Scholar]
- Koch, C., and S. Ullman. 1985. Shifts in selective visual-attention-towards the underlying neural circuitry. Hum. Neurobiol. 4: 219–227. [Google Scholar]
- Mackworth, N. H., and A. J. Morandi. 1967. The gaze selects informative details within pictures. Percept. Psychophys. 2: 547–552. [Google Scholar] [CrossRef]
- Marr, D. 1982. Vision. New York: W.H. Freeman & Company. [Google Scholar]
- Mazer, J. A., and J. L. Gallant. 2003. Goal-related activity in V4 during free viewing visual search. Evidence for a ventral stream visual salience map. Neuron 40, 6: 1241–1250. [Google Scholar] [CrossRef] [PubMed]
- Parkhurst, D., K. Law, and E. Niebur. 2002. Modelling the role of salience in the allocation of overt visual attention. Vis. Res. 42: 107–123. [Google Scholar] [CrossRef]
- Pasupathy, A., and C. E. Connor. 2001. Shape representation in area V4: position-specific tuning for boundary conformation. J. Neurophysiol. 86: 2505–2519. [Google Scholar] [PubMed]
- Peters, P. J., A. Iyer, L. Itti, and C. Koch. 2005. Components of bottom-up gaze allocation in natural images. Vis. Res. 45: 2397–2416. [Google Scholar] [CrossRef] [PubMed]
- Walther, D., and C. Koch. 2006. Modelling attention to proto-objects. Neural Networks 19: 1395–1407. [Google Scholar] [CrossRef] [PubMed]
- Wilson, H. R., B. Krupa, and F. Wilkinson. 2000. Dynamics of perceptual oscillations in form vision. Nat. Neurosci. 3: 170–176. [Google Scholar] [PubMed]
- Wilson, H. R., and F. Wilkinson. 1998. Detection of global structure in Glass patterns: implications for form vision. Vis. Res. 38: 2933–2947. [Google Scholar] [CrossRef] [PubMed]
- Wilson, H. R., F. Wilkinson, and W. Asaad. 1997. Concentric orientation summation in human form vision. Vis. Res. 37: 2325–2330. [Google Scholar] [CrossRef] [PubMed]
- Wilson, H. R. 1991. Psychophysical models of spatial vision and hyperacuity. In Spatial Vision. Edited by D. Regan. London: Macmillan, pp. 64–86. [Google Scholar]
- Yarbus, A. L. 1967. Eye movements and vision. Translated by L. A. Riggs. New York: Plenum Press. [Google Scholar]
- Li, Z. 2002. A saliency map in primary visual cortex. Trends Cogn. Sci. 6: 9–16. [Google Scholar] [CrossRef] [PubMed]

© 2009 by the author. 2009 Ozgur E. Akman, Richard A. Clement, David S. Broomhead, Sabira Mannan, Ian Moorhead, Hugh R. Wilson