1. Introduction
In recent decades, rapid industrial expansion, increased energy consumption, and urban growth have led to a sharp rise in global carbon emissions. This trehas exacerbated the effects of climate change and endangered the ecological stability of the planet. Technological progress has boosted productivity since the Industrial Revolution, but it has also contributed to sustained increases in carbon emissions (
Rasoulinezhad & Taghizadeh-Hesary, 2022). This situation has prompted the international community to seek innovative financial mechanisms that can actively mitigate polluting emissions and promote the transition to a low-carbon economy. Against this backdrop, green finance has emerged, and green bonds have become a key instrument of sustainable financing. Green bonds are specifically designed to channel resources toward projects that generate verifiable environmental benefits, such as renewable energy, energy efficiency, clean transportation, and sustainable infrastructure (
Zerbib, 2019).
As investors have begun to consider the long-term sustainability and ethical implications of their portfolios, interest in environmental, social, and governance (ESG) issues has grown. Agreements such as the 2015 Paris Climate Agreement have contributed to this growing awareness. According to
Sheenan et al. (
2024), financing options for sustainable initiatives have expanded, and new types of bonds have emerged under the broad umbrella of GSS (green, social, sustainable, sustainability-linked, and transition bonds). These bonds currently represent approximately 4% of global bond issuance (
Climate Bonds Initiative, 2025). In mid-2024, the total GSS market had surpassed USD 5 trillion in cumulative value. In the first half of 2024, USD 554 billion was issued, marking a 7% increase compared with the same period in 2023 (
Guesmi et al., 2025;
Mitchell et al., 2025). Green, social, and sustainability bonds are used to raise funds for public spending programs that contribute to various objectives, such as climate and environmental projects, energy efficiency, pollution prevention, and sustainable agriculture, fishing, and forestry (
AlAhbabi & Nobanee, 2020;
Baker et al., 2022;
Bernabé Argandoña et al., 2022;
Guesmi et al., 2025;
Mocanu et al., 2021). These studies also show that economic growth in Latin American and Caribbean (LAC) countries that issue GSS bonds is significantly related to green sovereign issuance.
Social bonds are a new and emerging form of impact investing in which proceeds are used to finance projects with defined social impacts. These impacts may be achieved by mitigating negative social outcomes or promoting positive social outcomes, such as housing, job creation, food security, health, and education (
Park, 2018). However, the theory of sovereign sustainable bonds emphasizes that financing is a tool for national sustainability reforms that depends on the incentives of both contracting parties: institutional investors and sovereign borrowers. This suggests that neither party may have sufficient incentive to use debt instruments to effect change in national policies and sustainability practices (
Lupo-Pasini, 2022). The issuance of green bonds, which are used to finance environmentally friendly projects, has increased significantly in recent years. Sustainability bonds and sustainability-linked bonds, which are subject to less stringent restrictions on the use of proceeds than green bonds, may also support environmentally friendly initiatives (
Capelle-Blancard & Monjon, 2014).
Since the European Investment Bank’s first symbolic issuance in 2007, the green bond market has experienced exponential growth. According to
Climate Bonds Initiative (
2026), global issuances reached record figures in 2019, exceeding EUR 230 billion—a dramatic increase from the EUR 28 billion recorded in 2014. Green bonds have become an essential tool for aligning the financial objectives of the private sector with global climate commitments, such as the Paris Agreement (2015) and the Sustainable Development Goals (SDGs) of the 2030 Agenda. However, despite the rapid expansion and growing prominence of green bonds within capital markets, a fundamental issue remains unresolved regarding the extent to which this form of financing has effectively contributed to reducing global carbon emissions. Some studies argue that green bond issuance promotes energy efficiency and the decarbonization of economies (
Chang et al., 2023;
Fatica & Panzica, 2021;
Flammer, 2021;
Prodanov et al., 2025), whereas others caution that its direct and tangible environmental impact depends critically on governance, transparency, external certification, and the actual use of proceeds (
S. S. Alharbi et al., 2022;
Zerbib, 2019).
Studies have shown that green bond issuance is a reliable indicator of a company’s environmental commitment, resulting in better environmental performance and attracting long-term investors (
Flammer, 2021). Similarly, issuers tend to reduce the carbon intensity of their assets following bond issuance, especially when the proceeds are allocated to new investments (capital expenditures) rather than debt refinancing (
Fatica & Panzica, 2021). Consistent with these findings, green bonds are associated with tangible environmental benefits and measurable improvements in corporate environmental performance (
Chang et al., 2022).
From a macroeconomic perspective, the authors of
Kim et al. (
2024) provide evidence that green financing, including green bonds, negatively impacts carbon emissions in emerging economies. This finding aligns with broader studies, such as
Su and Lee (
2023), which identify a positive correlation between green finance and environmental quality on a global scale. Regarding mechanisms,
Rasoulinezhad and Taghizadeh-Hesary (
2022) highlight the role of green finance in improving energy efficiency. Meanwhile,
A. Alharbi et al. (
2023) provide global evidence that the expansion of green bonds measurably promotes the development of renewable energy.
However, these potential benefits are accompanied by financial risks and complexities. The main identified risk is greenwashing, which occurs when weak public governance and reliance on self-regulation dilute the actual environmental impact of green financial instruments (
Fatica & Panzica, 2021;
Flammer, 2021). From a financial perspective, the debate on the greenium, or the green bond price premium, remains ongoing.
Zerbib (
2019) found evidence of a green premium, suggesting that investors are willing to pay more for these assets. In contrast,
Bachelet et al. (
2019);
Pietsch and Salakhova (
2025) report more ambiguous results depending on the market and bond structure. This complexity is reinforced by the high volatility of the sector, as analyzed by
Yang et al. (
2021) in green finance; the high-risk dependence between green bonds and energy markets, as analyzed by (
Zheng et al., 2025); and the impact of external shocks, such as the COVID-19 pandemic, which reconfigured market volatility, as analyzed by (
Liu et al., 2024;
Wang et al., 2024).
Financial inclusion and financial technology (FinTech) can increase the effectiveness of green finance in improving energy efficiency, especially in emerging economies (
Ghouse et al., 2025). In particular, green finance plays mediates the relationship between financial inclusion and energy efficiency outcomes (
Yu & Tang, 2023). These results indicate that the effectiveness of green bonds hinges on the development level of the financial and technological ecosystem in which they operate.
The green bond market has established itself as a key tool for sustainable investment. However, there is no academic consensus on the scale of its direct environmental impact. Although some studies point to a negative relationship between green finance and carbon emissions, others emphasize that these effects may depend on measurement methods, time frames, and economic conditions (
Flammer, 2021;
Zerbib, 2019). Crucially, much of the existing macroeconomic literature relies on static models that fail to address endogeneity and reverse causality. Countries with structural conditions favoring a low-carbon transition are intrinsically more likely to issue sustainable financial instruments.
Countries that are already on more advanced decarbonization trajectories are also those that are most likely to develop green bond markets. Thus, observed associations between green financing and carbon intensity may reflect preexisting structural differences rather than the effect of financial instruments. The present study addresses this methodological gap by using dynamic panel models to account for endogeneity concerns.
The issuance of green bonds can influence carbon intensity through several channels. First, green bonds can facilitate investments in renewable energy and low-carbon infrastructure, thereby reducing emissions associated with economic activity. Second, green bonds can improve energy efficiency by financing cleaner technologies and production processes. Third, green bonds can serve as a signaling mechanism, attracting environmentally conscious investors and reinforcing corporate and government commitments to sustainability. Although these mechanisms have been identified in the literature, their aggregate macroeconomic impact remains uncertain, especially when potential endogeneity and reverse causality are considered.
The research hypothesis is as follows:
H1: Higher green bond issuance is associated with lower carbon intensity.
It is important to acknowledge that this study employs an aggregate country-level design. Consequently, we cannot observe the environmental performance of individual green bond projects, nor can we distinguish whether the proceeds were utilized for new green capital expenditure, refinancing, or symbolic issuance.
The remainder of this paper is organized as follows:
Section 2 details the materials and methods, describing the dataset, variables, and the static and dynamic econometric specifications.
Section 3 presents the empirical results and contrasts the fixed-effects estimates with the system.
Section 4 discusses the findings in the context of endogeneity. Finally,
Section 5 concludes the study and outlines the policy implications of the research.
3. Results
The results are structured as follows. First,
Section 3.1 presents the baseline static panel data estimations using two-way fixed effects, validated against cross-sectional dependence.
Section 3.2 extends the analysis to a dynamic framework employing the system GMM estimator to address endogeneity and reverse causality. Finally,
Section 3.3 evaluates the robustness of the identification strategy by exploring structural heterogeneity across OECD and non-OECD economic blocs to ensure the stability of the estimated parameters.
3.1. Two-Way Fixed Effects
The results from the two-way fixed-effects estimations are reported in
Table 4. Across all specifications, green bond issuance has a negative association with carbon intensity.
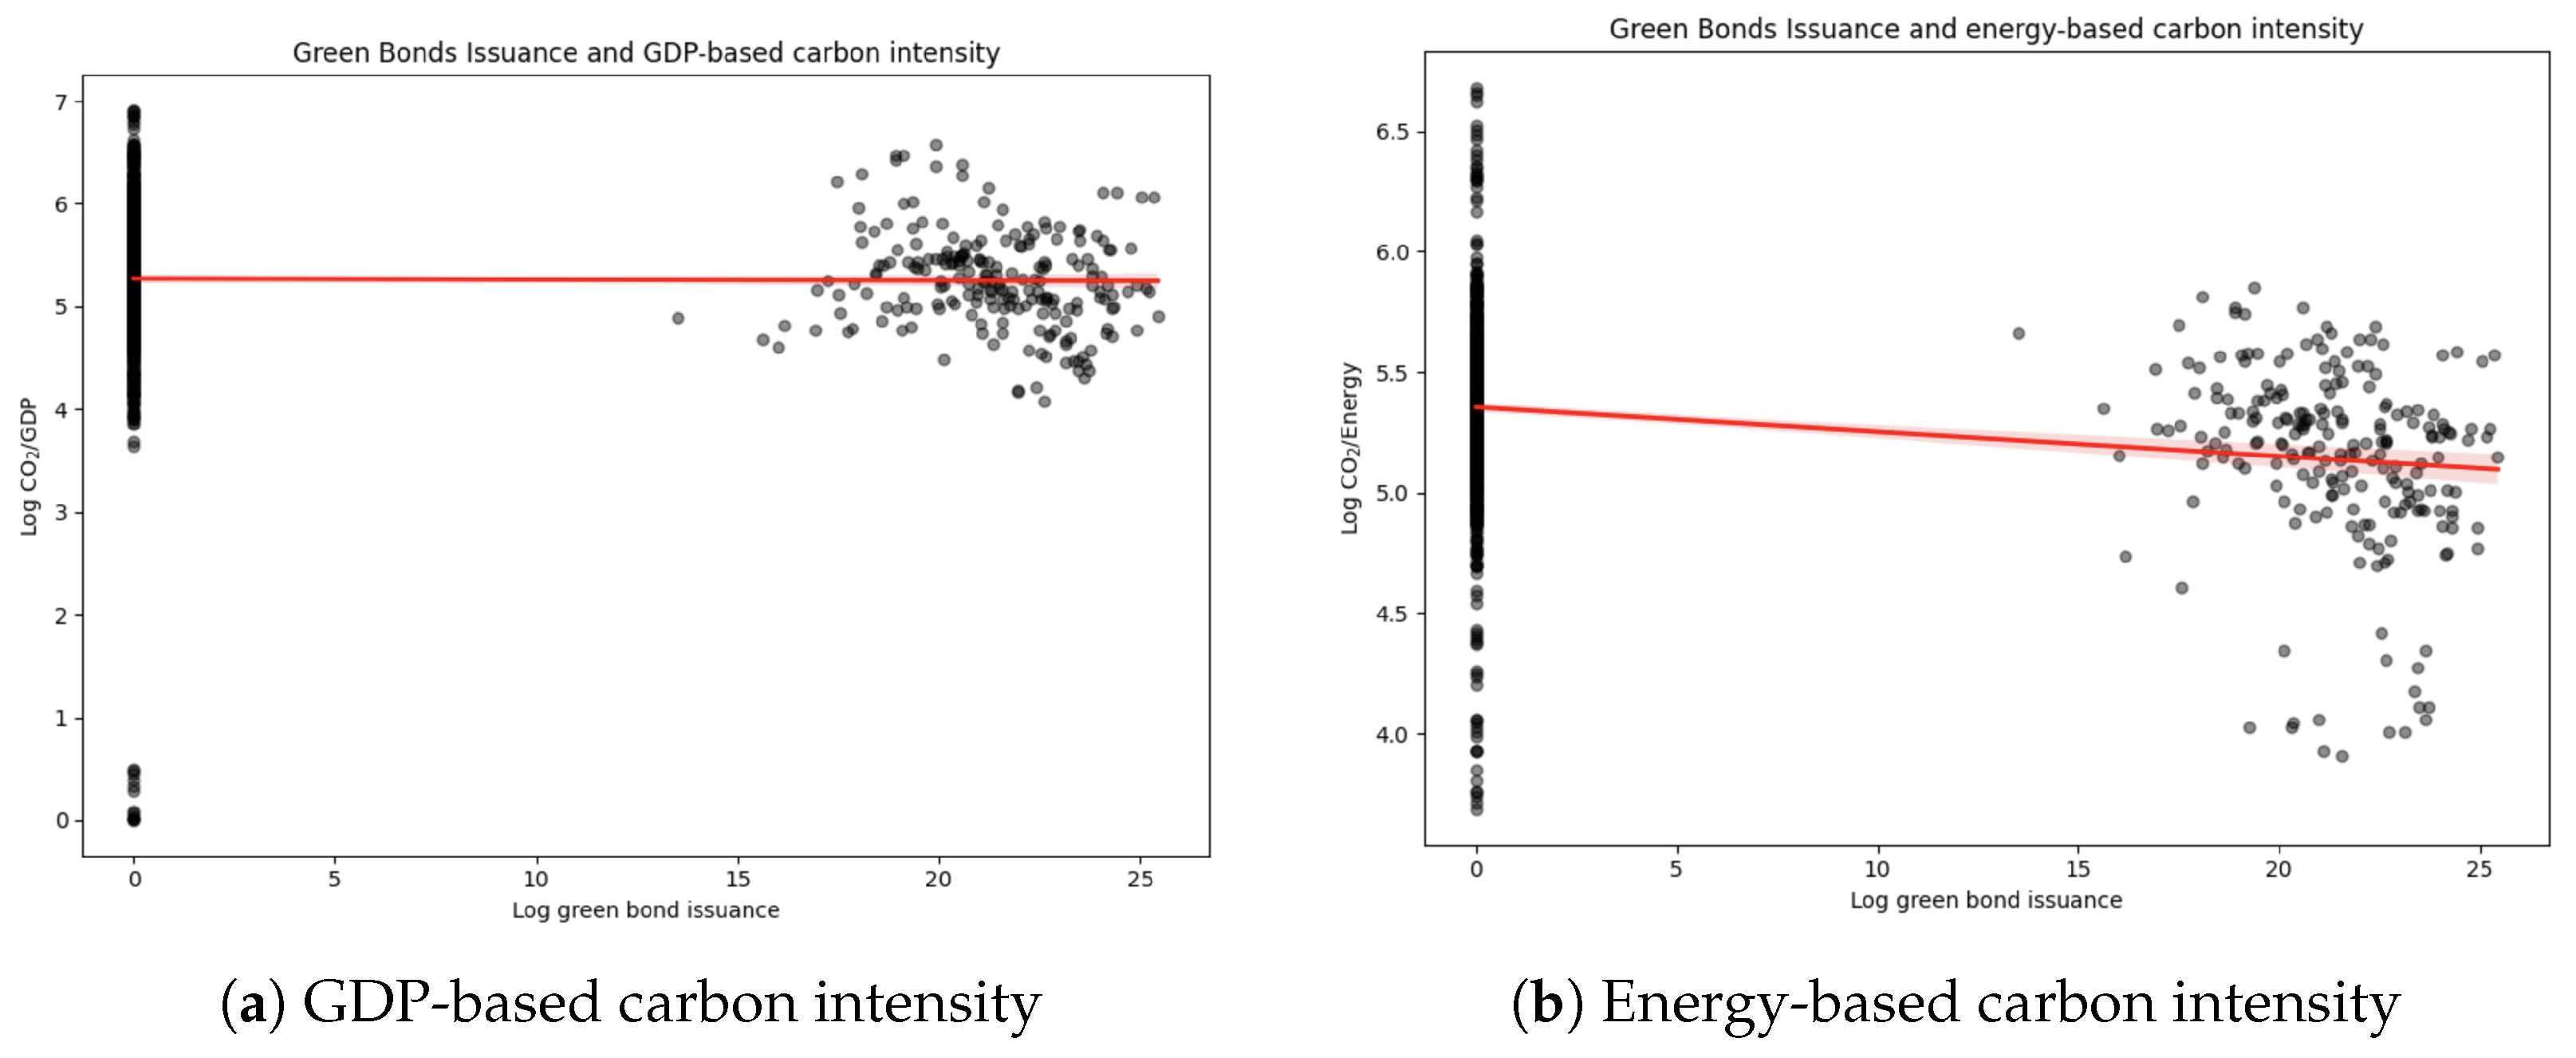
Figure 3 provides a visual representation of these relationships.
Table 4.
Two-way fixed-effects estimates of carbon intensity.
Table 4.
Two-way fixed-effects estimates of carbon intensity.
| | Model 1 | Model 2 | Model 3 | Model 4 |
|---|
| | | | | |
|---|
| | Full Sample | Full Sample | Top-5 Excluded | Top-5 Excluded |
|---|
| ** | *** | ** | *** |
| | (0.0020) | (0.0007) | (0.0020) | (0.0008) |
| | 0.0746 | | 0.0749 |
| | (0.3861) | (0.0839) | (0.3896) | (0.0848) |
| | | | |
| | (0.0695) | (0.0526) | (0.0697) | (0.0526) |
| Observations | 1320 | 1320 | 1280 | 1280 |
| (Within) | 0.0094 | 0.0301 | 0.0088 | 0.0298 |
| Country FE | Yes | Yes | Yes | Yes |
| Year FE | Yes | Yes | Yes | Yes |
Table 5.
Dynamic panel-data estimation (Two-step System GMM).
Table 5.
Dynamic panel-data estimation (Two-step System GMM).
| | GMM 1 | GMM 2 | GMM 3 |
|---|
| | Baseline | Top-5 Excluded | CO2/Energy |
|---|
| 0.8650 *** | 0.8638 *** | 0.9283 *** |
| | (0.0665) | (0.0741) | (0.0495) |
| ** | *** | * |
| | (0.0011) | (0.0010) | (0.0006) |
| | | 0.0005 |
| | (0.0240) | (0.0228) | (0.0058) |
| 0.0157 | 0.0133 | |
| | (0.0252) | (0.0245) | (0.0050) |
| Observations | 1320 | 1280 | 1280 |
| Hansen J-test (p-value) | 0.795 | 0.866 | 0.161 |
| AR(1) Test (p-value) | 0.186 | 0.183 | 0.000 |
| AR(2) Test (p-value) | 0.550 | 0.547 | 0.273 |
| Number of instruments | 16 | 16 | 16 |
Model 1 shows that absolute green bond issuance () is negatively associated with carbon intensity measured relative to economic output, with a coefficient of (p < 0.05). Model 2 shows that this negative and statistically significant relationship persists when carbon intensity is measured relative to energy consumption, yielding a coefficient of (p < 0.01).
The robustness of these findings is further confirmed when the specifications exclude the five largest green-bond-issuing countries. Specifically, models 3 and 4 report negative and statistically significant coefficients of −0.0043 (p < 0.05) and −0.0035 (p < 0.01), respectively, demonstrating that the estimated baseline relationship is not driven by a small number of dominant market issuers.
Overall, fixed-effects estimates provide consistent evidence of a negative association between green bond activity and carbon intensity. However, these estimates should be interpreted with caution because they do not fully address potential endogeneity arising from reverse causality or omitted-variable bias. The next section introduces a dynamic panel framework based on system GMM to evaluate the robustness of these findings under stricter identification assumptions.
It should be noted that the within R2 values remain relatively low across specifications, indicating that green bond activity explains only a limited amount of the variation in carbon intensity within countries. This result is not unexpected, as emissions are influenced by complex, multidimensional factors, including technological, institutional, regulatory, and sectoral factors that are beyond the scope of this analysis.
Regarding the diagnostic tests, the high persistence of the lagged dependent variable coefficients (ranging from 0.864 to 0.928) implies that the autoregressive structure absorbs the vast majority of the time-series dynamic profile. This explains the absence of a statistically significant (1) in Models 1 and 2, as the remaining idiosyncratic innovations approach white noise properties. Crucially, the fundamental condition for the consistency of the system GMM estimator is the absence of second-order serial correlation, which is robustly satisfied across all specifications since the (2) tests fail to reject the null hypothesis of no autocorrelation. Furthermore, given our two-step robust estimation with a collapsed instrument matrix, the overidentification restrictions are properly evaluated using the Hansen J-test, which is robust to heteroscedasticity.
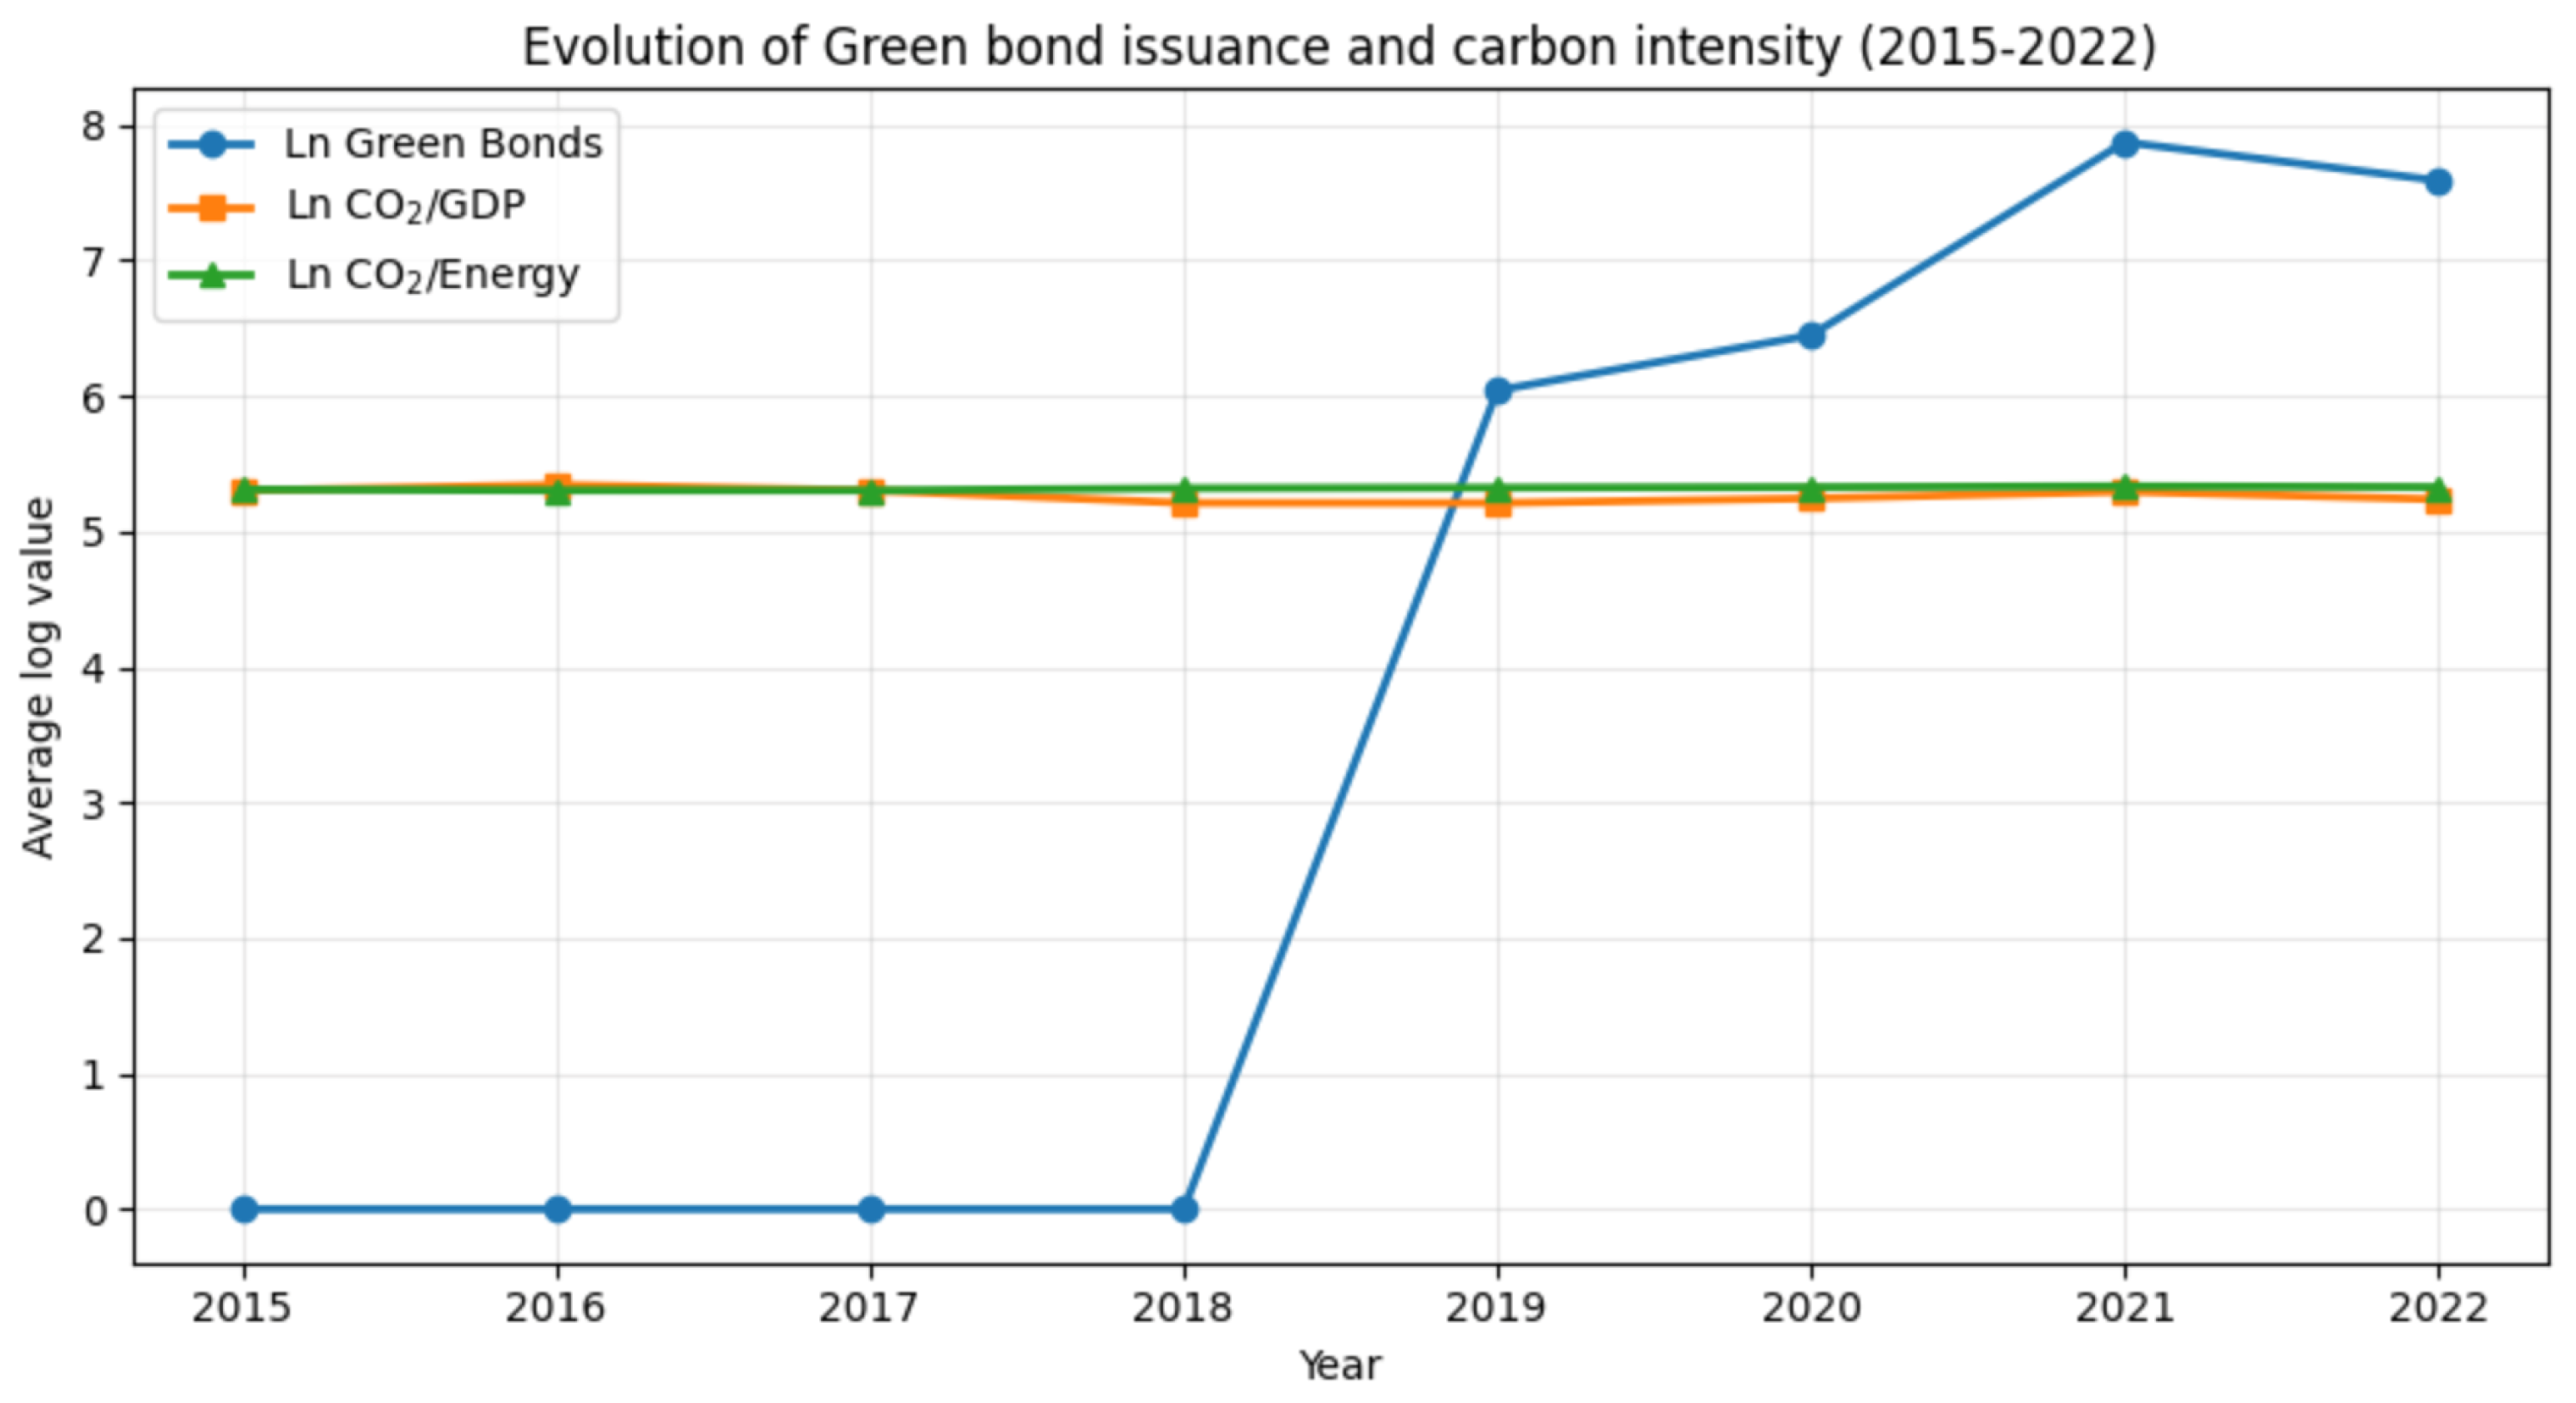
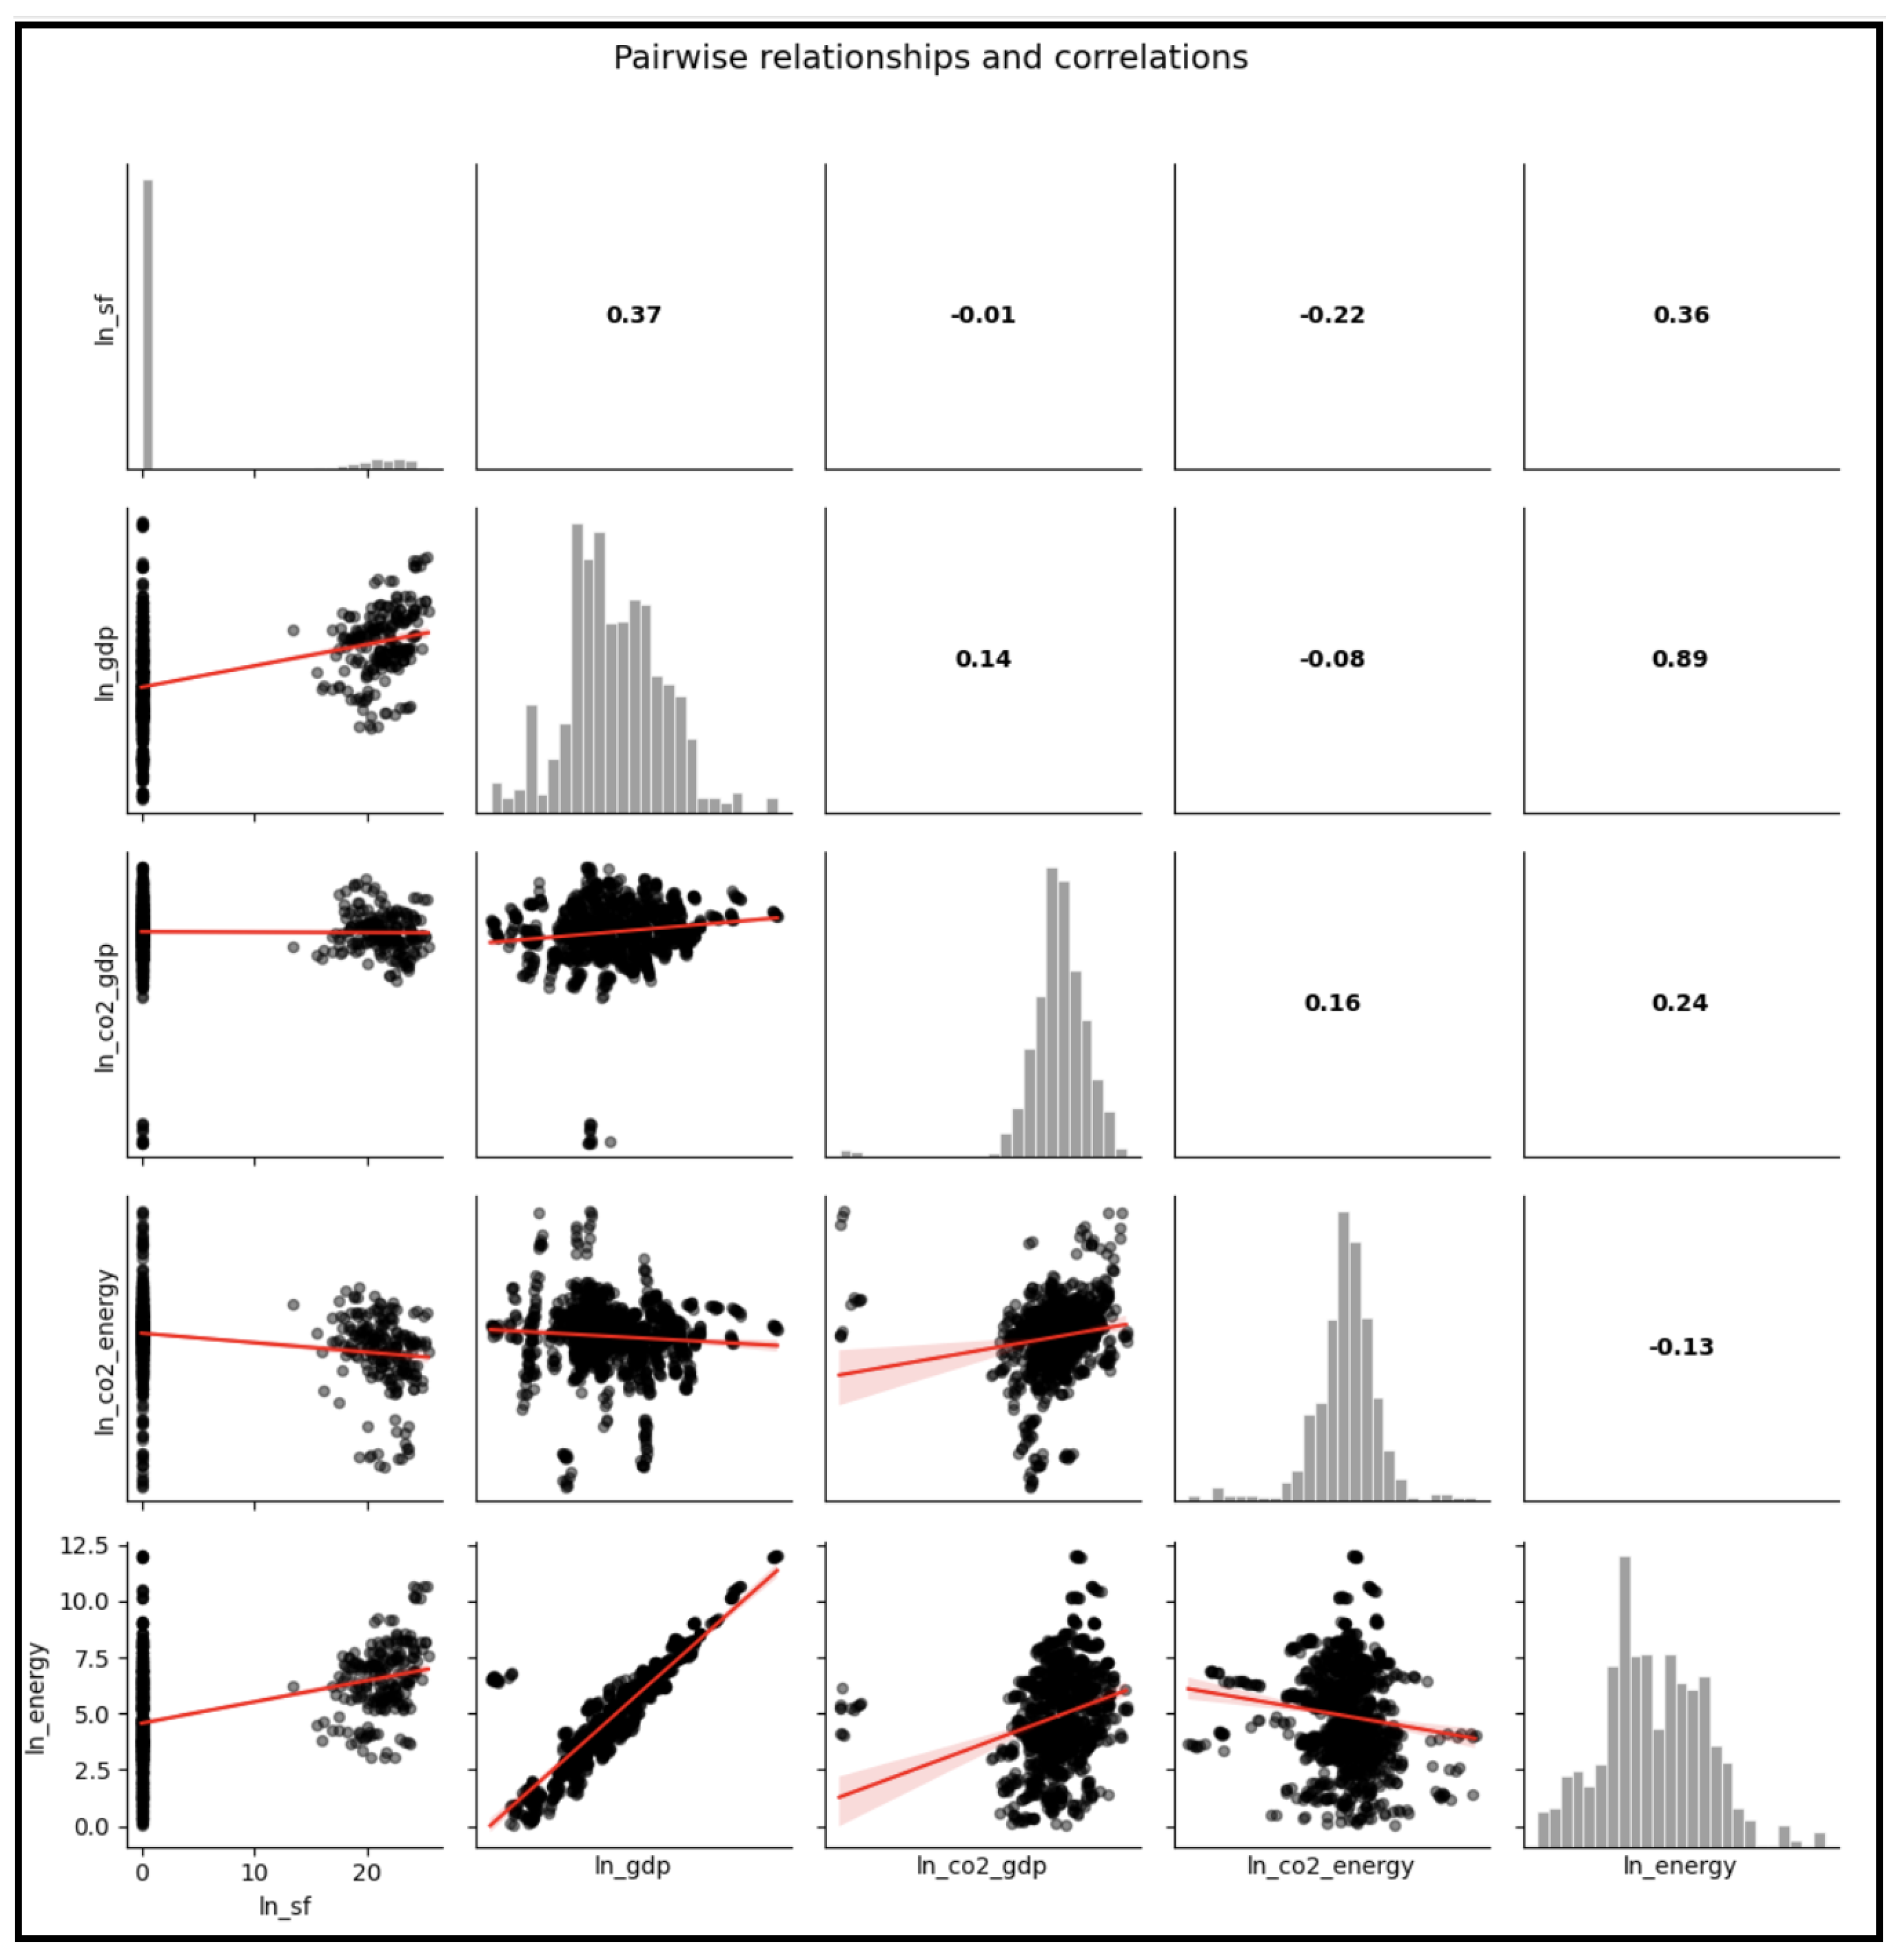
Figure 3 illustrates the bivariate relationship between green bond issuance and carbon intensity. The concentration of observations at zero issuance reflects the limited diffusion of green bond markets across countries, with only 16.4% of country-year observations reporting positive issuance values. Despite this concentration, the fitted trend lines indicate raw pairwise associations between green bond activity and both measures of carbon intensity. These plots serve solely as a descriptive exploration of the data; the formal identification of a relationship—and any potential directional effect—is reserved for the multivariate econometric analysis conducted in the following sections.
To ensure the robustness of the static panel baseline against unobserved common shocks and global macroeconomic trends (such as the implementation of the Paris Agreement or the COVID-19 pandemic), the presence of cross-sectional dependence is explicitly evaluated. The Pesaran CD test reveals an average cross-sectional correlation among the residuals of 0.200, strongly rejecting the null hypothesis of cross-sectional independence across all specifications. To address this heterogeneous exposure to global shocks and prevent biased statistical inference, the baseline models in
Table 4 are validated utilizing Driscoll–Kraay standard errors, which are robust to serial correlation and general forms of spatial and cross-sectional dependence. Crucially, the coefficient for green bond activity (
) remains negative and statistically significant at the 1% level (
p = 0.0008), confirming that the baseline results are highly robust and not artifactual products of cross-sectional correlation.
3.2. Dynamic Panel Estimation (System GMM)
The results from the two-step system GMM estimates are reported in
Table 5. Across all specifications, the lagged dependent variable remains positive and significant, with coefficients ranging from 0.864 to 0.928. This finding confirms the strong persistence of carbon intensity over time and highlights the structural inertia of national energy and production systems.
In the baseline specification (GMM 1), green bond issuance exhibits a negative and statistically significant association with carbon intensity (, p < 0.05). This result remains robust when the five largest green-bond-issuing countries are excluded from the sample (GMM 2), where the coefficient becomes slightly larger in magnitude (, p < 0.01). The stability of the coefficient suggests that the estimated relationship is not driven by a small number of dominant issuers.
The alternative specification based on carbon intensity relative to energy consumption (GMM 3) also yields a negative coefficient for green bond issuance (). Although statistical significance weakens under this specification (p < 0.10), the direction of the relationship remains consistent with the baseline model.
The diagnostic tests support the validity of the dynamic estimates. The Sargan test statistics are not statistically significant in any specification (p-values ranging from 0.161 to 0.866), indicating no evidence against the validity of the instrument set.
To provide a clearer economic interpretation of the estimated impacts, given the highly skewed distribution and extreme concentration of the green bond variable (), economic magnitudes are evaluated using standard deviation and distributional shifts based on Model 1. A one-standard-deviation increase in the log of green bond issuance (10.05) is associated with a 2.41% reduction in carbon intensity in the short run and a cumulative long-run reduction of 17.78%. Furthermore, shifting from zero issuance to the median positive issuance level yields a short-run decline of 1.12% (8.25% in the long run). Finally, a distributional move from the 25th to the 75th percentile among active green bond issuers reduces carbon intensity by 1.68% in the short run and by 12.39% over the long-run horizon. These metrics confirm that while short-run semi-elasticity appears small, realistic scales of green finance expansion imply economically meaningful decarbonization pathways.
Furthermore, given the high persistence of the lagged dependent variable, the short-run coefficients underestimate the permanent structural impact of green bonds over time. Following standard dynamic panel methodology, the long-run effects are computed as . The estimated long-run coefficients are for the baseline model (GMM 1), when excluding the top-five issuers (GMM 2), and for the energy-adjusted specification (GMM 3). These results reveal that the long-run association between green bond issuance and carbon intensity is between 7 and 14 times larger than the immediate short-run impact. This underscores that while the contemporary effect of green financing appears modest, its cumulative macroeconomic role in supporting decarbonization is economically substantial.
3.3. OECD Robustness
To address potential identification challenges and to evaluate whether the baseline relationship is homogeneous across structurally distinct economic blocs, the dynamic system GMM framework presented in
Section 3.2 is extended to test for heterogeneity between OECD and non-OECD economies. Three complementary specifications are estimated: (i) a system GMM model restricted to the OECD subsample, (ii) a system GMM model restricted to the non-OECD subsample, and (iii) a single system GMM model estimated on the full sample that includes an interaction term,
, allowing the green bond coefficient to differ between the two groups within a unified specification. In this extension, the interaction term, together with
and
, is treated as exogenous and instrumented by its own current and lagged values; only the lagged dependent variable is instrumented using the internal GMM-style lags described in
Section 3.2.
Table 6 reports the results. In the pooled interaction model (GMM 6), the coefficient on
captures the association for non-OECD countries (the reference group), while the interaction term
captures the additional differential association for OECD countries. The non-OECD effect is negative and statistically significant (
,
p < 0.05), consistent in magnitude with the baseline estimate reported in
Table 5. The interaction term is negative but not statistically significant (
,
p = 0.130), indicating that the data do not provide sufficient evidence to reject the null hypothesis of equal slopes across OECD and non-OECD countries. In other words, the analysis does not detect a statistically significant difference in the green bond–carbon intensity relationship between the two blocs.
This conclusion is reinforced by the separately estimated subsample models. The non-OECD-only specification (GMM 5) yields a negative and marginally significant coefficient (, p = 0.061), consistent with the pooled interaction model. The OECD-only specification (GMM 4), by contrast, yields a coefficient close to zero and not statistically significant (, p = 0.746). However, this OECD-only estimate should be interpreted with substantial caution: the Sargan overidentification test rejects the validity of the instrument set at the 5% level (p = 0.019), and the estimated autoregressive coefficient ( = 0.986) is close to the unit-root boundary. Both patterns are consistent with the well-documented weak-instrument problem that arises in dynamic panel GMM estimation when the number of cross-sectional units is small (n = 38 OECD countries), and they indicate that the OECD-only point estimate is not statistically reliable on its own. By contrast, the non-OECD subsample (n = 127) and the pooled interaction model (n = 165) both satisfy the Sargan test (p = 0.802 and p = 0.795, respectively) and show no evidence of second-order serial correlation, supporting the validity of their instrument sets.
Taken together, these results support two conclusions. First, the negative association between green bond issuance and carbon intensity identified in the baseline system GMM model is not an artifact of pooling structurally different economies: it is present and statistically detectable in the larger and better-identified non-OECD subsample. Second, the pooled interaction model does not detect a statistically significant difference between the green bond–carbon intensity relationship in OECD and non-OECD countries. This suggests that, within the boundaries of the available sample, the carbon-mitigating association of green bond issuance is not exclusive to economies with the most developed institutional infrastructure; it is also present, and more precisely estimated, in the larger non-OECD subsample.
4. Discussion
The initial fixed-effects estimates reveal a negative correlation between green bond issuance and carbon intensity. This finding aligns with prior research indicating that sustainable financial markets can support improvements in environmental outcomes. Studies such as
Kim et al. (
2024) emphasize the intricate relationship between sustainable finance mechanisms and the necessity of managing uncertainty to facilitate a gradual shift toward a sustainable economy, while
Su and Lee (
2023) find a positive association between green finance and environmental quality at the global level.
Importantly, the dynamic system GMM results indicate that this relationship remains negative even after controlling for persistence and potential endogeneity. Although the magnitude of the coefficients decreases relative to the static specifications, green bond issuance continues to exhibit a statistically significant negative association with carbon intensity in the baseline dynamic model and in the specification excluding the largest issuing countries. These findings suggest that the observed relationship is not solely driven by reverse causality or omitted-variable bias, although the system GMM framework mitigates rather than fully eliminates these concerns, and a residual selection effect cannot be ruled out. At the same time, the relatively small magnitude of the coefficients indicates that the environmental effects of green bond markets are likely gradual and cumulative rather than immediate.
The robustness analyses further reinforce this interpretation. First, excluding the five largest green-bond-issuing countries does not eliminate the relationship; instead, the coefficient becomes slightly stronger. This result suggests that the estimated association is not driven by a small number of dominant issuers and responds directly to concerns regarding the concentration of green bond activity. Second, the alternative specification based on carbon intensity relative to energy consumption also yields a negative coefficient for green bond issuance. Although statistical significance becomes weaker in this specification, the consistency of the sign across all models offers tentative support for the underlying relationship, while underscoring that the energy-based channel is estimated with less precision than the GDP-based measure.
These results are broadly consistent with studies such as
Rasoulinezhad and Taghizadeh-Hesary (
2022), which emphasize the role of green finance in promoting energy efficiency improvements, and
A. Alharbi et al. (
2023), which conclude that the expansion of green bond markets can support renewable energy development. However, our findings also suggest that the environmental benefits associated with green bond issuance may materialize gradually because energy transitions are constrained by long-lived infrastructure, technological inertia, and the persistence of existing production systems.
The results are also consistent with the broader literature emphasizing that the environmental effectiveness of green bonds depends on institutional and market conditions. Studies by
Chang et al. (
2022);
Fatica and Panzica (
2021);
Flammer (
2021) document positive environmental outcomes associated with green bond instruments, while other contributions highlight the importance of governance quality, transparency, and the effective allocation of financial resources (
S. S. Alharbi et al., 2022;
Zerbib, 2019). The persistence of the negative coefficient across alternative specifications suggests that green bond markets can contribute to lower carbon intensity, although the magnitude of the effect may vary across countries depending on the quality of supporting institutions and policy frameworks.
The heterogeneity analysis presented in
Section 3.3 provides further context for this institutional interpretation. Although OECD economies are typically characterized by stronger regulatory frameworks and more mature green bond markets, the pooled interaction model does not detect a statistically significant difference between the green bond–carbon intensity relationship in OECD and non-OECD countries. This suggests that, within the boundaries of the available sample, the carbon mitigating association of green bond issuance is not exclusive to economies with the most developed institutional infrastructure; it is also present, and more precisely estimated, in the larger non-OECD subsample. This finding tempers a purely institutional-quality explanation of the results and is consistent with the view that the relationship between green bond issuance and carbon intensity operates, at least partially, through channels that are not strictly conditional on OECD-level governance standards. At the same time, the methodological limitations of the small OECD subsample mean that this conclusion should be treated as suggestive rather than definitive, and that institutional quality may still play a moderating role that the present aggregate, country-level design cannot fully isolate.
Furthermore, the results suggest that green bond issuance can indirectly influence environmental outcomes by promoting investments in cleaner technologies, renewable energy projects, and low-carbon infrastructure. As demonstrated by
Flammer (
2021), green bond issuance can also serve as a signaling mechanism that attracts environmentally oriented investors and encourages long-term commitments to sustainability objectives.
Consequently, the contribution of green bond markets should not be evaluated only through their immediate impact on aggregate emissions but also through their capacity to generate capital for environmentally sustainable investments.
In general, the evidence suggests that green bond issuance is associated with lower carbon intensity and that this relationship remains reasonably robust when adjusting for persistence, alternative environmental indicators, sample concentration effects, and structural heterogeneity between OECD and non-OECD economies. However, the relatively modest magnitude of the estimated coefficients indicates that green bonds should be considered a supplementary mechanism within a broader decarbonization strategy, which also requires supportive regulatory frameworks, technological innovation, and long-term climate policies.
A potential limitation of our empirical strategy is the challenge of fully separating the effect of green bond market development from a country’s baseline climate governance. Nations that actively issue green bonds often have stronger institutional frameworks, transparent environmental reporting standards, and stringent decarbonization policies, which could directly drive reductions in carbon intensity. Although the model addresses this by capturing structural time-invariant institutional characteristics through country fixed effects (), rapidly shifting, time-varying policy instruments, such as localized carbon taxes or green mandates introduced within our sample period, remain inherently unobserved factors due to data constraints. Consequently, the green bond coefficient may partially reflect the broader national capacity for green transition alongside the direct financial impact of the bonds themselves.
5. Conclusions
This study evaluated the relationship between green bond issuance and carbon intensity using two-way fixed-effects models and dynamic system GMM estimators for a balanced panel of 165 countries (2015–2022). The empirical results reveal a negative association between green bond issuance and carbon intensity that holds across most, although not all, specifications and subsamples. The dynamic system GMM estimates confirm that this relationship holds after controlling for persistence and potential endogeneity. However, the evidence remains consistent with both a direct green-finance effect and a selection mechanism, whereby countries on pre-existing lower-carbon trajectories are more likely to issue these instruments.
The significance of the lagged dependent variable across all dynamic specifications suggests that structural characteristics of national energy systems continue to play a central role in shaping environmental outcomes. Consequently, green bond markets should be interpreted as a complementary component of broader strategies for low-carbon economic transition rather than a standalone transformative solution.
From a policy perspective, the findings emphasize that the effectiveness of green bonds is contingent on the broader institutional and policy environment. Policy efforts should be primarily directed toward strengthening regulatory frameworks, enhancing transparency, and mandating rigorous post-issuance reporting and environmental verification. By prioritizing the clarity of use-of-proceeds reporting, policymakers can ensure that green financing is effectively aligned with national decarbonization targets.
Several limitations should be acknowledged when interpreting the results. First, the study covers the period 2015–2022, which corresponds to a relatively early stage in the development of global green bond markets. Second, due to the aggregate nature of the country-level data, the estimated coefficients should be interpreted as macroeconomic associations rather than direct measures of project-level environmental performance.
A methodological limitation of this study arises from the high proportion of zero observations in global green bond issuance, reflecting the nascent state of this market. Although our two-step system GMM framework effectively handles distributional asymmetries through internal instruments and optimal moment conditions without imposing strict normality assumptions on independent variables, it does not explicitly disentangle the extensive margin (the decision to issue) from the intensive margin (the volume issued). Future research should explore hurdle-type panel methodologies and zero-inflated dynamic models as global market participation expands, allowing for a more granular decomposition of these distinct financial decisions. The analysis focuses on the aggregate relationship between green bond issuance and carbon intensity and does not allow the identification of specific transmission channels, such as renewable energy investments, energy efficiency improvements, or signaling effects. Future research could explore these mechanisms using sectoral or project-level data. Although the dynamic system GMM framework rigorously controls for time-invariant country heterogeneity and emissions persistence through internal instruments and dynamic lags, macro-level omissions regarding rapidly shifting time-varying policies remain a structural constraint. Future research should aim to explicitly integrate dynamic institutional indices, such as time-varying climate policy stringency scores, renewable energy shares, and evolving carbon pricing mechanisms, as global data standardizes across a comprehensive macro-panel of emerging and developed nations. Overall, while green bonds are associated with lower carbon intensity, they must be integrated into comprehensive climate policies that prioritize governance, accountability, and systemic structural reforms.