1. Introduction
The stability of the financial systems of Asia-Pacific countries has been a concern since the Asian financial crisis in 1997 and the US financial crisis in 2008 (
Hasni et al., 2023). The instability of the world economy and the decline in profitability stem from the fragility of banks due to the many risks they face. This issue has always attracted the attention of bank managers and academics. In the Southeast Asian financial market, after the global financial crisis in 2008, the financial structure of the banking system changed due to the rapid consolidation of banks through integration, privatization, the removal of barriers to mergers and acquisitions, financial reform, and the penetration of foreign banks. In addition, other financial institutions such as investment banks, mutual funds, and insurance companies are competing vigorously with the core business of commercial banks (
Battaggion et al., 2023;
Hasni et al., 2023).
In this situation, the survival and sustainable development of commercial banks inevitably must take into account the issue of profit efficiency and risk. Therefore, the topic of the causal relationship between profit efficiency and bank risk has attracted scholars around the world (
Deng et al., 2024;
Koroleva et al., 2021). In terms of academics, most studies only evaluate the one-way impact between profit efficiency and bank risk (
Berger & DeYoung, 1997;
Saif-Alyousfi, 2022;
Van Anh, 2022).
The causal relationship between bank profitability and risk is of interest in European financial markets (
Van Anh, 2022), and American financial markets (
Dutta & Saha, 2021). However, in Southeast Asian emerging financial markets, this topic has received little or no significant attention, except for the Chinese financial market (
Tan et al., 2021).
The
Berger and DeYoung (
1997) theory of the relationship between risk and return continues to be widely used in empirical studies, as it provides a useful analytical framework that helps researchers, investors, and bank managers identify and evaluate these two factors simultaneously. From the perspective of investors and managers, this theory is particularly significant in clarifying the causal relationship between risk and return, thereby supporting optimal decision-making, especially in the context of economic shocks.
Essentially, business decisions are all aimed at maximizing enterprise value, with efficiency reflected through profit indicators such as ROA and ROE. Therefore, the two-way relationship between risk and return becomes an important theoretical basis for many studies to build hypotheses about the interaction between these two factors. Based on that foundation, the current study examines the causal relationship between risk and return in the context of banks in emerging financial markets in Southeast Asia.
Based on the foregoing analysis, this study aims to examine the causal relationship between profit efficiency and risk in Southeast Asian commercial banks. By providing robust empirical evidence on the performance–risk trade-off, the findings offer practical implications for bank managers and policymakers in ASEAN, particularly in Vietnam:
- -
In designing effective risk management strategies.
- -
In improving profit efficiency and formulating regulatory policies that promote financial stability and sustainable banking development.
2. Related Literature and Hypotheses
For the convenience of experimentation, in this paper, “profitability” can be understood as the ability of a business or bank to generate profit from its assets and equity, measured primarily through ROA and ROE.
Both as a stimulus to improve productivity and efficiency, and as a factor affecting the financial stability of the banking system, it is formed by the intertwined relationship between profit efficiency and risk (
Tan et al., 2021).
Investors will not choose a risky portfolio if they do not expect the level of profit achieved to correspond to the risk faced. This means that these discussions are not beyond the purpose of answering the question of why a bank cannot achieve maximum profit efficiency in a risky operating environment. The causal relationship between profit efficiency and risk was first studied by
Berger and DeYoung (
1997), related to the hypotheses “bad luck”, “bad management”, “skimping”, and “moral hazard”, which were later developed by (
Koutsomanoli-Filippaki et al., 2009).
Recent studies in the ASEAN region after 2021 show a shift from traditional linear models to multidimensional analytical frameworks, where profit efficiency and risk are measured simultaneously through composite indicators and modern quantitative methods. Besides the approaches of
Berger and DeYoung (
1997),
Hasni et al. (
2023),
Koroleva et al. (
2021), and
Saif-Alyousfi (
2022), approaches such as risk-adjusted efficiency, the extended CAMELS model, DEA/SFA analysis, and the Basel framework have been widely applied to more fully reflect the complex relationship between bank profitability and risk in the context of financial integration and global economic volatility.
Several studies have also analyzed the relationship between risk and banking performance. For example,
Berger and DeYoung (
1997) studied the relationship between credit risk management and banking profit efficiency in the US banking system. They showed that increased credit risk is often accompanied by decreased profit efficiency, due to increased credit provisioning costs and asset losses.
Veizi and Çelo (
2024) studied the relationship between bad debt and banking profit efficiency in Albanian banks, showing that high bad debt ratios negatively affect banking performance. Banks that are effective in controlling credit tend to be less affected by bad debt.
Khan (
2022) studied banks in six countries in the GCC and found that banks with higher profit efficiency generally had lower risk ratios. Their research indicated that effective risk management helps banks enhance profit efficiency and reduce losses from bad debt.
Supiyadi and Novita (
2023) conducted research at banks in Indonesia and found that increased credit risk can reduce bank profit efficiency, especially during periods of economic instability. High bank performance is often accompanied by lower credit risk indicators.
A review of international studies shows that most previous studies mainly focused on assessing the one-way impact of risk on bank profit efficiency (
Berger & DeYoung, 1997;
Veizi & Çelo, 2024;
Khan, 2022;
Tan, 2016); meanwhile, studies analyzing the two-way causal relationship between profit efficiency and risk, especially in the context of emerging markets in Southeast Asia, are still quite limited. Therefore, this study was conducted to fill the gap in the existing literature by examining the causal relationship between profit efficiency and bank risk in Southeast Asian countries.
The impact of risk on profit efficiency:
The “bad luck” hypothesis states that an increase in bad debt and Granger-cause reduces banking profit efficiency and leads to a decline in profit efficiency. At this time, an increase in bad debt is influenced by factors such as macro-GDP, inflation, unemployment, lower interest rates, and increasing money supply, which forces commercial banks to increase management activities and credit portfolios, especially near maturity credits. The increase in management and debt sale increase costs and reduce banking profit efficiency, leading to a decline in profit efficiency. By the above argument, the authors hypothesize:
H1. The increase in risk is the cause of the decline in profit efficiency.
The impact of profit efficiency on risk:
The “bad management” hypothesis show that low-cost efficiency and declining profitability are the signals of poor governance such as loan portfolio management, credit supervision, and operating cost management. At the same time, managers do not fully control and supervise expenses, resulting in low cost-effectiveness and lower profit efficiency, which will increase the reaction of the NPLs. Thus, low banking efficiency leading to reduced profit efficiency is a sign of weak and causal business performance causing bad debts (NPLs) to rise. The expectation in this relationship is negative between bad debt and bank profit efficiency. This also means a negative relationship between bad debt and bank profit efficiency.
The “Skimping” hypothesis tested is similar to bad management, but the signal is reversed, resulting in a negative causal relationship between bank profit efficiency and bad debt. Here, the key decision of the bank lies in the conflict between short-term operating costs and problems with loan quality. Therefore, a bank that wants to maximize profit efficiency in the long term must choose to cut costs in the short term by ignoring the cost of credit appraisal, monitoring loans, etc., and will suffer the consequences of bad debt appearing in the future. At this point, the higher the bank’s efficiency, the higher the bank’s profit efficiency, which will have negative effects on the Granger causality analysis of bad debt. This negative relationship is supposed to trade future loan performance (long-term profit maximization expectation) for the short-term efficiency of bank costs.
Contrary to the “skimping” hypothesis of
Berger and DeYoung (
1997), the “risk-averse management” hypothesis by according to
Koutsomanoli-Filippaki et al. (
2009) argues that senior executives often tend to avoid risks, thus increasing the costs of monitoring, controlling, and guaranteeing loans to reduce bad debt. Therefore, concern about the effects of the financial crisis and asymmetric information explains the relationship as constructed in the same way, meaning that cost-effectiveness increases proportionally with the rate that increases in impact returns positively reduce bad debt ratios.
Finally, the “moral hazard” hypothesis refers to the conflicting relationship between risk and profit efficiency, and the idea that low-capital banks often have an incentive to invest in risky assets, and in the long run that risk will increase. Therefore, banks with relatively low capital will be the cause of inefficient loans. Conversely, high-capital banks often do not face the ethical risk of ineffective loans. Meanwhile, cost-effectiveness is assessed by these loans. This, showing that inefficiency in terms of costs leads to a decline in profit efficiency, is the basis for increasing banking risks in the future.
Profit efficiency can be considered one of the causes of banking risk when viewed from the perspective of profit efficiency-maximizing behaviors, and the motivations of financial institutions. Firstly, the pressure to maintain and increase profit efficiency (reflected in indicators such as ROA and ROE) can drive banks to accept higher levels of risk. When profit is prioritized, banks tend to expand lending into high-yield segments with high levels of risk, such as lending to customers with low credit quality or investing in highly volatile assets. This increases credit risk and market risk. Secondly, high short-term profit efficiency can create a “search-for-yield” incentive, leading banks to loosen credit assessment standards or reduce risk control levels. This behavior often occurs in the context of intense competition or low market interest rates, degrading asset quality and increasing the likelihood of future bad debts.
Third, positive profit efficiency can lead to overconfidence among managers, causing them to underestimate potential risks and expand business operations beyond their control. As a result, banks may face liquidity risk, operational risk, or financial imbalances when market conditions change. Fourth, in some cases, low or declining profits can also increase risk. Specifically, to improve business results banks may employ a “gambling for resurrection” strategy, accepting high-risk investments in search of sudden profit efficiency, thereby increasing financial instability. Ultimately, the relationship between profit efficiency and risk is two-way and time-lagged: decisions aimed at maximizing profit efficiency in the present may increase risk in the future. Therefore, profit efficiency is not only a result of banking operations but also a factor that inversely impacts and alters the risk appetite and risk management behavior of banks. Based on the above argument, the authors propose the following hypothesis:
H2. The decrease in profit efficiency will be the cause of the increased risk.
3. Methodology
3.1. Data
The research data consists of the unbalanced panel data of commercial banks, collected from BankFocus during the period of 2007–2022. From the data of financial institutions in 11 Southeast Asian countries, the study excluded Brunei, East Timor, and Myanmar due to a lack of financial reporting, thus obtaining a sample of 118 commercial banks from eight countries: Cambodia, Indonesia, Laos, Malaysia, the Philippines, Singapore, Thailand, and Vietnam. Methodologically, the period of 2007–2022 provides a sufficiently long data series to ensure the reliability of empirical tests, while also fully reflecting the stages of the economic cycle, such as crisis, recovery, stability, and new shocks.
To ensure the reliability and consistency of the data, the study only retained banks with a minimum of five years of observation and financial reporting extending beyond 2021. Simultaneously, duplicate records were removed to ensure the accuracy of the unbalanced panel data structure. Variables with high data missing rates were removed to limit estimation bias, while values with small missing values were replaced with the mean. In addition, outliers were handled using winsorization at appropriate quantiles to reduce the impact of extreme observations on regression results.
After data cleaning, the research variables were standardized and converted into ratio variables for analysis. Finally, banking data was merged with macroeconomic data using a country-year structure, where each banking observation was linked to corresponding macroeconomic indicators for the country and year, such as GDP growth and inflation.
3.2. Calculating Based Profit Efficiency and Risk
Based on financial statement data, bank risks are measured by the Z-score index. The Z-score is used to measure the solvency risk of commercial banks. It is a reverse proxy of the firm’s probability of failure, and it combines profit efficiency, leverage, and volatility in a single measure. For each bank i and time t, it is determined as follows:
where ROA is the return on assets, E/TA is the ratio of equity to total assets, and ROA is the standard deviation of return on assets. The higher the Z-score, the greater the stability, and the lower the risk (
Deng et al., 2024;
Van Anh, 2022).
3.3. Panel VAR Model
We consider the causal relationship between profit efficiency and risk through a system of the PVAR model.
Step 1: Select the optimal lag order for the model, satisfying the condition that the smallest values of MBIC, MAIC, MQIC, and CD are the largest.
Step 2: The author performs stationarity testing using the Fisher-type unit root test and stability testing for the data.
Step 3: After testing the stationarity and stability of the data, the author estimates the model using the PVAR method and Granger causality testing for this relationship.
The variables included in the model are profit efficiency and risk, and lags of the two variables, in which the short-term dynamic relationship is defined (
Van Anh, 2022;
Licerán-Gutiérrez et al., 2025;
Duho et al., 2020). The dynamic relationship between endogenous variables is shown in the PVAR equation as follows:
where
consists of two random variables, profit efficiency, and risk,
is a (k × 1) vector of the blocking coefficient vector constant over time given for each specific bank,
is the matrix (k × k) of the coefficient of the lag variable (the parameter to estimated),
, to collect the unique and cross effects of these lag variables depends on observation, and
is a (1 × k) vector of errors measurement with characteristics,
for all t. The coefficient of
in Equation (1) is correlated with the error part, and through least square regression OLS will bias coefficients (
Duho et al., 2020;
Saeed & Izzeldin, 2016).
To address these issues, particularly in panel data with many cross-sectional observations but few time periods, the model should first be transformed to eliminate individual fixed effects and then estimated using the system GMM method, which employs lagged variables as instruments (
Arellano & Bover, 1995). SGMM is especially suitable for handling the dynamic nature of the model, reflected in lagged dependent variables and potential correlations among explanatory variables, thereby reducing endogeneity and improving the reliability of the estimates.
Compared with traditional methods such as REM and FEM, the PVAR model offers greater advantages in analyzing the causal relationship between risk and profit efficiency. By combining VAR with panel data and estimating through GMM, PVAR allows for the examination of bidirectional and lagged relationships among endogenous variables (
Tan, 2016;
Arellano & Bover, 1995). In addition, PVAR is appropriate for panel data characterized by many observations and few time periods, while also controlling for fixed effects, heteroskedasticity, and autocorrelation.
The Panel Vector Autoregression model was estimated using the System Generalized Method of Moments and employed forward orthogonality to eliminate fixed effects and reduce the loss of observations in unbalanced panel data. The Hansen J test was still used to evaluate the validity of the toolkit and model specification. The number of tools compared to the number of observation groups was checked to avoid tool overshoot.
Granger causality test of the form:
In which, α0 and α1 are the intercept; βj, j, γj, θj are the regression coefficients, and ɛt and υt are the errors.
Yt and Yt−1 are the profit efficiency in the current period and the previous period, respectively.
Xt and Xt−1 are the risk in the current period and the previous period, respectively.
Hypothesis:
If ρj ≠ 0 and has p-value < 0.05 but θj has p-value > 0.05, conclude that the fluctuation of Xt is the cause of the fluctuation of Yt.
If ρj has p-value > 0.05 but θj ≠ 0 and has p-value < 0.05, conclude that the fluctuation of Yt is the cause of the fluctuation of Xt.
If both ρj and θj are different from 0 and have statistical significance (p-value < 0.05), Xt and Yt interact with each other.
If both ρj and θj are not statistically significant (p-value > 0.05), conclude that Xt and Yt are independent.
After performing the PVAR regression, we calculate the impulse response function (IRF) and variance decomposition (VDC) to account for the orthogonal shock between the profit efficiency variable and the risk variable. Next, we estimate the current and future responses of profit efficiency to the risk shock and vice versa through the impulse response function (IRF) estimation technique. The percentage of changes in profit efficiency explained by the risk shock over time and vice versa is calculated through the variance decomposition (VDC) technique.
3.4. Research Model
The authors approach the study of
Dutta and Saha (
2021) and the study of
Saeed and Izzeldin (
2016). Specifically, we test the causal relationship between profit efficiency and risk according to two equations with the following structure:
In which i is understood as bank, t is time, risk is estimated by Z-score index for bank i in time t, Eff is profit efficiency for bank i in time t, lag = (1, …, j).
4. Empirical Results and Discussion
4.1. Profit Efficiency and Risk
Table 1 presents descriptive statistics of the variables for the observations (Obs), mean (Mean), standard deviation (Std.Dev), minimum (Min), and maximum (Max) of the banks.
Table 1 shows that Southeast Asian commercial banks maintained relatively stable profitability during the period 2007–2022, with an average ROA of 0.018 and an ROE of 0.568. This reflects the region’s ability to generate returns from assets and equity, especially in the context of facing shocks such as the global financial crisis and the COVID-19 Pandemic.
In addition, the average Z-score of 1.792 indicates the relative financial stability of banks in the region, which is similar to the average risk level of Asia Pacific commercial banks, which is 0.16 (
Deng et al., 2024). A higher Z-score generally reflects a lower probability of insolvency and better risk resilience. Compared to the average risk level of banks in the Asia-Pacific region, these results show that Southeast Asian banks generally maintain a relatively safe level, although significant differences still exist between countries due to uneven levels of financial development, governance capacity, and banking supervision standards.
4.2. PVAR Model Result
For the conditions for estimating research models (2) and (3) using the PVAR method, we chose the optimal lag j of the independent variable. The lag length chosen satisfies the minimum value of MBIC, MAIC, and MQIC, and CD is the largest. The results in
Table 2 show that the optimal lag length is 1. This result is similar to the study (
Duho et al., 2020;
Azmi et al., 2019). The selection of a one-period lag (lag = 1) is theoretically and empirically justified beyond mere consistency with prior studies. In banking operations, managerial decisions related to lending, risk management, and asset allocation typically require time to materialize in financial outcomes, particularly in terms of credit risk and profit efficiency. Given that most financial indicators (e.g., ROA, ROE, and non-performing loans) are reported on an annual basis, a one-year lag appropriately captures the temporal transmission mechanism between profit efficiency and risk.
Moreover, employing a lagged structure helps mitigate endogeneity concerns arising from the bidirectional relationship between profit efficiency and risk. By introducing lagged explanatory variables, the model reduces simultaneity bias and enhances causal interpretation. This is particularly relevant in dynamic panel frameworks, where lagged variables often serve as valid instruments.
In the context of Southeast Asian banking systems, where regulatory adjustments, credit risk realization, and balance sheet restructuring tend to occur with short but non-instantaneous delays, a one-period lag is sufficient to capture the dynamic interaction between profit efficiency and risk without imposing the excessive loss of degrees of freedom. Therefore, the choice of lag = 1 ensures a balance between theoretical relevance, empirical robustness, and data constraints.
To estimate PVAR, the satisfaction condition for PVAR implementation requires testing the stationarity of the variables in the research models (2) and (3). The research data collected is unbalanced panel data, so the unit root test of the Fisher 3 Phillips-Perron (PP) table is consistent with hypothesis H
0 that all panel data are non-stationary. The results of the ADF test are often very sensitive to the choice of lag length. Therefore, the optimal lag length criterion is selected from the analysis results of
Table 2. The unit root test results of the Fisher Phillips-Perron table in
Table 3 show that all 4 test values obtained
p-values with a significance level of <0.05%. Therefore, contrary to hypothesis H
0, all series of values of the panel data are non-stationary for the observed variables of profit efficiency and the risk of banks. This means that the values of the observed variables ROA, ROE, and Z-score in the unbalanced panel data satisfy the stationarity according to the PVAR model. The results in
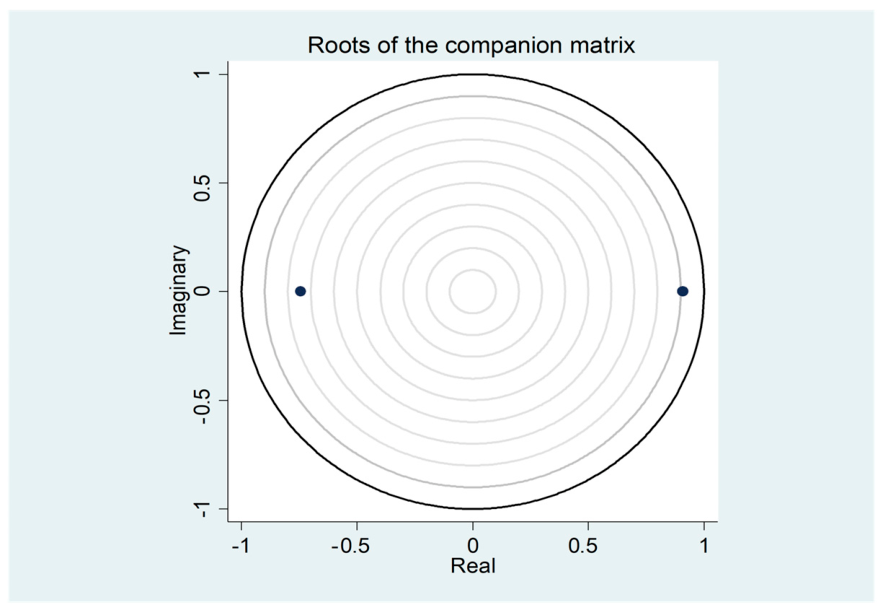
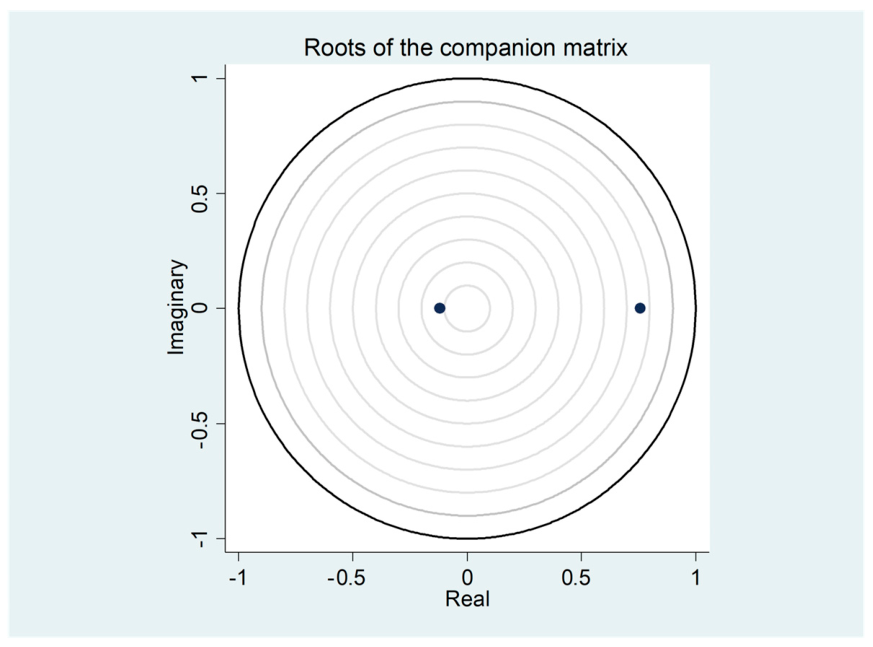
Table 4 show that all the eigenvalues lie inside the unit circle, so the PVAR model satisfies the stationarity condition (see
Figure 1 and
Figure 2).
The results presented in
Table 5 show that both models calculate the VAR Table (1), the causal relationship between ROA and Z-score, and model (2) estimates the causal relationship between ROE and Z-score for all banks in the sample. According to
Fu et al. (
2014), the larger the Z-score, the higher the financial stability of the banks, and the lower the risk.
The impact of risk on profitability (ROA) is positive and statistically significant at a 10% level (column 2, model (1) of
Table 5). This suggests that maintaining a lower level of risk tends to contribute to the improved profitability of the assets of banks (Z-score increases). This result is inconsistent with the risk–reward trade-off theory of
Koutsomanoli-Filippaki et al. (
2009), according to which, with reduced risk, banks tend to expand lending or invest in higher-yielding assets to maximize profitability. A decrease in risk (an increase in Z-score) can help banks improve interest income and enhance their return on assets in the short term. Conversely, there is a negative impact of return on assets (ROA) on bank risk at a 1% significance level. This result suggests that banks with higher returns tend to accept higher levels of risk. This can be explained by the fact that high profits enable banks to expand their operations, increase access to capital, and improve their risk tolerance, thereby encouraging them to pursue investment and lending strategies with higher returns but greater risk. Furthermore, good operational efficiency can create overconfidence in management, leading banks to increase their risk tolerance to maximize expected profits in an increasingly competitive environment.
Therefore, changes in a bank’s risk ratio are the cause of changes in its return on assets (ROA). Conversely, changes in profitability are also the cause of changes in bank risk. In other words, when bank risk decreases, it will create an increase in profitability. Conversely, when profitability (ROA) increases, it is the cause of increased risk. This result shows that bank managers must take risks to achieve the desired level of profitability. The research results support hypothesis H2 and the “bad management”, “skimping”, and “moral hazard” of
Berger and DeYoung (
1997). This is similar to
Duho et al. (
2020) and
Abdelaziz et al. (
2022).
In column 3, model (2) of
Table 5 shows that changes in bank risk are the cause of changes in profitability (represented by ROE). Conversely, changes in profitability (ROE) do not affect bank risk. The impact of bank risk on profitability (ROE) is negative at the 1% significance level, meaning that an increase in bank risk (a lower Z-score) will increase profitability (ROE).
Overall, the research results show that the role of risk management differs depending on the profitability measure used. Specifically, ROA reflects the dynamic trade-off relationship between risk and profitability, implying that as banks increase profitability on total assets, they tend to accept a higher level of risk. Conversely, with regard to ROE, banks prioritizing risk control and mitigation often lead to a decline in return on equity. Therefore, banks need to develop flexible risk management strategies tailored to their specific financial objectives, ensuring a balance between profit growth and long-term operational stability.
4.3. Impulse Response Functions and Variance Decompositions Analysis
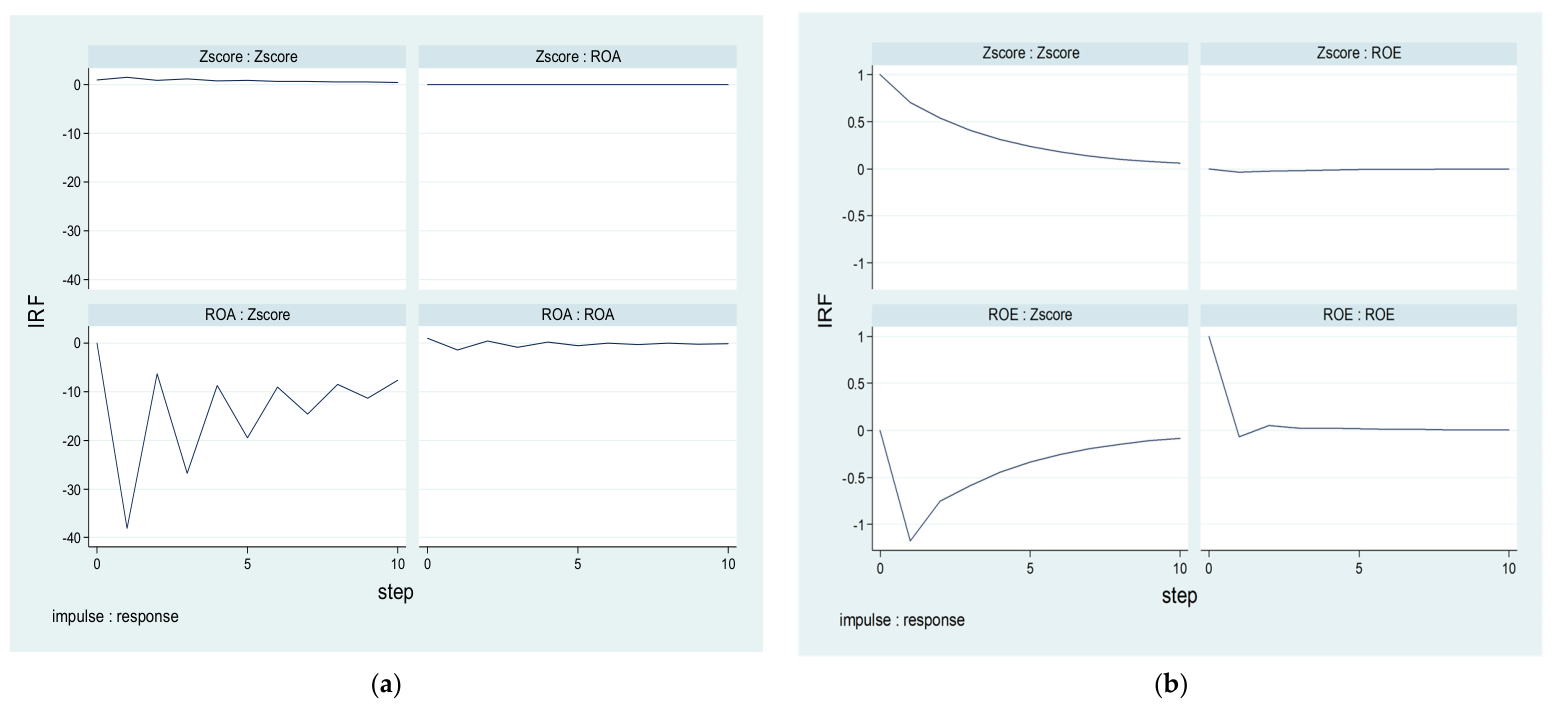
The impulse response functions (IRFs) in
Figure 3 reflect the dynamic relationship between the bank’s profitability (ROA, ROE) and financial stability as measured by the Z-score. Since a higher Z-score indicates greater financial stability and lower bank risk, an increase or decrease in the Z-score can be interpreted as a corresponding decrease or increase in the bank’s financial risk.
In the VAR model of ROA and Z-score in
Figure 3a, the Z-score’s response to a shock to itself remains positive and decreases over time, indicating a degree of financial stability, and shocks to financial stability weaken as the system returns to equilibrium. Notably, the Z-score’s response to ROA shocks is almost negligible and quickly converges to equilibrium, implying that the impact of return on assets on financial stability is relatively limited in the short term. Conversely, the ROA’s response to shocks from the Z-score fluctuates sharply and is mostly negative in the early periods, then fluctuates and gradually stabilizes. This suggests that as a bank increases its financial stability (Z-score increases, risk decreases), its return on assets may decline in the short term. This result reflects the potential trade-off between financial stability and profitability, as banks maintaining higher safety levels often have to limit high-profit but high-risk activities.
For the VAR model between ROE and Z-score in
Figure 3b, the Z-score’s response to shocks from itself is also positive and decreases over time, further demonstrating the persistence of financial stability. Meanwhile, the Z-score’s response to shocks from ROE is almost zero and converges quickly, indicating that the impact of return on equity on financial stability is not significant. Conversely, the ROE’s response to shocks from the Z-score is negative in the short term before gradually returning to equilibrium in subsequent periods. This implies that as the level of financial stability increases and bank risk decreases, return on equity tends to decline in the short term. This result is consistent with the argument that maintaining higher capital adequacy levels and tight risk control can reduce a bank’s ability to generate profits in the short term.
Overall, the impulse response function suggests that the relationship between profitability and financial stability in banks involves a short-term trade-off. Increased financial stability (higher Z-score, lower risk) tends to reduce ROA and ROE in the early periods, while the inverse effect of profitability on financial stability is relatively weak and quickly dissipates. This implies that banks may have to balance the goal of maximizing profits with the goal of maintaining financial safety in their operations. However, since the IRF plots lack statistical confidence intervals, these results should only be considered as suggestive evidence regarding the dynamic impact of variables on the relationship between profitability and risk in the VAR model.
The results of the analysis of variance between profit efficiency (ROA) and risk (Z-score) in
Table 6 (for model estimates: ROA and Z-score) are shown as follows:
The change in profit efficiency (ROA), explained by the change in risk (Z-score), is 0.1% for the first period and more than 13% for the following periods. Thus, the effect of risk on profit efficiency is significant in the following periods. In contrast, the risk (Z-score) change explained by returns is 0.79% for early periods and decreases to nearly 0.45% for subsequent periods.
The research results are presented in
Table 6 (Estimated model: ROE and Z-score) showing that the change in profit efficiency (ROE explained by the risk ratio (Z-score)) is nearly 0.07% in the first period and more than 12% for the following periods. In contrast, the risk change explained by profit efficiency is only more than 2% for all periods.
This implies that the impact of risk on profit efficiency is not instantaneous but lags behind, and the effect becomes more pronounced in the medium and long term. In other words, current risk management decisions may need time to be fully reflected in the bank’s profitability.
Conversely, the explanatory power of profit efficiency on risk is low (around just over 2% for all periods), suggesting that the impact of ROE on the Z-score is limited and less significant. This implies that banks do not significantly adjust risk levels based on fluctuations in profitability.
Overall, the results reinforce the evidence of an asymmetrical relationship between risk and profit efficiency, where risk plays a major role in influencing profit efficiency, especially in the long term. Therefore, banks need to focus on building effective and long-term risk management strategies to sustainably improve ROE instead of just focusing on short-term profit efficiency targets.
This result can be explained by the structural and institutional characteristics of the ASEAN banking system. Specifically, the lagged impact of risk on profit efficiency reflects the cumulative nature of risk, especially in economies dependent on bank credit. Credit risk is often only apparent when loans become non-performing or when economic conditions deteriorate, leading to a more pronounced impact on profitability in the medium and long term (
Berger & DeYoung, 1997;
O’Connell, 2023).
In addition, the uneven application of regulatory standards such as Basel II/III and the limited level of information transparency in some ASEAN countries also contribute to the slow reflection of risk into profit efficiency. This allows banks to maintain ROE in the short term but requires more significant adjustments in the long term as risk accumulates (
Nguyen & Nguyen, 2024;
Lew & Lau, 2022).
Conversely, the weak impact of profit efficiency on risk suggests that ASEAN banks do not significantly adjust their risk appetite based on return fluctuations. This may stem from institutional constraints, such as the role of the central bank or the goal of system stability, as well as capital adequacy regulations that limit flexibility in risk adjustment (
Taib Khan et al., 2025).
In short, the results reinforce the asymmetrical relationship between risk and profit efficiency, where risk plays a leading role, especially in the long term. Therefore, banks need to prioritize long-term risk management strategies to enhance sustainable operational performance.
5. Conclusions and Implications
5.1. Conclusions
The study employs the Panel Vector Autoregression (PVAR) estimation method and the Granger causality test to examine the causal relationship between profit efficiency and bank risk in ASEAN commercial banks. Profit efficiency is proxied by return on assets (ROA), measured as the ratio of net profit to total assets, and return on equity (ROE), measured as the ratio of net profit to total equity. Bank risk is measured using the Z-score index, where a higher Z-score indicates greater financial stability and lower risk.
The empirical findings reveal a significant bidirectional causal relationship between profit efficiency and bank risk within the sample of ASEAN commercial banks. Specifically, the results indicate that: (1) Bank risk significantly affects and alters profit efficiency measured by ROA; and (2) profit efficiency measured by ROA also significantly influences bank risk. However, this bidirectional relationship does not hold for profit efficiency measured by ROE. In particular, changes in ROE do not appear to significantly affect bank risk.
Furthermore, the impulse response function (IRF) and variance decomposition (VDC) analyses suggest that the dynamic relationship between profit efficiency and risk among ASEAN banks is relatively persistent. The results imply several important dynamic effects. First, a decline in bank risk, reflected by an increase in financial stability (higher Z-score), tends to improve profit efficiency measured by ROA. Second, risk reduction (increased financial stability) may simultaneously reduce profit efficiency, as measured by ROE, suggesting a trade-off between financial stability and shareholder returns.
Conversely, an increase in ROA is associated with higher bank risk, indicating that banks pursuing higher profitability may engage in riskier activities. In contrast, changes in ROE do not show a clear relationship with bank risk. These findings highlight the important role of bank management in balancing profitability objectives with risk control and financial stability.
5.2. Theoretical Implications
The results reinforce the trade-off and two-way interaction between risk and profit efficiency, contributing additional empirical evidence to financial and banking theory.
Supporting the hypotheses of “poor management” and cost-efficiency behavior shows that operational profit efficiency and risk are not separate but are influenced by internal governance capabilities.
The study emphasizes the role of bank governance as an important mediating variable, contributing to expanding the analytical framework of operational profit efficiency in the context of emerging markets.
At the same time, the results suggest that diversification strategies and income structure should be considered in relation to risk management, rather than being analyzed in isolation.
5.3. Practical Implications
Banks need to strengthen their risk–return assessment of assets, combined with prudent credit policies to ensure, financial stability.
A balanced business strategy between traditional operations and diversified revenue streams is necessary to improve overall efficiency.
Improving governance capacity, enhancing operational quality, and controlling costs are key factors in minimizing risk.
Banks should aim for proactive and long-term risk management, ensuring both profit maximization and sustainable development.
5.4. Future Research Directions
In the future, research could be expanded in the following directions:
- (i)
Combining qualitative methods with market data to strengthen the practical basis for proposing risk management solutions and measuring profit efficiency using Profit Before Tax or Net Interest Margin (NIM) indicators.
- (ii)
Determining the optimal risk acceptance threshold corresponding to profit efficiency targets, as well as the level of profit at which risk is effectively controlled.
- (iii)
Analyzing the differences in the relationship between profit efficiency and risk across bank sizes (large, medium, and small) to clarify heterogeneity within the system.