1. Introduction
Do overlapping returns make time series momentum look stronger than it really is? Time series momentum (TSM) strategies forecast an asset’s future performance from their own return histories, and they continue to earn positive returns in both academic studies and practical implementations. That such predictable patterns survive in an era of high-frequency trading, rapid information flows and competitive capital markets appears to challenge the efficient markets hypothesis. But if part of the measured TSM signal is a by-product of how returns are constructed, then standard evidence may overstate the extent of genuine return predictability.
The implications are substantial. TSM’s apparent strength underpins a large empirical asset pricing literature and a wide range of active investment strategies, yet part of this strength may be overstated because of a subtle but systematic measurement problem: the overlapping returns bias. A widely used method of constructing returns mechanically induces serial correlation and can make momentum effects appear more persistent and profitable than they truly are. While econometric work has shown that overlapping observations inflate test statistics and can generate spurious predictability, its role as a central driver of measured TSM strength has not been examined in a comprehensive way. If overlapping returns materially amplify TSM, then a sizeable portion of the evidence that supports behavioural or risk-based explanations may, in fact, be a statistical artefact.
This paper asks a simple but fundamental question: to what extent is reported TSM strength, and its widely documented increase with the length of the look-back period, driven by genuine economic dynamics rather than by the mechanics of return construction? To address this question, we examine why TSM appears so strong in the data and identify the factors that drive measured TSM, with particular attention to the systematic upward bias introduced by overlapping returns. The analysis combines an AR(1) framework, simulations and empirical tests in order to separate economic signal from measurement-induced noise.
We first develop a closed-form AR(1) framework that links TSM strength to return autocorrelation, volatility and the look-back horizon, and makes the effect of overlapping versus non-overlapping returns explicit. This provides an analytical benchmark for understanding how serial correlation and volatility propagate through the construction of multi-period returns and how they shape the predictive content of momentum signals.
We then use simulation analysis to study how different look-back periods interact with alternative return calculation methods. By varying the degree of autocorrelation and volatility and comparing overlapping with non-overlapping windows, we quantify the extent to which overlapping returns can inflate measured TSM. This step translates the closed-form expressions into economically interpretable patterns, such as the familiar monotonic increase in TSM strength as look-back horizons lengthen when overlapping returns are used.
Finally, we test the model’s predictions using equity index data from two structurally distinct markets, the United States (S&P 500) and Australia (S&P/ASX 200), over the period 1996 to 2019. These markets differ in size, liquidity and concentration, which allows us to assess whether the impact of overlapping returns and autocorrelation on TSM is a local feature or a persistent property across market environments. The empirical design follows standard TSM implementations, but we systematically compare overlapping and non-overlapping return constructions across look-back horizons.
The findings reveal clear and robust patterns. Return autocorrelation emerges as the dominant driver of measured TSM strength, particularly when overlapping returns are employed. Overlapping windows accumulate serial dependence, producing a strong and almost monotonic increase in TSM strength as the look-back period lengthens. When returns are instead computed on a non-overlapping basis, this pattern weakens or disappears, and TSM strength becomes much less sensitive to the look-back horizon. These results support the theoretical prediction that the widely reported relationship between TSM and look-back length is, to a large extent, a consequence of return-construction mechanics rather than a structural feature of markets.
We also examine the role of volatility. The AR(1) framework implies a negative relation between volatility and TSM strength, since higher volatility reduces the signal-to-noise ratio in returns. The theoretical derivation confirms this intuition, but the empirical evidence shows no statistically significant effect in either the Australian or United States equity markets. Volatility therefore appears to be an unreliable input for constructing TSM signals in practice, even though it enters the theoretical expressions in a systematic way. Together with the dominance of autocorrelation, this result suggests that the way returns are constructed matters more for measured TSM strength than commonly assumed risk-based or volatility-adjusted explanations.
These findings have direct practical implications. Traders and portfolio managers often use overlapping returns to smooth signals, improve statistical power or follow conventions in the literature. Our results show that this practice can materially overstate the strength and robustness of TSM strategies by mechanically inflating autocorrelation, especially at longer look-back horizons. Backtests based on overlapping returns may therefore give an overly optimistic view of expected profitability and resilience of momentum strategies, so careful attention to return construction is essential when designing and evaluating momentum strategies.
The analysis also has important implications for empirical research. Much of the TSM literature relies on overlapping returns and then applies econometric corrections, such as heteroskedasticity- and autocorrelation-consistent (HAC) standard errors or bootstrapping, to address serial correlation. Our results indicate that these techniques treat symptoms rather than the underlying measurement problem. Because overlapping returns can alter both the level and the look-back profile of measured TSM, existing studies may need to be revisited, and future work should report results under both overlapping and non-overlapping constructions.
This study fits into the broad literature documenting TSM across asset classes and markets. Early work showed that past returns predict future returns at intermediate horizons, and subsequent research established that TSM is persistent, globally pervasive and economically significant for asset pricing and portfolio management. Behavioural and risk-based explanations link this persistence to investor underreaction, overreaction, risk-bearing and regime shifts, while more recent contributions emphasise the roles of autocorrelation and econometric design. At the same time, an econometric literature has long recognised that overlapping observations induce moving-average errors, inflate test statistics and can produce spurious predictability, yet overlapping returns remain standard in momentum research, with corrections applied at the estimation stage rather than at the level of return measurement.
Taken together, these observations define the research gap that this paper addresses. Despite long-standing recognition that overlapping observations induce serial correlation and distort inference (
Hansen & Hodrick, 1980;
Lo & MacKinlay, 1988), prior work has treated this as a secondary estimation problem to be corrected at the inference stage rather than as a core driver of measured momentum strength. We bring together the momentum and econometrics literature to provide a comprehensive treatment of overlapping returns as a central measurement bias in TSM. Our contribution is threefold. First, we derive a closed-form expression linking autocorrelation, volatility and the look-back horizon to TSM strength, making explicit how overlapping return construction inflates measured momentum. Second, we use simulations to quantify this inflation and show that the familiar monotonic relationship between look-back length and TSM strength is largely an artefact of overlapping windows. Third, we provide comparative empirical evidence from two structurally distinct equity markets (S&P 500 and S&P/ASX 200), demonstrating that the bias is pervasive rather than market specific. In doing so, the paper reframes the widely observed relationship between look-back horizons and TSM strength as largely a statistical artefact of return construction rather than purely an expression of behavioural or risk-based pricing mechanisms, with direct implications for how theories of return predictability are tested and how momentum strategies are designed and evaluated.
2. Literature Review
2.1. Time Series Momentum: Foundations and Evidence
The empirical study of momentum was pioneered by
Jegadeesh and Titman (
1993), who show that strategies buying past winners and selling past losers generate significant abnormal returns across equities.
Rouwenhorst (
1998) finds that these effects extend internationally, providing early evidence of global momentum. Building on these insights,
Moskowitz et al. (
2012) show that momentum also operates in the time series of individual assets, with past returns predicting their own future performance across global futures markets. This defines time series momentum (TSM) as a distinct anomaly that is conceptually separate from cross-sectional momentum.
Evidence of TSM has since been documented across a wide range of markets and asset classes.
Asness et al. (
2013) highlight time series momentum persistence across international equity indices alongside other asset classes, while
Lim et al. (
2018) document persistent time series momentum in US stocks over nearly a century. In futures markets,
Moskowitz et al. (
2012) document persistence across 58 contracts spanning equity indices, currencies, commodities and bonds, and
Schmid and Wirth (
2021) find that dynamically allocating between time series and cross-sectional strategies improves performance.
Georgopoulou and Wang (
2017) confirm TSM robustness across developed and emerging equity and commodity markets, while
Hambusch et al. (
2015) extend the anomaly to sovereign bonds, underscoring its diversification benefits.
Pitkäjärvi et al. (
2020) document cross-asset time series momentum across bond and equity markets in 20 countries, where past bond returns positively predict future equity returns and past equity returns negatively predict future bond returns.
Further studies provide long-run and multi-asset evidence on TSM.
Hurst et al. (
2017) document persistent profitability across multiple asset classes over long historical samples. Collectively, this literature shows that TSM is a widely documented return predictability pattern with relevance for both empirical asset pricing and quantitative investment strategies.
The persistence of TSM across markets, time periods and asset classes underlines its importance. At the same time, reliance on standard measurement practices motivates closer scrutiny of both the theoretical explanations for TSM and the way momentum is measured.
2.2. Explanations of Time Series Momentum
Several strands of literature seek to explain the persistence of time series momentum. Behavioural theories emphasise investor underreaction and overreaction.
Barberis et al. (
1998) develop a model in which investors underreact to individual news events but overreact to a series of consistent news, generating predictable return patterns.
H. Hong and Stein (
1999) argue that the gradual diffusion of information across heterogeneous investors produces momentum effects, while
Frazzini (
2006) highlights the role of the disposition effect. Extending this perspective,
Gutierrez and Kelley (
2008) document short-horizon return continuation at weekly frequencies, reinforcing the underreaction channel.
Risk-based explanations interpret momentum profits as compensation for bearing systematic risks.
Daniel et al. (
2019) propose a hidden Markov model in which regime shifts and leverage dynamics underpin momentum profitability, with crash risk cited as a vulnerability. Studies of volatility scaling also connect risk dynamics to momentum:
Kim et al. (
2016) and
Wang and Xu (
2015) show that volatility adjustments enhance risk-adjusted performance, suggesting that TSM reflects exposure to time-varying volatility risk premia.
Baltas and Kosowski (
2020) further demonstrate that signal construction and volatility estimators materially affect performance, underscoring the link between methodological refinements and risk-based explanations.
Other research highlights the role of autocorrelation and return persistence.
Lewellen (
2002) shows how positive autocorrelation can help rationalise momentum profits, and
K. J. Hong and Satchell (
2015) extend this insight in a continuous-time setting.
Goyal and Jegadeesh (
2018) provide comparative evidence across cross-sectional and time series strategies, emphasising that econometric features such as serial correlation contribute to measured profitability.
More recently, several studies have questioned the robustness of these explanations.
Ehsani and Linnainmaa (
2022) argue that stock momentum profits largely reflect factor momentum rather than stock-specific predictability.
Huang et al. (
2020) argue that the predictive power of time series momentum is statistically weak and may be largely driven by the static equity premium rather than market timing.
Schmid and Wirth (
2021) find that combining time series and cross-sectional momentum may be superior to either type of momentum in isolation.
Kobinger et al. (
2020) propose reversal-based strategies that counteract standard momentum effects, further challenging purely behavioural or risk-based accounts.
Together, these studies underscore that while behavioural, risk-based and econometric perspectives shed light on different aspects of TSM, no single perspective provides a fully satisfactory explanation.
2.3. Econometric Issues in Momentum Measurement
The econometric implications of using overlapping observations have been recognised for decades.
Hansen and Hodrick (
1980) show that overlapping returns induce MA(h − 1) error structures, where h denotes the length of the overlap. For twelve-month overlapping returns computed monthly, this implies eleven months of induced serial correlation.
Lo and MacKinlay (
1988) demonstrate that this induced autocorrelation inflates test statistics and can generate spurious evidence of predictability, and
Richardson and Smith (
1991) quantify the extent of the resulting bias in standard test statistics. More recent work by
Britten-Jones et al. (
2011) develops improved inference procedures for regressions with overlapping observations, further highlighting the econometric challenges posed by such designs.
Nevertheless, overlapping returns remain standard in the momentum literature.
Moskowitz et al. (
2012), for example, construct signals based on past twelve-month returns, which inherently involve overlapping observations.
Hollstein and Prokopczuk (
2023) continue to use overlapping returns while applying heteroskedasticity- and autocorrelation-consistent (HAC) standard errors as a corrective device.
Dichtl et al. (
2019) show that factor timing profits largely disappear once transaction costs are taken into account, which raises the question of whether initial signals partly reflect artefacts of overlapping data.
Other studies expose further vulnerabilities.
Schmid and Wirth (
2021) show that dynamic allocation between time series and cross-sectional momentum strategies produces very different outcomes depending on how signals are constructed. Machine learning applications may inherit similar issues.
Gu et al. (
2020) rely on return histories that can embed overlapping horizons, so their models risk learning patterns that partly reflect the underlying measurement structure rather than genuine economic signal. More broadly, the application of advanced forecasting methods to financial time series, including recent comparisons of machine learning and traditional approaches (
Nortey et al., 2025), underscores the importance of careful attention to data construction when evaluating predictive performance.
Several factors help explain the continued reliance on overlapping returns: monthly overlapping windows align with institutional rebalancing practices, overlap increases the number of observations and can improve statistical precision, and consistency with prior studies facilitates comparison across results. In response to the induced serial correlation, empirical work has typically adopted econometric adjustments such as HAC standard errors, bootstrapping and out-of-sample validation. These approaches address the consequences of overlap at the inference stage but leave the underlying measurement choice largely unchanged. As a result, overlapping returns remain an important and under-examined measurement issue in empirical TSM research.
2.4. Research Gap
The literature thus demonstrates that time series momentum is a persistent and widely observed anomaly, examined through behavioural, risk-based and econometric perspectives and tested across diverse markets and time periods. However, important gaps remain. First, while
K. J. Hong and Satchell (
2015) provide a theoretical analysis of autocorrelation amplification under overlapping moving-average rules, prior work has not, to our knowledge, derived a closed-form expression for time series momentum strength (as measured by the AR(1)
t-statistic) as a joint function of return autocorrelation, volatility and the look-back horizon in an overlapping-returns setting. Second, although overlapping returns are widely employed, their inflationary impact on measured profitability has not been systematically quantified. Third, empirical validation of this measurement bias across structurally distinct markets remains limited. Existing studies often focus on a single market or asset class and rely on conventions that embed the very bias in question.
This paper addresses these gaps by providing a comprehensive treatment of the overlapping-returns bias in TSM measurement. We derive a closed-form expression in a univariate AR(1) setting that links autocorrelation, volatility and the look-back horizon to TSM strength, quantify the degree of inflation arising from overlapping returns, and present comparative evidence from the United States and Australian equity markets. In doing so, we reframe the observed relationship between look-back horizons and momentum strength as largely a statistical artefact of return construction and highlight the need to correct for this bias, with direct implications for both empirical asset pricing research and quantitative investment practice. Our contribution extends
K. J. Hong and Satchell (
2015) by incorporating volatility into the AR(1) framework, deriving testable predictions for the look-back profile, and providing systematic empirical comparison of overlapping and non-overlapping return constructions across two equity markets.
3. Research Design and AR(1) Framework
This section presents the AR(1) framework used to examine key drivers of time series momentum (TSM), including return autocorrelation, volatility and the length of the look-back period. We first apply a regression-based approach commonly used in the TSM literature and then develop a univariate AR(1) model that links measured TSM strength to these return properties.
3.1. Time Series Predictability of Future Returns
Following
Moskowitz et al. (
2012), we estimate an ordinary least squares (OLS) regression to assess the sensitivity of measured TSM to return autocorrelation, volatility and the length of the look-back period (
lbp):
where
is the return for asset
in period
over the look-back period
lbp,
is the asset’s one-period lagged return, and
is the stochastic error term. To adjust for time-varying return volatility, returns at time
and
are scaled by asset
’s previous period’s volatility
and
, respectively
1. As in
Moskowitz et al. (
2012), we use the
t-statistic of the slope estimate as a measure of TSM strength: a large positive
t-statistic indicates strong return continuation, while a large negative
t-statistic indicates strong return reversal.
3.2. Theoretical Expectations
We expect TSM to increase with return autocorrelation, since higher serial correlation raises the predictive content of past returns. We expect TSM to decrease with volatility, as greater noise weakens the quality of the signal. For the length of the look-back period (lbp), we anticipate a positive association when returns are computed on an overlapping basis, because overlapping windows mechanically amplify autocorrelation and can inflate momentum signals. In contrast, when non-overlapping returns are used, we expect a weaker and less systematic (potentially non-monotonic) relation between look-back length and TSM strength, as this construction avoids the artificial accumulation of autocorrelation.
3.3. Univariate AR(1) Model
To investigate TSM in a theoretical setting, we assume that an asset’s returns follow a stationary first-order autoregressive process (AR(1)) of the form:
where
and
denote the asset’s returns at time
t and
t 1,
captures the first-order return autocorrelation (restricted to
to ensure stationarity), and the error term
is independently and identically distributed with mean zero and variance
.
The choice of an AR(1) framework is motivated by several considerations. First, it is analytically tractable and allows us to derive closed-form expressions for the impact of overlapping returns on measured TSM strength. Second, AR(1) processes approximate the short-horizon autocorrelation structure observed in financial returns reasonably well at the daily and multi-day frequencies we examine. Third, this specification facilitates comparison with prior work that emphasises autocorrelation-based explanations of momentum, such as
K. J. Hong and Satchell (
2015). While actual return processes may exhibit higher-order autocorrelation, conditional heteroskedasticity and non-linearities, the AR(1) setting is sufficient to demonstrate the mechanical effect of overlapping returns on measured momentum, which is our primary objective.
We note that while overlapping returns induce an MA(h − 1) error structure, this moving-average component arises mechanically from aggregating the AR(1) process rather than being modelled explicitly. Extending the framework to an ARMA setting would allow future research to distinguish more clearly between momentum arising from genuine return persistence and momentum generated by the interaction between overlapping aggregation and existing MA dynamics in innovations.
Additionally, the AR(1) model assumes independently and identically distributed innovations with constant variance, which abstracts from volatility clustering, conditional heteroskedasticity and fat-tailed distributions that are commonly observed in financial returns. Overlapping returns can amplify these features, potentially inflating t-statistics even when mean returns are unpredictable. While our simulation evidence is informative under the assumed data-generating process, readers should bear this simplification in mind when interpreting the results.
Remark 1. Under the univariate AR(1) model in Equation (2), an asset’s return over the look-back period lbp for period , denoted , can be expressed as (see Appendix A):where captures the cumulative effect of return autocorrelation over the look-back period window, and is a composite residual given by .
Equation (3) shows how positive autocorrelation propagates into the look-back period return and inflates measured predictability when > 0. In other words, overlapping return windows accumulate autocorrelation, which can exaggerate measured momentum signals when serial dependence is positive. Using Equation (3), an asset’s distribution of can be derived.
Remark 2. Under the univariate AR(1) model in Equation (2), the look-back period return conditional on the lagged return , follows a normal distribution centred on the momentum signal (see Appendix B):where .
Building on the return process in Equation (3) and the distribution in Equation (4), we assess TSM for
using the regression framework in Equation (1). Within the univariate model, this involves examining the
t-statistic on the estimated slope coefficient in the following regression:
where a statistically significant positive
t-statistic indicates return continuation (momentum), while a statistically significant negative
t-statistic indicates return reversal.
As a next step, we derive a closed-form expression for the t-statistic under the AR(1) model. This formulation makes explicit how return autocorrelation and volatility interact to determine measured TSM strength and provides a theoretical benchmark for the simulation and empirical analyses reported in the next section.
4. AR(1) Framework and Simulation Results
This section presents results from the AR(1) framework and simulations.
Section 4.1 derives closed-form expressions, and
Section 4.2 and
Section 4.3 report simulation evidence for overlapping and non-overlapping return constructions.
Section 4.4 summarises the analytical findings.
4.1. Closed-Form Solution
To analyse the sensitivity of measured TSM to several return properties, we derive a closed-form expression for the t-statistic of the slope coefficient in the AR(1) specification of Equation (5).
Proposition 1. In the univariate AR(1) framework, the t-statistic () of the slope estimate, which we use as a measure of TSM strength, can be expressed as (see Appendix C): Proposition 2. Asset return autocorrelation has a positive relation with TSM strength (see Appendix D). Because the square-root term on the right-hand side of Equation (6) is always positive, the sign of the t-statistic is determined by the sign of . A positive produces a positive t-statistic (momentum), while a negative produces a negative t-statistic (reversal). The magnitude of the t-statistic increases with the absolute level of , implying that return continuation (reversal) is stronger (weaker) when the underlying asset return exhibits higher positive (negative) autocorrelation. This result is intuitive but important for implementation, as it highlights that both the sign and the magnitude of autocorrelation matter for the strength of TSM signals.
Proposition 3. Asset return volatility has a negative relation with TSM strength (see Appendix E). In Equation (6), for a given level of autocorrelation (
), higher volatility (
) reduces the magnitude of the
t-statistic, weakening measured momentum effects. Conversely, when volatility is lower, a positive
t-statistic indicates stronger return continuation. This result suggests that heteroskedasticity influences measured TSM and supports the use of volatility-scaling approaches such as that of
Moskowitz et al. (
2012), who scale returns by volatility to improve the reliability of continuation and reversal signals.
4.2. Simulation Results for Overlapping Return Calculations
The closed-form solution for the sensitivity of TSM to the length of the look-back period (
lbp) yields expressions that are analytically complex and less intuitive to interpret directly. To complement the analytical results, we run two sets of simulations that examine how simulated TSM strength varies with autocorrelation and with look-back period under overlapping return constructions. Following
Moskowitz et al. (
2012), we control for cross-sectional heteroskedasticity across assets while varying the degree of return autocorrelation. Unlike Propositions 1–3, which admit closed-form proofs (
Appendix C,
Appendix D and
Appendix E), Propositions 4 and 5 are established through simulation analysis rather than additional closed-form derivations.
In the first simulation, we generate ten simulated asset return series, each with an autocorrelation parameter ranging from 0 to 0.9 in increments of 0.1. Each series has volatility
, and look-back lengths are considered up to 40 lags. These parameter choices span a range that allows us to illustrate how the overlapping-returns bias operates: volatility is held constant to isolate the effect of autocorrelation, while daily equity index returns typically exhibit first-order autocorrelation in the range of 0 to 0.15, with higher values occasionally observed during periods of market stress. The extended range of autocorrelation values (up to 0.9) allows us to illustrate how the overlapping-returns bias intensifies as serial dependence increases.
Table 1 reports the relation between different levels of return autocorrelation
and simulated TSM strength, expressed as the
t-statistic, across look-back lengths of 1–40 periods.
Results in
Table 1 indicate that for lower lag lengths, simulated TSM strength increases monotonically with return autocorrelation. For example, at a lag of one period, the
increases from −0.19 when autocorrelation is zero (
= 0) to 64.85 when
ρ = 0.9. These findings are consistent with Proposition 2 and the expectations outlined in
Section 3.2, providing analytical support of the positive relation between return autocorrelation and TSM.
Table 1 also illustrates the expected rapid decay in TSM at higher lag levels under the AR(1) process.
In the second simulation, we investigate the sensitivity of TSM to the length of the look-back period itself. We generate ten simulated asset return series, each constructed with overlapping return windows of
periods and lag lengths ranging from 1 to 40. For example, when
= 10 the return is based on the past ten periods.
Table 2 reports the relation between these look-back periods and simulated TSM strength, expressed as the
t-statistic, across look-back lengths of 1–40 periods.
The resulting statistics
show very high values at low lags levels. More importantly, and in contrast to the results in
Table 1, for all lag lengths, including very high values, the
t-statistic increases monotonically as the look-back period lengthens. These observations yield two key insights. First, under the assumed parameters and overlapping construction, the look-back period itself is a central driver of TSM: longer look-back periods produce stronger continuation signals, while shorter periods produce weaker signals. Second, even at high lag levels the positive relation between look-back length and TSM strength persists. This implies that, under overlapping returns, the precise choice of lag length is less critical once the look-back period is sufficiently long, as extended look-back horizons are systematically associated with stronger continuation effects.
Proposition 4. The look-back period lbp has a positive relation with TSM when returns are calculated on an overlapping basis. TSM is stronger for longer look-back periods and weaker for shorter look-back periods, regardless of the number of lag periods employed.
These results carry straightforward implications for practice. For short lag horizons, high autocorrelation levels translate into strong TSM effects. More generally, when the look-back period is varied under overlapping returns, TSM strength increases across all lag lengths. Because the positive relation between TSM and the look-back period is central to strategy design, it is important to recognise that these results follow from the standard cumulative return construction based on overlapping observations (
Jegadeesh & Titman, 1993;
Rouwenhorst, 1999).
In this context,
K. J. Hong and Satchell (
2015) analyse the impact of overlapping return calculations on autocorrelation and show that the method amplifies the serial dependence structure. This amplification has direct implications for the interpretation of TSM: merely computing returns on an overlapping basis raises observed autocorrelation, which in turn increases TSM strength, as formalised in Proposition 2.
4.3. Simulation Results for Non-Overlapping Return Calculations
To account for the amplification effect of overlapping return calculations, we extend the simulation analysis by examining TSM sensitivities when returns are calculated on a non-overlapping basis. This approach, although less common in the literature, isolates the role of overlap and allows us to study whether the positive relation between the look-back period and TSM persists once the mechanical accumulation of autocorrelation is removed.
Table 3 reports simulated TSM strength, measured by the
t-statistic
, for ten different look-back periods
with non-overlapping return lengths of
and for lag lengths ranging from 1 to 40. Each look-back period spans
k consecutive, non-overlapping returns. For example, when
, the first return is computed as the average of the three most recent periods, the second return as the average of the next three periods four to six, and so on.
Proposition 5. The look-back period lbp exhibits a non-monotonic relation with TSM when returns are calculated on a non-overlapping basis.
Simulation results in
Table 3 support Proposition 5 and differ sharply from the overlapping return results in
Table 2. For any given lag length, TSM strength is no longer monotonically increasing with the look-back period. This finding is important for two reasons. First, it shows that the positive relation between look-back length and TSM under overlapping returns breaks down once overlapping calculations are removed within the AR(1) framework. The earlier monotonic pattern therefore appears to be driven largely by autocorrelation amplification induced by overlapping returns. Second, this result has direct implications for momentum traders and related strategy design: when returns are computed on a non-overlapping basis, longer look-back periods do not necessarily yield stronger TSM signals or higher expected profits.
Taken together, the contrast between
Table 2 and
Table 3 underscores the central role of return construction. While overlapping returns mechanically amplify autocorrelation and produce a monotonic increase in TSM strength with the look-back period, non-overlapping returns reveal that this pattern does not hold intrinsically within the simulated AR(1) environment. This comparison highlights that part of the persistence attributed to TSM in prior studies may reflect methodological artefacts rather than underlying return dynamics.
4.4. Discussion of AR(1) Framework and Simulation Results
Using a simple univariate AR(1) model, we have investigated the sensitivity of TSM strength with respect to return autocorrelation, volatility, and the look-back period. For overlapping return constructions, the analytical and simulation results indicate that TSM is stronger when autocorrelation is higher, volatility is lower, and the look-back period is longer.
The positive relation between TSM and autocorrelation, as formalised in Proposition 2, is consistent with the expectations in
Section 3.2 and with the analysis of
K. J. Hong and Satchell (
2015), who model single-asset momentum in a log Ornstein–Uhlenbeck setting and highlight the central role of autocorrelation in generating momentum effects. The practical implication is that autocorrelation is a primary determinant of measured TSM strength and should be a central consideration for investors employing TSM-based trading strategies. This conclusion should be interpreted as dominance within the AR(1) model class. Other sources of dependence, such as regime shifts, structural breaks or time-varying risk premia, are intentionally abstracted from and may also contribute to measured momentum.
The negative relation between volatility and TSM, presented in Proposition 3, also aligns with our theoretical expectations. Within the AR(1) framework, higher volatility reduces the signal-to-noise ratio in returns, weakening continuation effects. This supports the argument of
Moskowitz et al. (
2012) that volatility-sensitive estimation techniques can improve the reliability of momentum signals. At the same time, as we show later, the empirical importance of volatility is limited once we move from the model to observed data.
The analysis of the look-back period highlights the influence of return-construction methods. Under overlapping returns, TSM strength increases monotonically with the length of the look-back period, whereas under non-overlapping returns this relationship becomes non-monotonic. This pattern indicates that the commonly documented positive link between look-back length and TSM strength is, to a significant extent, shaped by the mechanics of overlapping return calculations.
Overall, the AR(1) model and simulation results clarify the mechanisms that drive measured TSM strength and emphasise the critical role of return construction. Having established these analytical benchmarks, we now turn to the empirical evidence in
Section 5 to examine whether the patterns predicted by the AR(1) model are present in observed index returns.
5. Empirical Analysis
This section tests the predictions from the univariate AR(1) framework and simulations using observed index returns. We formulate four hypotheses on the roles of autocorrelation, volatility and the look-back period in shaping measured TSM strength and examine them using daily data for the S&P/ASX 200 and S&P 500 indices.
5.1. Hypothesis Formulation and Data
We evaluate the empirical relevance of the AR(1)-based results by formulating four hypotheses:
Hypothesis 1 (H1). Asset return autocorrelation has a positive relation with TSM strength.
Hypothesis 2 (H2). Asset return volatility has a negative relation with TSM strength.
Hypothesis 3 (H3). The look-back period has a positive relation with TSM strength when returns are computed on an overlapping basis.
Hypothesis 4 (H4). When returns are computed on a non-overlapping basis, the relation between the look-back period and TSM strength is weaker and non-monotonic compared with the relation obtained under overlapping returns.
Hypothesis 4 operationalises the prediction from Proposition 5 that, under non-overlapping return constructions, the look-back profile of TSM becomes non-monotonic. We frame H4 in comparative terms, relative to the overlapping case in H3, because the empirical contrast between overlapping and non-overlapping returns is the central focus of our analysis.
To test Hypotheses 1–4, we use return data for the S&P/ASX 200 and S&P 500 indices obtained from Datastream. These markets provide a useful contrast between a relatively small developed market and a large global benchmark, allowing us to assess whether TSM sensitivities are consistent across different market structures. Both indices are widely used in empirical momentum research and have long, reliable price histories. Daily index data for both indices are available from January 1995 to December 2019. Because we construct multi-period returns for look-back horizons of up to 264 trading days, the effective sample used in the empirical analysis runs from 1996 to 2019. This sample spans several distinct market regimes, including the dot-com boom and bust, the global financial crisis and the subsequent recovery, providing a varied backdrop for assessing the behaviour of time series momentum.
Index prices are converted to continuously compounded returns. Following the standard TSM literature, we construct overlapping and non-overlapping returns, computed as the mean daily log return over look-back horizons ranging from one day to twelve months. For each horizon, we compute TSM strength as the
t-statistic on the slope coefficient from regressions of current multi-period returns on their own lags, in line with the AR(1) framework in
Section 3. In all empirical regressions, we include an intercept term to allow for non-zero mean returns. For daily returns with near-zero means, this has negligible impact on the slope estimates and
t-statistics. Overlapping returns provide more observations but mechanically induce serial correlation, whereas non-overlapping returns yield fewer observations that are closer to being independent, making the choice of construction an integral part of the empirical design.
Table 4 reports descriptive statistics for overlapping and non-overlapping returns for both indices across the set of look-back horizons. The table highlights clear differences in autocorrelation patterns between overlapping and non-overlapping constructions, with overlapping returns displaying markedly higher serial correlation, particularly at longer look-back periods. These patterns are consistent with the amplification mechanism emphasised in
Section 4.
5.2. Test of Hypothesis 1
Hypothesis 1 (H1) states that asset return autocorrelation has a positive relation with TSM strength. To test this empirically, we construct an annual time series of TSM strength and return autocorrelation for each index. For each calendar year from 1996 to 2019, we compute daily log returns as the natural logarithm of the ratio of a given day’s index level to the preceding day’s index level and estimate the AR(1) regression in Equation (2) separately for each index and year. Following
Moskowitz et al. (
2012), we take the
t-statistic for the AR(1) slope coefficient for each of the 24 years in the sample as our measure of TSM strength, with larger positive values indicating stronger return continuation. We use the estimated AR(1) slope coefficient from each yearly regression as a measure of the annual first-order autocorrelation of daily returns.
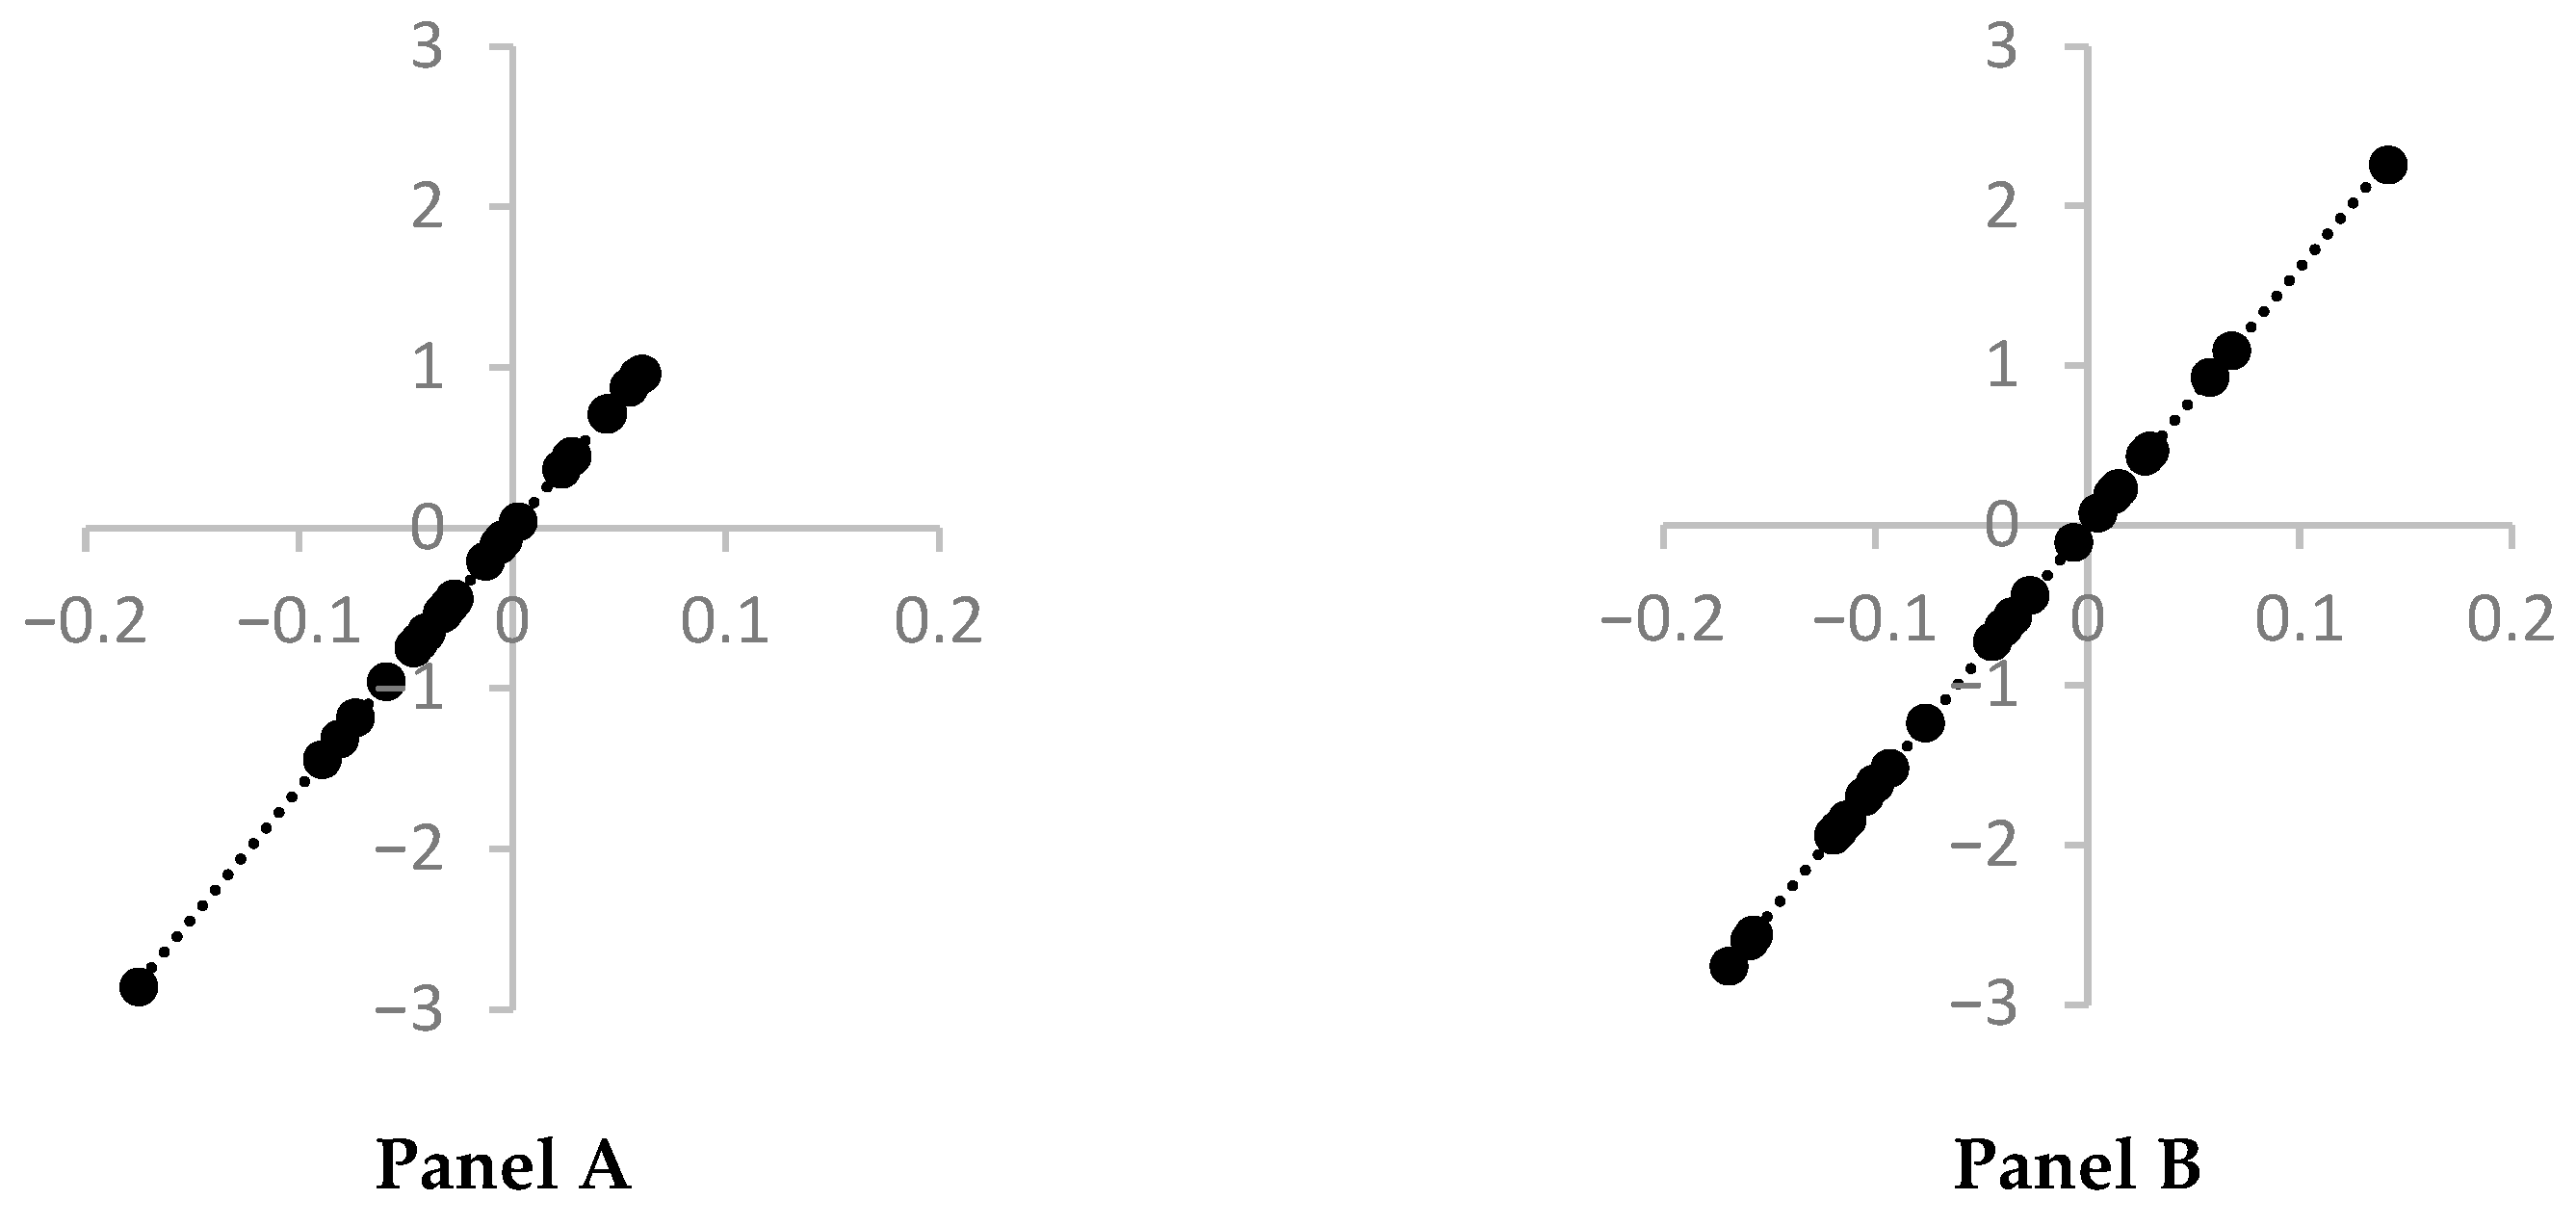
Figure 1 plots annual TSM strength (vertical axis) against annual return autocorrelation (horizontal axis) for the ASX 200 (Panel A) and the S&P 500 (Panel B).
Figure 1 shows a clear positive relation between return autocorrelation
and TSM strength in both markets: years with higher estimated AR(1) coefficients tend to exhibit larger TSM
t-statistics, and the fitted regression line is very steep. This pattern is partly mechanical, since the
t-statistic on the AR(1) coefficient is, by construction, proportional to the coefficient when standard errors are similar across years. The key empirical observation is that the AR(1) slope estimates themselves vary substantially over time, and this variation maps directly into variation in measured TSM strength. Taken together, the evidence supports H1 and is consistent with Proposition 2, which states that TSM is stronger when return autocorrelation is higher.
5.3. Test of Hypothesis 2
Hypothesis 2 (H2) states that asset return volatility has a negative relation with TSM strength. To test this, we construct an annual time series of return volatility and TSM strength for each index. For each calendar year from 1996 to 2019, we compute return volatility as the standard deviation of daily log returns and use the annual TSM
t-statistics from the AR(1) coefficient estimates obtained in the test of Hypothesis 1. This yields 24 annual observations per index.
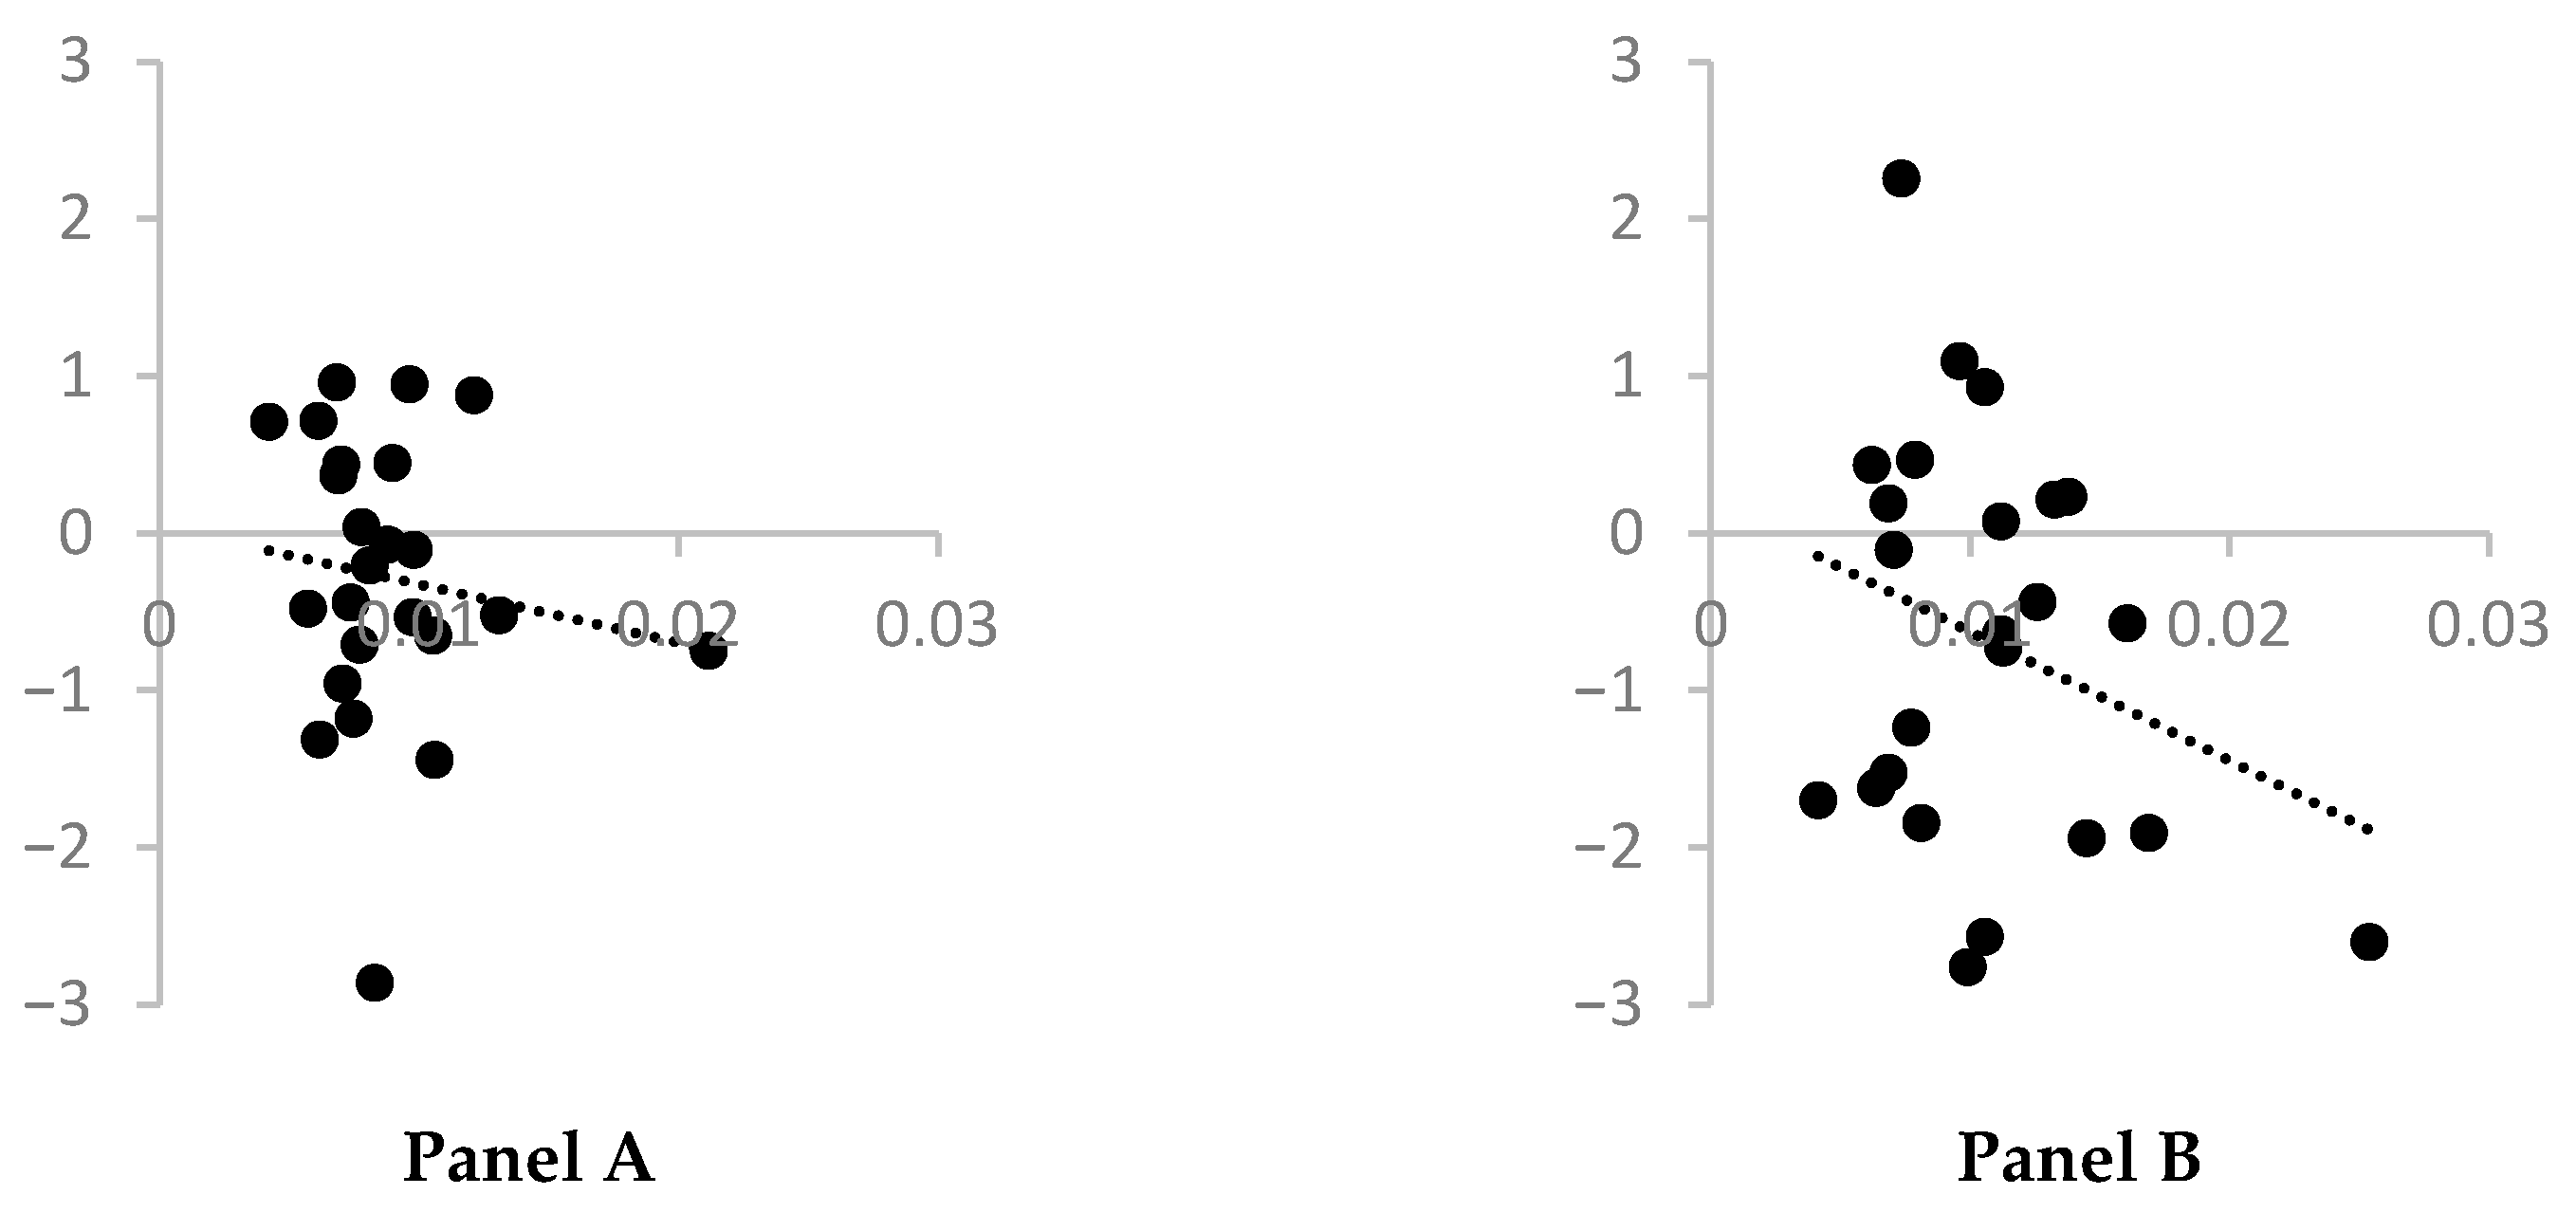
Figure 2 plots annual TSM strength (vertical axis) against return volatility (horizontal axis) for the ASX 200 (Panel A) and the S&P 500 (Panel B).
Figure 2 shows negative relations between the return standard deviation and TSM strength in both the Australian market (Panel A) and the U.S. market (Panel B), consistent with the theoretical prediction from the AR(1) framework. However, return volatility lacks statistically significant explanatory power in either market. For the ASX 200, the
t-statistic on volatility is −0.64 (
p = 0.53), while for the S&P 500 it is −1.40 (
p = 0.17). Thus, although higher volatility is associated with weaker TSM strength in both markets, the estimates are imprecise and we cannot reject the null of no effect.
The consistent negative sign across the two indices suggests that volatility behaves in line with our theoretical expectations, but the evidence is weak. The lack of statistical significance may reflect limited statistical power with 24 annual observations, or it may indicate that the relationship between volatility and momentum is more complex than captured by our linear specification. For practitioners, this suggests that while volatility should not be ignored in momentum strategy design, it may be a less reliable predictor of momentum strength than autocorrelation or look-back period length. Overall, we view the evidence on H2 as suggestive rather than conclusive.
5.4. Test of Hypothesis 3
Hypothesis 3 (H3) states that, when returns are computed on an overlapping basis, longer look-back periods are associated with stronger TSM. To test this, we examine how TSM strength varies with the length of the look-back horizon for each index when overlapping returns are used.
Using the 1996–2019 sample described above, we construct overlapping multi-day returns for 16 look-back horizons ranging from very short to approximately one year: one day, one week, two weeks, three weeks, and 12 monthly intervals from one to twelve months. For each look-back horizon, we estimate the AR(1) regression in Equation (2) on the corresponding overlapping return series for the full sample and record the
t-statistic on the AR(1) slope coefficient as our measure of TSM strength. In these regressions, we regress the current multi-period return on its one-period lag, where “one period” refers to one observation in the constructed return series. For overlapping returns computed from daily data, this corresponds to a one-day lag, so the dependent and independent variables share
overlapping daily observations, which mechanically induces serial correlation. The resulting 16 TSM
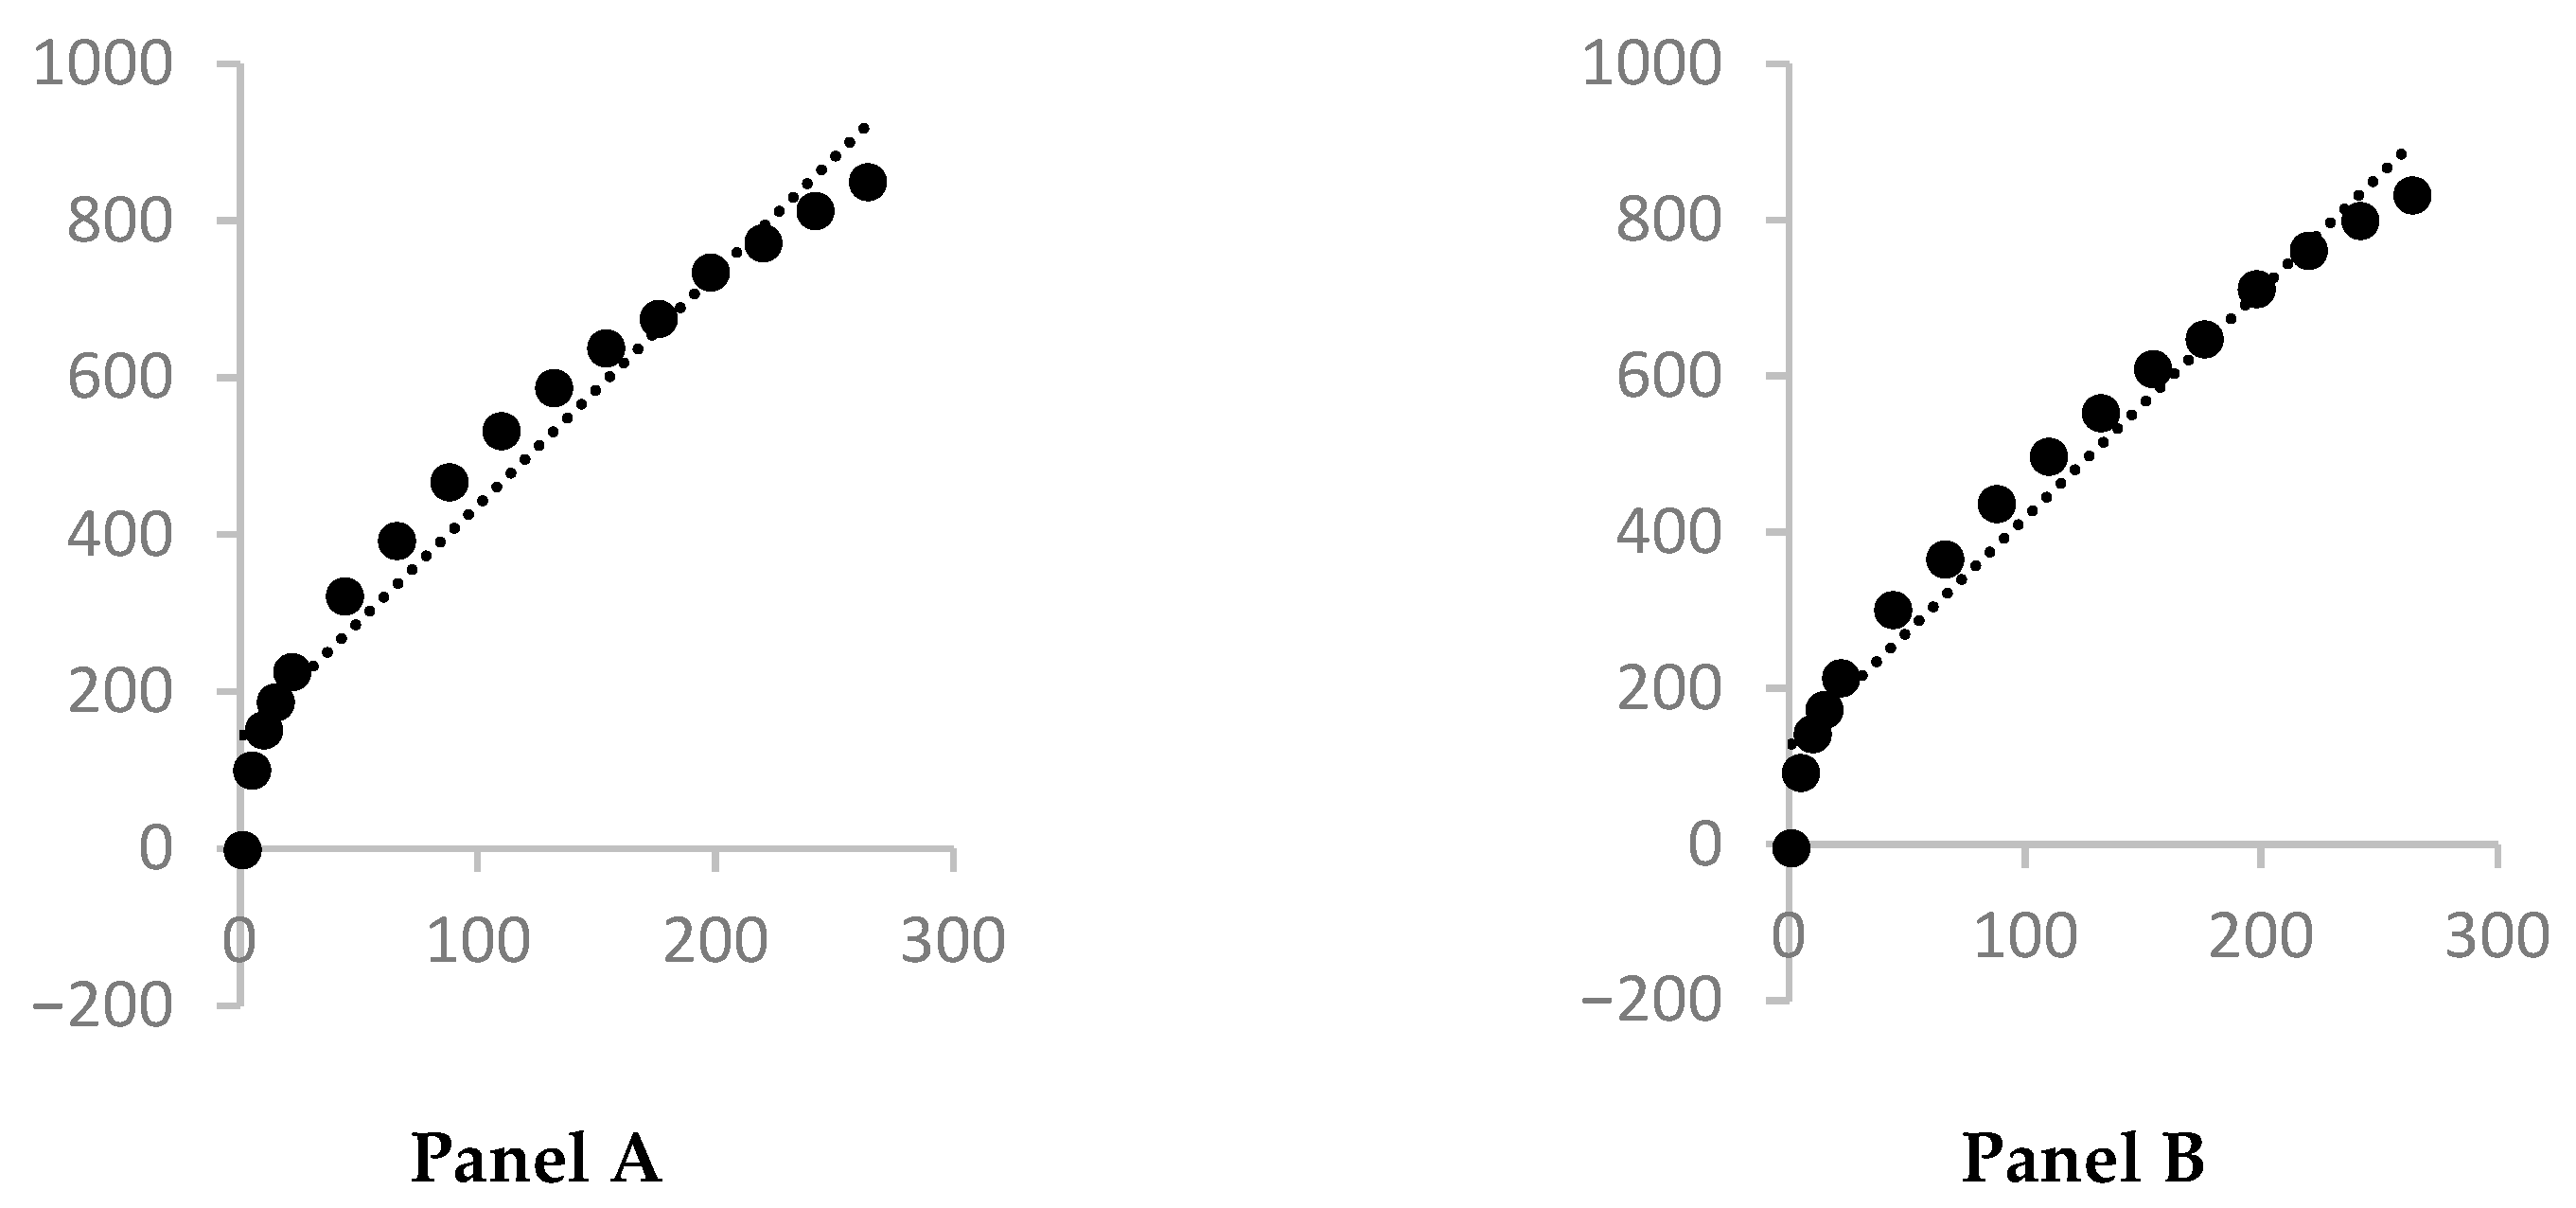
t-statistics are plotted in
Figure 3 as a function of the look-back period, expressed in trading days, for the ASX 200 (Panel A) and the S&P 500 (Panel B).
Panels A and B illustrate a clear positive relation between the look-back period and TSM strength for both the ASX 200 and S&P 500. For the ASX 200 (Panel A), this relation is statistically significant (t-statistic = 17.11, p < 0.01). The S&P 500 (Panel B) shows a similarly strong and positive association at the 1% significance level. These findings support H3 and are consistent with Proposition 4, indicating that longer look-back periods amplify measured TSM strength when overlapping return computations are used.
From a practical perspective, the results suggest that momentum traders relying on overlapping returns should be aware that longer look-back horizons mechanically increase measured continuation effects, which may overstate the true predictive strength of TSM signals.
5.5. Test of Hypothesis 4
Hypothesis 4 (H4) states that the length of the look-back period has a weaker and non-monotonic relation with TSM strength when returns are computed on a non-overlapping basis than when returns are computed on an overlapping basis. To test this, we repeat the analysis of Hypothesis 3 using non-overlapping, rather than overlapping, return computations.
Using the 1996–2019 sample, we construct non-overlapping multi-day returns for the same 16 look-back horizons as before: one day, one week, two weeks, three weeks, and 12 monthly intervals from one to twelve months. For each look-back horizon, we estimate the AR(1) regression in Equation (2) on the corresponding non-overlapping return series for the full sample and record the
t-statistic on the AR(1) slope coefficient as our measure of TSM strength.
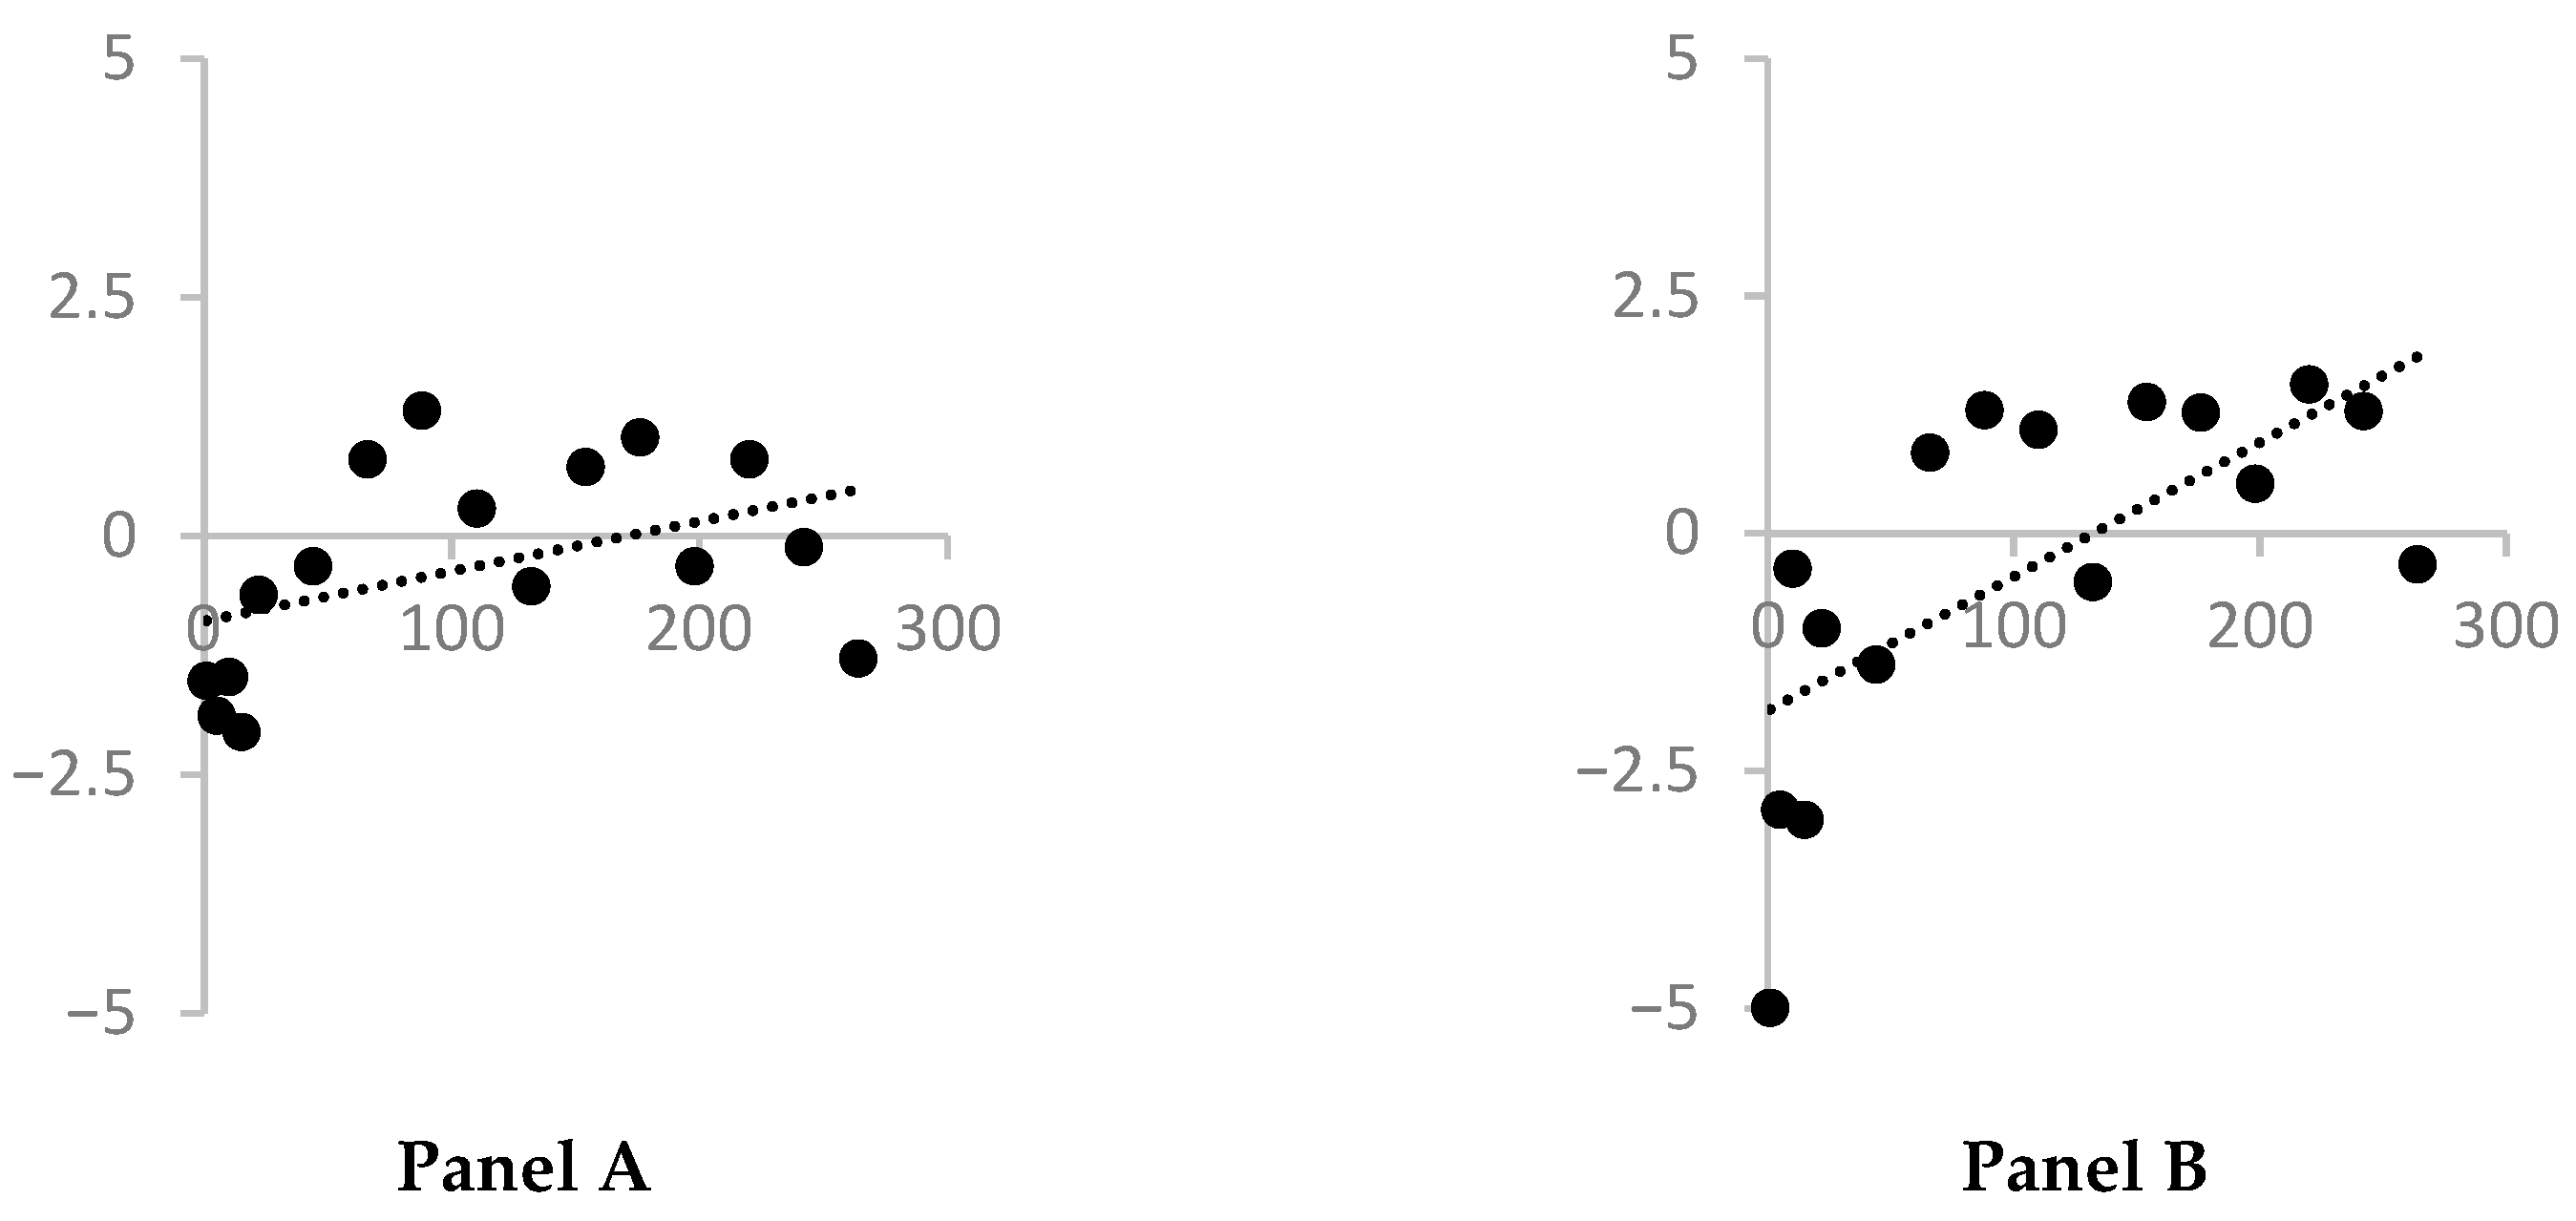
Figure 4 plots these TSM
t-statistics as a function of the look-back period, expressed in trading days, for the ASX 200 (Panel A) and the S&P 500 (Panel B).
The relation between the look-back period and TSM strength shown in
Figure 4 is positive but not monotonic, and it is visibly weaker than under overlapping return computations in
Figure 3. For the ASX 200 (Panel A), a
t-test yields a
t-statistic of 1.81 (
p = 0.09), indicating a marginal and statistically insignificant positive association. For the S&P 500 (Panel B), the relation remains statistically significant at the 1% level, though the pattern is less monotonic than under overlapping returns. This suggests that while non-overlapping returns reduce the strength of the look-back effect, they do not eliminate it entirely in the larger, more liquid U.S. market.
The persistence of a significant (though attenuated) relationship in the S&P 500 suggests that some degree of look-back sensitivity may reflect genuine return dynamics rather than purely measurement artefact. Nevertheless, the contrast between the strong monotonic pattern under overlapping returns and the weaker, non-monotonic pattern under non-overlapping returns supports the conclusion that a substantial portion of the documented look-back effect is driven by return-construction mechanics rather than economic fundamentals. Overall, the results partially support H4: the dependence of TSM strength on the look-back period is weaker and non-monotonic when returns are computed on a non-overlapping basis, in contrast to the stronger, monotonic pattern under overlapping returns. This weaker and non-monotonic empirical pattern is consistent with Proposition 5, which predicts a non-monotonic look-back profile for TSM under non-overlapping return constructions.
The S&P 500 result warrants further consideration. That a significant positive relationship persists even under non-overlapping returns suggests that some portion of measured momentum in the U.S. market may reflect real economic forces rather than purely statistical artefact. Several mechanisms could underpin this residual momentum. Market microstructure effects, such as non-synchronous trading, can induce short-horizon autocorrelation that persists under aggregation. Macroeconomic cycles and associated shifts in risk premia may generate medium-horizon return predictability that is robust to return construction choices. Additionally, the depth and liquidity of the U.S. equity market may allow momentum signals to persist longer before being arbitraged away. Disentangling these potential sources of genuine momentum from residual measurement effects remains an important avenue for future research.
A methodological consideration is the bias-power trade-off inherent in the choice between overlapping and non-overlapping returns. While non-overlapping returns reduce the measurement bias documented in this study, they also sharply reduce the number of independent observations, which diminishes statistical power. For instance, the marginally insignificant result for the ASX 200 under non-overlapping returns (p = 0.09) may reflect not only weaker genuine momentum but also reduced ability to detect a true effect with fewer observations. Conversely, the S&P 500’s significant result under non-overlapping returns could stem partly from its longer sample of tradeable days or from stronger underlying momentum dynamics. Researchers and practitioners must therefore weigh the benefit of reduced bias against the cost of lower power when selecting return construction methods. Insignificant results under non-overlapping returns should be interpreted with appropriate caution.
5.6. Summary of Empirical Findings
Overall, the empirical tests of Hypotheses 1–4 provide strong support for the AR(1) framework developed in
Section 4 with respect to autocorrelation and the impact of overlapping versus non-overlapping look-back periods, while offering weaker evidence for the volatility channel.
First, the relationship between TSM strength and look-back period depends critically on the return computation method. The strong monotonic pattern documented in the literature using overlapping returns (H3: supported) becomes substantially weaker and non-monotonic with non-overlapping returns (H4: partially supported). This confirms that much of the perceived look-back period effect is mechanical rather than economic.
Second, autocorrelation emerges as the primary driver of momentum effects, showing the predicted positive relationship with TSM (H1: supported). In contrast, volatility’s theoretically negative relationship, while correctly signed in both markets, lacks statistical significance (H2: directionally consistent but not statistically significant), suggesting that volatility’s role in momentum may be more complex than linear models capture or may require larger samples to detect.
Third, these patterns hold consistently across both United States and Australian markets despite their structural differences, indicating that the overlapping returns effect represents a general measurement issue rather than a market-specific phenomenon.
For practitioners, these findings carry an important warning: backtesting with overlapping returns may substantially overstate expected momentum profits. The choice between overlapping and non-overlapping return calculations is not merely a technical detail but fundamentally affects measured strategy performance. Traders designing TSM-based strategies should recognise that overlapping computations can inflate apparent autocorrelation, potentially leading to overly optimistic expectations and inadequate risk management.
6. Conclusions
Motivated by the ongoing debate in the literature and the continuing importance of time series momentum (TSM) as a market anomaly for investors worldwide, this study examines how key return characteristics shape measured TSM strength. We focus on the roles of return autocorrelation, return volatility, the length of the look-back period, and the choice between overlapping and non-overlapping return constructions.
Our analysis proceeds in two stages. First, we develop an AR(1) framework, inspired by
Moskowitz et al. (
2012), that links TSM strength to return autocorrelation, volatility and the look-back horizon in closed form, and we use simulations to examine how overlapping versus non-overlapping return computations affect the look-back profile of TSM. Second, we test these predictions empirically using daily S&P 500 and S&P/ASX 200 index data over the period 1996 to 2019.
Three main findings emerge. First, return autocorrelation emerges as the dominant driver of TSM strength. Both the AR(1) framework and the empirical results for Australia and the United States show a strong positive relation between TSM and return autocorrelation, consistent with the view that serial dependence in returns underpins continuation effects.
Second, the method used to construct returns plays a central role in shaping the relation between look-back period and TSM. When overlapping returns are used, longer look-back periods mechanically increase measured TSM strength and produce the familiar monotonic pattern widely reported in the literature. Under non-overlapping return computations, this positive relation weakens and becomes non-monotonic, as the autocorrelation amplification inherent in overlapping constructions is removed. The empirical evidence from both markets aligns closely with these predictions, indicating that much of the observed look-back effect is driven by return-construction mechanics rather than purely by economic structure.
Third, the AR(1) framework predicts a negative relation between volatility and TSM strength, reflecting the idea that higher volatility lowers the signal-to-noise ratio in returns. In the data, this relationship is correctly signed in both markets but not statistically significant at conventional levels, suggesting that volatility is a secondary and empirically fragile determinant of TSM strength in our setting. This pattern may reflect limited power with annual observations or a more complex role for volatility than is captured by a simple linear specification.
Finally, the analysis of non-overlapping returns shows that while a weak positive association between look-back period and TSM sometimes persists, the relationship is no longer consistently increasing. Together with the strong contrast with overlapping returns, this supports the conclusion that overlapping return calculations can inflate apparent autocorrelation and overstate the persistence of TSM signals. Our results therefore do not negate the existence of time series momentum, but they do show that its measured strength is highly sensitive to return-construction choices. For investors, the choice between overlapping and non-overlapping return constructions is not a minor technical detail but a key design decision that materially affects backtested performance and the perceived robustness of momentum-based trading strategies.
A few limitations should be noted. First, we focus on broad equity indices rather than individual securities, so the patterns we document may differ from those observed at the stock level or in other asset classes. Second, our sample period, while spanning multiple market cycles between the mid-1990s and 2019, reflects a particular era of market structure and regulation and may not generalise to earlier or future environments. Third, we abstract from implementation frictions such as transaction costs, market impact and margin requirements, and we implicitly assume that strategies can be implemented at (or close to) a daily frequency. Fourth, the analysis abstracts from deterministic seasonal patterns in returns, such as monthly, quarterly or annual seasonality. Because overlapping return constructions mechanically align observations to calendar time, seasonal effects may be embedded within cumulative return measures and interpreted as autocorrelation-driven momentum. Prior research documents that momentum profitability varies systematically across calendar months and fiscal periods. Incorporating seasonal controls or using seasonally adjusted returns would help to disentangle pure autocorrelation effects from calendar-based regularities, and we leave this extension to future work. Fifth, the theoretical results are derived under stationarity and implicitly rely on large-sample properties. However, overlapping returns reduce the effective number of independent observations, and this can interact with near-white-noise return processes to produce apparent predictability in finite samples. Some of the observed inflation in TSM strength may therefore reflect small-sample distortions rather than structural predictability. Future work could examine effective sample size adjustments and finite-sample bias corrections to provide more precise inference.
These simplifications suggest some caution in directly translating our results into specific trading rules, but they do not diminish the central message that return-construction choices can materially affect measured TSM strength.
Future research could extend this analysis by exploring richer autocorrelation structures (such as higher-order or regime-dependent processes), additional asset classes and higher-frequency data, or by embedding the overlapping-returns bias within more complex econometric and machine learning frameworks. Investigating how alternative volatility measures, dynamic risk modelling and bias-adjusted test statistics for overlap-induced autocorrelation affect TSM signals and other return predictors across markets would also help to clarify when, and to what extent, momentum and related anomalies are sensitive to return-construction choices.