Abstract
This paper investigates Bitcoin’s resilience against the U.S. dollar—widely recognized as the global reserve currency—by applying a multi-method wavelet analysis framework to daily price data of Bitcoin, the USD strength index (DXY), the euro, and other assets ranging from August 2015 to June 2024. Quantitative measures—particularly the Frobenius norm of wavelet coherence and an exponential decay phase-weighting scheme—reveal that Bitcoin’s out-of-phase relationship with the dollar is lower and more sporadic than that of mainstream assets, indicating it is not tightly governed by dollar fluctuations. Even after controlling for the euro’s dominant influence in the DXY, BTC continues to show weaker coupling than mainstream assets—reinforcing the idea that it may serve as a partial hedge against dollar-driven volatility. These results support the hypothesis that Bitcoin may serve as a resilient store of value and hedge against dollar-driven market volatility, placing Bitcoin within the broader debate on global monetary frameworks. As global monetary conditions evolve, the resilience of Bitcoin (BTC) relative to the world’s leading reserve currency—the U.S. dollar—has significant implications for both investors and policymakers.
JEL Classification:
G11; G15; E44; E52
1. Introduction
According to mainstream and heterodox economic theories—such as Austrian economics and modern monetary theory—Bitcoin (BTC) is not considered money and theoretically should not function as such (Kubát, 2015; Wray, 2024; Mises, 1953). Nevertheless, El Salvador’s adoption of BTC as legal tender reignited debates regarding its monetary properties. This echoes historical precedents, notably gold serving as a global reserve currency, an analogy recently revisited academically (Benigno et al., 2022).
Despite global challenges, the USD retains its position as the world’s dominant reserve currency, supported by its role in trade invoicing, international lending, and safe assets—collectively termed the “dollar trinity” (Bertaut et al., 2023; Goldberg et al., 2022). The USD’s unique global role introduces complexities beyond domestic economic fundamentals, significantly shaping global financial cycles and commodity pricing (Georgiadis et al., 2023). Thus, assessing BTC’s resilience to USD fluctuations, as represented by the ICE U.S. dollar index (DXY), becomes critical for evaluating its viability as a monetary asset and hedge against currency risk.
Early research described BTC primarily as speculative or risky (Dyhrberg, 2016a; Baur et al., 2018). More recent work has shown significant coherence between BTC and systematic risk factors (Al-Mansouri et al., 2025). Despite extensive studies on BTC’s price behavior, many rely on datasets that precede current market developments—such as the post-2016 expansion, the COVID-19 pandemic, and new regulatory changes (Baur et al., 2018; Kang et al., 2020). Early findings tended to focus on BTC’s hedging capabilities vis-à-vis commodities and equities (Bouri et al., 2017b), or on its dynamic interlinkages with foreign exchange through Granger causality tests (Mokni & Ajmi, 2021). Related research has employed fractal or complexity-based methods (Zitis et al., 2023), often concentrating on BTC’s market disruptions rather than its persistent co-movements.
In parallel, comprehensive examinations of BTC’s tie to the U.S. dollar—particularly via the ICE U.S. dollar index (DXY)—remain markedly limited. Some studies would treat the DXY as an asset class in analysis (e.g., Ahmadova et al., 2024; Kang et al., 2020; Bhuiyan et al., 2021), yet analyzing the DXY as an asset class may be an oversimplification since it is hardly an asset capable of ownership per se. This literature scarcity is noteworthy, given the dollar’s dominant reserve-currency role and the critical importance of currency volatility for global investors and policymakers (Georgiadis et al., 2023; Bertaut et al., 2023).
Motivated by these gaps, this study analyzes BTC’s resilience relative to the USD. Rather than focusing solely on whether BTC is a short-term hedge or safe haven (Dyhrberg, 2016b; Kang et al., 2020), this study concentrates on BTC’s ability to maintain comparatively low or inconsistent coherence with the DXY over multiple time scales—an approach this research terms “resilience”. Such resilience is crucial for participants seeking to diversify against exchange-rate fluctuations, and for regulators evaluating the integration of cryptocurrencies into the broader financial system. Indeed, if BTC persists in demonstrating weaker coherence with USD-driven market dynamics (Mokni & Ajmi, 2021), it may offer distinctive diversification benefits beyond what conventional “strong-dollar, weak-asset” logic suggests.
Leveraging an advanced wavelet coherence literature (Bhuiyan et al., 2021; Zitis et al., 2023; Disli et al., 2021), this study addresses two central research questions. First, what are the time–frequency characteristics of the DXY itself? By analyzing the wavelet power spectrum (WPS) for the DXY, a “volatility heatmap” is established that pinpoints periods of pronounced dollar strength or weakness.
Second, is BTC actually resilient to USD movements, or does it follow the conventional inverse pattern typical of USD-priced assets (Clements & Fry, 2008)? This question builds on the link revealed in the literature between BTC and the DXY (Baur et al., 2018; Mokni & Ajmi, 2021; Zitis et al., 2023), an integral part of the central hypothesis of this research. Under standard “strong-dollar, weak-asset” reasoning, one would expect pronounced inverse coherence. However, BTC’s distinctive market and investor profiles (Celeste et al., 2020; Bouri et al., 2017b) raise the alternative hypothesis that it may exhibit lower or inconsistent coherence.
The hypothesis of this study draws on classical economic theories, particularly purchasing power parity (PPP), empirical relationships between BTC and the DXY (Baur et al., 2018; Mokni & Ajmi, 2021; Zitis et al., 2023), and empirical evidence indicating that USD-priced assets generally exhibit inverse coherence with the dollar (Clements & Fry, 2008). If BTC aligns with these conventional asset dynamics, it should demonstrate substantial inverse coherence. However, given BTC’s unique market dynamics and investor profiles (Celeste et al., 2020; Bouri et al., 2017b), the alternative hypothesis is that BTC may exhibit comparatively low coherence and inconsistent phase relationships with the DXY. This study employs validated wavelet coherence methods (Al-Mansouri et al., 2025), including quantitative metrics such as the Frobenius norm and exponential decay phase weighting, to rigorously assess this relationship. Evidence supporting lower or inconsistent coherence would strengthen claims of BTC’s resilience, highlighting its distinctiveness as a diversification and hedging asset.
This study analyzes daily price data from 13 August 2015 to 29 June 2024, covering BTC, DXY, major asset indices (S&P GSCI for commodities, Europe Brent Spot Price for oil, Gold Bullion, Dow Jones Global Index [DJGI], and Ethereum [ETH]), and the EUR/USD exchange rate. BTC occupies a unique role as a digital monetary asset potentially distinct from traditional currencies or commodities, making it particularly suitable for analysis against the DXY. Comparing BTC with the DXY, its core component (the EUR/USD pair), and mainstream asset classes enables a robust evaluation of BTC’s resilience relative to established global benchmarks.
While local factors such as inflation and domestic demand affect most currencies, the global reserve status of the U.S. dollar often overrides strictly national considerations—as cross-border capital flows, safe-haven preferences, and the widespread use of the dollar in debt and trade drive the DXY in response to worldwide financial conditions. Emphasizing ICE’s market-driven DXY (as opposed to the broader, trade-weighted Fed USD strength indices) allows the dataset to capture the interplay between domestic fundamentals and international capital flows. This focus reflects the prominence of capital markets over trade flows in shaping exchange rates, as well as the fact that global monetary policies remain tightly intertwined with the dollar’s influence.
This study employs a comprehensive, multi-method wavelet analysis to investigate BTC’s resilience against the DXY. Initially, a WPS heatmap of the DXY provides a detailed volatility profile across various time and frequency scales, establishing the contextual background for further analyses. Subsequently, the wavelet coherence (WTC) is computed between BTC and DXY and the analysis extended to other asset classes (commodities, equities, ETH) to benchmark BTC’s dynamics against conventional “strong-dollar, weak-asset” expectations.
Recognizing the significant euro weighting within the DXY, partial wavelet coherence (PWC) is applied to control for EUR/USD influences and multivariate wavelet coherence (MWC) to capture joint interactions among BTC, DXY, and EUR/USD, providing deeper insights into underlying currency dynamics.
By integrating visual analyses (wavelet heatmaps) with quantitative measures (matrix norms, weighted phase metrics), the methodology comprehensively evaluates whether BTC deviates from typical USD-priced asset behavior, contributing valuable insights into its potential as a store of value and a hedge against global currency volatility.
This study improves upon earlier analyses in several ways. First, this study exploits a broader dataset spanning August 2015 to June 2024, thus capturing vital post-2016 developments, the peak of the COVID-19 pandemic, and ongoing regulatory shifts. Second, this study incorporates partial and multivariate wavelet coherence (PWC, MWC) to account for the influential role of EUR/USD within the DXY composition, a nuance sometimes overlooked (e.g., Baur et al., 2018). Third, this study adopts exponential decay phase weighting and Frobenius norm analysis to systematically test coherence magnitude, thereby decomposing BTC’s risk profile more granularly than standard volatility (GARCH) or fractal-based (Zitis et al., 2023) approaches.
The empirical results of this study reveal that BTC manifests significantly lower and more sporadic coherence with the DXY than typical USD-priced assets. Such “weaker-than-expected” correlation underscores that BTC may not simply behave like conventional assets under a “strong dollar → falling asset” paradigm. This outcome aligns partly with earlier hints (Baur et al., 2018; Bhuiyan et al., 2021) that BTC–DXY linkages can be fragile and time-dependent. Yet this study broadens these findings into the post-COVID era, reinforcing BTC’s potential resilience to the dollar. Moreover, the wavelet-based framework decomposes these co-movements by frequency, showing that BTC’s inverse reactions to USD strengthening are neither uniform nor persistent. These conclusions—distinct from the “hedge or safe haven” lens of Kang et al. (2020) or the fractal analyses in Zitis et al. (2023)—cement BTC’s evolving role as an alternative store of value with intermittent decoupling from USD pressure.
The results suggest that BTC’s lower or inconsistent inverse correlation with the USD may improve diversification or hedging benefits against currency risk in portfolio management. In practical terms, investors seeking to dampen dollar-driven volatility might incorporate BTC, especially if they anticipate “strong-dollar” phases that weigh heavily on other USD-priced assets. For policymakers, these findings highlight that BTC—though not a classical “safe haven” nor a standard currency—can still affect global markets. As additional jurisdictions (e.g., El Salvador) explore deeper BTC integration, regulatory bodies should note that BTC’s partial resilience to USD fluctuations can reconfigure capital flows and risk exposures. Tailoring frameworks that allow for BTC’s safe and effective integration into financial systems—without compromising monetary or financial stability—remains crucial. In this sense, this study complements earlier GARCH and cointegration works by presenting robust wavelet-based evidence that BTC’s “resilient” behavior toward the DXY warrants serious consideration in both private investment strategies and regulatory architectures.
The remainder of this paper is structured as follows: Section 2 reviews the relevant literature, outlining key theoretical and empirical contributions on Bitcoin, global reserve currencies, and exchange rate dynamics. Section 3 details the data sources and methodology, describing the wavelet-based analytical framework used to assess Bitcoin’s resilience to the U.S. dollar index (DXY). Section 4 presents the empirical results, including wavelet coherence findings, Frobenius norm analysis, and phase-weighted metrics. Section 5 concludes with a discussion of key findings, limitations, and policy implications.
2. Literature Review
Historically, numerous proposals have aimed at creating a universal currency, reflecting widespread dissatisfaction with the dominance of any single national currency—particularly the USD—as the global reserve standard. Such initiatives have typically sought to mitigate the disproportionate monetary influence held by a single nation, promoting equitable global economic interactions. Yet, despite persistent advocacy, no universally accepted supranational currency has successfully emerged, leaving the USD’s position relatively unchallenged.
John Maynard Keynes, in 1941, introduced the concept of the Bancor—a supranational reserve currency designed to diminish the outsized global role of national currencies, especially the USD (Komath, 2022). Dobija (2014) similarly argues that reliance on a singular reserve currency exacerbates global economic disparities, advocating instead for a unified global monetary framework. In contrast, Ballocchi and d’Hautefort (2016) propose diversified currency baskets as a more realistic reflection of the multipolar global economy, drawing lessons from the historical limitations of the gold standard.
The recent emergence of cryptocurrencies introduces novel dimensions to the global currency discourse. Kunaifi et al. (2022) examine the potential and challenges associated with a cryptocurrency-based global reserve, emphasizing the necessity of robust regulatory mechanisms for stability. Shao and Mao (2023) suggests that while cryptocurrencies like BTC may not immediately replace traditional currencies, their growing adoption positions them as potential future alternatives. Similarly, Mikhail (2018) notes the increasing influence of BRICS currencies, signaling a shift toward multipolarity in global finance. These historical and contemporary discussions highlight ongoing dissatisfaction with the current unipolar reserve system and underscore BTC’s potential relevance in addressing these monetary concerns.
The USD has dominated as the global reserve currency since the Bretton Woods agreement, significantly shaping international trade, finance, and economic policy (Bertaut et al., 2021). Approximately 87% of global transactions are conducted in dollars (Bao & Le, 2021), underscoring the dollar’s pervasive influence.
Despite its strength, vulnerabilities persist in the dollar’s dominance. Siddiqui (2020) highlights the potential rise of the Chinese renminbi (RMB) as a rival reserve currency, though current restrictions such as capital controls limit its international appeal (Chernilevskaya, 2021; Aysan & Kayani, 2022). Additionally, cryptocurrencies challenge traditional monetary structures, offering decentralized exchange mechanisms and alternative stores of value (Nguyen & Nguyen, 2024).
Moreover, the geopolitical leverage conferred by the USD is evident in its use as a political instrument, notably through sanctions that leverage dollar-based financial systems such as SWIFT (Flach et al., 2024). Such actions have prompted countries like Russia to pursue strategies aimed at de-dollarization, diversifying reserves away from the USD (Chen, 2023). Despite these pressures, Goldberg et al. (2022) assert that no alternative currently matches the liquidity and global acceptance of the dollar, reinforcing its entrenched reserve status and central role in global financial mechanisms.
Classical exchange rate models, including purchasing power parity (PPP) and interest rate parity (IRP), typically explain currency movements through economic fundamentals such as inflation, interest rate differentials, and productivity (Khan et al., 2019). However, Hassan and Zhang (2021) argue that currency risk encompasses factors beyond these traditional models, influencing global capital flows, equity markets, and investment sentiment. Due to its unique reserve status, the dollar often deviates from these classical frameworks, highlighting the need for analyses that account for its broader international financial implications.
While generally conforming to fundamental forex principles, the USD uniquely benefits from its reserve currency status, enhanced by historical precedent, extensive global financial linkages, and specific market structures (Chaboud et al., 2023; Iancu et al., 2022). Its influence permeates various asset classes, notably commodities priced predominantly in USD, equities sensitive to export competitiveness, and bonds reflecting global capital flows (Adams & Glück, 2015; Adrian & Xie, 2020). The financialization of commodities further integrates commodity markets with forex dynamics, increasing sensitivity to fluctuations in the dollar (Sun et al., 2017).
Emerging market economies (EMEs) experience significant vulnerability to USD volatility, due to their reliance on dollar-denominated financing and susceptibility to capital flow reversals. A strengthening USD often precipitates capital outflows, heightens exchange rate volatility, and increases the cost of servicing dollar-denominated debts (Wang et al., 2024; Gelos et al., 2024). Park and Son (2022) emphasize the particular challenges faced by highly dollarized economies, exacerbating inflationary pressures and reducing policy flexibility.
The DXY serves as a crucial indicator of the USD’s international strength, integrating factors beyond purely domestic economic fundamentals. Movements in the DXY reflect global financial conditions, including risk sentiment, cross-border capital flows, and monetary policy divergence (Beschwitz et al., 2019; Intercontinental Exchange, 2025). Recognizing the euro’s dominant weighting within the DXY, this study separately analyzes the EUR–USD relationship to isolate BTC’s resilience to broader dollar strength from euro-specific influences. By focusing on the DXY, this research assesses BTC’s interaction with the foremost global currency benchmark, offering critical insights into its viability as an alternative reserve asset.
The euro, heavily weighted within the DXY, represents the second-most significant global reserve currency. Its fluctuations reflect crises within the Eurozone and varying investor confidence (Laser & Weidner, 2022). This analysis distinguishes between euro-driven effects and broader dollar dynamics, enhancing clarity on BTC’s relationship with major global currencies.
Wavelet analysis, capturing both time and frequency domains, has been applied to BTC to assess its hedging properties, correlation with commodities, and interactions with fiat currencies (Grinsted et al., 2004; Celeste et al., 2020).
Notably, existing research covers a range of approaches for examining BTC’s relationship to the US dollar—ranging from GARCH-based volatility analyses (Baur et al., 2018) and causality in quantiles (Mokni & Ajmi, 2021) to fractal-based methods (Zitis et al., 2023). While these studies confirm that BTC and the dollar do interact, many rely on older datasets that precede critical developments such as the post-2020 institutional adoption of BTC and shifts in US monetary policy. Moreover, most do not isolate the euro’s influence within the DXY or emphasize BTC’s potential “resilience” under a strong-dollar paradigm.
In this context, we build upon these works by employing a multi-method wavelet framework that explicitly controls for euro-driven effects and covers an extended dataset through June 2024. Studies indicate BTC’s potential as a short-term hedge or diversifier (Bouri et al., 2017b; Disli et al., 2021), yet few specifically examine BTC–DXY dynamics in the recent transformative market conditions characterized by institutional adoption and increased volatility. By integrating partial wavelet coherence (PWC) and exponential decay phase weighting, this research provides contemporary insights into whether BTC behaves like typical USD-priced assets or demonstrates weaker and more sporadic correlations—a phenomenon we term “resilience”.
To summarize, despite extensive literature on USD dominance and alternative monetary systems, key gaps remain. Prior BTC–USD studies often use different methods (e.g., GARCH, fractal complexity) or end before major shifts in the cryptocurrency market. Furthermore, many do not disentangle BTC’s relationship with the dollar from euro-driven effects, even though the euro is the largest component of the DXY. Consequently, there remains a critical question of whether BTC acts as an independent monetary alternative or follows the dynamics typical of USD-priced assets. By employing contemporary wavelet methodologies—including multivariate and partial coherence analyses—and an updated dataset capturing post-2020 trends, this study offers fresh evidence on BTC’s viability as a resilient alternative to traditional fiat currencies in the global financial ecosystem.
3. Methodology
3.1. Data
This study utilizes daily price data spanning from 13 August 2015 to 29 June 2024. This timeframe is selected to guarantee a broad range and sufficient data availability across all variables, with a particular focus on Ethereum (ETH). All prices and indices are expressed as natural logarithmic returns multiplied by 100 to ensure comparability across variables and to stabilize the variance. Table 1 below lists the variables analyzed in this study along with their descriptions and sources, while Table 2 and Table 3 provide summary statistics and pairwise Pearson correlation coefficients, respectively.

Table 1.
Variables used.
Table 2.
Descriptive statistics. SD is standard deviation, TRIMMED is trimmed mean, and MAD is mean absolute deviation.
Table 3.
This table presents the pairwise Pearson correlation coefficients between variables along with their respective p-values as well as the pairwise Pearson correlation coefficients between the daily log returns of financial variables. Each cell contains the correlation coefficient, significance stars (denoting statistical significance), and the p-value in parentheses. Statistical significance levels are indicated as follows: p < 0.05 (*), p < 0.01 (**), and p < 0.001 (***).
3.2. Methods
Wavelet analysis has long been employed to examine financial time series across both time and frequency dimensions (Grinsted et al., 2004; Celeste et al., 2020). This study addresses two interrelated research questions. First, what are the time–frequency characteristics of the DXY? This study begins by applying the continuous wavelet transform to the DXY to generate a WPS heatmap that visually depicts its volatility across different time and frequency bands. This descriptive analysis establishes the volatility landscape of the DXY, identifying key periods and scales of dollar strength and weakness that form the contextual backdrop for the subsequent analyses.
Second, is BTC resilient to the movements of the USD? Building on the insights from the DXY heatmap, this study investigates whether BTC exhibits the conventional “strong-dollar, weak-asset” behavior—characterized by a robust inverse (out-of-phase) relationship with the DXY (phase values near π or −π)—or whether it demonstrates weak or inconsistent coherence with the dollar.
In this study, we adopt an operational definition of resilience with respect to dollar strength, specifically as it pertains to the US dollar index (DXY). Traditionally, under purchasing power parity (PPP) logic, a rising DXY should exert downward pressure on USD-denominated asset prices, giving rise to a negative (out-of-phase) correlation between the asset and the DXY. We label an asset “resilient” to the DXY if it does not manifest this typical inverse movement; that is, if its co-movement with the DXY remains low or non-systematic in terms of phase relationships across different frequencies. Low wavelet coherence in general—and an absence of consistent out-of-phase patterns—would suggest that the asset’s price dynamics are largely independent from, or at least not driven by, fluctuations in the dollar’s value.
The null hypothesis posits that if BTC behaves like typical USD-priced assets, it will display substantial out-of-phase coherence with the DXY, while a resilient BTC will exhibit minimal or sporadic inverse coherence and a lower overall coherence magnitude. This hypothesis builds on the link revealed in the literature between BTC and the DXY (Baur et al., 2018; Mokni & Ajmi, 2021; Zitis et al., 2023), with more details on the characterization of such a relationship. To test this hypothesis, the multi-method wavelet analysis framework employed in this study comprises several components. First a WPS heatmap of the DXY is generated using the Morlet wavelet with an upper scaling factor of 6, following Smolo et al. (2024), which decomposes the DXY time series into its constituent time–frequency components. This process reveals both short-term shocks and longer-term cycles, setting the stage for subsequent comparisons. Next, the WTC between BTC and the DXY is computed, as well as between the DXY and various asset classes (including traded commodities such as the S&P GSCI, oil, and gold; global equities as the DJGI; and Ethereum). This bivariate analysis quantifies the strength and phase relationships of co-movements, allowing us to benchmark BTC’s dynamics against the typical inverse relationship expected under a strong-dollar scenario.
Recognizing that the DXY is heavily influenced by the euro (approximately 57.6% weighting), the analysis is further refined with PWC to control for the influence of the EUR/USD pair, thereby isolating the residual BTC–DXY dynamics. This approach is extended by employing MWC to simultaneously examine BTC, the DXY, and EUR/USD, which captures their joint time–frequency interactions and provides a more integrated view of currency influences.
To quantify the overall intensity of coherence within the reliable regions (i.e., within the cone of influence, COI), this study employs matrix norms—specifically, the Frobenius norm. Defined as , this norm is equivalent to the Euclidean distance when the coherence matrix is vectorized and aggregates the bias-corrected squared coherence (rsq) values over the COI. A higher Frobenius norm indicates a stronger overall relationship with the dollar, while a lower norm suggests weaker coupling.
Finally, to rigorously assess the phase relationships, this study introduces an exponential decay phase weighting method. This approach involves computing the distance of the absolute phase from π by , and then applying an exponential decay function where σ is a decay parameter controlling the steepness of the decay. For negative phase values—indicative of the DXY leading BTC—the base weight is multiplied by a factor (set to 1.5) to emphasize their influence. The resulting weights are then normalized so that the maximum value is 1. This study systematically varies σ (0.2, 0.3, 0.4, and 0.5) and computes the weighted average phase weights over cells where the coherence is statistically significant. Lower weighted averages for BTC, relative to conventional assets, would indicate that BTC does not follow the expected inverse response to dollar strength, thereby supporting the hypothesis of resilience.
While the multi-method wavelet framework presented in this study provides robust insights into BTC’s relationship with the U.S. dollar, certain limitations warrant acknowledgment. First, the wavelet analysis results depend significantly on the chosen parameters, such as the type of wavelet (Morlet) and scaling factors, potentially affecting the robustness of the findings. Second, while the Frobenius norm effectively quantifies the aggregate intensity of coherence, it inherently simplifies the rich, dynamic information embedded within wavelet analyses by collapsing detailed time–frequency interactions into a single scalar measure. Therefore, caution must be exercised when interpreting these norm-based results, as important nuances in coherence behavior over specific time periods or frequency bands may not be adequately captured by this aggregate metric. Third, the exponential decay phase weighting approach, though effective for highlighting important phase relationships, introduces sensitivity to the decay parameter (σ). Lastly, the analysis focuses on historical data and relationships and therefore may not fully capture evolving market dynamics or future structural changes.
4. Results and Discussion
This section provides the outcomes derived from the wavelet-based methods outlined earlier. For clarity, the wavelet analysis is organized into three timescale categories: short-term (up to 30 days), medium-term (30–180 days), and long-term (beyond 180 days). This classification follows Disli et al. (2021), reflecting the typically shorter investment horizon observed among cryptocurrency investors.
4.1. DXY Time–Frequency Characteristics
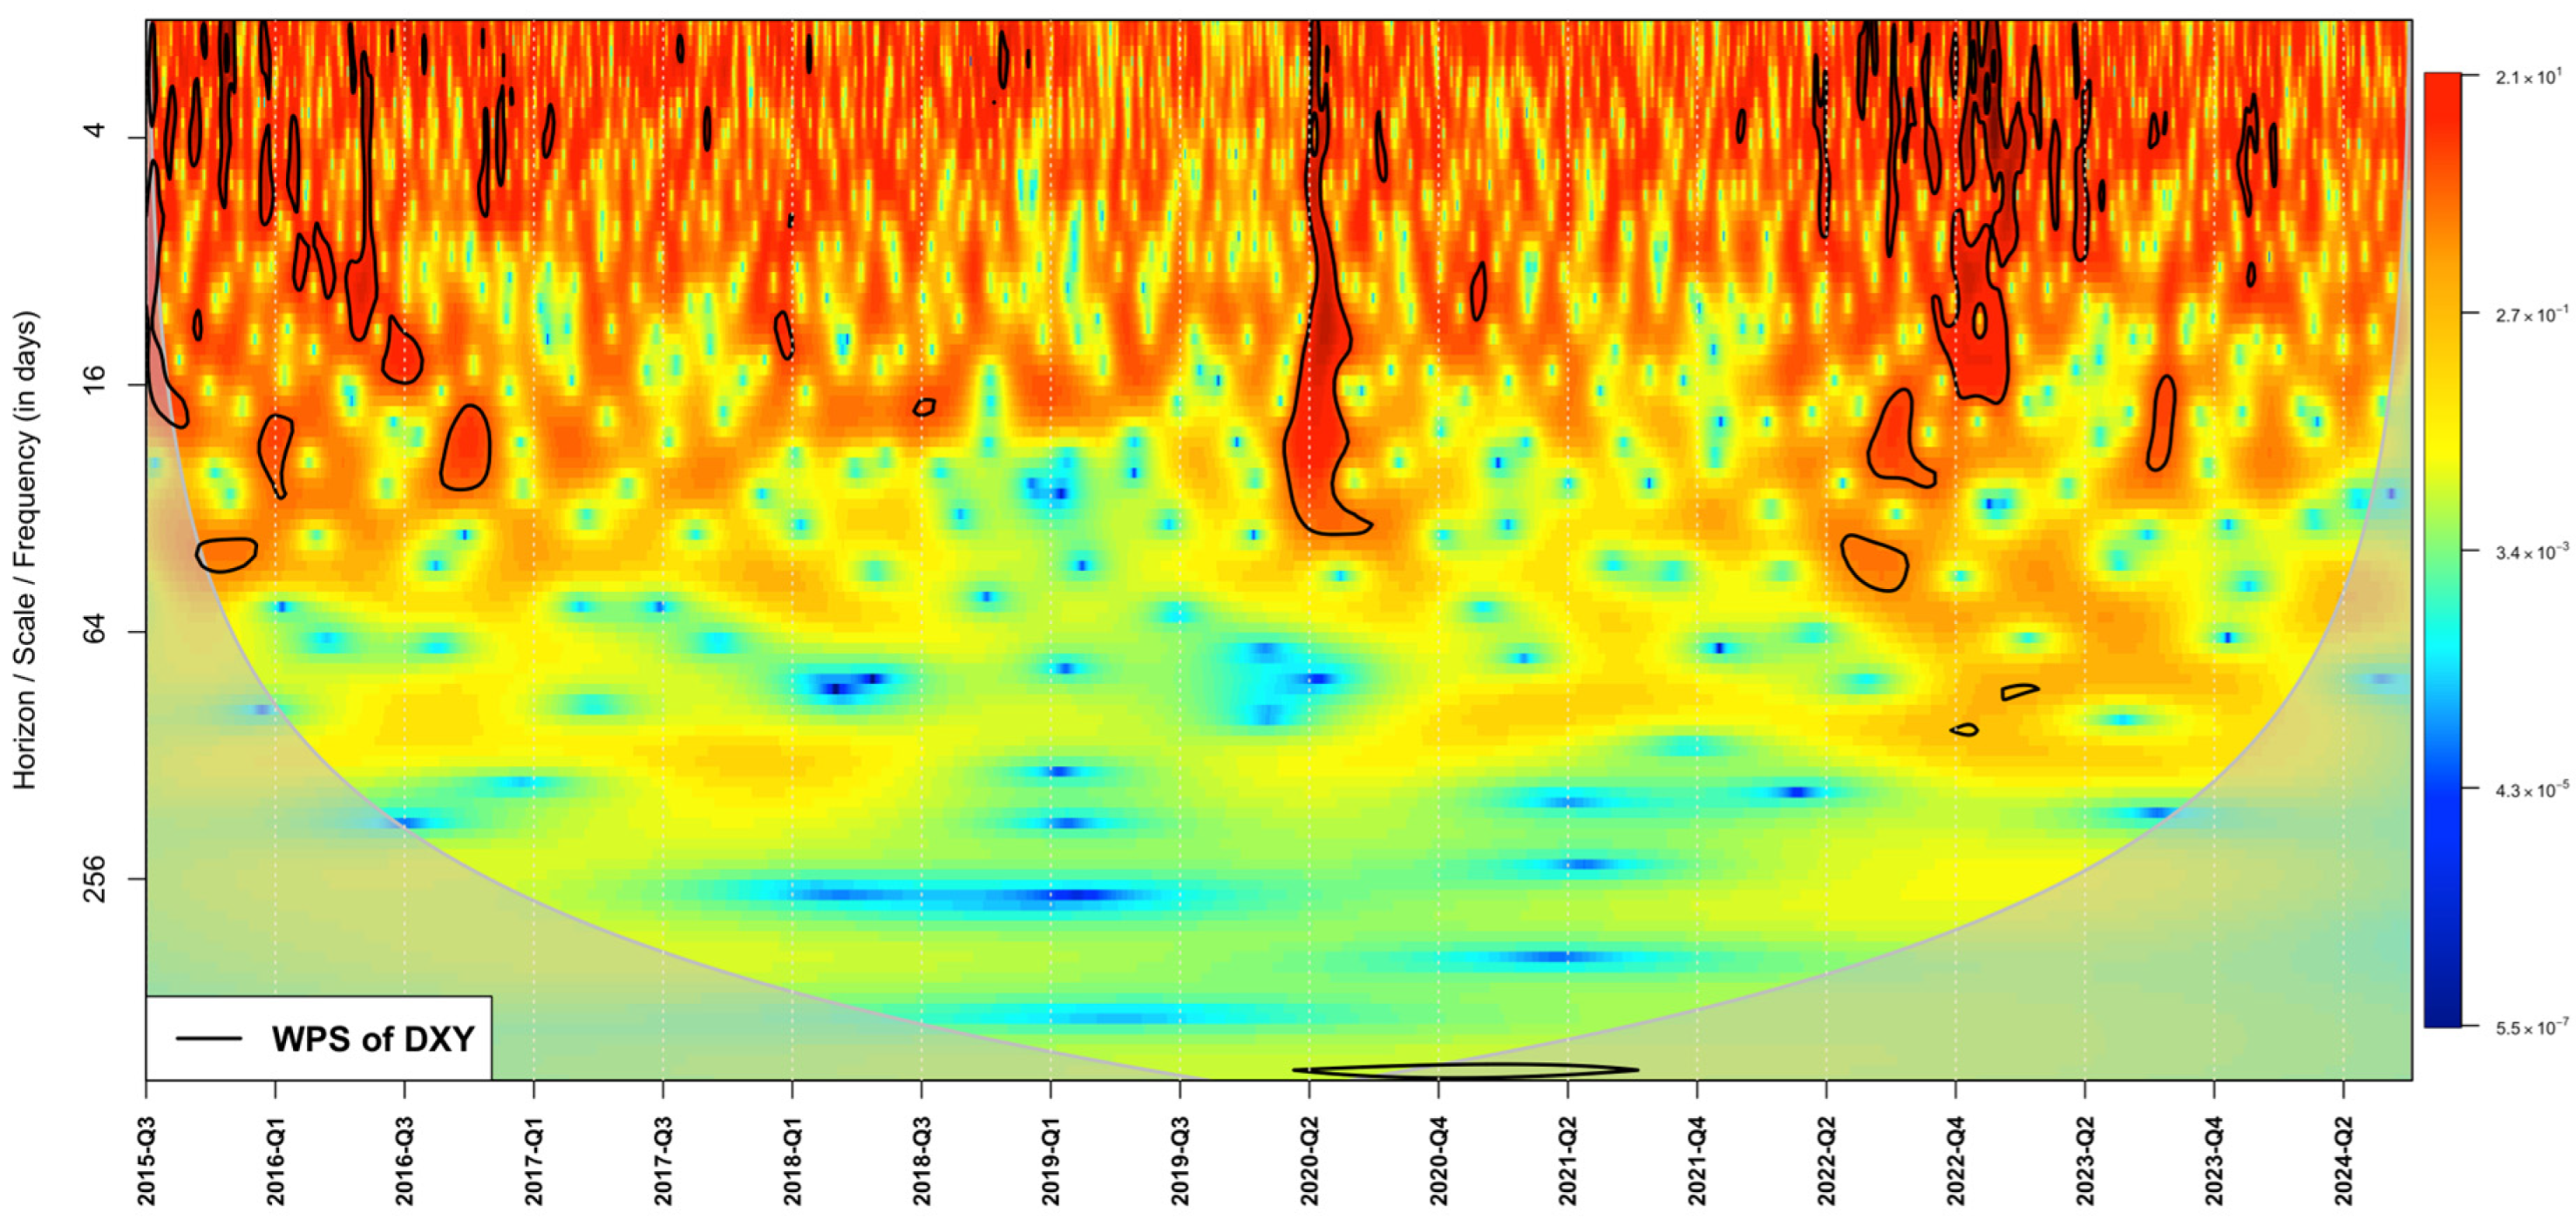
Figure 1 below shows a WPS heatmap of the DXY, addressing the first research question. Warmer colors (reds and oranges) indicate higher volatility, while cooler hues (blues) denote lower volatility. In the upper part of the heatmap, intermittent bursts of short-lived, high-frequency fluctuations are observed—reflecting sharp, rapid changes in the dollar’s strength—whereas the lower portion highlights more protracted, lower-frequency cycles. Notably, episodes of heightened wavelet power around 2016–2017 and again in 2020–2022 align with global monetary and geopolitical shifts, indicating that the dollar often reacts strongly to safe-haven flows and divergent policy environments (Bao & Le, 2021).

Figure 1.
A WPS heatmap of the DXY. The right-hand color bar reflects the intensity of the wavelet power, where warmer shades (e.g., red and yellow) denote heightened volatility, and cooler tones (blue and green) suggest lower volatility levels. The black contours outline statistically significant regions at the 5% confidence level, highlighting time–scale intervals where observed fluctuations stand out relative to expected baseline behavior. These contours are computed using an AR(1) benchmark model for DXY returns, a standard approach in wavelet studies, which aids in distinguishing genuine volatility signals from random noise inherent in autoregressive processes.
This volatility landscape of the DXY directly addresses how the DXY’s time–frequency characteristics evolve, setting the stage for examining whether BTC’s market behavior remains robust—or “resilient”—amid these dollar movements. By linking the DXY’s observed volatility windows to subsequent wavelet coherence analyses, we can observe whether BTC displays the expected inverse relationship typical of USD-priced assets (i.e., an out-of-phase correlation) or diverges from this norm, thereby offering evidence of resilience properties.
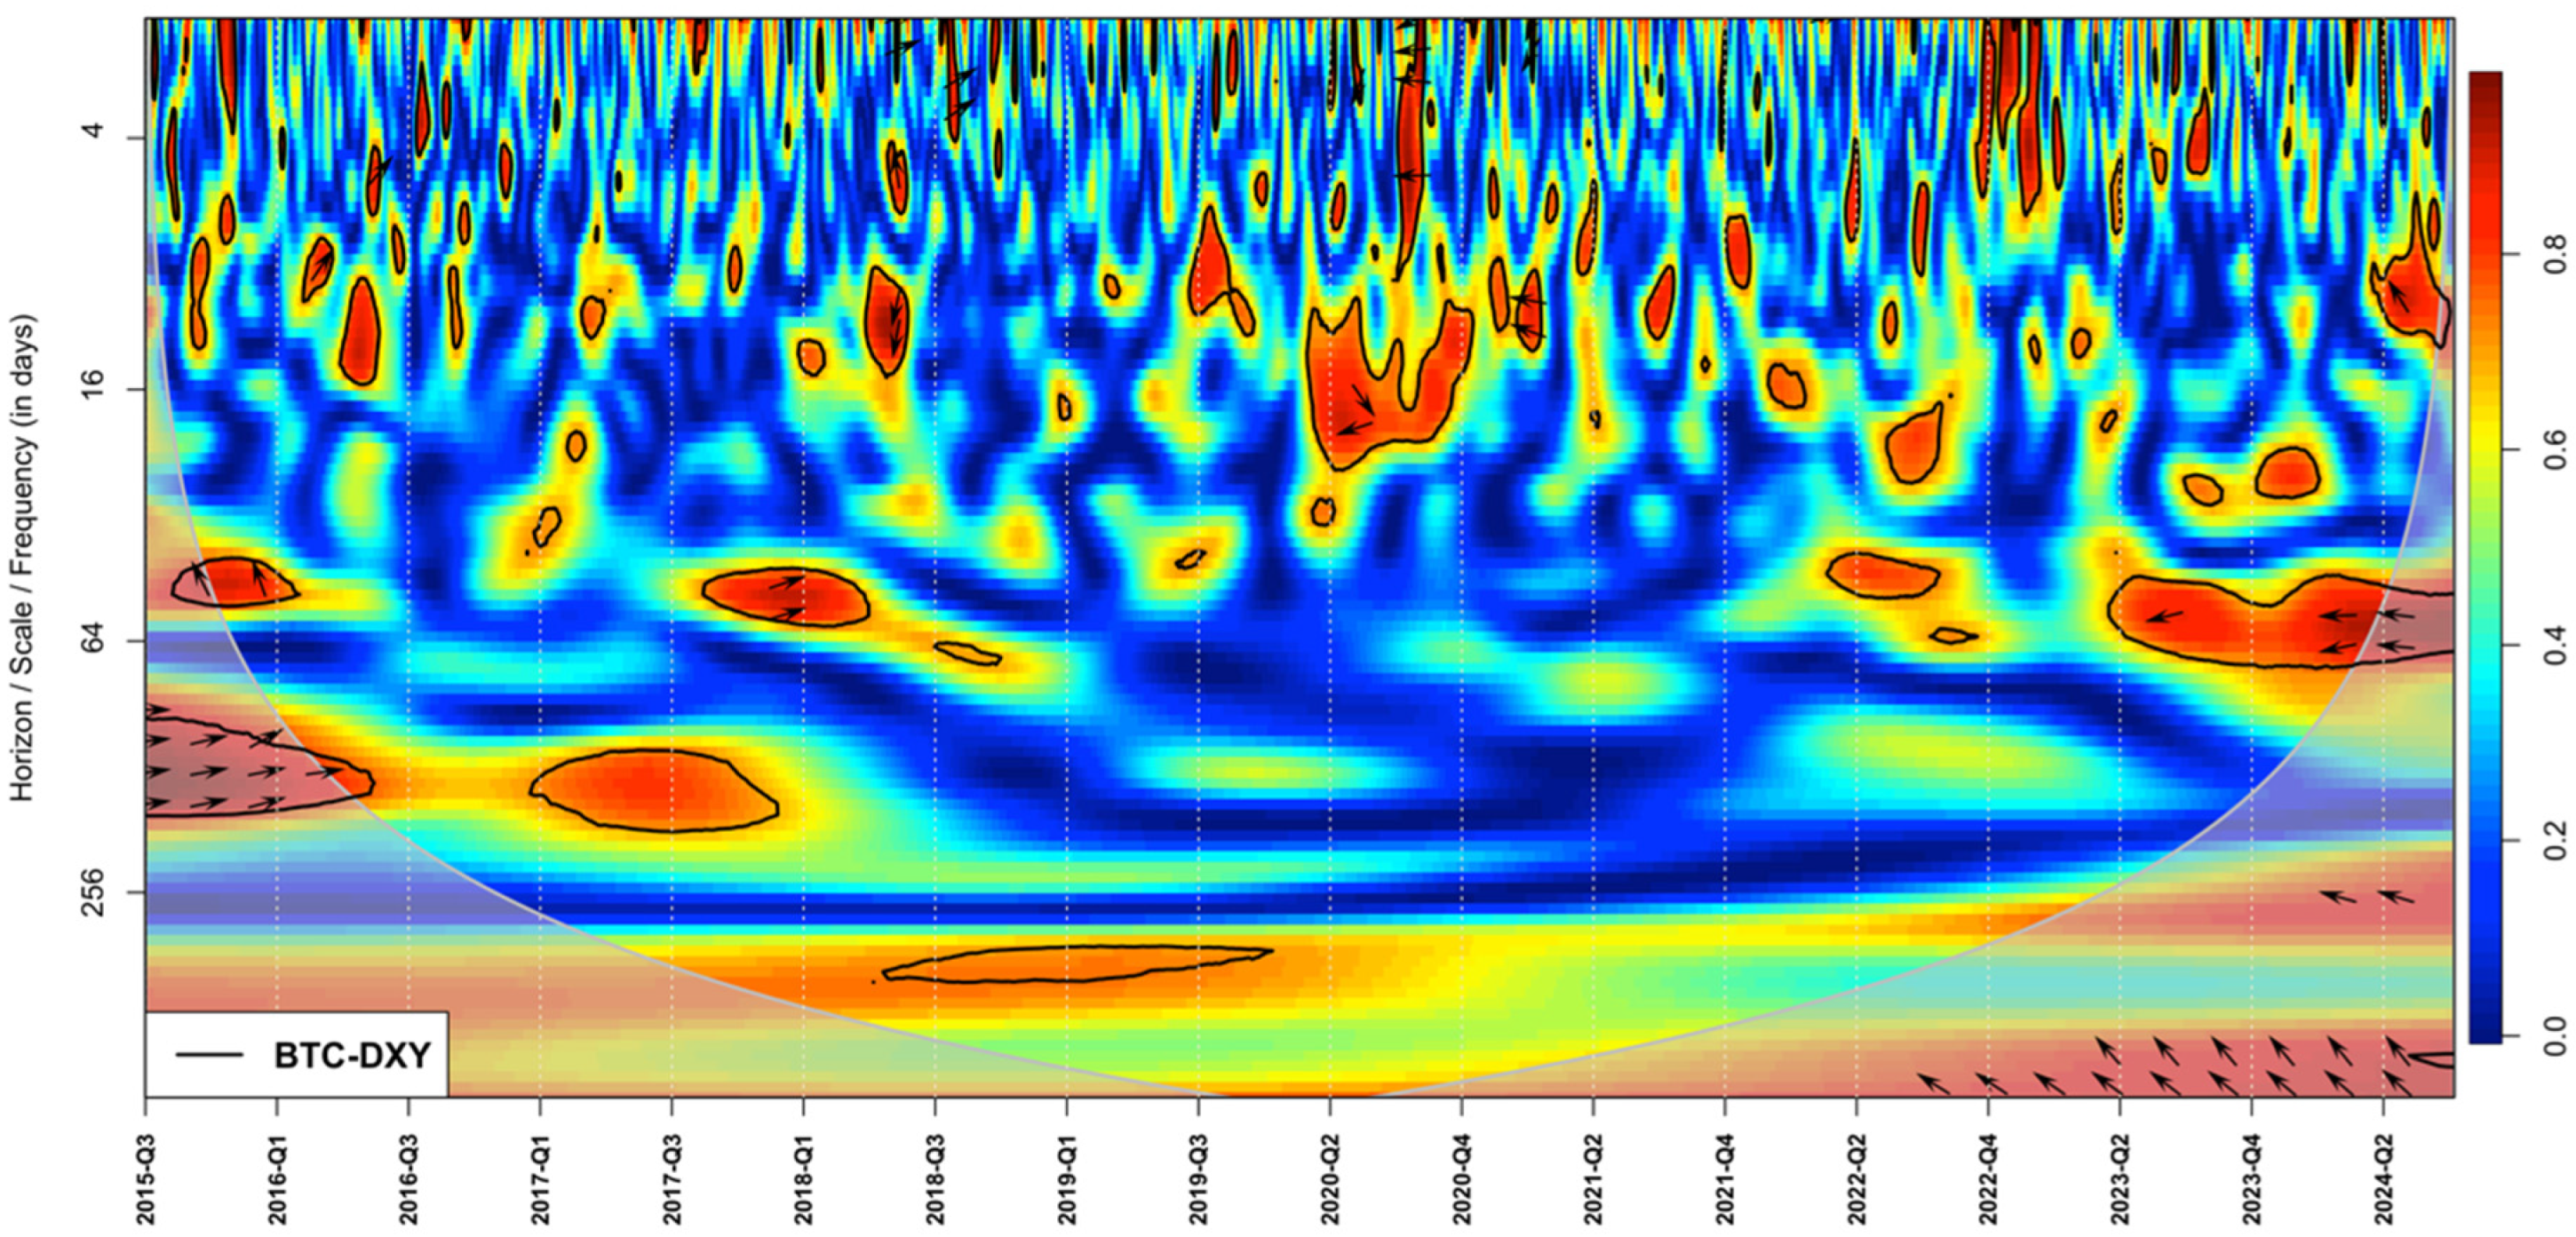
4.2. WTC Analysis of BTC-DXY
The WTC heatmap for BTC–DXY in Figure 2 below reveals that while there are intermittent patches of high coherence during certain periods, the overall pattern does not consistently show the robust inverse (out-of-phase) relationship expected of traditional USD-priced assets under a strong-dollar scenario (e.g., as in Baur et al., 2018; Mokni & Ajmi, 2021; Zitis et al., 2023). In many key time–frequency regions—especially during periods of significant dollar volatility—the phase arrows are neither uniformly pointing left (which would indicate a strong, negative correlation) nor do they persistently maintain high coherence. In the short-term band (up to 30 days), the arrow patterns occasionally point left, indicating a negative correlation, but these segments last only a few weeks and then disappear. In the medium-term band (30–180 days), there is even a less consistent structure, with scattered coherence pockets. Beyond 180 days, BTC–DXY coherence is weak, underscoring that BTC’s cyclical patterns are not governed heavily by the dollar’s longer-term phases (Noreng, 2004).
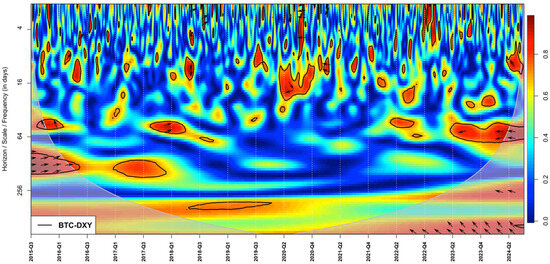
Figure 2.
A WTC Heatmap of BTC–DXY. Arrows within the heatmap indicate the phase relationship between the two time series. The arrows within the plot indicate the phase relationship between BTC and DXY. Right-pointing arrows signify in-phase behavior (both series moving together), left-pointing arrows indicate anti-phase behavior (series moving in opposite directions), upward arrows mean BTC is leading DXY, and downward arrows mean DXY is leading BTC.
Instead, the heatmap displays a mix of phase orientations and frequent intervals of low coherence. This sporadic and inconsistent phase behavior suggests that BTC’s price dynamics are not strictly governed by dollar movements, thereby supporting the hypothesis that BTC exhibits resilience to fluctuations in the USD. These findings reinforce the notion that BTC is not a typical USD-priced asset responding uniformly to US monetary cycles (Laser & Weidner, 2022).
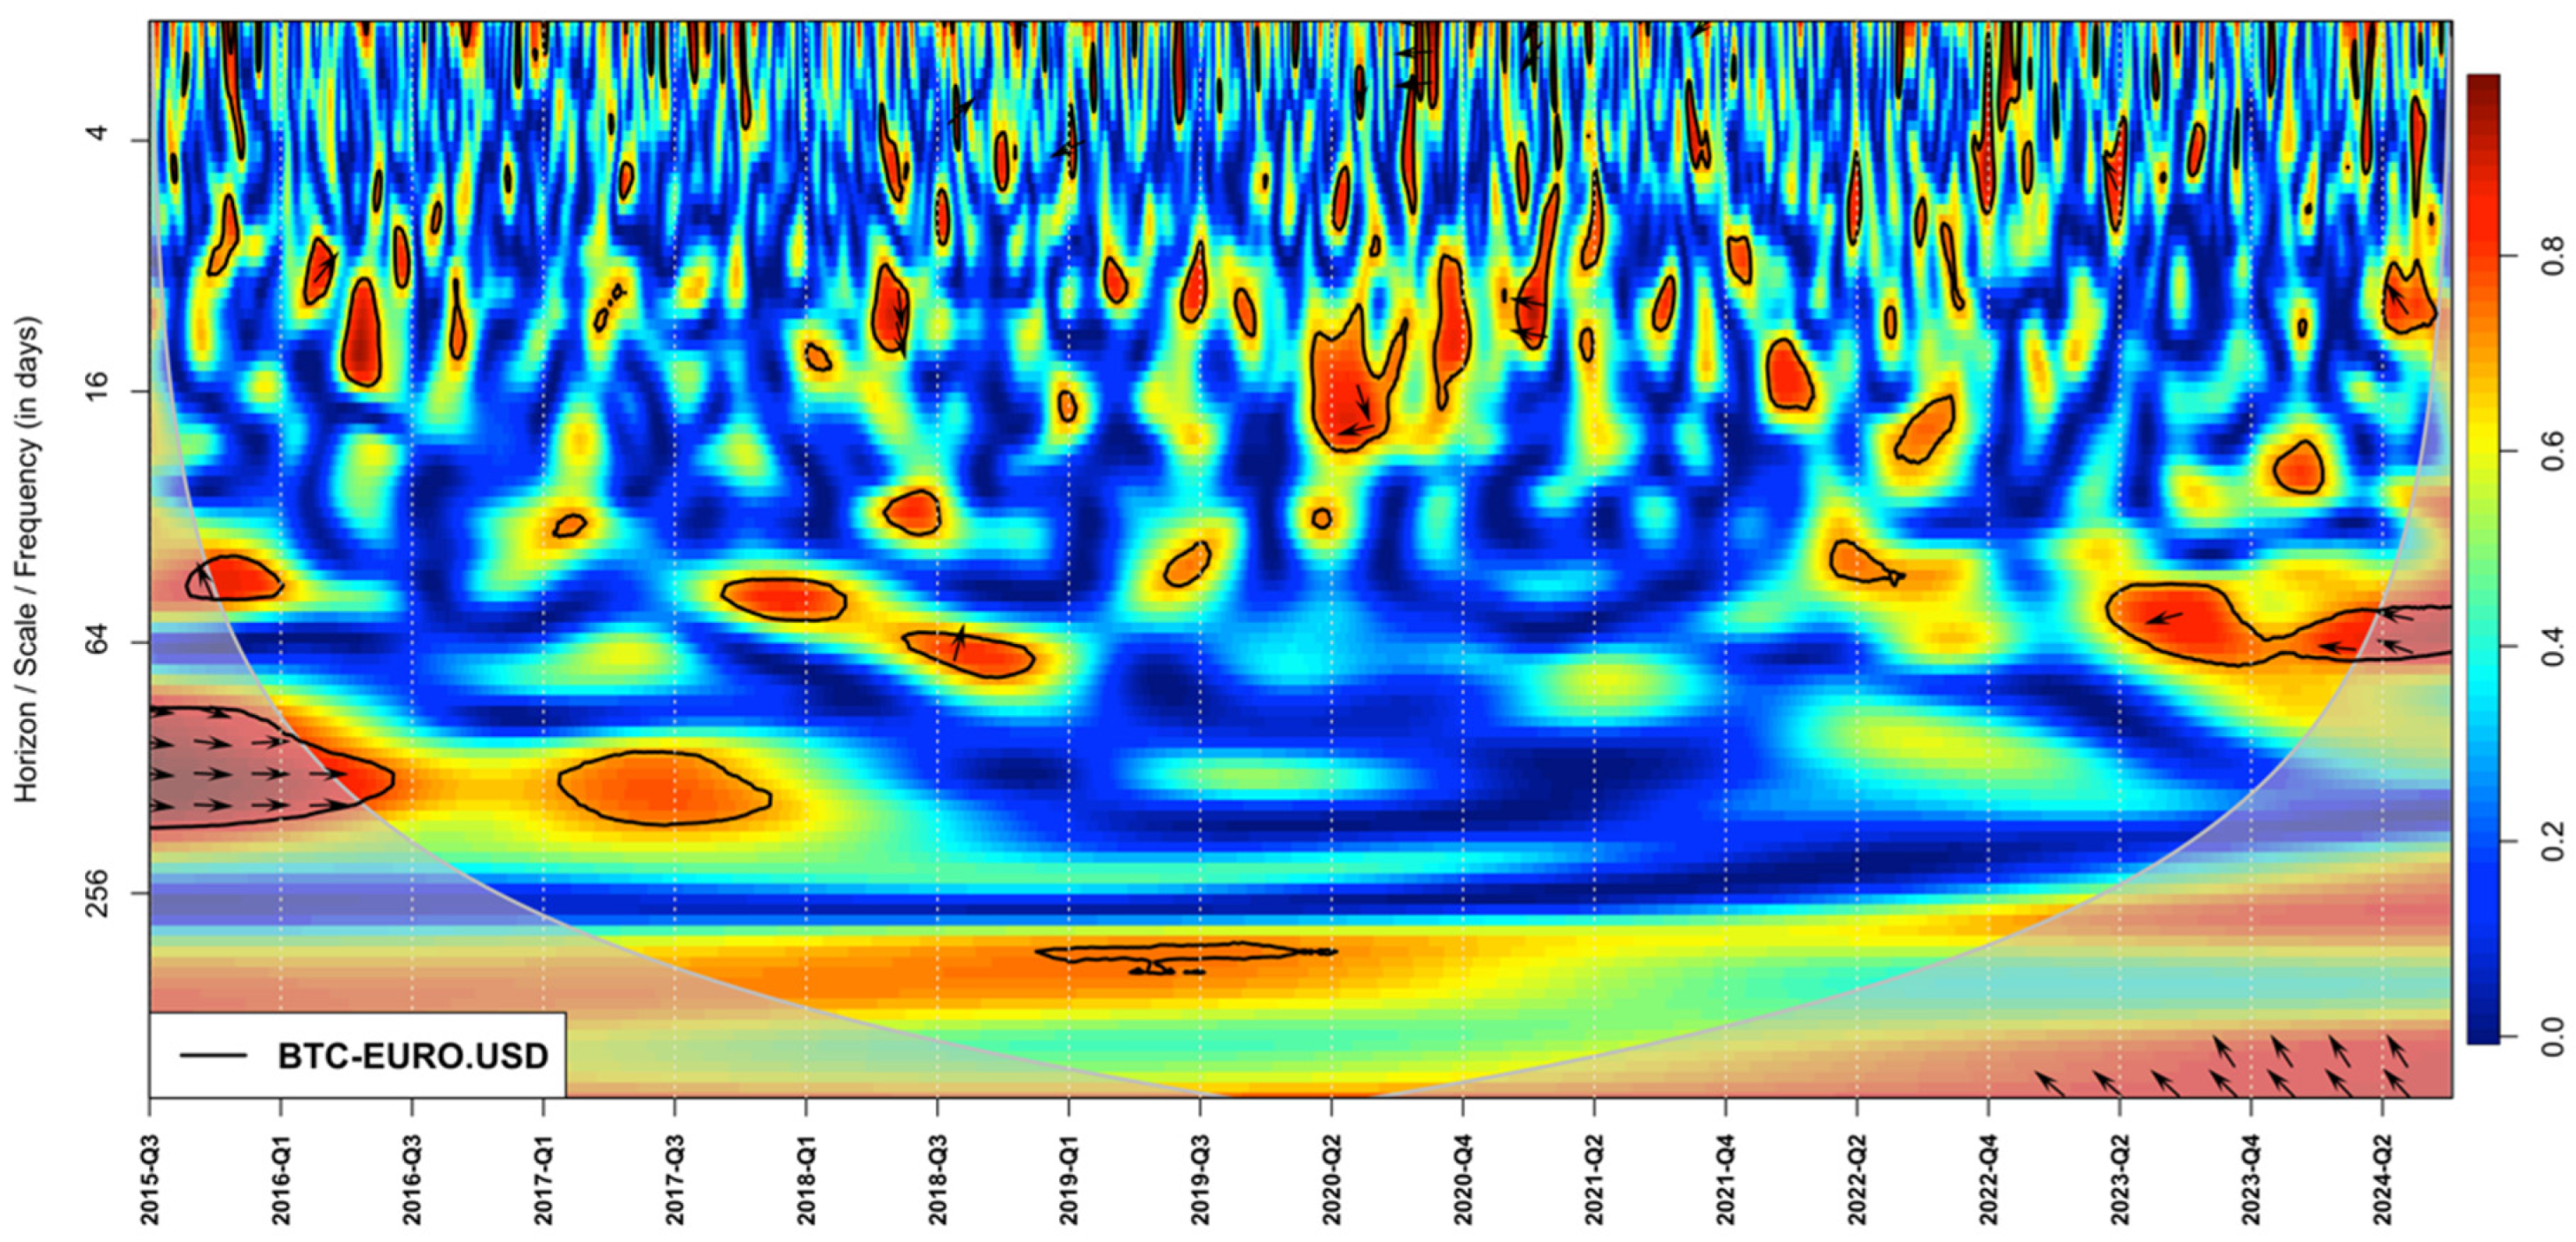
Given that the euro constitutes a substantial share of the DXY, analyzing BTC–EUR/USD directly clarifies whether BTC’s resilience—evident in its less consistent inverse response to the dollar—also extends to the euro itself. If BTC exhibits similar sporadic or lower coherence with the euro, it underlines that BTC’s partial independence from fiat currency cycles is not merely a byproduct of other currencies in the DXY basket, but rather a broader feature of BTC’s market dynamics.
The WTC BTC–EURO/USD heatmap in Figure 3 reveals that BTC’s coherence with the euro is generally sporadic and lower in magnitude across various time–frequency bands. In many intervals, the phase arrows do not consistently display the strong out-of-phase (negative) relationship—indicated by arrows pointing predominantly left—that would be expected if BTC behaved like traditional USD-priced assets. Instead, there are regions where the phase relationship is ambiguous or even in-phase, suggesting that BTC’s price dynamics are not tightly coupled with euro movements. This irregularity in both coherence strength and phase direction implies that BTC may not simply react to euro fluctuations in a predictable manner. Consequently, these findings support the research hypothesis that BTC exhibits resilience to the global reserve currency, as its behavior deviates from the conventional inverse reaction seen in other asset classes.
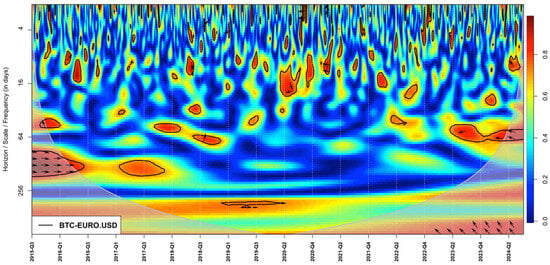
Figure 3.
A WTC heatmap of BTC–EURO/USD.
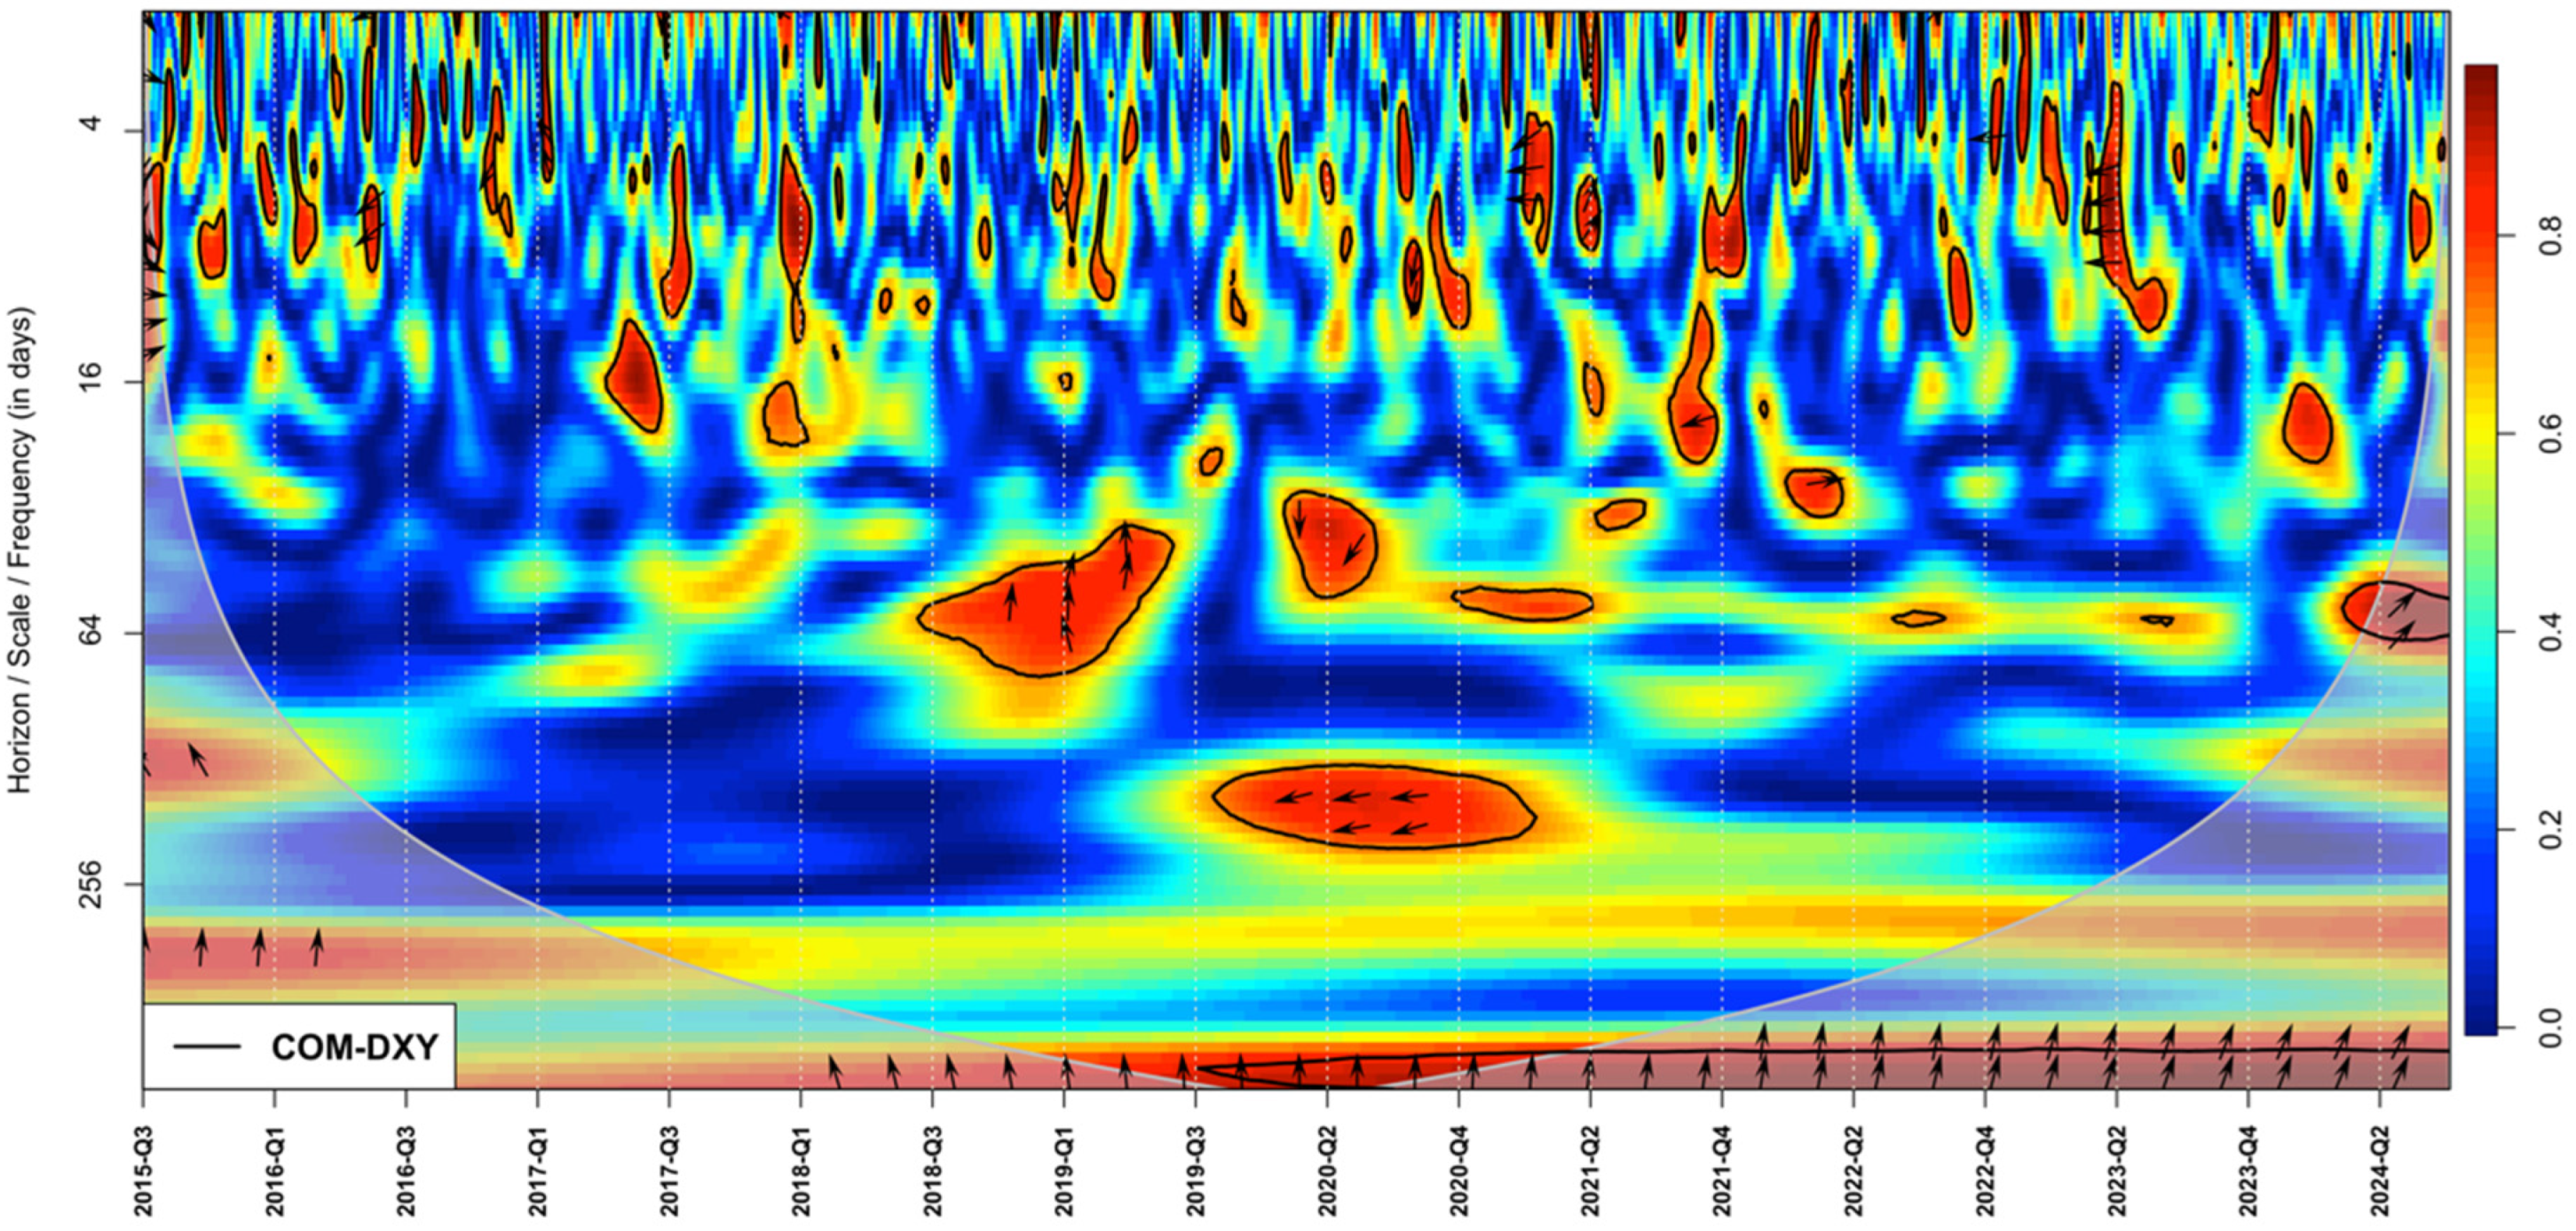
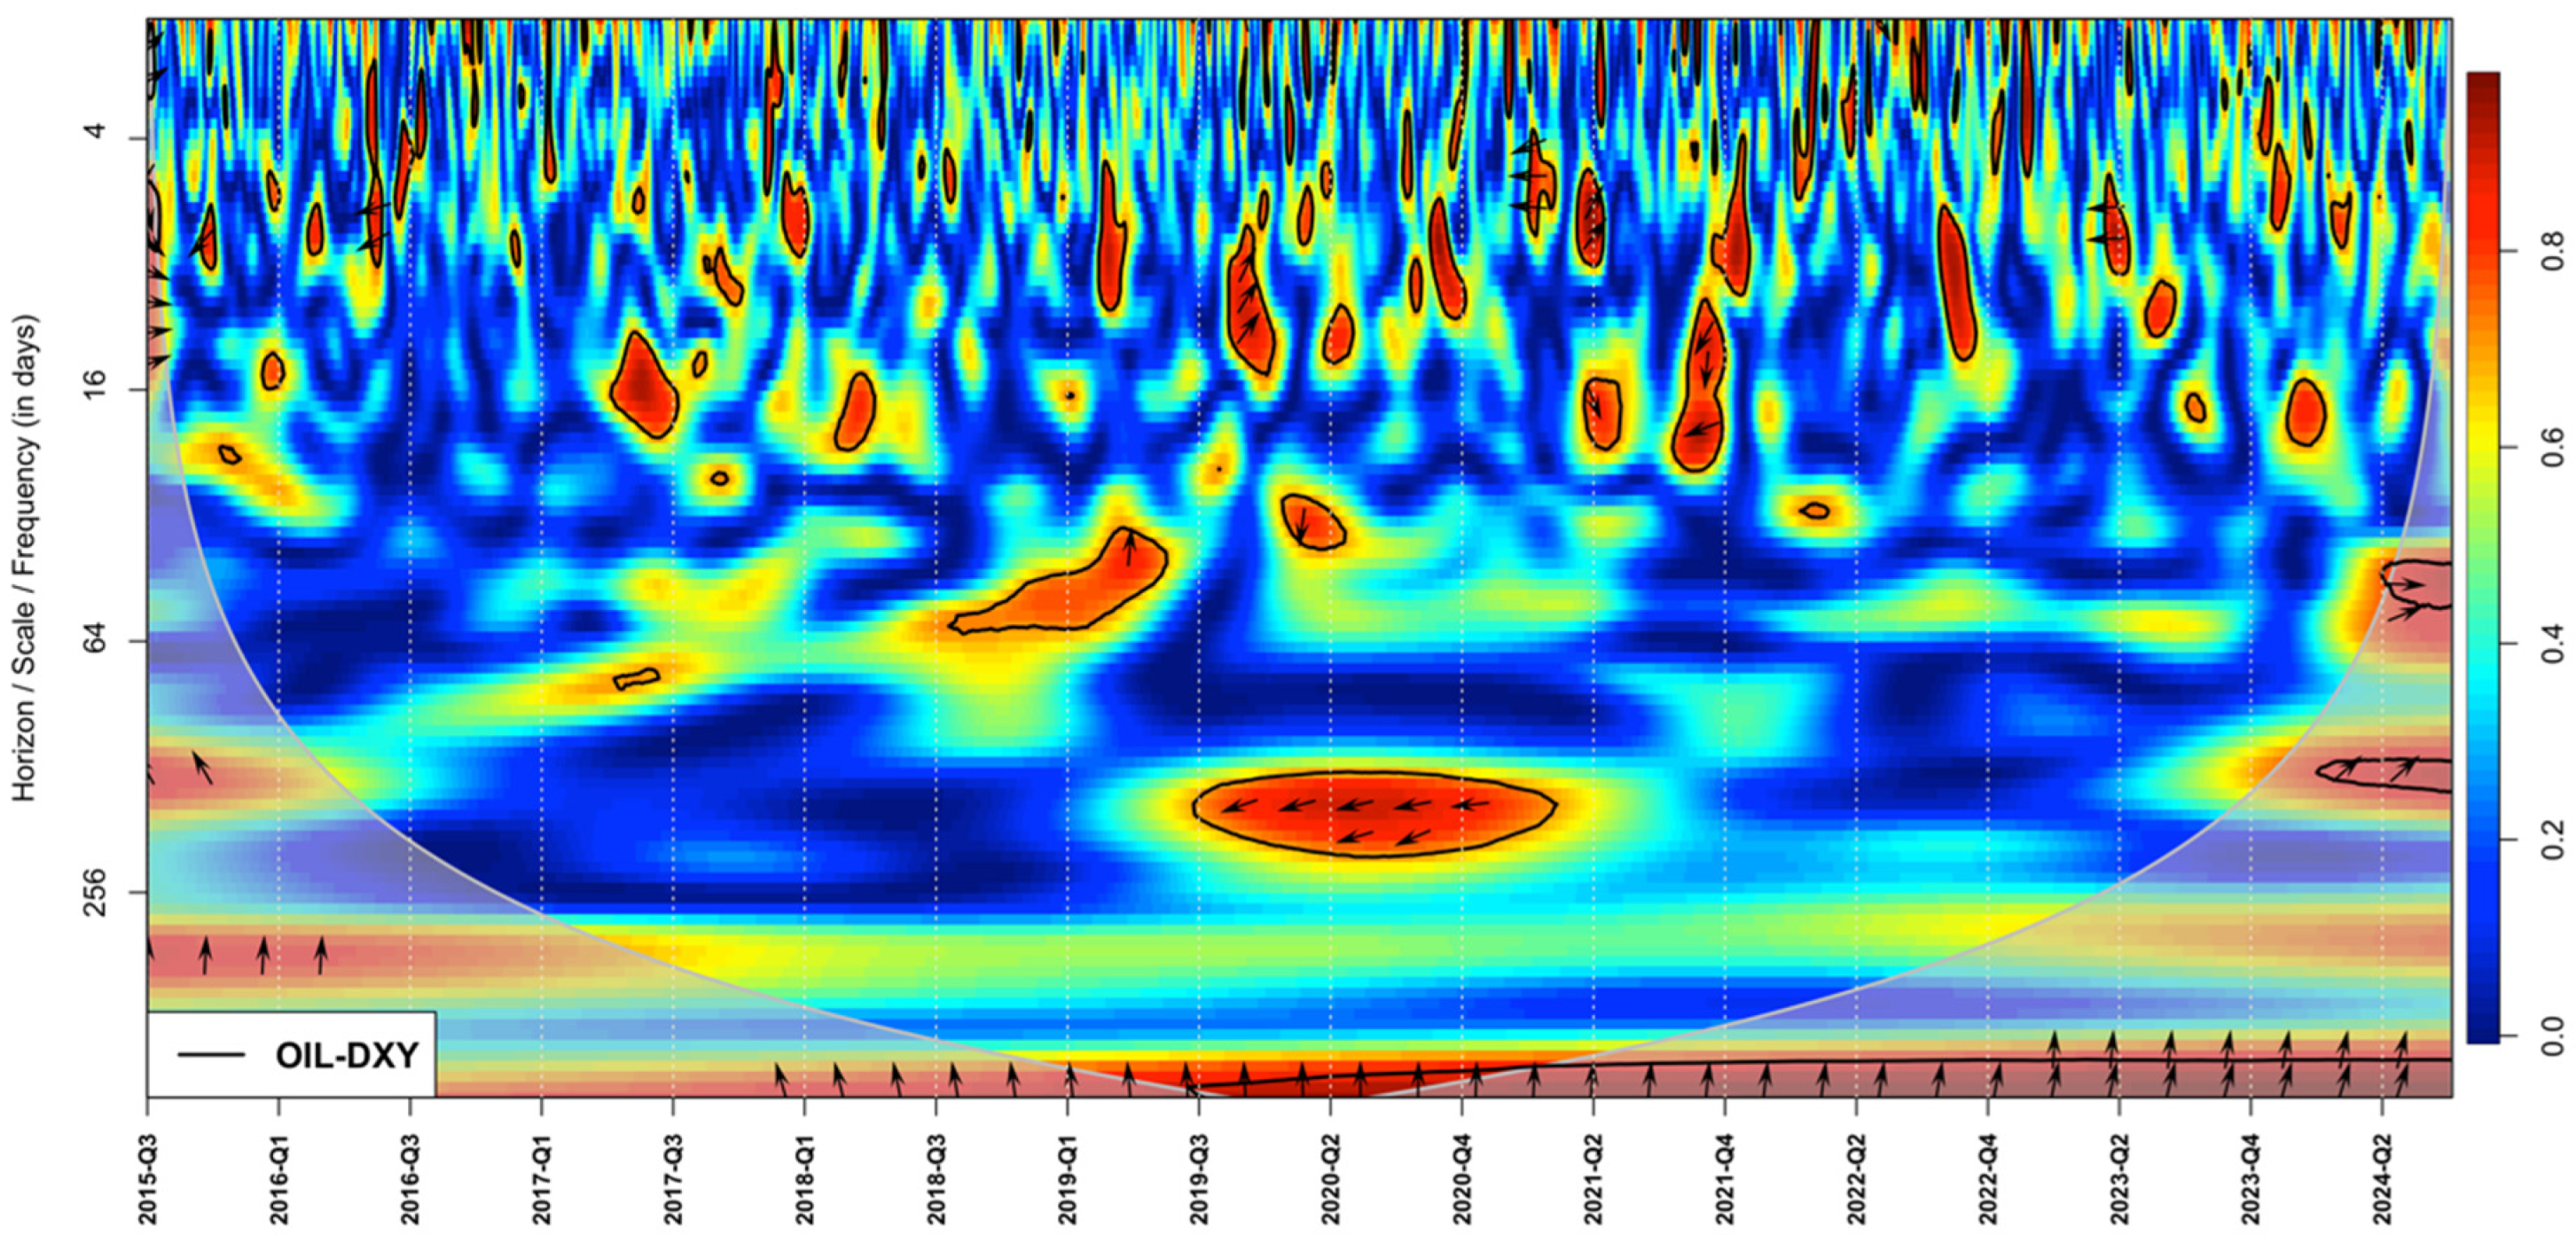
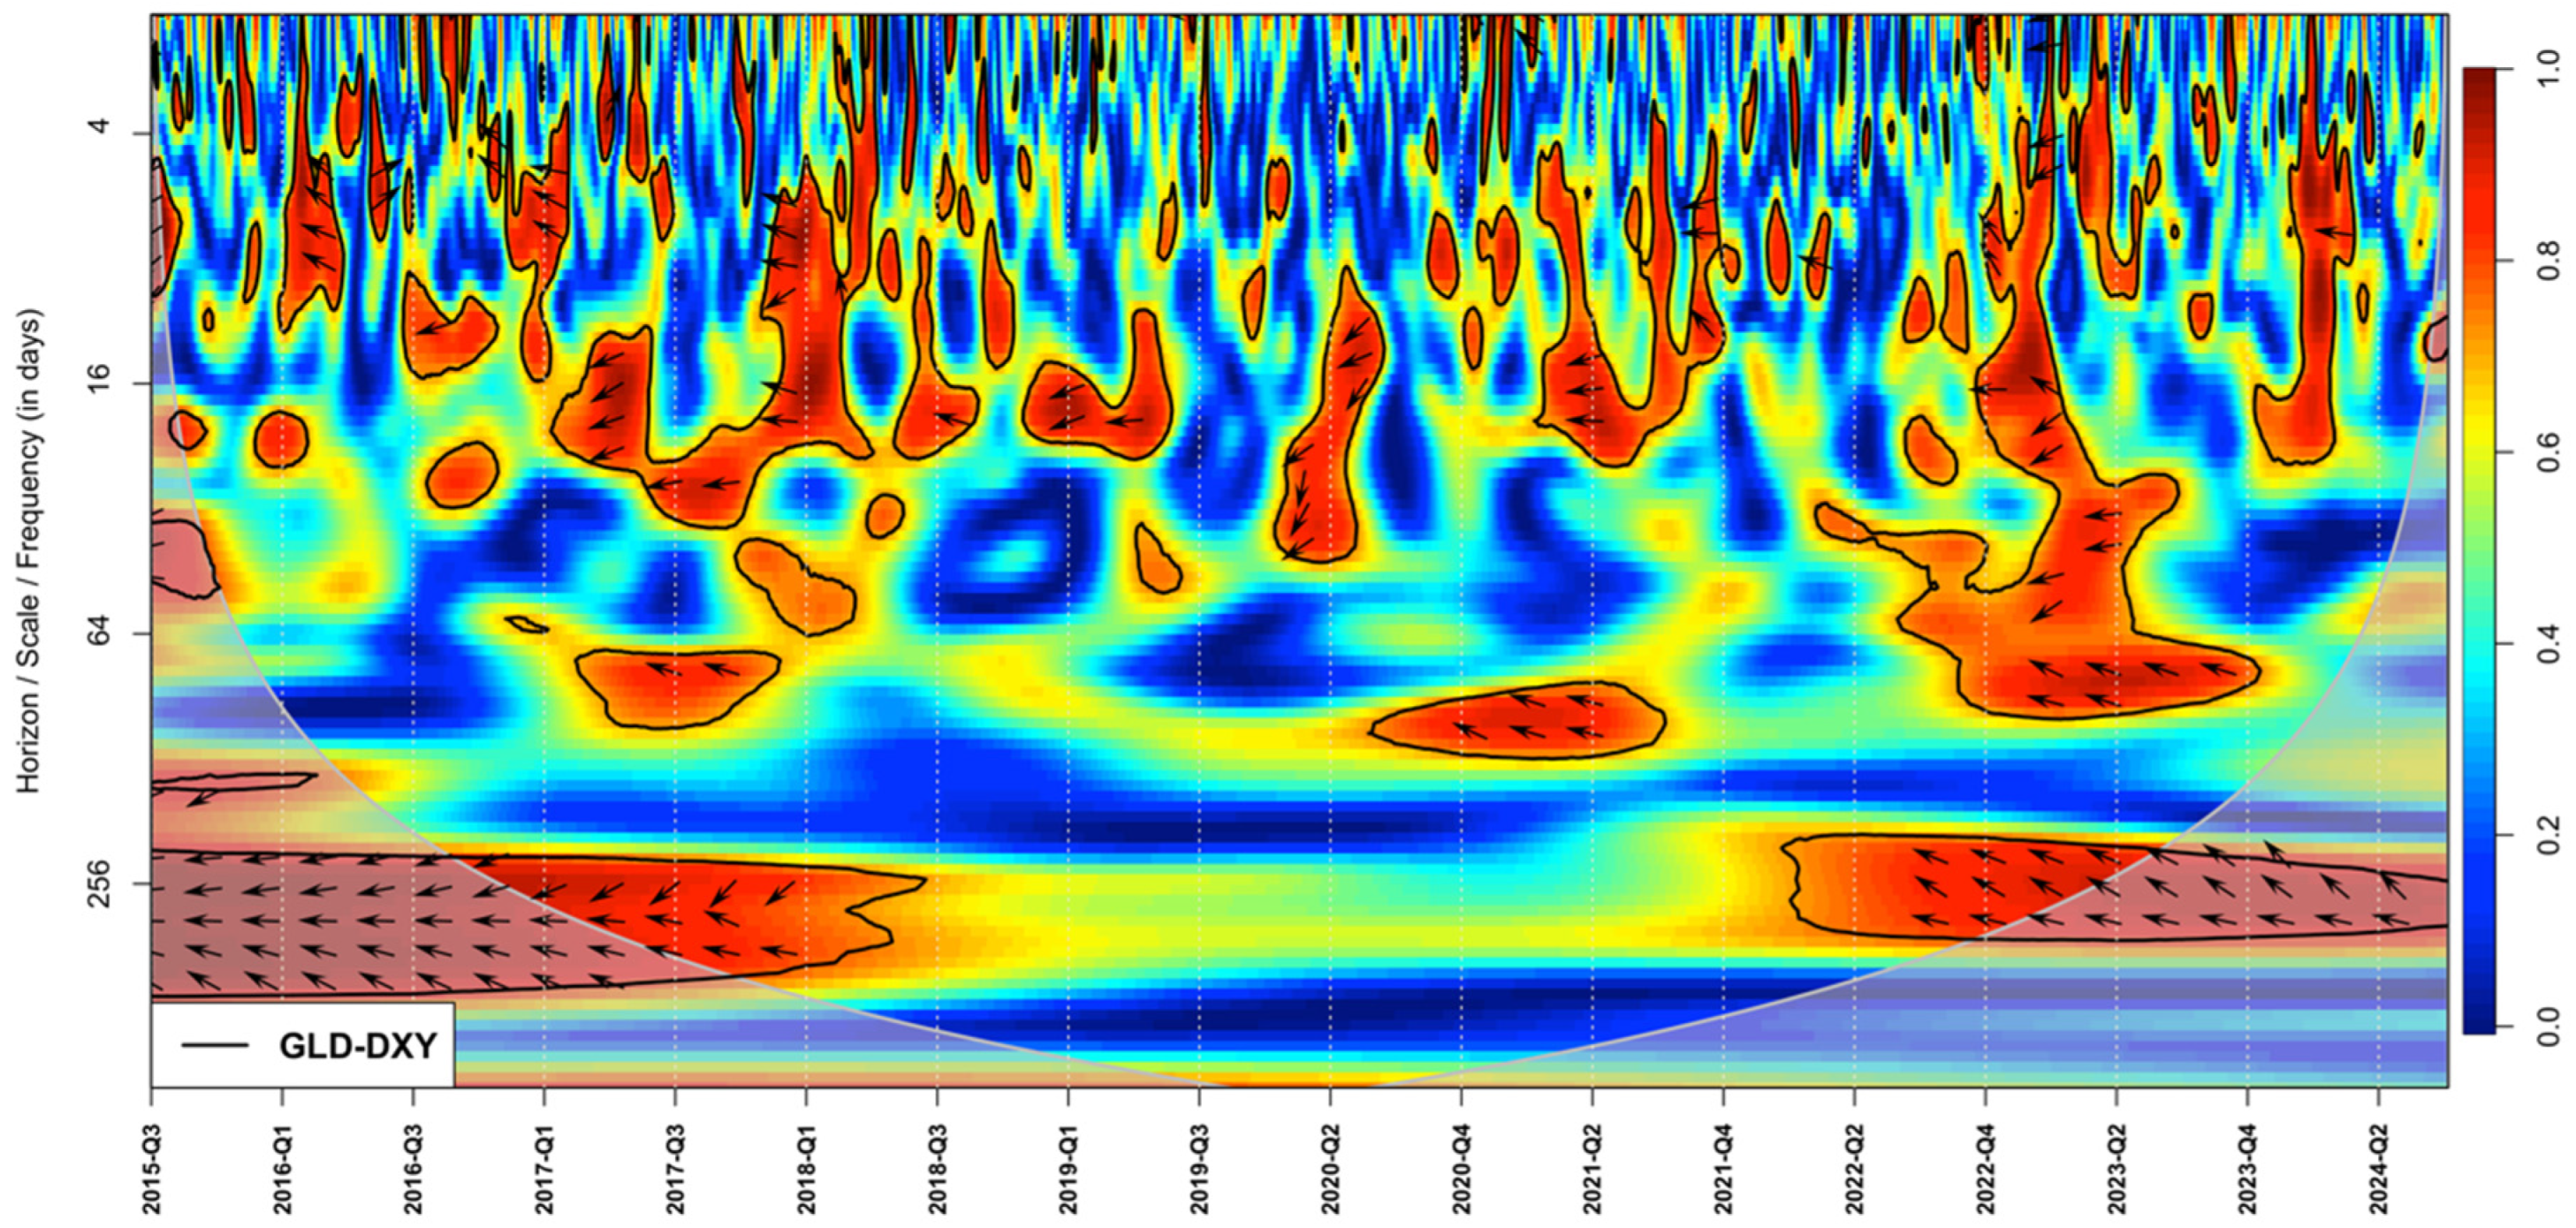
Figure 4, Figure 5, Figure 6, Figure 7 and Figure 8 represents the WTC between the DXY and the other mainstream assets—in particular, the following.
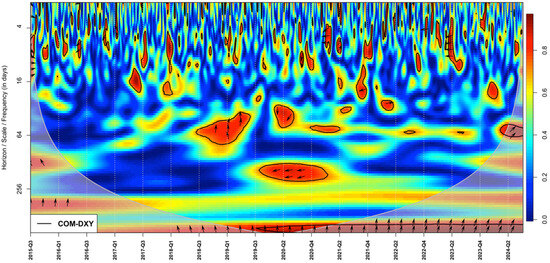
Figure 4.
A WTC heatmap of COM-DXY.
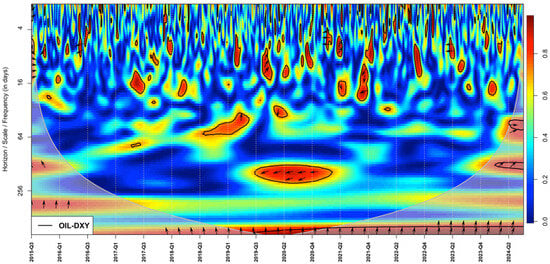
Figure 5.
A WTC heatmap of OIL-DXY.

Figure 6.
A WTC heatmap of GLD-DXY.

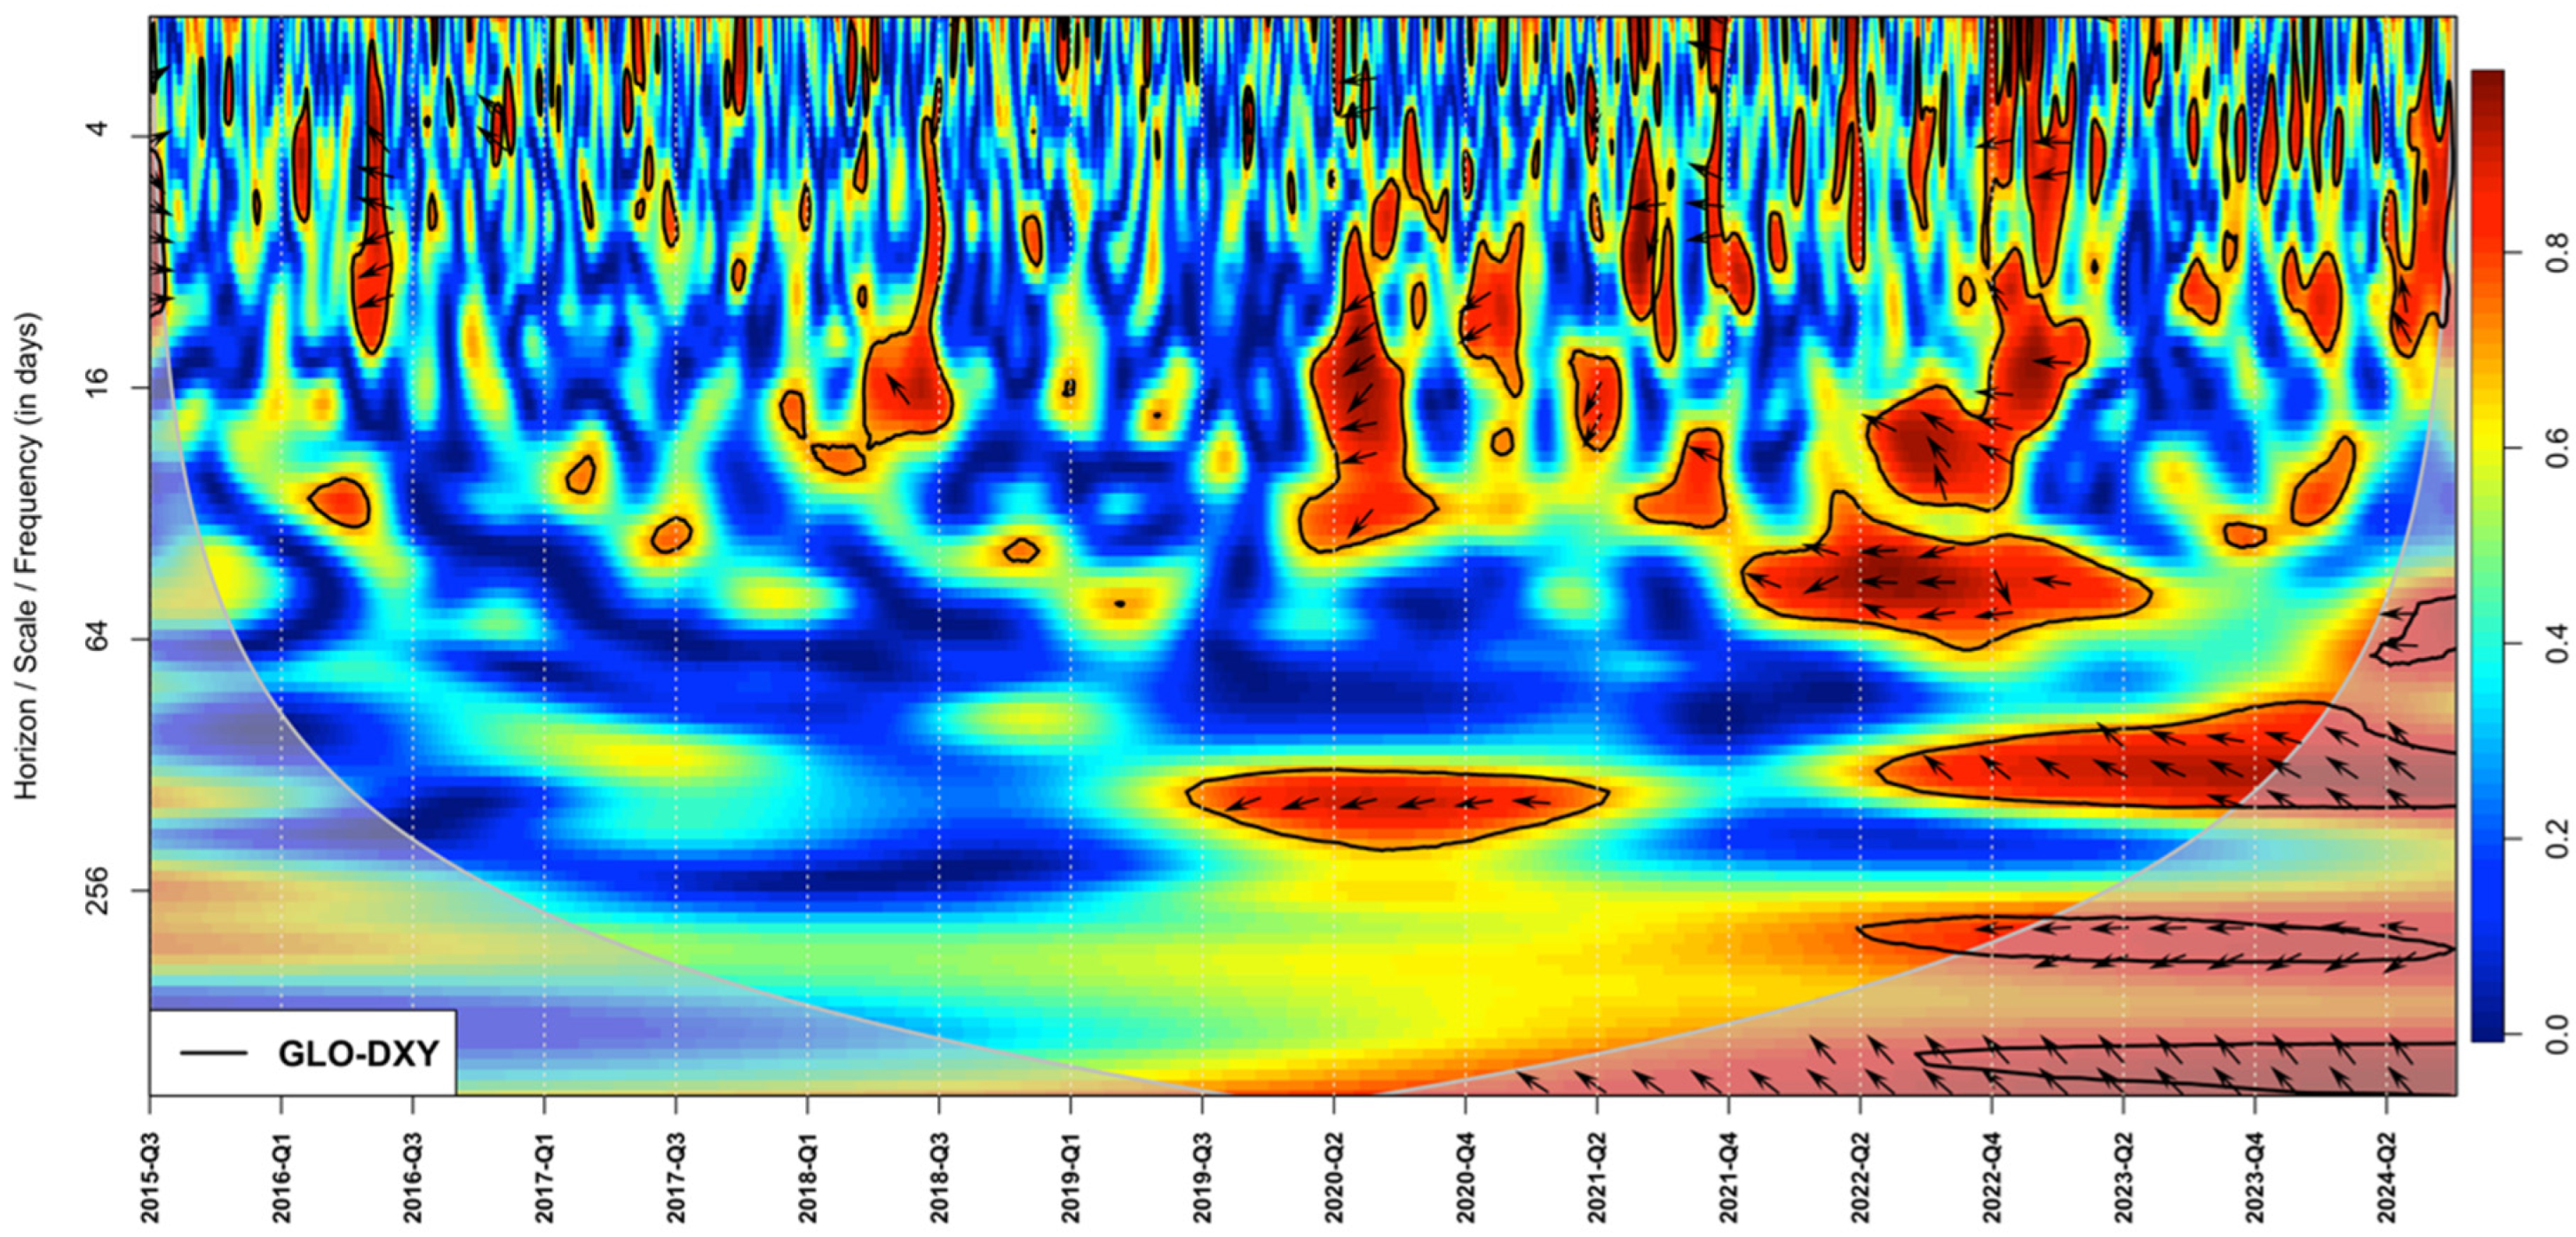
Figure 7.
A WTC heatmap of GLO-DXY.

Figure 8.
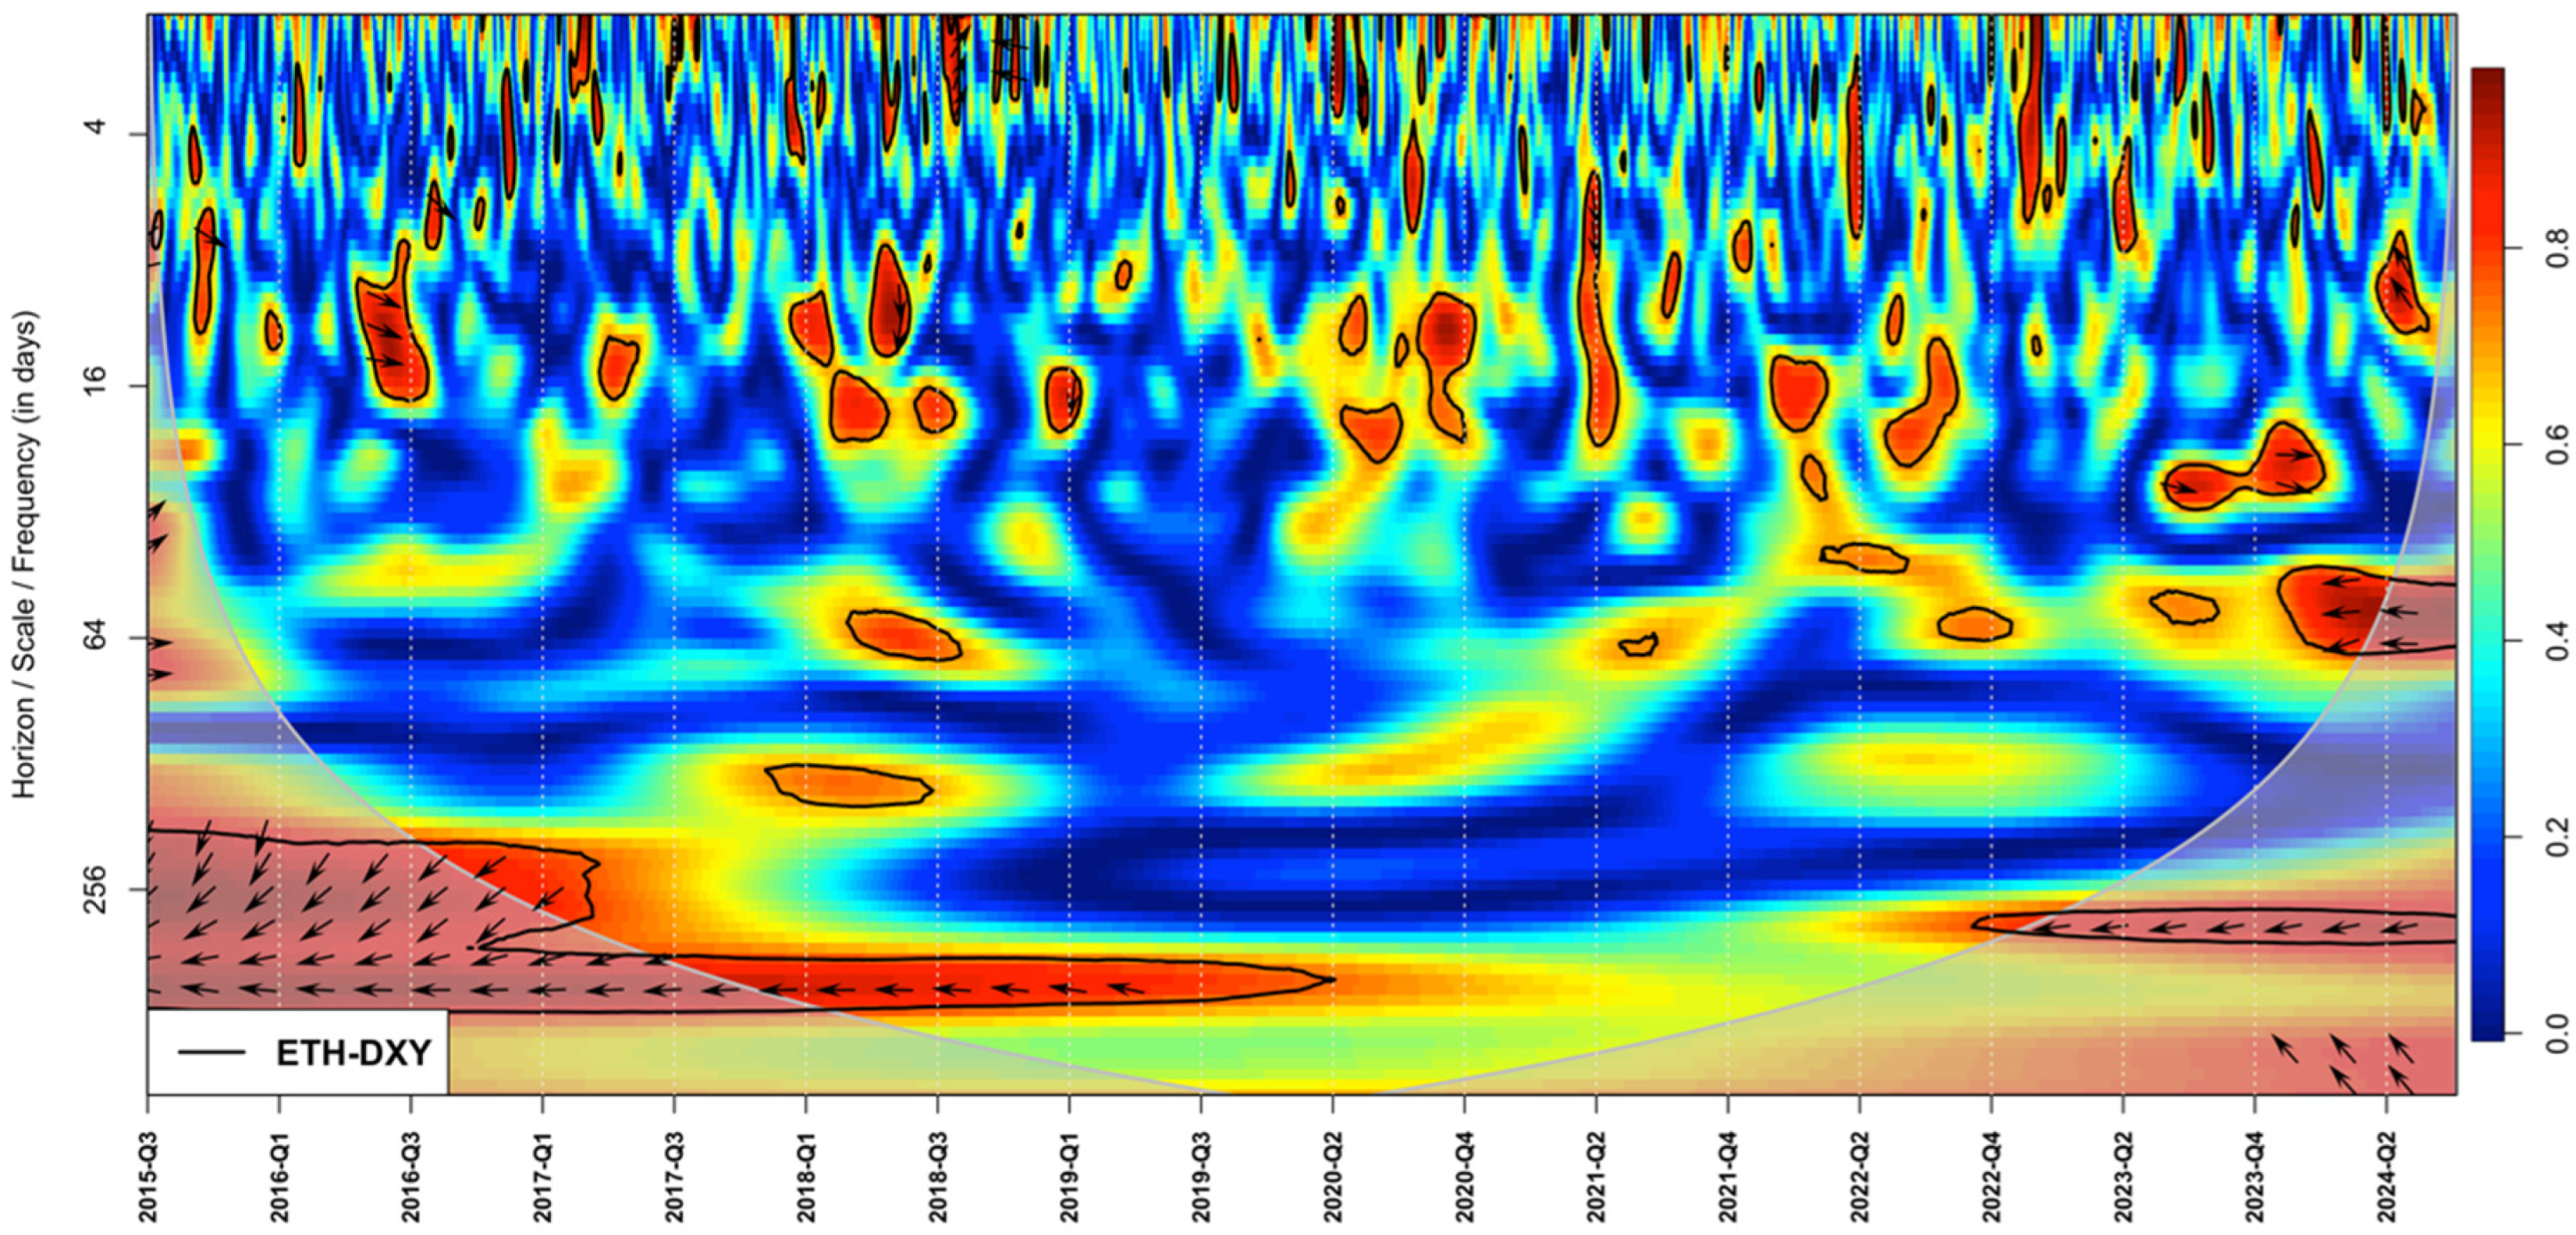
A WTC heatmap of ETH-DXY.
- Short Term (up to 30 days): BTC occasionally shows negative coherence with the dollar, but these episodes are short-lived. The ephemeral nature of negative correlation suggests it might respond briefly to sudden monetary or risk shifts but does not remain pegged to them.
- Medium Term (30–180 days): Negative BTC–DXY coherence becomes even more sporadic, with no cohesive out-of-phase region. Comparatively, gold maintains consistent negative alignment, echoing standard “flight to safety” in this horizon.
- Long Term (beyond 180 days): BTC’s wavelet coherence with the DXY vanishes in most intervals, highlighting BTC’s decoupled trajectory over the extended horizon. In contrast, gold and equities maintain partial correlation even in long cycles (Bouri et al., 2017b).
These time-varying patterns highlight that BTC’s distinct market narrative leads to resilience across multiple horizons. However, resilience here should be interpreted cautiously because BTC remains subject to large idiosyncratic swings (Urquhart, 2016).
In all the WTC heatmaps, the expected pattern of a strong dollar leading (with leftward arrows denoting a negative correlation) is generally evident, especially for global equities and gold, which show a consistently higher inverse relationship with the DXY. Commodities and oil exhibit lower overall coherence, likely because the dollar’s movements are influenced by inflationary pressures that also drive commodity prices. Ethereum, meanwhile, reveals surprisingly subdued coherence values; however, this observation must be viewed in light of Ethereum’s substantial correlation and coherence with BTC (Al-Mansouri et al., 2025) and its comparatively smaller market depth. Consequently, focusing on BTC’s price behavior may offer a clearer perspective on the reduced ETH–DXY coherence.
Although gold is commonly regarded as a safe haven or hedge (Bouri et al., 2017a), the WTC findings suggest that it remains strongly out-of-phase with the DXY, indicating a persistent negative correlation rather than a more stable store-of-value relationship relative to the dollar. In contrast, BTC appears more resistant to the dollar’s fluctuations than gold, despite both assets being predominantly denominated in USD. This outcome supports the hypothesis that BTC demonstrates a level of resilience surpassing that of many mainstream USD-priced assets, reinforcing its potential role as a distinct store of value.
The findings of Noreng (2004), and Pukthuanthong and Roll (2011) provide a useful benchmark for interpreting the results. The WTC analysis indicates that most traditional USD-priced assets exhibit a strong negative correlation with the DXY, as evidenced by pronounced out-of-phase (negative) relationships in their heatmaps. For instance, gold consistently displays high negative coherence with the DXY, reflecting the typical “strong-dollar, weak-asset” behavior—suggesting that when the dollar strengthens, gold prices tend to fall, a response possibly driven by safe-haven dynamics and the scarcity of the US dollar.
In contrast, BTC’s coherence with the DXY is noticeably lower and less directionally consistent. The heatmap and corresponding correlation matrix reveal that, although many assets are negatively correlated with the DXY, BTC shows a lower overall correlation and coherence. This reduced coupling implies that BTC is less influenced by shifts in the dollar strength; it does not exhibit the typical inverse relationship observed in most USD-priced assets. Furthermore, given the high market capitalization of BTC, its lower degree of coherence suggests that investors are not uniformly reallocating away from BTC in response to dollar fluctuations, underscoring its relative independence.
These results support the central hypothesis that if BTC behaves like conventional USD-priced assets, it should display a strong inverse phase relationship with the DXY. Instead, BTC’s low and inconsistent coherence—whether in-phase or out-of-phase—indicates a form of resilience, suggesting that its price dynamics are not dominated by the same factors that influence traditional assets. This resilience may enhance BTC’s potential as a store of value and a hedge against dollar-driven market volatility.
4.3. MWC and PWC Analysis of BTC–DXY
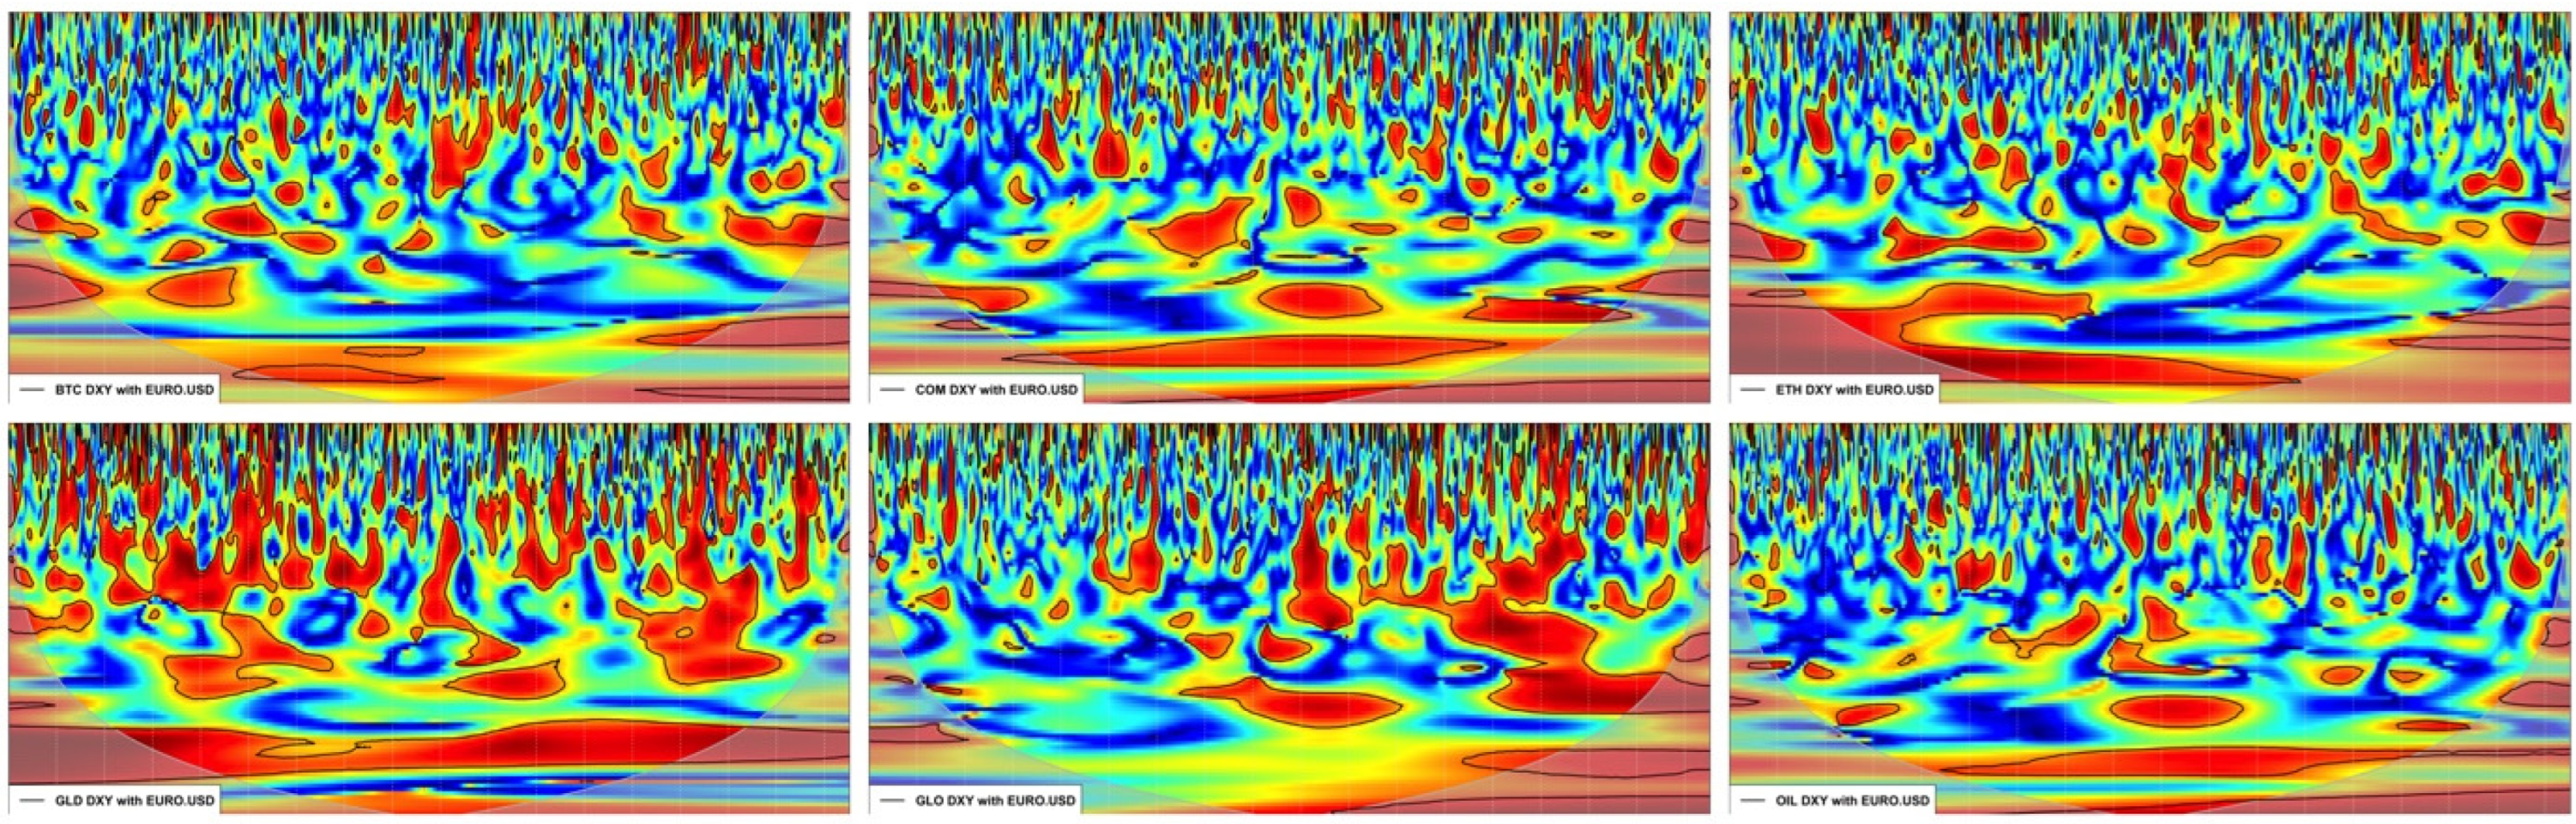
In the grids in Figure 9 and Figure 10 each panel illustrates how BTC (BTC) interacts with the DXY and a third variable—be it a commodity index (COM), gold (GLD), oil (OIL), a global equity benchmark (GLO), Ethereum (ETH), or the euro exchange rate (EURO/USD). The MWC analysis provides a joint view of the three-way relationship across time and frequency, while the PWC analysis “partials out” the third variable’s influence to clarify how much of the BTC–DXY coherence remains independent of that variable’s fluctuations. In line with the study’s goal of assessing BTC’s resilience, these heatmaps help identify whether BTC’s interactions with the dollar are consistently negative (out-of-phase)—mirroring the typical “strong-dollar, weak-asset” paradigm—or whether BTC shows lower or more sporadic coherence, supporting its independence from major USD-priced asset behaviors.
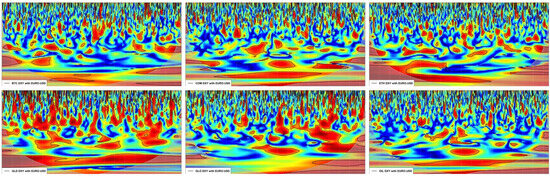
Figure 9.
An MWC heatmap for six distinct pairs (or triplets) of time series. The horizontal axis in each panel represents time, and the vertical axis represents the scale (or approximate frequency). Warm (red) areas indicate high coherence, suggesting stronger co-movement or shared cyclical behavior in that frequency band and time interval. Cooler (blue) areas indicate lower coherence, signifying weaker co-movement. The thick black contours outline regions of statistical significance at the 5% level, and the lighter curved cone delineates the cone of influence, where edge effects may distort the results.
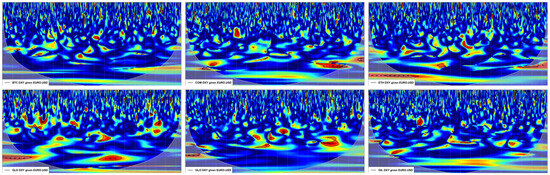
Figure 10.
Grid of PWC heatmaps. Each panel illustrates the time–frequency relationship between two primary variables after “partialling out” the influence of a third variable (EUR/USD). Warmer colors indicate higher partial coherence, while cooler colors denote lower partial coherence. The curved shaded region near the bottom represents the cone of influence (COI), where edge effects reduce reliability.
Visually distinguishing subtle variations in coherence magnitude or phase angles can be challenging in these heatmaps, particularly when multiple variables are considered simultaneously. Consequently, the upcoming sections introduce matrix norms of coherence and exponential decay phase weighting—two quantitative methods designed to measure overall coherence “energy” and systematically weight phase values, respectively.
4.4. Matrix Norms of Coherence
The Frobenius norm analysis of the squared wavelet coherence (rsq) values within the cone of influence, as shown in Table 4, provides a quantitative measure of the overall intensity of the relationship between the DXY and various asset pairs. For the BTC–DXY pair, the Frobenius norm is approximately 190.55, which is similar to the values for COM (186.38) and ETH (189.77), and somewhat higher than for OIL (174.43). In contrast, traditional assets such as gold (GLD) and the Dow Jones global index (GLO) exhibit substantially higher norm values (234.53 and 214.66, respectively), indicating a stronger overall coupling with the dollar.
Table 4.
Frobenius norm analysis of wavelet coherence (rsq) values for various asset pairs. The table reports the overall coherence magnitudes, computed as the Frobenius norm, for three analytical approaches: (i) WTC (BTC–DXY, COM–DXY, etc.), (ii) MWC incorporating EUR/USD, and (iii) PWC controlling for EUR/USD. Higher norm values indicate stronger aggregate coherence, whereas lower values suggest weaker coupling. Notably, the marked reduction in norms under the PWC analysis highlights the significant role of euro-driven dynamics in the observed relationships.
When extending the analysis using MWC that incorporates EUR/USD alongside BTC and the DXY, the overall coherence magnitudes increase—norms range from 233.16 for BTC–DXY with EURO/USD to 277.50 for GLD–DXY with EURO/USD. However, when controlling for the euro using PWC (denoted as “given EURO/USD”), the Frobenius norms drop considerably; for example, BTC–DXY given EURO/USD registers a norm of 119.64. This reduction suggests that a significant portion of the observed coherence in the bivariate analysis is driven by euro-related effects.
It is important to note that the Frobenius norm quantifies the aggregate “energy” or magnitude of coherence but does not capture phase relationships directly. Thus, while a higher norm indicates stronger overall coherence, the relative lower norm for BTC implies that its cumulative coupling with the DXY is less pronounced compared to traditional assets. This finding supports the hypothesis that if BTC is resilient; its price dynamics will be less tightly coupled to dollar movements than those of conventional USD-priced assets.
4.5. Exponential Decay Phase Weighting
The weighted average phase weights obtained from the wavelet coherence analyses provide quantitative measures of how strongly each asset pair exhibits the conventional “strong-dollar, weak-asset” behavior. In the WTC results (Table 5), for instance, traditional assets such as gold (GLD-DXY and GLO-DXY) consistently show higher weighted phase values—ranging from approximately 0.257 at sigma = 0.2 to 0.527 at sigma = 0.5 for GLD-DXY—indicating a pronounced inverse (out-of-phase) relationship with the DXY. In contrast, BTC-DXY exhibits lower weighted phase averages (from 0.147 to 0.309), suggesting that BTC’s phase behavior is less strongly tied to dollar movements. Similarly, the BTC–EURO/USD pair shows weighted averages comparable to BTC-DXY, reinforcing that BTC’s coherence is relatively muted compared to that of conventional assets.
Table 5.
WTC weighted average phase weights. This table presents the weighted average phase weights for asset pairs computed using WTC. Results are shown for four sigma values (0.2, 0.3, 0.4, and 0.5). Higher values indicate a stronger inverse (out-of-phase) relationship with the DXY, while lower values suggest greater resilience.
The multivariate wavelet coherence (MWC) results (Table 6) further reveal that when the euro’s influence is jointly considered with BTC and the DXY, coherence magnitudes remain moderate; for example, BTC–DXY with EURO/USD ranges from 0.145 to 0.291. Meanwhile, the PWC results (Table 7), which control for the EUR/USD pair, show an even more pronounced reduction in coherence for BTC—down to 0.124 at sigma = 0.2 and 0.308 at sigma = 0.5. This reduction across the PWC analysis indicates that much of the inverse relationship observed in the bivariate analysis is attributable to euro-driven effects. The fact that BTC exhibits lower weighted phase metrics compared to conventional assets under partial control supports the hypothesis of BTC’s resilience to dollar movements.
Table 6.
MWC weighted average phase weights with EUR/USD. This table summarizes the weighted average phase weights from the MWC analysis, incorporating BTC, DXY, and EUR/USD simultaneously. The results across sigma values demonstrate the joint influence of euro dynamics on the BTC–DXY relationship.
Table 7.
PWC weighted average phase weights controlling for EUR/USD. This table shows the weighted average phase weights from the PWC analysis, where the effect of the EUR/USD pair is controlled for. The lower values observed here suggest that when euro-driven dynamics are removed, BTC exhibits even weaker inverse coherence with the DXY, supporting the notion of its resilience.
A sensitivity analysis was conducted by systematically varying the decay parameter σ across four values (0.2, 0.3, 0.4, and 0.5). Across all methods (WTC, MWC, and PWC), weighted phase averages increase with higher sigma values due to the less steep exponential decay. However, the relative ranking among asset pairs remains consistent. This robustness suggests that while the absolute weighted phase weights are sensitive to the choice of σ, the comparative differences between BTC and traditional assets persist. Such consistency reinforces the findings that BTC’s phase behavior is distinct and less strongly inversely correlated with the U.S. dollar, thereby lending support to the hypothesis of its resilience.
In summary, the analysis of the WTC results reveals that traditional USD-priced assets—such as gold (GLD–DXY) and global equities (GLO–DXY)—consistently exhibit strong inverse (out-of-phase) relationships with the USD index (DXY), as reflected by higher weighted average phase weights. In contrast, BTC (BTC–DXY) shows lower and more sporadic weighted phase averages, suggesting that its price dynamics are less tightly coupled with dollar movements. This finding is consistent across multiple sigma values in the sensitivity analysis, where the relative ranking among asset pairs remains robust despite changes in the absolute weighted phase metrics.
Furthermore, when extending the analysis to incorporate the influence of the euro—via MWC and PWC analyses—the overall coherence magnitudes increase in the MWC framework but drop significantly in the PWC analysis. The marked reduction in coherence for BTC when controlling for the EUR/USD pair indicates that a considerable part of the inverse relationship observed in bivariate analysis is driven by euro dynamics. Notably, even under partial control, BTC continues to exhibit lower coherence compared to conventional assets.
These findings collectively support the central hypothesis that BTC is relatively resilient to dollar movements. While most traditional assets display a strong, consistent inverse (out-of-phase) relationship with the DXY, BTC’s lower and less consistent coherence implies that its price dynamics are not as strongly dictated by the global reserve currency. This relative decoupling suggests that BTC could function as a potential store of value or hedge against dollar fluctuations—an insight of particular relevance for investors and policy makers seeking diversification and stability in an increasingly volatile financial landscape.
It is important to clarify that framing Bitcoin purely as a “diversifier”, “hedge”, or “safe haven” against the DXY, as in (Bouri et al., 2017b), can be overly simplistic. Unlike a single, tradable asset, the DXY is a composite index reflecting the dollar’s value against a basket of major currencies. As a result, short-term fluctuations or systematic shifts in global currency markets can influence DXY in ways that do not mirror the risk-return relationships of conventional assets. Given this complexity, our analysis focuses on resilience rather than labeling Bitcoin strictly as a hedge or safe haven. In doing so, we underscore that Bitcoin’s relationships with the broader financial ecosystem, including its interplay with currency indexes, require nuance beyond the traditional hedge/diversifier framework.
5. Conclusions
This study originated from the need to examine whether BTC, a prominent digital asset, is truly resilient to movements of the global reserve currency represented in the US dollar index (DXY). By building on and extending the existing literature on BTC–USD dynamics (Baur et al., 2018; Mokni & Ajmi, 2021; Zitis et al., 2023), the findings of this study show that, while traditional USD-priced assets (such as gold and global equities) display strong and sustained inverse (out-of-phase) coherence with the dollar, BTC exhibits lower, more sporadic coherence. This sporadic coupling—reinforced by partial coherence analyses controlling for the EUR/USD pair—suggests that BTC is not merely acting like a typical “strong-dollar, weak-asset” as suggested by theory (Clements & Fry, 2008).
The primary contribution of this study from policy and regulatory perspectives lies in the explicit identification of BTC’s unique resilience characteristics. From a monetary policy standpoint, BTC’s observed resilience to USD fluctuations implies reduced “flight-to-safety” reactions during USD shortages or periods of uncertainty regarding USD supply, indicating storage-of-value characteristics. Policymakers and financial regulators should recognize that BTC’s partial decoupling from traditional currency dynamics may mitigate some systemic risks, suggesting its potential utility as a diversifier in broader financial portfolios. Regulators, especially in non-US jurisdictions, may find BTC appealing as its lower coherence with USD fluctuations implies reduced vulnerability to exchange-rate shocks, providing relative stability compared to US-dominated local debts and domestic-currency assets. Institutional investors, recognizing the unique composition of the DXY, may interpret BTC’s resilience as indicative of systematic linkage to USD-priced assets and reduced sensitivity to non-USD assets. Consequently, BTC may serve as an effective diversifier, mitigating exposure to both US-centric risks and foreign economic turbulence.
Beyond methodological precision, this research clarifies the scope and limitations of its approach. First, the choice of the Morlet wavelet and an upper scaling factor of six is informed by prior wavelet studies (Smolo et al., 2024) but may be further tested with alternative wavelet families or scale parameters for robustness. Second, although the Frobenius norm effectively condenses overall coherence “energy”, it necessarily simplifies rich time–frequency detail into a single scalar metric. Future research could expand upon this dimension, potentially employing rolling-window wavelet analyses to explore how evolving macroeconomic or political shocks (such as shifts in U.S. monetary policy post-2020) might reshape BTC’s coherence patterns. Finally, further research could explore potential lagged coherence and predictive causality relationships between BTC and the DXY more explicitly. Moreover, it would be insightful to investigate the potential that distortive effect lagged relationships might impose on medium-term and long-term coherence analyses, necessitating methodologies that explicitly differentiate immediate coherence from lagged coherence.
Funding
This research received no external funding.
Institutional Review Board Statement
Not applicable.
Informed Consent Statement
Not applicable.
Data Availability Statement
The original data presented in the study are available from the repositories shown in the Methodology section. The raw data supporting the conclusions of this article will be made available by the authors on request.
Acknowledgments
I would like to express my sincere gratitude to Ahmet Aysan for his invaluable guidance, support, and encouragement throughout this work. His insights and expertise have been instrumental in shaping my research. I am also deeply grateful to Ruslan Nagayev for his constructive feedback, mentorship, and continuous support, which have significantly contributed to the development of this study. Additionally, I extend my heartfelt appreciation to Atta Ul Mustafa for his unwavering assistance and valuable discussions, which have greatly enriched my work. Their collective support and contributions have been truly invaluable, and I am sincerely thankful for their time, efforts, and dedication.
Conflicts of Interest
The author declares no conflicts of interest.
Abbreviations
The following abbreviations are used in this manuscript:
| BTC | Bitcoin |
| COI | Cone of Influence |
| COM | S&P GSCI Commodity Index |
| DXY | U.S. Dollar Index (ICE) |
| ETH | Ethereum (Ether in USD) |
| EUR/USD | Euro to U.S. Dollar Exchange Rate |
| GLD | Gold Bullion LBM (USD/t oz) |
| GLO | Dow Jones Global Index |
| MWC | Multivariate Wavelet Coherence |
| OIL | Europe Brent Spot Price FOB (USD/Bbl) |
| PWC | Partial Wavelet Coherence |
| USD | U.S. Dollar |
| WPS | Wavelet Power Spectrum |
| WTC | Wavelet Transform Coherence |
References
- Adams, Z., & Glück, T. (2015). Financialization in commodity markets: A passing trend or the new normal? Journal of Banking & Finance, 60, 93–111. [Google Scholar] [CrossRef]
- Adrian, T., & Xie, P. (2020). The Non-U.S. bank demand for U.S. dollar assets. Working Paper No. 2020/101. IMF. [Google Scholar] [CrossRef]
- Ahmadova, A., Guliyev, T., & Aliyev, K. (2024). The relationship between Bitcoin and Nasdaq, U.S. dollar index and commodities. International Journal of Energy Economics and Policy, 14(1), 281–289. [Google Scholar] [CrossRef]
- Al-Mansouri, E. H., Aysan, A. F., & Nagayev, R. (2025). Beyond the Buzz: A measured look at Bitcoin’s viability as money. Journal of Risk and Financial Management, 18(1), 39. [Google Scholar] [CrossRef]
- Aysan, A. F., & Kayani, F. N. (2022). China’s transition to a digital currency does it threaten dollarization? Asia and the Global Economy, 2(1), 100023. [Google Scholar] [CrossRef]
- Ballocchi, G., & d’Hautefort, H. (2016). Overcoming the notion of a single reference currency: A currency basket approach. CFA Institute Research Foundation. [Google Scholar] [CrossRef]
- Bao, H. H. G., & Le, H. P. (2021). The prominence of USD/CNY in China-EU and China-UK trade. The Journal of Asian Finance, Economics and Business, 8(11), 47–66. [Google Scholar] [CrossRef]
- Baur, D. G., Dimpfl, T., & Kuck, K. (2018). Bitcoin, Gold and the US Dollar—A replication and extension. Finance Research Letters, 25, 103–110. [Google Scholar] [CrossRef]
- Benigno, P., Schilling, L. M., & Uhlig, H. (2022). Cryptocurrencies, currency competition, and the impossible trinity. Journal of International Economics, 136, 103601. [Google Scholar] [CrossRef]
- Bertaut, C., von Beschwitz, B., & Curcuru, S. (2021, October). The international role of the U.S. dollar. Available online: https://www.federalreserve.gov/econres/notes/feds-notes/the-international-role-of-the-u-s-dollar-20211006.html (accessed on 18 January 2025).
- Bertaut, C., von Beschwitz, B., & Curcuru, S. (2023, June). The international role of the U.S. dollar’ post-covid edition. Available online: https://www.federalreserve.gov/econres/notes/feds-notes/the-international-role-of-the-us-dollar-post-covid-edition-20230623.html (accessed on 26 February 2025).
- Beschwitz, B. V., Collins, C. G., & Datta, D. D. (2019, January). Revisions to the federal reserve dollar indexes. FEDS Notes No. 2019-01-15. The Federal Reserve Board of Governors. [Google Scholar] [CrossRef]
- Bhuiyan, R. A., Husain, A., & Zhang, C. (2021). A wavelet approach for causal relationship between Bitcoin and conventional asset classes. Resources Policy, 71, 101971. [Google Scholar] [CrossRef]
- Bouri, E., Jalkh, N., Molnár, P., & Roubaud, D. (2017a). Bitcoin for energy commodities before and after the December 2013 crash: Diversifier, hedge or safe haven? Applied Economics, 49(50), 5063–5073. [Google Scholar] [CrossRef]
- Bouri, E., Molnár, P., Azzi, G., Roubaud, D., & Hagfors, L. I. (2017b). On the hedge and safe haven properties of Bitcoin: Is it really more than a diversifier? Finance Research Letters, 20, 192–198. [Google Scholar] [CrossRef]
- Celeste, V., Corbet, S., & Gurdgiev, C. (2020). Fractal dynamics and wavelet analysis: Deep volatility and return properties of Bitcoin, Ethereum and Ripple. The Quarterly Review of Economics and Finance, 76, 310–324. [Google Scholar] [CrossRef]
- Chaboud, A., Rime, D., & Sushko, V. (2023). Chapter 12: The foreign exchange market. In R. Gürkaynak, & J. Wright (Eds.), Research handbook of financial markets. Research handbooks in money and finance. Edward Elgar Publishing. Available online: https://www.elgaronline.com/edcollchap/book/9781800375321/book-part-9781800375321-20.xml (accessed on 27 February 2025).
- Chen, Y. (2023). The impact of Russia’s ‘De Dollarization’ on the international status of the US Dollar. Academic Journal of Business & Management, 5(2), 17–21. [Google Scholar] [CrossRef]
- Chernilevskaya, K. E. (2021). Internationalization of Renminbi as a function of China’s foreign exchange policy. RUDN Journal of Political Science, 23(2), 233–242. [Google Scholar] [CrossRef]
- Clements, K. W., & Fry, R. (2008). Commodity currencies and currency commodities. Resources Policy, 33(2), 55–73. [Google Scholar] [CrossRef]
- Disli, M., Nagayev, R., Salim, K., Rizkiah, S. K., & Aysan, A. F. (2021). In search of safe haven assets during COVID-19 pandemic: An empirical analysis of different investor types. Research in International Business and Finance, 58, 102882. [Google Scholar] [CrossRef]
- Dobija, M. (2014). The global currency area a way to constructively end the era of reserve currency. Modern Economy, 5(4), 289–302. [Google Scholar] [CrossRef]
- Dyhrberg, A. H. (2016a). Bitcoin, Gold and the Dollar—A GARCH volatility analysis. Finance Research Letters, 16, 85–92. [Google Scholar] [CrossRef]
- Dyhrberg, A. H. (2016b). Hedging capabilities of Bitcoin. Is it the virtual gold? Finance Research Letters, 16, 139–144. [Google Scholar] [CrossRef]
- Flach, L., Heiland, I., Larch, M., Steininger, M., & Teti, F. A. (2024). Quantifying the partial and general equilibrium effects of sanctions on Russia. Review of International Economics, 32(1), 281–323. [Google Scholar] [CrossRef]
- Gelos, G., Patelli, P., & Shim, I. (2024). The US dollar and capital flows to EMEs. BIS quarterly review. Bank for International Settlements. Available online: https://www.bis.org/publ/qtrpdf/r_qt2409d.htm (accessed on 26 February 2025).
- Georgiadis, G., Müller, G. J., & Schumann, B. (2023). Dollar trinity and the global financial cycle. DIW Berlin discussion paper No. 2058. Social Science Research Network. [Google Scholar] [CrossRef]
- Goldberg, L. S., Lerman, R., & Reichgott, D. (2022). The U.S. Dollar’s global roles: Revisiting where things stand. Federal Reserve Bank of New York Liberty Street Economics. Available online: https://libertystreeteconomics.newyorkfed.org/2022/07/the-u-s-dollars-global-roles-revisiting-where-things-stand/ (accessed on 26 February 2025).
- Grinsted, A., Moore, J. C., & Jevrejeva, S. (2004). Application of the cross wavelet transform and wavelet coherence to geophysical time series. Nonlinear Processes in Geophysics, 11(5/6), 561–566. [Google Scholar] [CrossRef]
- Hassan, T. A., & Zhang, T. (2021). The economics of currency risk. Annual Review of Economics, 13, 281–307. [Google Scholar] [CrossRef]
- Iancu, A., Anderson, G., Ando, S., Boswell, E., Gamba, A., Hakobyan, S., Lusinyan, L., Meads, N., & Wu, Y. (2022). Reserve currencies in an evolving international monetary system. Open Economies Review, 33(5), 879–915. [Google Scholar] [CrossRef]
- Intercontinental Exchange. (2025). U.S. dollar index. Available online: https://www.ice.com/publicdocs/ICE_USDX_Brochure.pdf (accessed on 27 January 2025).
- Kang, S. H., Yoon, S.-M., Bekiros, S., & Uddin, G. S. (2020). Bitcoin as hedge or safe haven: Evidence from stock, currency, bond and derivatives markets. Computational Economics, 56(2), 529–545. [Google Scholar] [CrossRef]
- Khan, M. K., Teng, J.-Z., & Khan, M. I. (2019). Cointegration between macroeconomic factors and the exchange rate USD/CNY. Financial Innovation, 5(1), 5. [Google Scholar] [CrossRef]
- Komath, A. (2022). Bancor comes of age: A case for an Indian Bitcoin reserve. India Quarterly: A Journal of International Affairs, 78(1), 121–142. [Google Scholar] [CrossRef]
- Kubát, M. (2015). Virtual currency Bitcoin in the scope of money definition and store of value. Procedia Economics and Finance, 30, 409–416. [Google Scholar] [CrossRef]
- Kunaifi, A., Fawa’id, M. W., & Faujiah, A. (2022). Cryptocurrency and the future of the world currency. Islamic Research, 5(1), 86–97. [Google Scholar] [CrossRef]
- Laser, F. H., & Weidner, J. (2022). Currency compositions of international reserves and the Euro crisis. Open Economies Review, 33(5), 917–944. [Google Scholar] [CrossRef]
- Mikhail, Z. (2018). The instruments to reform the world system of currencies: Internationalising the currencies of the BRiCS. Review of Business and Economics Studies, 6(3), 19–28. [Google Scholar] [CrossRef]
- Mises, L. V. (1953). The theory of money and credit (493p). Yale University Press. [Google Scholar]
- Mokni, K., & Ajmi, A. N. (2021). Cryptocurrencies vs. US dollar: Evidence from causality in quantiles analysis. Economic Analysis and Policy, 69, 238–252. [Google Scholar] [CrossRef]
- Nguyen, L. T. M., & Nguyen, P. T. (2024). Determinants of cryptocurrency and decentralized finance adoption—A configurational exploration. Technological Forecasting and Social Change, 201, 123244. [Google Scholar] [CrossRef]
- Noreng, O. (2004). Oil, the Euro, & the Dollar. Journal of Energy and Development, 30(1), 53–80. [Google Scholar]
- Park, H., & Son, J. C. (2022). Dollarization, inflation and foreign exchange markets: A cross-country analysis. International Journal of Finance & Economics, 27(3), 2724–2736. [Google Scholar] [CrossRef]
- Pukthuanthong, K., & Roll, R. (2011). Gold and the dollar (and the Euro, Pound, and Yen). Journal of Banking & Finance, 35(8), 2070–2083. [Google Scholar] [CrossRef]
- Shao, J., & Mao, Y. (2023). Research of willingness to use digital currency in international shipping—Based on operations research theory. In 2023 IEEE 3rd International Conference on Information Technology, Big Data and Artificial Intelligence (ICIBA) (Vol. 3, pp. 1430–1434). IEEE. [Google Scholar] [CrossRef]
- Siddiqui, K. (2020). The US dollar and the world economy: A Critical Review. Athens Journal of Business & Economics, 6(1), 21–43. [Google Scholar]
- Smolo, E., Nagayev, R., Jahangir, R., & Tarazi, C. S. C. (2024). Resilience amidst Turmoil: A multi-resolution analysis of portfolio diversification in emerging markets during global financial and health crises. Journal of Asset Management, 25(1), 51–69. [Google Scholar] [CrossRef]
- Sun, X., Lu, X., Yue, G., & Li, J. (2017). Cross-Correlations between the US monetary policy, US dollar index and crude oil market. Physica A: Statistical Mechanics and Its Applications, 467, 326–344. [Google Scholar] [CrossRef]
- Urquhart, A. (2016). The inefficiency of Bitcoin. Economics Letters, 148, 80–82. [Google Scholar] [CrossRef]
- Wang, M., Liu, J., & Yang, B. (2024). Does the strength of the US dollar affect the interdependence among currency exchange rates of RCEP and CPTPP countries? Finance Research Letters, 62, 105110. [Google Scholar] [CrossRef]
- Wray, L. R. (2024). Modern money theory. Palgrave Macmillan. [Google Scholar] [CrossRef]
- Zitis, P. I., Kakinaka, S., Umeno, K., Hanias, M. P., Stavrinides, S. G., & Potirakis, S. M. (2023). Investigating dynamical complexity and fractal characteristics of Bitcoin/US Dollar and Euro/US Dollar exchange rates around the COVID-19 outbreak. Entropy, 25(2), 214. [Google Scholar] [CrossRef] [PubMed]

Disclaimer/Publisher’s Note: The statements, opinions and data contained in all publications are solely those of the individual author(s) and contributor(s) and not of MDPI and/or the editor(s). MDPI and/or the editor(s) disclaim responsibility for any injury to people or property resulting from any ideas, methods, instructions or products referred to in the content. |
© 2025 by the author. Licensee MDPI, Basel, Switzerland. This article is an open access article distributed under the terms and conditions of the Creative Commons Attribution (CC BY) license (https://creativecommons.org/licenses/by/4.0/).