
Hawthorn Juice Simulation System for Pectin and Polyphenol Adsorption Behavior: Kinetic Modeling Properties and Identification of the Interaction Mechanism

Abstract
1. Introduction
2. Materials and Methods
2.1. Materials
2.2. Hawthorn Pectin (HP) Extraction and Purification
2.3. Chemical Composition Analysis
2.3.1. Monosaccharide Determination
2.3.2. Uronic Acid Determination
2.3.3. Total Sugar Determination
2.3.4. Degree of Methyl Esterification Determination
2.3.5. High Performance Gel Permeation Chromatography
2.4. Adsorption Experiments
2.5. Adsorption Model Fitting
2.5.1. Adsorption Kinetics Model Fitting
2.5.2. Adsorption Isotherm Model Fitting
2.6. Characterization of Interaction between HP and Polyphenols
2.6.1. Turbidity Analysis
2.6.2. Dynamic Light Scattering (DLS) Analysis
2.6.3. Scanning Electron Microscope (SEM) Analysis
2.6.4. UV-VIS Spectrum Analysis
2.6.5. Fourier Transform Infrared Spectroscopy (FT-IR) Analysis
2.6.6. Isothermal Titration Calorimetry (ITC) Analysis
2.7. Statistical Analysis
3. Results
3.1. Characterization of Hawthorn Pectin
3.2. Adsorption Experiments Analysis of Different Polyphenols
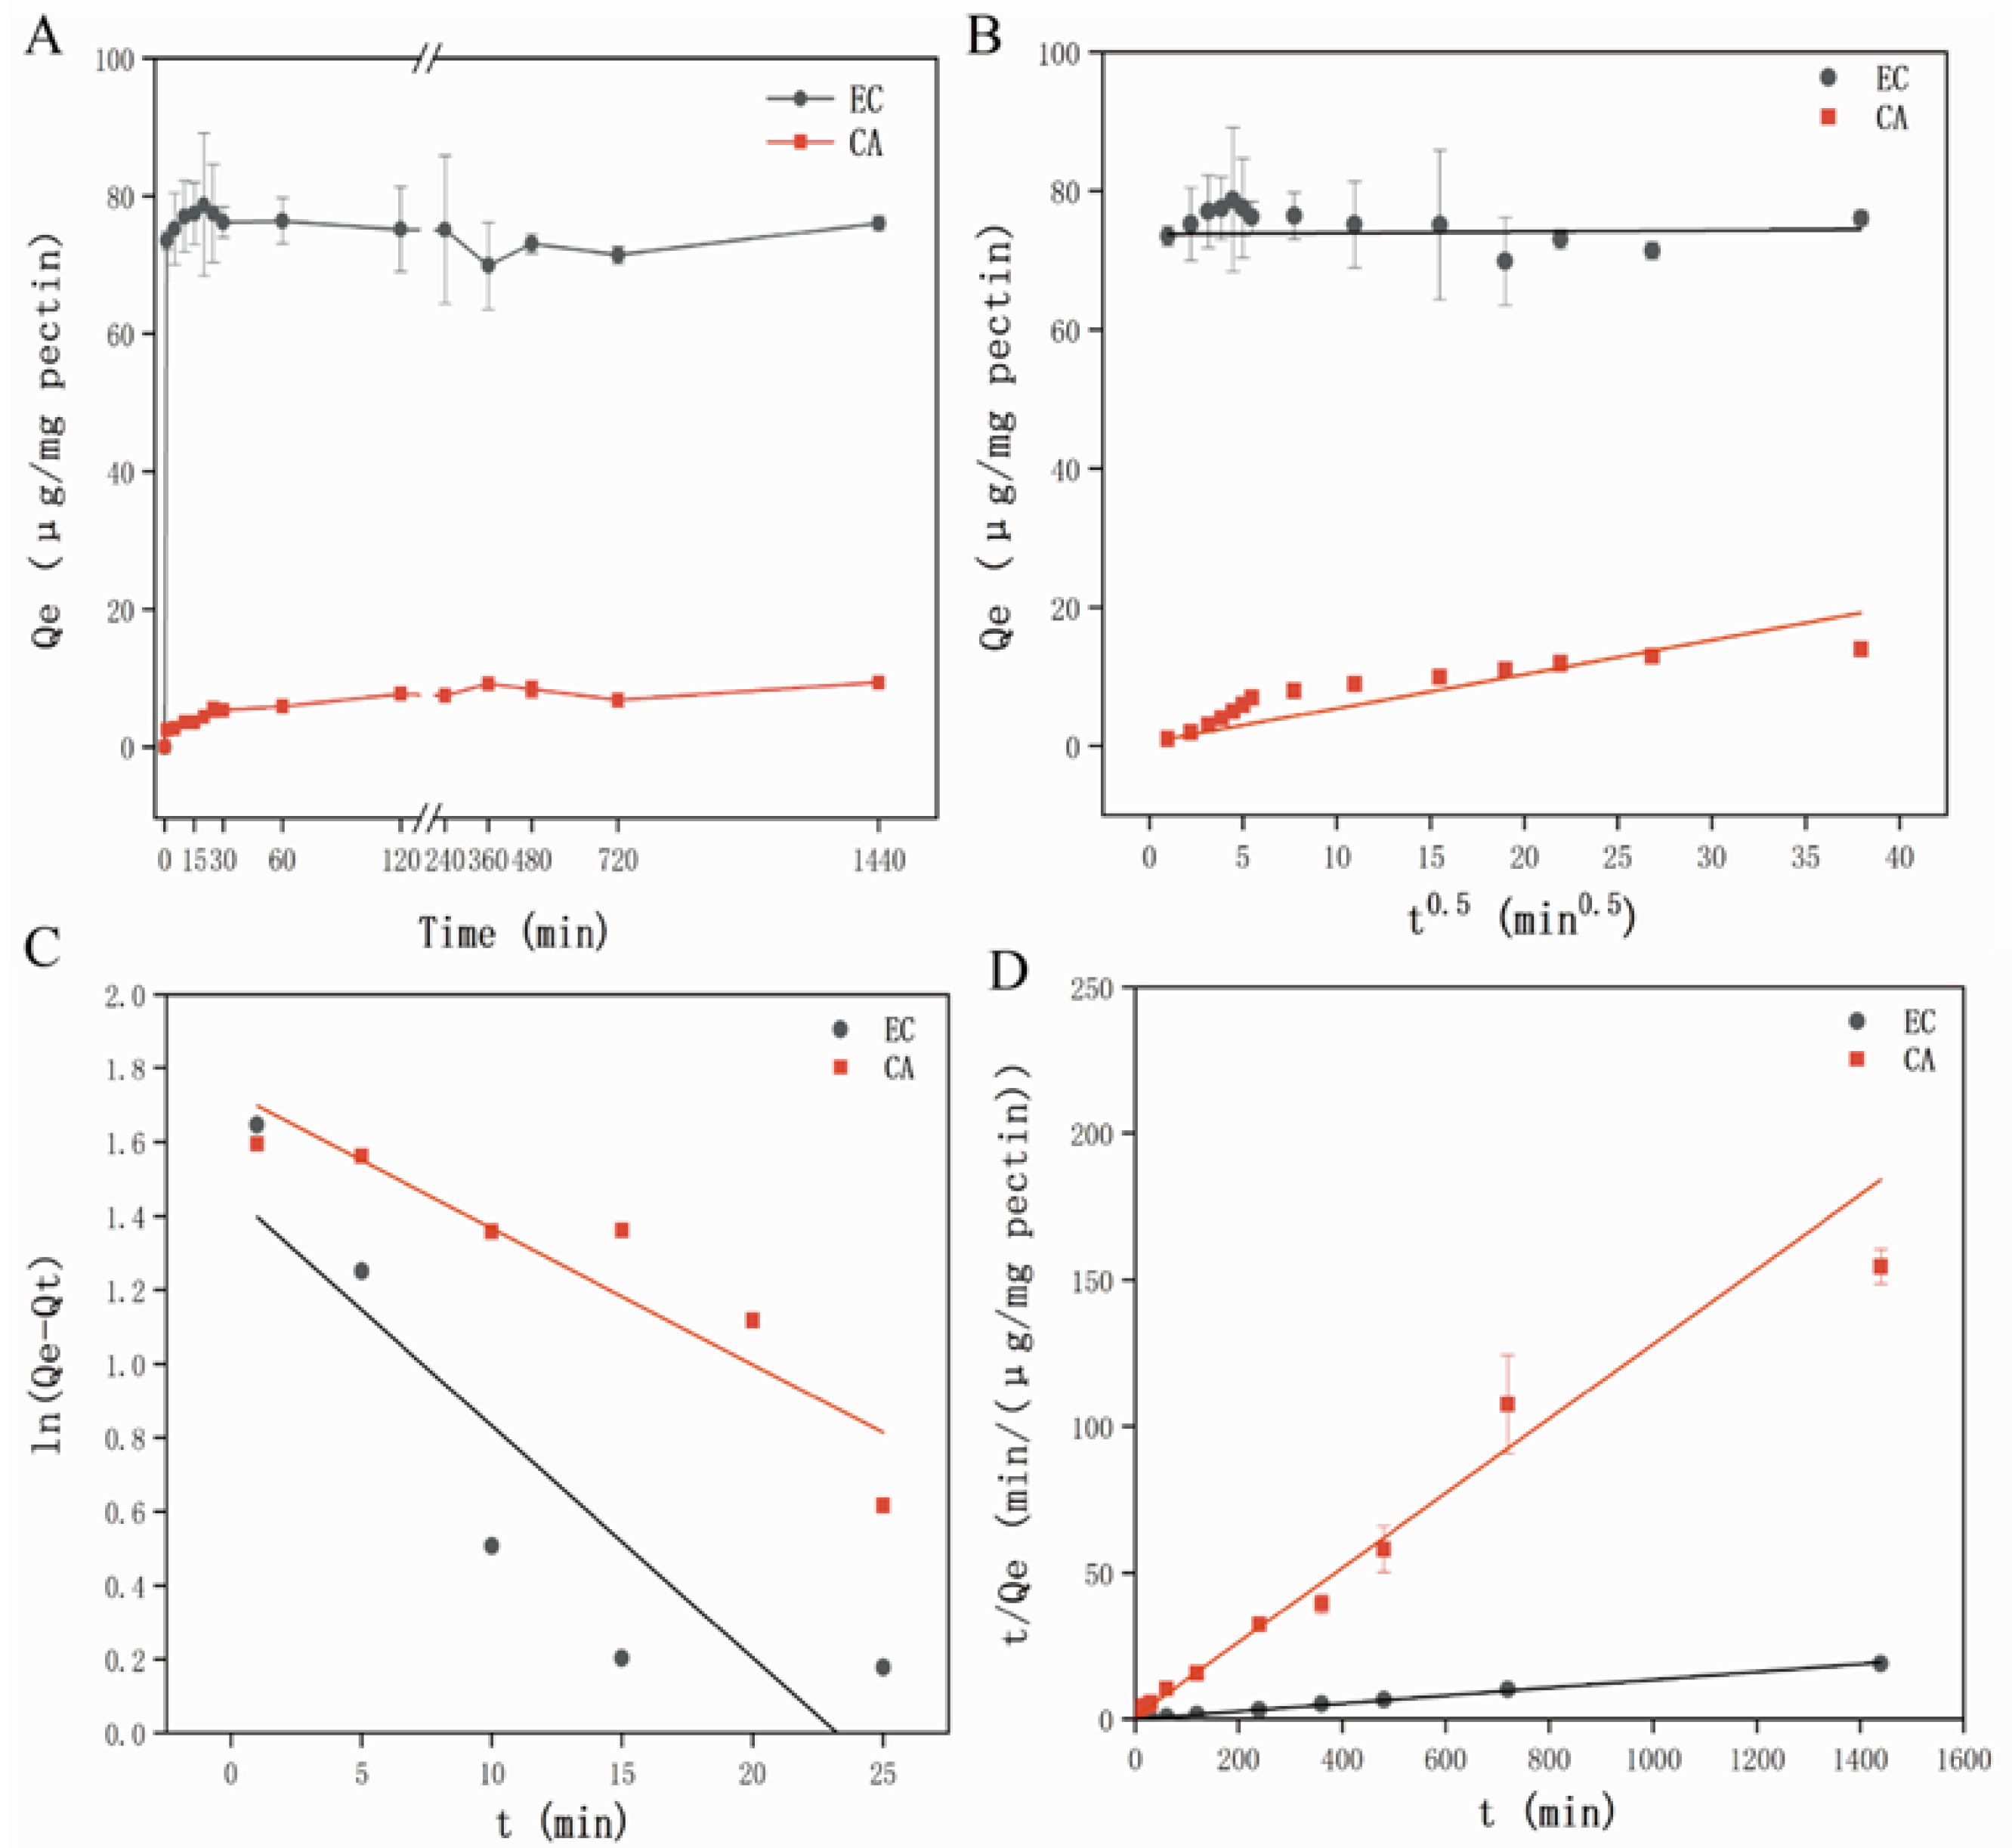
3.2.1. Adsorption Kinetics Analysis
Study on Adsorption Kinetics
Adsorption Kinetics Model Fitting Analysis
3.2.2. Adsorption Isotherm Models Analysis
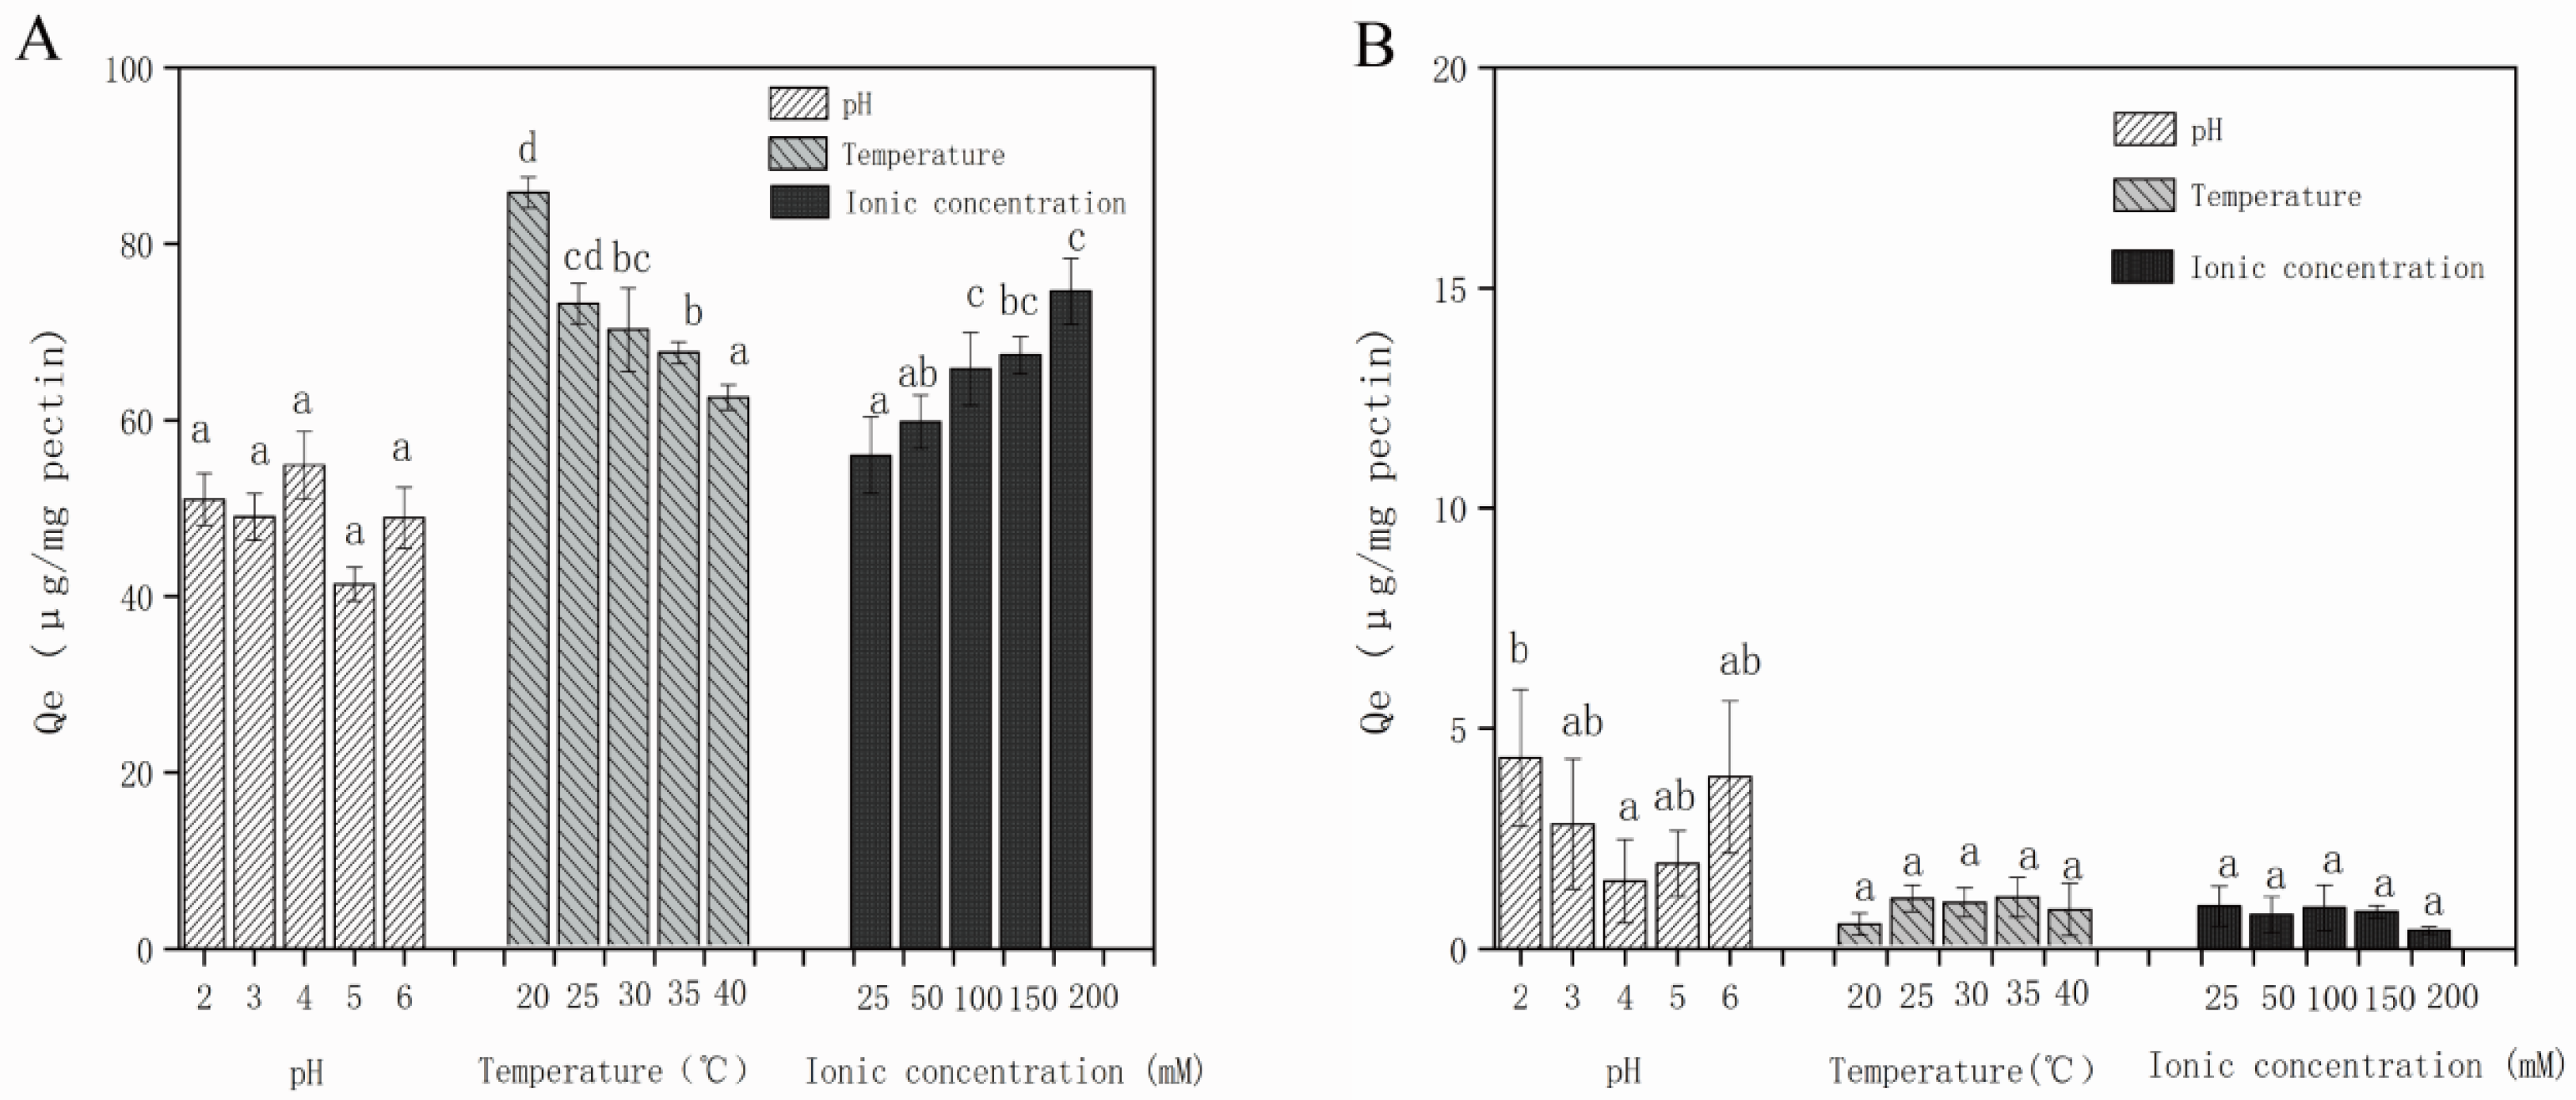
3.2.3. Effect of Solution Conditions on Adsorption Capacity of Different Polyphenols
3.3. Turbidity Analysis
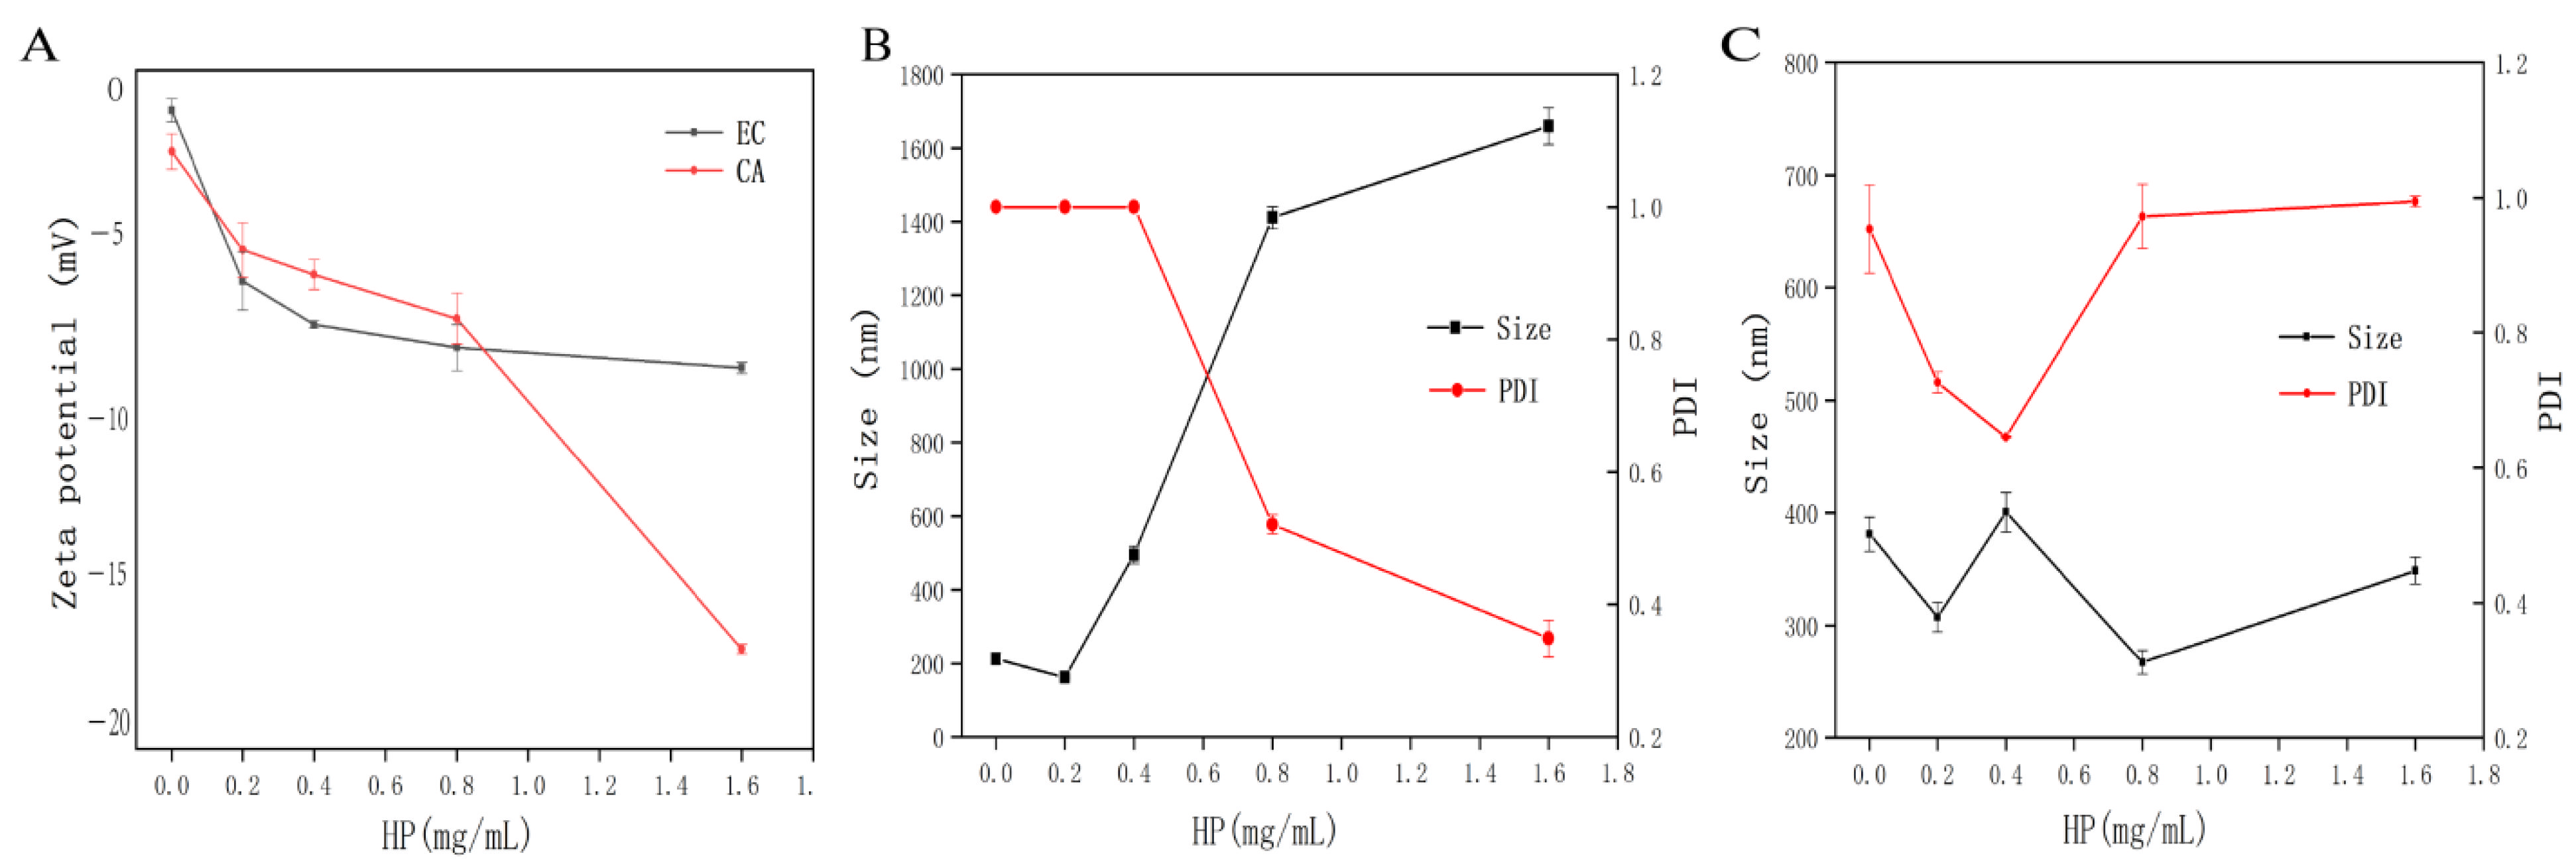
3.4. DLS Analysis
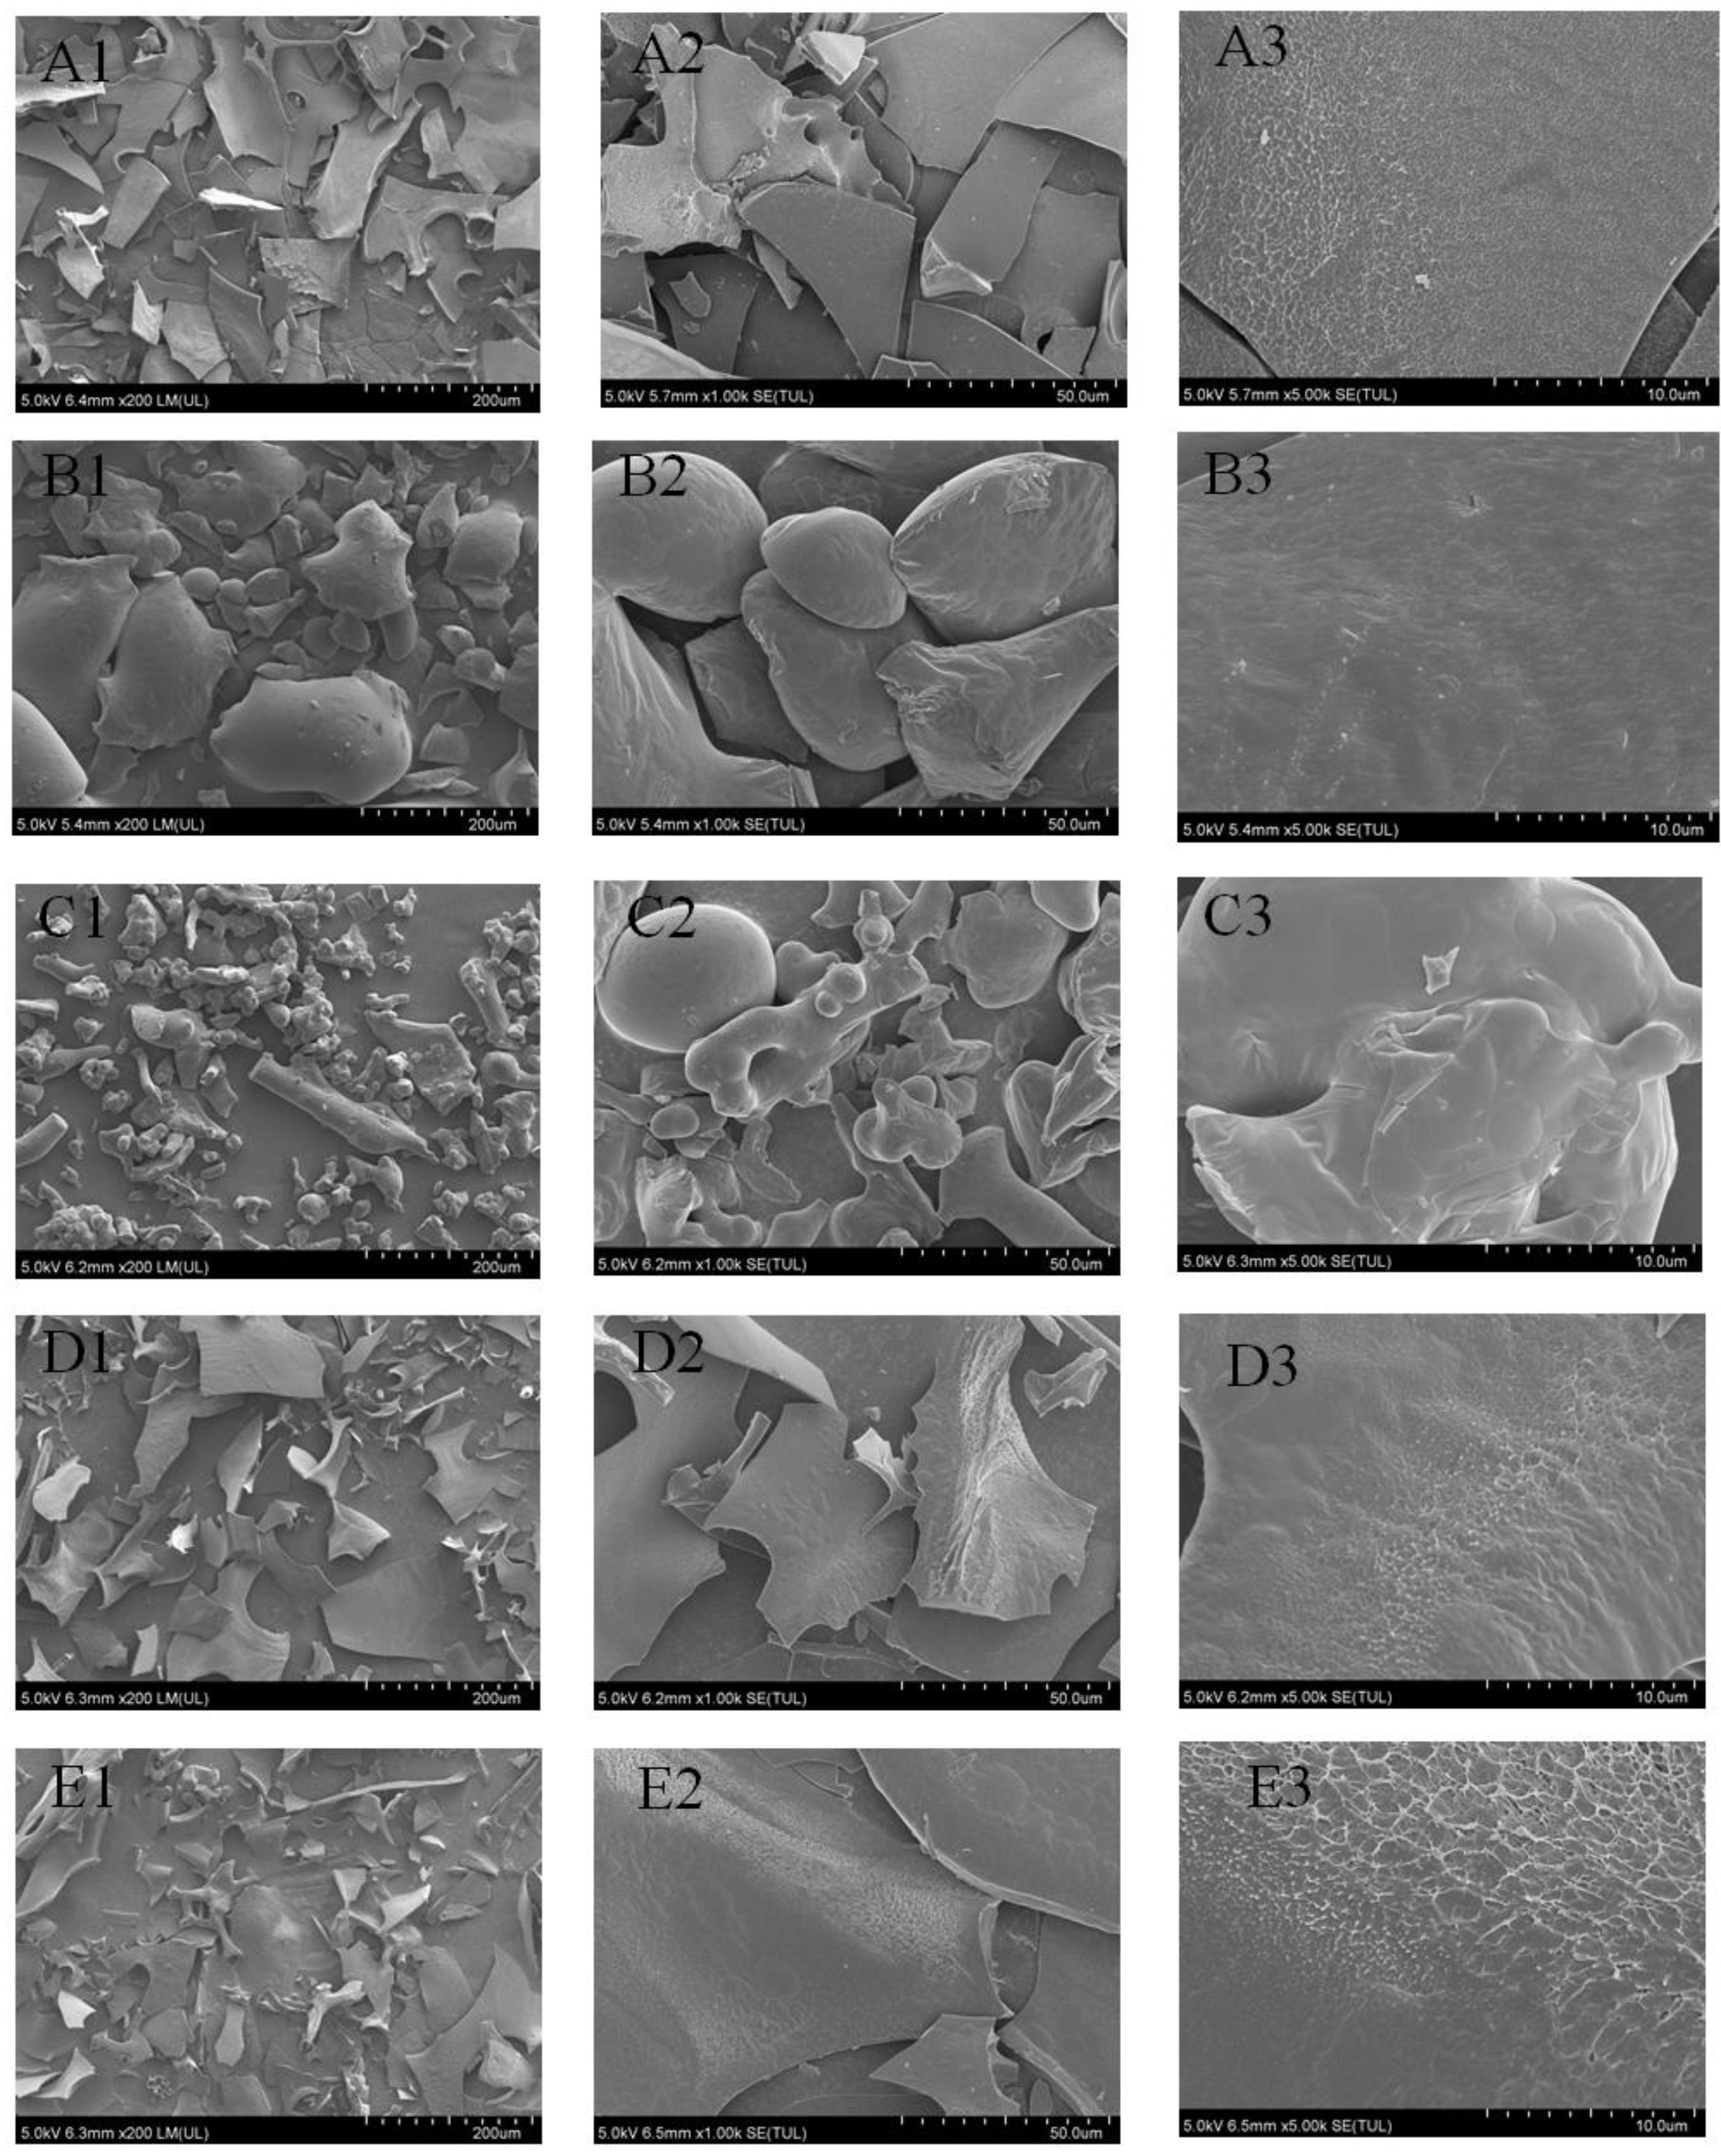
3.5. SEM Analysis
3.6. UV-VIS Spectrum Analysis
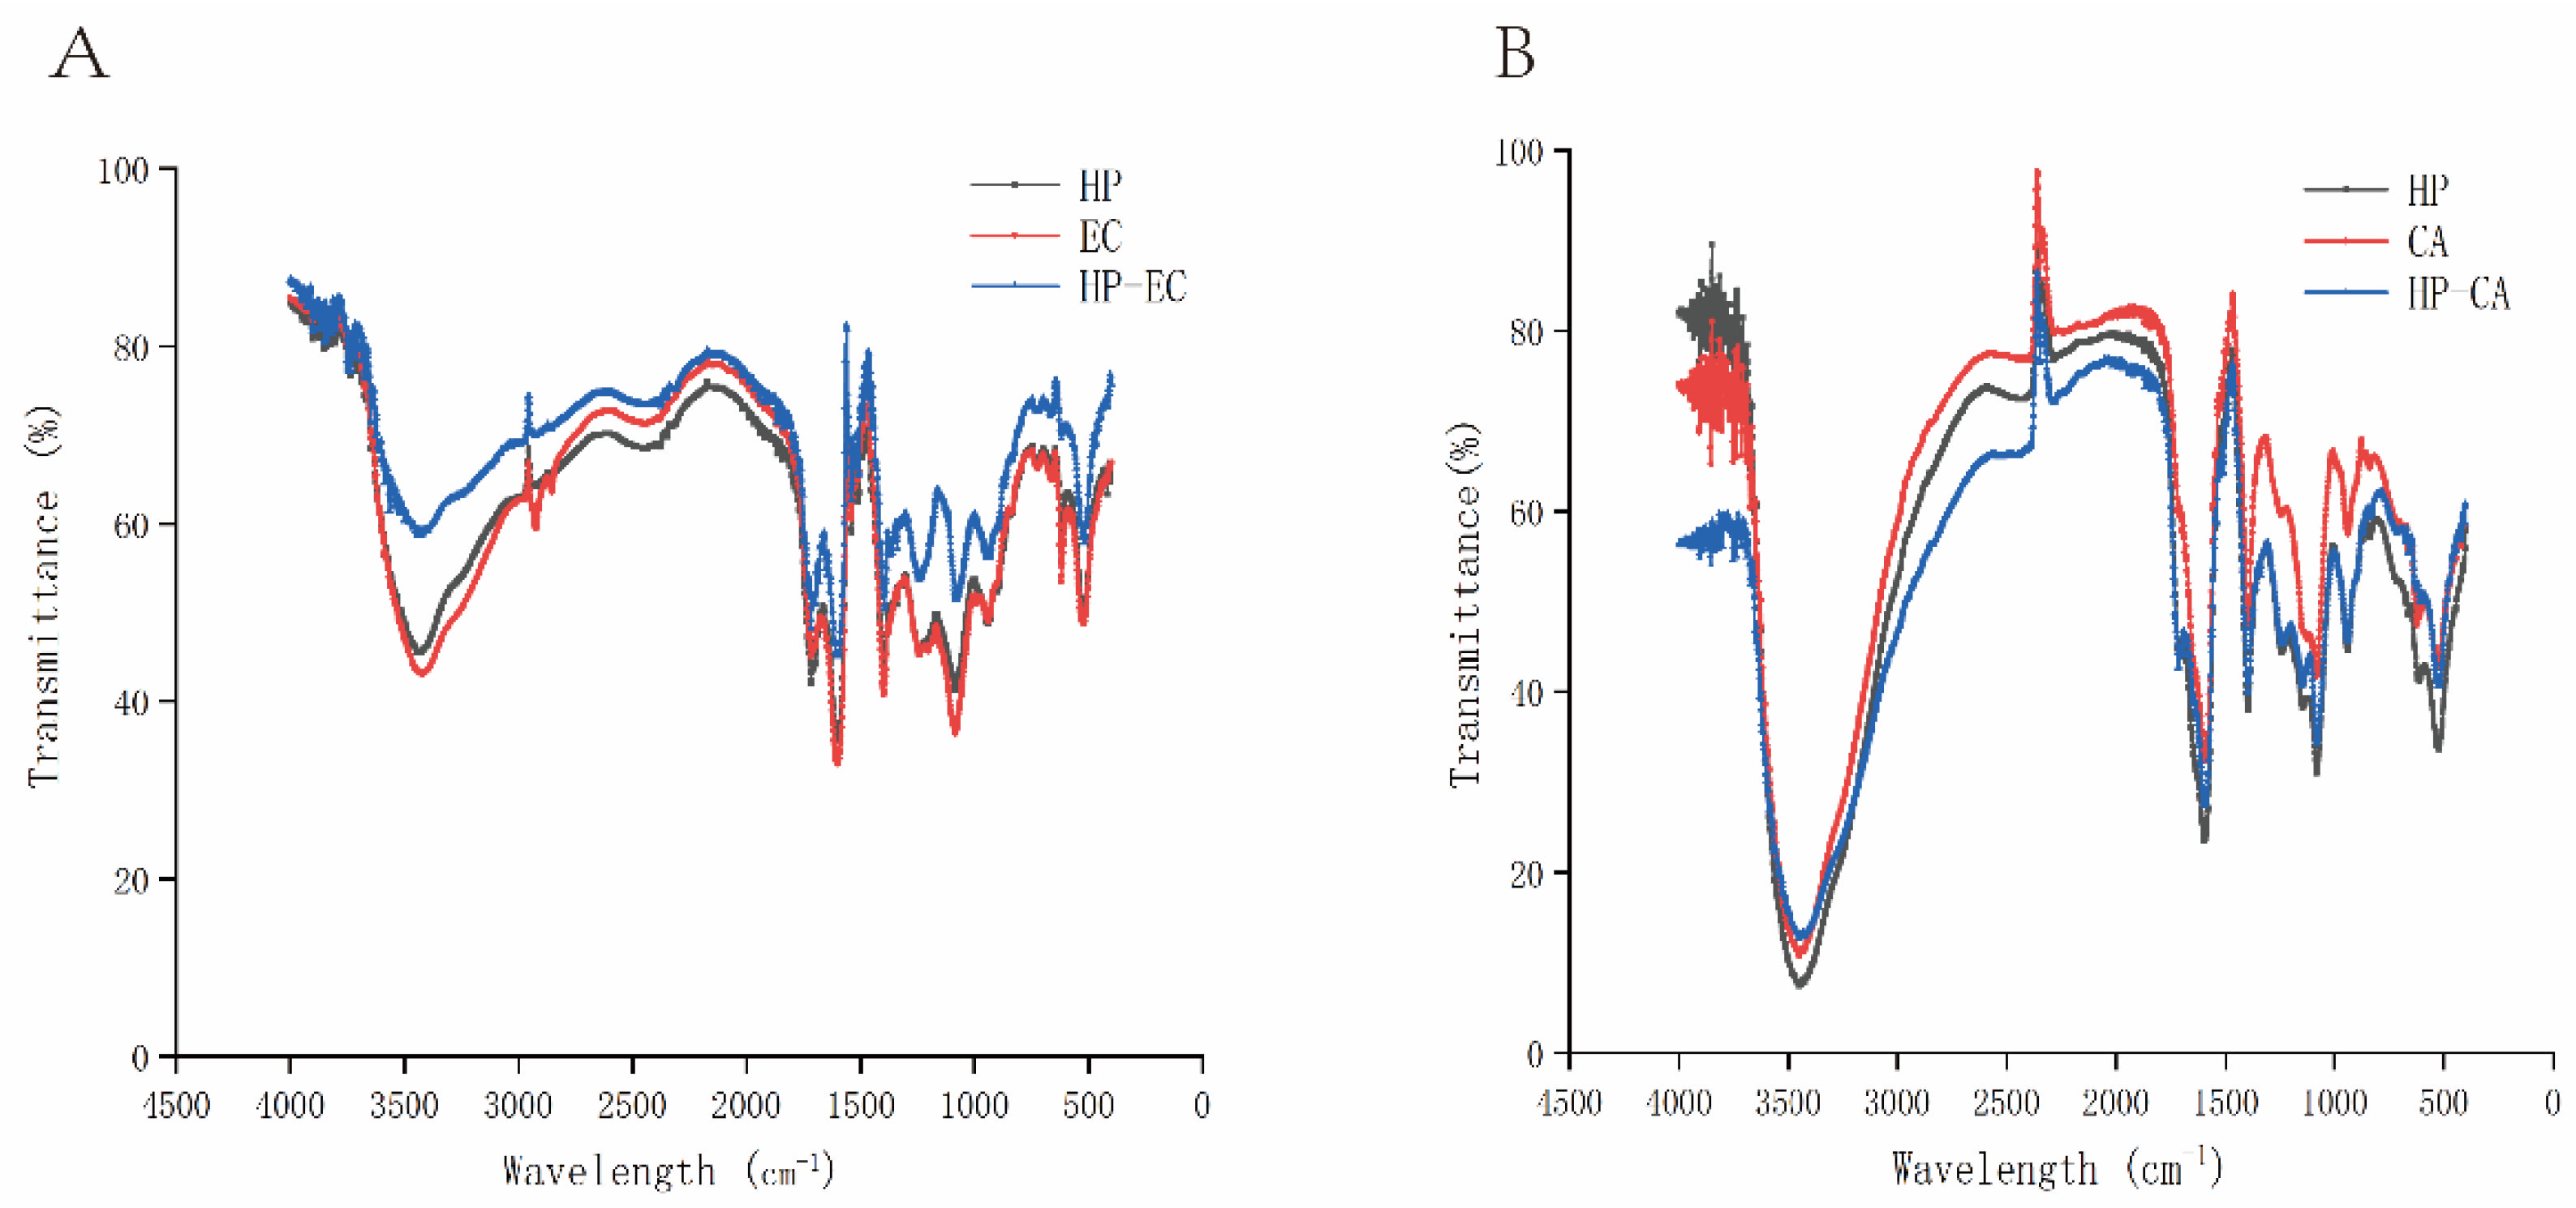
3.7. FT-IR Analysis
3.8. ITC Analysis
4. Conclusions
Supplementary Materials
Author Contributions
Funding
Institutional Review Board Statement
Informed Consent Statement
Data Availability Statement
Conflicts of Interest
Abbreviations
| HP | hawthorn pectin |
| EC | epicatechin |
| CA | chlorogenic acid |
| HP-EC mixture | the mixture of hawthorn pectin and epicatechin |
| HP-CA mixture | the mixture of hawthorn pectin and chlorogenic acid. |
References
- Li, L.; Gao, X.L.; Liu, J.G.; Chitrakar, B.; Wang, B.; Wang, Y.C. Hawthorn pectin: Extraction, function and utilization. Curr. Res. Food Sci. 2021, 4, 429–435. [Google Scholar] [CrossRef]
- Rababa’h, A.M.; Al Yacoub, O.N.; El-Elimat, T.; Rabab’ah, M.; Altarabsheh, S.; Deo, S.; Al-Azayzih, A.; Zayed, A.; Alazzam, S.; Alzoubi, K.H. The effect of hawthorn flower and leaf extract (Crataegus spp.) on cardiac hemostasis and oxidative parameters in Sprague Dawley rats. Heliyon 2020, 6, e04617. [Google Scholar] [CrossRef]
- Ma, L.; Xu, G.B.; Tang, X.Y.; Zhang, C.; Zhao, W.; Wang, J.; Chen, H. Anti-cancer potential of polysaccharide extracted from hawthorn (Crataegus.) on human colon cancer cell line HCT116 via cell cycle arrest and apoptosis. J. Funct. Foods 2020, 64, 103677. [Google Scholar] [CrossRef]
- Wang, L.J.; Zhao, S.; Liao, T.Y.; Shu, X.M.; Guo, D.F.; Huang, Y.K.; Yang, X.; Wang, Q.; Chen, X.G. Polysaccharide selection and mechanism for prevention of protein-polyphenol haze formation in beverages. J. Food Sci. 2020, 85, 3776–3785. [Google Scholar] [CrossRef] [PubMed]
- Carvalho, E.; Mateus, N.; Plet, B.; Pianet, I.; Dufourc, E.; De Freitas, V. Influence of wine pectic polysaccharides on the interactions between condensed tannins and salivary proteins. J. Agric. Food Chem. 2006, 54, 8936–8944. [Google Scholar] [CrossRef] [PubMed]
- Brandao, E.; Fernandes, A.; Guerreiro, C.; Coimbra, M.A.; Mateus, N.; de Freitas, V.; Soares, S. The effect of pectic polysaccharides from grape skins on salivary protein-procyanidin interactions. Carbohydr. Polym. 2020, 236, 116044. [Google Scholar] [CrossRef]
- Liu, D.J.; Martinez-Sanz, M.; Lopez-Sanchez, P.; Gilbert, E.P.; Gidley, M.J. Adsorption behaviour of polyphenols on cellulose is affected by processing history. Food Hydrocoll. 2017, 63, 496–507. [Google Scholar] [CrossRef]
- Liu, D.J.; Lopez-Sanchez, P.; Martinez-Sanz, M.; Gilbert, E.P.; Gidley, M.J. Adsorption isotherm studies on the interaction between polyphenols and apple cell walls: Effects of variety, heating and drying. Food Chem. 2019, 282, 58–66. [Google Scholar] [CrossRef]
- Tarko, T.; Duda-Chodak, A. Influence of food matrix on the bioaccessibility of fruit polyphenolic compounds. J. Agric. Food Chem. 2020, 68, 1315–1325. [Google Scholar] [CrossRef]
- Kamiloglu, S.; Tomas, M.; Ozdal, T.; Capanoglu, E. Effect of food matrix on the content and bioavailability of flavonoids. Trends Food Sci. Technol. 2021, 117, 15–33. [Google Scholar] [CrossRef]
- Diez-Sanchez, E.; Quiles, A.; Hernando, I. Interactions between blackcurrant polyphenols and food macronutrients in model systems: In vitro digestion studies. Foods 2021, 10, 847. [Google Scholar] [CrossRef] [PubMed]
- Liu, X.W.; Renard, C.M.G.C.; Rolland-Sabate, A.; Le Bourvellec, C. Exploring interactions between pectins and procyanidins: Structure-function relationships. Food Hydrocoll. 2021, 113, 106498. [Google Scholar] [CrossRef]
- Kyomugasho, C.; Willemsen, K.L.D.D.; Christiaens, S.; Van Loey, A.M.; Hendrickx, M.E. Microscopic evidence for Ca2+ mediated pectin-pectin interactions in carrot-based suspensions. Food Chem. 2015, 188, 126–136. [Google Scholar] [CrossRef] [PubMed][Green Version]
- Le Bourvellec, C.; Watrelot, A.A.; Ginies, C.; Imberty, A.; Renard, C.M.G.C. Impact of processing on the noncovalent interactions between procyanidin and apple cell wall. J. Agric. Food Chem. 2012, 60, 9484–9494. [Google Scholar] [CrossRef]
- Mamet, T.; Ge, Z.Z.; Zhang, Y.; Li, C.M. Interactions between highly galloylated persimmon tannins and pectins. Int. J. Biol. Macromol. 2018, 106, 410–417. [Google Scholar] [CrossRef]
- Watrelot, A.A.; Le Bourvellec, C.; Imberty, A.; Renard, C.M.G.C. Neutral sugar side chains of pectins limit interactions with procyanidins. Carbohydr. Polym. 2014, 99, 527–536. [Google Scholar] [CrossRef]
- Koh, J.; Xu, Z.M.; Wicker, L. Blueberry pectin and increased anthocyanins stability under in vitro digestion. Food Chem. 2020, 302, 125343. [Google Scholar] [CrossRef]
- Padayachee, A.; Netzel, G.; Netzel, M.; Day, L.; Zabaras, D.; Mikkelsen, D.; Gidley, M.J. Binding of polyphenols to plant cell wall analogues-Part 2: Phenolic acids. Food Chem. 2012, 135, 2287–2292. [Google Scholar] [CrossRef]
- Tang, R.X.; Yu, H.F.; Ruan, Z.; Zhang, L.; Xue, Y.L.; Yuan, X.F.; Qi, M.G.; Yao, Y.B. Effects of food matrix elements (dietary fibres) on grapefruit peel flavanone profile and on faecal microbiota during in vitro fermentation. Food Chem. 2022, 371, 131065. [Google Scholar] [CrossRef]
- Tomas, M.; Beekwilder, J.; Hall, R.D.; Simon, C.D.; Sagdic, O.; Capanoglu, E. Effect of dietary fiber (inulin) addition on phenolics and in vitro bioaccessibility of tomato sauce. Food Res. Int. 2018, 106, 129–135. [Google Scholar] [CrossRef]
- Symoneaux, R.; Chollet, S.; Patron, C.; Bauduin, R.; Le Quere, J.M.; Baron, A. Prediction of sensory characteristics of cider accordiernal validang to their biochemical composition: Use of a central composite design and exttion by cider professionals. LWT-Food Sci. Technol. 2015, 61, 63–69. [Google Scholar] [CrossRef]
- Le Bourvellec, C.; Bouchet, B.; Renard, C.M.G.C. Non-covalent interaction between procyanidins and apple cell wall material. Part III: Study on model polysaccharides. Biochim. Biophys. Acta-Gen. Subj. 2005, 1725, 10–18. [Google Scholar] [CrossRef]
- Koh, J.; Xu, Z.; Wicker, L. Binding kinetics of blueberry pectin-anthocyanins and stabilization by non-covalent interactions. Food Hydrocoll. 2020, 99, 105354. [Google Scholar] [CrossRef]
- Buchweitz, M.; Speth, M.; Kammerer, D.; Carle, R. Stabilisation of strawberry (Fragaria x ananassa Duch.) anthocyanins by different pectins. Food Chem. 2013, 141, 2998–3006. [Google Scholar] [CrossRef]
- Jurikova, T.; Sochor, J.; Rop, O.; Mlcek, J.; Balla, S.; Szekeres, L.; Adam, V.; Kizek, R. Polyphenolic profile and biological activity of Chinese hawthorn (Crataegus pinnatifida BUNGE) fruits. Molecules 2012, 17, 14490–14509. [Google Scholar] [CrossRef]
- Zurek, N.; Karatsai, O.; Redowicz, M.J.; Kapusta, I.T. Polyphenolic compounds of crataegus berry, leaf, and flower extracts affect viability and invasive potential of human glioblastoma cells. Molecules 2021, 26, 9. [Google Scholar] [CrossRef]
- Guo, Q.B.; Du, J.H.; Jiang, Y.; Goff, H.D.; Cui, S.W. Pectic polysaccharides from hawthorn: Physicochemical and partial structural characterization. Food Hydrocoll. 2019, 90, 146–153. [Google Scholar] [CrossRef]
- Huo, J.Y.; Wu, Z.Y.; Zhao, H.; Sun, W.Z.; Wu, J.H.; Huang, M.Q.; Zhang, J.L.; Wang, Z.H.; Sun, B.G. Structure-activity relationship of antioxidant polysaccharides from Huangshui based on the HPLC fingerprint combined with chemometrics methods. LWT-Food Sci. Technol. 2022, 159, 113201. [Google Scholar] [CrossRef]
- Kim, H.M.; Song, Y.X.; Hyun, G.H.; Long, N.P.; Park, J.H.; Hsieh, Y.S.Y.; Kwon, S.W. Characterization and antioxidant activity determination of neutral and acidic polysaccharides from Panax Ginseng, C.A. Meyer. Molecules 2020, 25, 791. [Google Scholar] [CrossRef]
- Yu, Y.; Wang, Y.W.; Liu, X.B.; Liu, Y.; Ji, L.; Zhou, Y.F.; Sun, L. Comparison of analytical methods for determining methylesterification and acetylation of pectin. Appl. Sci. 2021, 11, 10. [Google Scholar] [CrossRef]
- Yang, J.; Du, J.H.; Zhang, L.G.; Li, W.Q. Properties of pectin extracted from fermented and steeped hawthorn wine pomace: A comparison. Carbohydr. Polym. 2018, 197, 174–182. [Google Scholar] [CrossRef]
- Zaghian, N.; Goli, M. Optimization of the production conditions of primary (W-1/O) and double (W-1/O/W-2) nano-emulsions containing vitamin B(12)in skim milk using ultrasound wave by response surface methodology. J. Food Meas. Charact. 2020, 14, 3216–3226. [Google Scholar] [CrossRef]
- Zhang, D.X.; Zhu, J.F.; Ye, F.Y.; Zhao, G.H. Noncovalent interaction between ferulic acid and arabinan-rich pectic polysaccharide from rapeseed meal. Int. J. Biol. Macromol. 2017, 103, 307–315. [Google Scholar] [CrossRef]
- Zhu, R.G.; Zhang, X.Y.; Wang, Y.; Zhang, L.J.; Wang, C.Y.; Hu, F.Q.; Ning, C.; Chen, G. Pectin oligosaccharides from hawthorn (Crataegus pinnatifida Bunge. Var. major): Molecular characterization and potential antiglycation activities. Food Chem. 2019, 286, 129–135. [Google Scholar] [CrossRef]
- Sadeghzadeh Benam, N.; Goli, M.; Seyedain Ardebili, S.M.; Vaezshoushtari, N. The quality characteristics of dough and toast bread prepared with wheat flour containing different levels of Portulaca oleracea leaf powder. Food Sci. Technol. 2022, 42, e60820. [Google Scholar] [CrossRef]
- Pawlaczyk-Graja, I. Polyphenolic-polysaccharide conjugates from flowers and fruits of single-seeded hawthorn (Crataegus monogyna Jacq.): Chemical profiles and mechanisms of anticoagulant activity. Int. J. Biol. Macromol. 2018, 116, 869–879. [Google Scholar] [CrossRef] [PubMed]
- Liu, J.; Pu, H.M.; Jin, C.H. Synthesis, characterization, bioactivity and potential application of phenolic acid grafted chitosan: A review. Carbohydr. Polym. 2017, 174, 999–1017. [Google Scholar] [CrossRef] [PubMed]
- Badawi, M.A.; Negm, N.A.; Abou Kana, M.T.H.; Hefni, H.H.; Moneem, M.M.A. Adsorption of aluminum and lead from wastewater by chitosan-tannic acid modified biopolymers: Isotherms, kinetics, thermodynamics and process mechanism. Int. J. Biol. Macromol. 2017, 99, 465–476. [Google Scholar] [CrossRef]
- Unlu, N.; Ersoz, M. Adsorption characteristics of heavy metal ions onto a low cost biopolymer sorbent from aqueous solutions. J. Hazard. Mater. 2006, 136, 272–280. [Google Scholar] [CrossRef]
- Bordenave, N.; Hamaker, B.R.; Ferruzzi, M.G. Nature and consequences of non-covalent interactions between flavonoids and macronutrients in foods. Food Funct. 2014, 5, 18–34. [Google Scholar] [CrossRef]
- Phan, A.D.T.; Flanagan, B.M.; D’Arcy, B.R.; Gidley, M.J. Binding selectivity of dietary polyphenols to different plant cell wall components: Quantification and mechanism. Food Chem. 2017, 233, 216–222. [Google Scholar] [CrossRef] [PubMed]
- Zhu, F. Interactions between cell wall polysaccharides and polyphenols. Crit. Rev. Food Sci. Nutr. 2017, 58, 1549–7852. [Google Scholar] [CrossRef] [PubMed]
- Vallar, S.; Houivet, D.; El Fallah, J.; Kervadec, D.; Haussonne, J.M. Oxide slurries stability and powders dispersion: Optimization with zeta potential and rheological measurements. J. Eur. Ceram. Soc. 1999, 19, 1017–1021. [Google Scholar] [CrossRef]
- Li, S.Y.; Li, J.S.; Zhu, Z.Z.; Cheng, S.Y.; He, J.R.; Lamikanra, O. Soluble dietary fiber and polyphenol complex in lotus root: Preparation, interaction and identification. Food Chem. 2020, 314, 126219. [Google Scholar] [CrossRef]
- Liang, T.S.; Jiao, S.S.; Jing, P. Molecular interaction between pectin and catechin/procyanidin in simulative juice model: Insights from spectroscopic, morphology, and antioxidant activity. J. Food Sci. 2021, 86, 2445–2456. [Google Scholar] [CrossRef]
- Liu, J.; Wang, X.; Yong, H.; Kan, J.; Jin, C. Recent advances in flavonoid-grafted polysaccharides: Synthesis, structural characterization, bioactivities and potential applications. Int. J. Biol. Macromol. 2018, 116, 1011–1025. [Google Scholar] [CrossRef]
- Yazaki, Y.; Hillis, W.E. Polyphenolic extractives of Pinus radiata bark. Holzforschung 1977, 31, 20–25. [Google Scholar] [CrossRef]
- Barrios-Rodriguez, Y.; Collazos-Escobar, G.A.; Gutierrez-Guzman, N. ATR-FTIR for characterizing and differentiating dried and ground coffee cherry pulp of different varieties (Coffea arabica L.). Eng. Agric. 2021, 41, 70–71. [Google Scholar] [CrossRef]
- Nisar, T.; Wang, Z.C.; Alim, A.; Lqbal, M.; Yang, X.; Sun, L.J.; Guo, Y.R. Citrus pectin films enriched with thinned young apple polyphenols for potential use as bio-based active packaging. Cyta-J. Food 2019, 17, 695–705. [Google Scholar] [CrossRef]


| Parameters | HP-EC1 | HP-CA2 |
|---|---|---|
| n | 6.32 | 15.40 |
| Ka (M−1) | 2.54 × 10⁶ | 2.09 × 10⁶ |
| ΔH (cal·mol−1) | −1.11 × 10⁶ | −1.12 × 10⁶ |
| ΔS (cal·mol−1·K−1) | −336 | −344 |
| −TΔS (cal·mol−1) | 1.02 × 10⁵ | 1.04 × 10⁵ |
Publisher’s Note: MDPI stays neutral with regard to jurisdictional claims in published maps and institutional affiliations. |
© 2022 by the authors. Licensee MDPI, Basel, Switzerland. This article is an open access article distributed under the terms and conditions of the Creative Commons Attribution (CC BY) license (https://creativecommons.org/licenses/by/4.0/).
Share and Cite
Zhang, X.; Li, M.; Zhao, W.; Gao, Z.; Wu, M.; Zhou, T.; Wu, C.; Zhou, K.; Han, X.; Zhou, Q. Hawthorn Juice Simulation System for Pectin and Polyphenol Adsorption Behavior: Kinetic Modeling Properties and Identification of the Interaction Mechanism. Foods 2022, 11, 2813. https://doi.org/10.3390/foods11182813
Zhang X, Li M, Zhao W, Gao Z, Wu M, Zhou T, Wu C, Zhou K, Han X, Zhou Q. Hawthorn Juice Simulation System for Pectin and Polyphenol Adsorption Behavior: Kinetic Modeling Properties and Identification of the Interaction Mechanism. Foods. 2022; 11(18):2813. https://doi.org/10.3390/foods11182813
Chicago/Turabian StyleZhang, Xuan, Meijiao Li, Wen Zhao, Zhe Gao, Mengying Wu, Tong Zhou, Chen Wu, Kaixuan Zhou, Xue Han, and Qian Zhou. 2022. "Hawthorn Juice Simulation System for Pectin and Polyphenol Adsorption Behavior: Kinetic Modeling Properties and Identification of the Interaction Mechanism" Foods 11, no. 18: 2813. https://doi.org/10.3390/foods11182813
APA StyleZhang, X., Li, M., Zhao, W., Gao, Z., Wu, M., Zhou, T., Wu, C., Zhou, K., Han, X., & Zhou, Q. (2022). Hawthorn Juice Simulation System for Pectin and Polyphenol Adsorption Behavior: Kinetic Modeling Properties and Identification of the Interaction Mechanism. Foods, 11(18), 2813. https://doi.org/10.3390/foods11182813