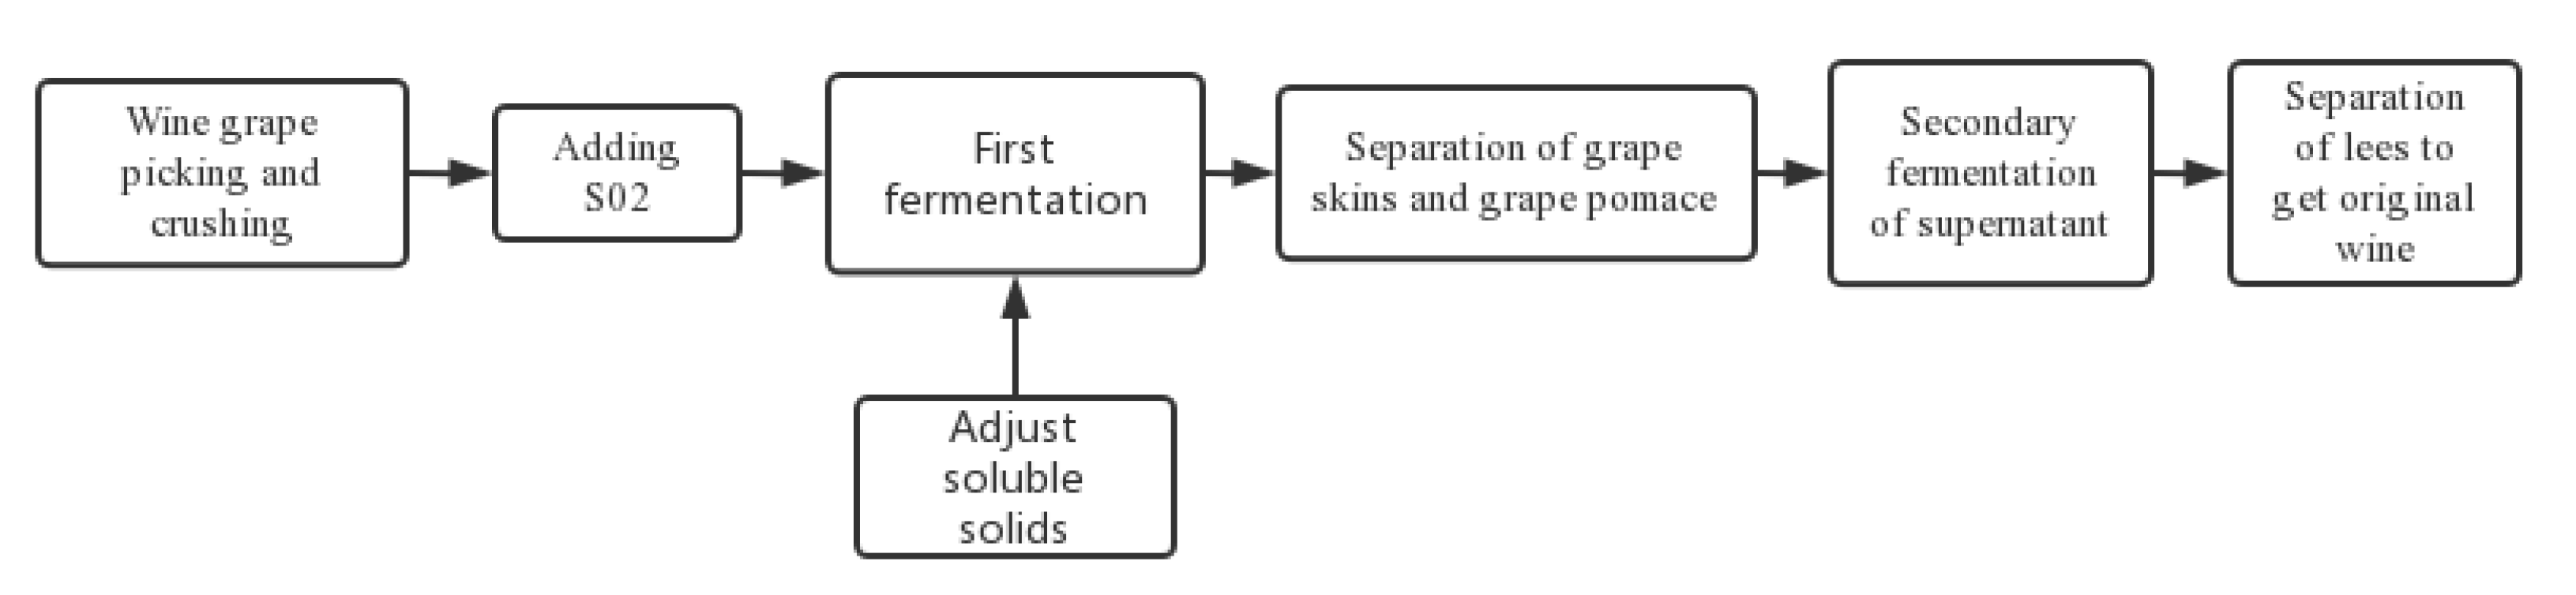
Figure 1.
Fermentation flow chart for wine.
Figure 1.
Fermentation flow chart for wine.
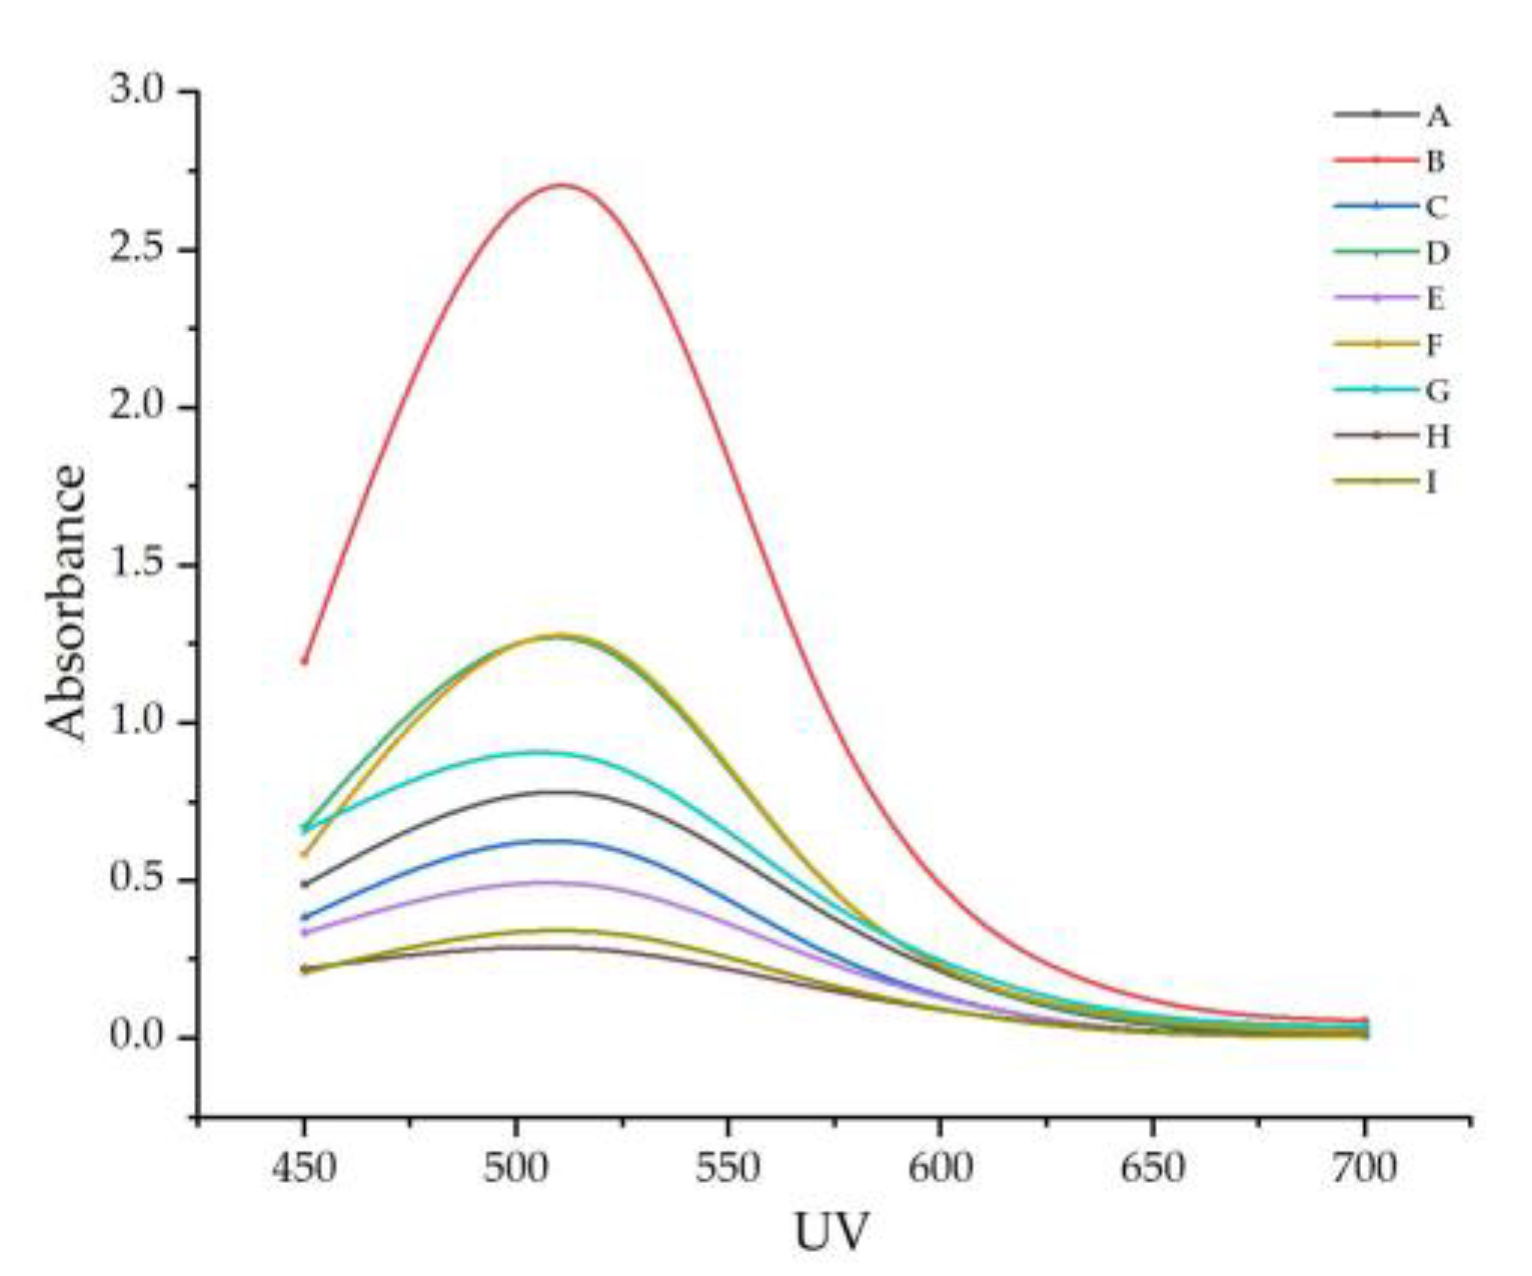
Figure 2.
The change rule of the absorbance in the visible band of the sample. Note: From A to I are ‘Hassan’, ‘Zuoshaner’, ‘Beibinghong’, ‘Zuoyouhong’, ‘Beta’, ‘Shuanghong’, ‘Zijingganlu’, ‘Cabernet Sauvignon’, and ‘Syrah’.
Figure 2.
The change rule of the absorbance in the visible band of the sample. Note: From A to I are ‘Hassan’, ‘Zuoshaner’, ‘Beibinghong’, ‘Zuoyouhong’, ‘Beta’, ‘Shuanghong’, ‘Zijingganlu’, ‘Cabernet Sauvignon’, and ‘Syrah’.
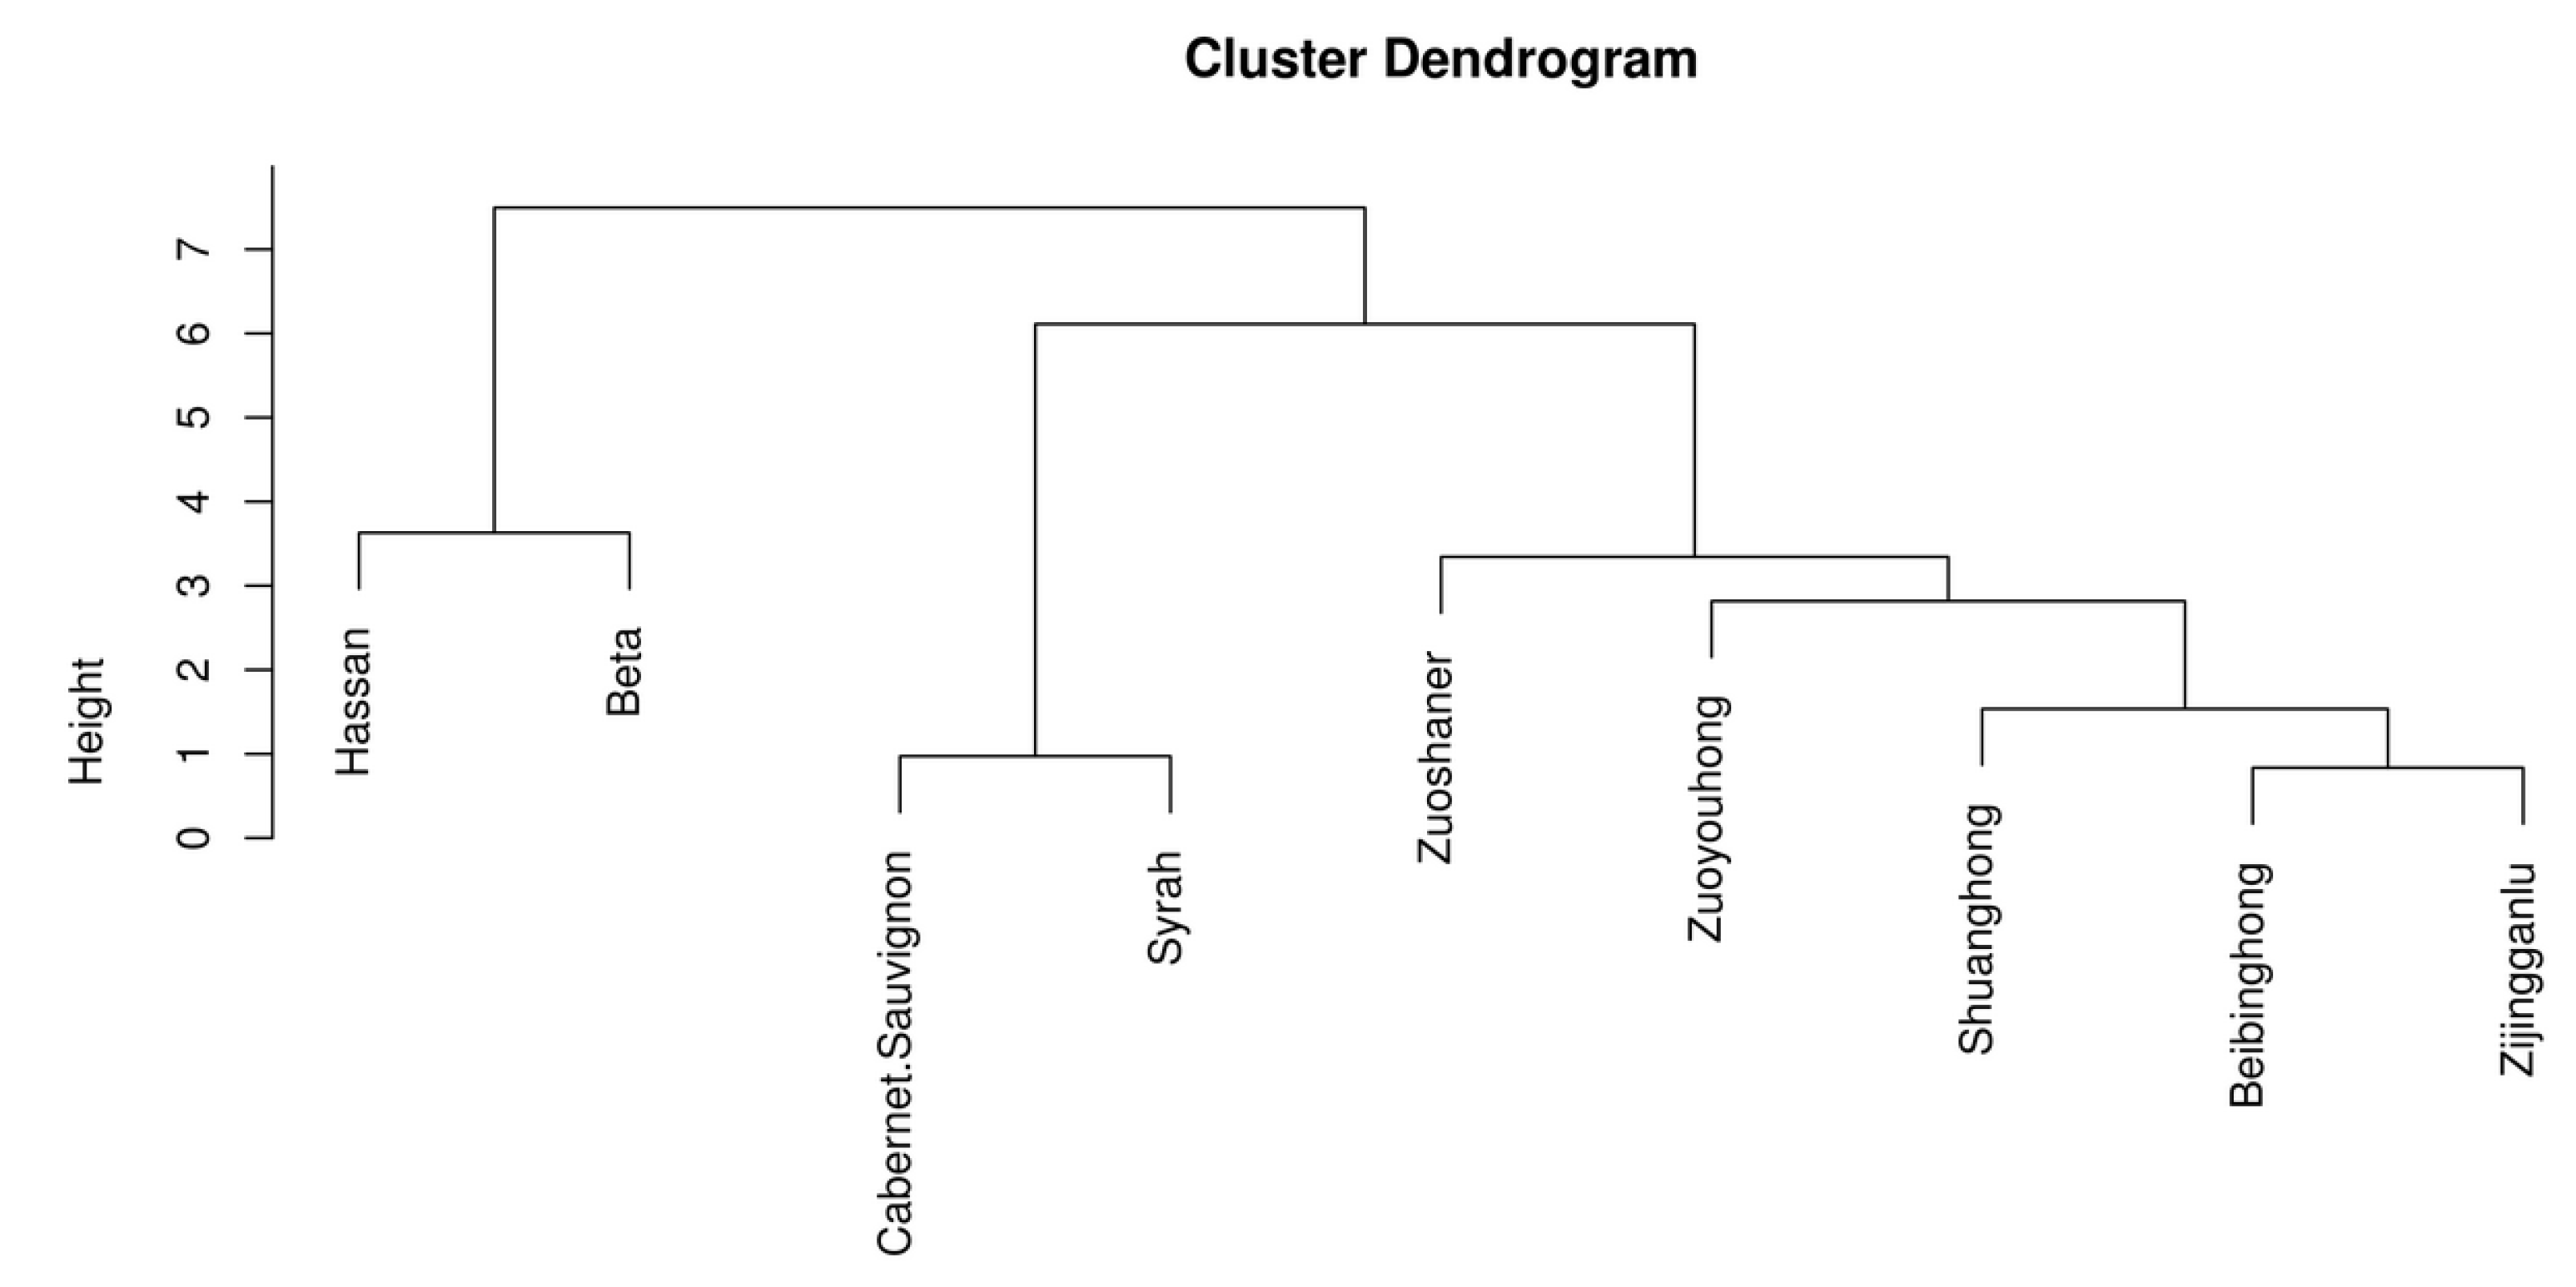
Figure 3.
Cluster analysis chart of organic acid content in different wine samples.
Figure 3.
Cluster analysis chart of organic acid content in different wine samples.
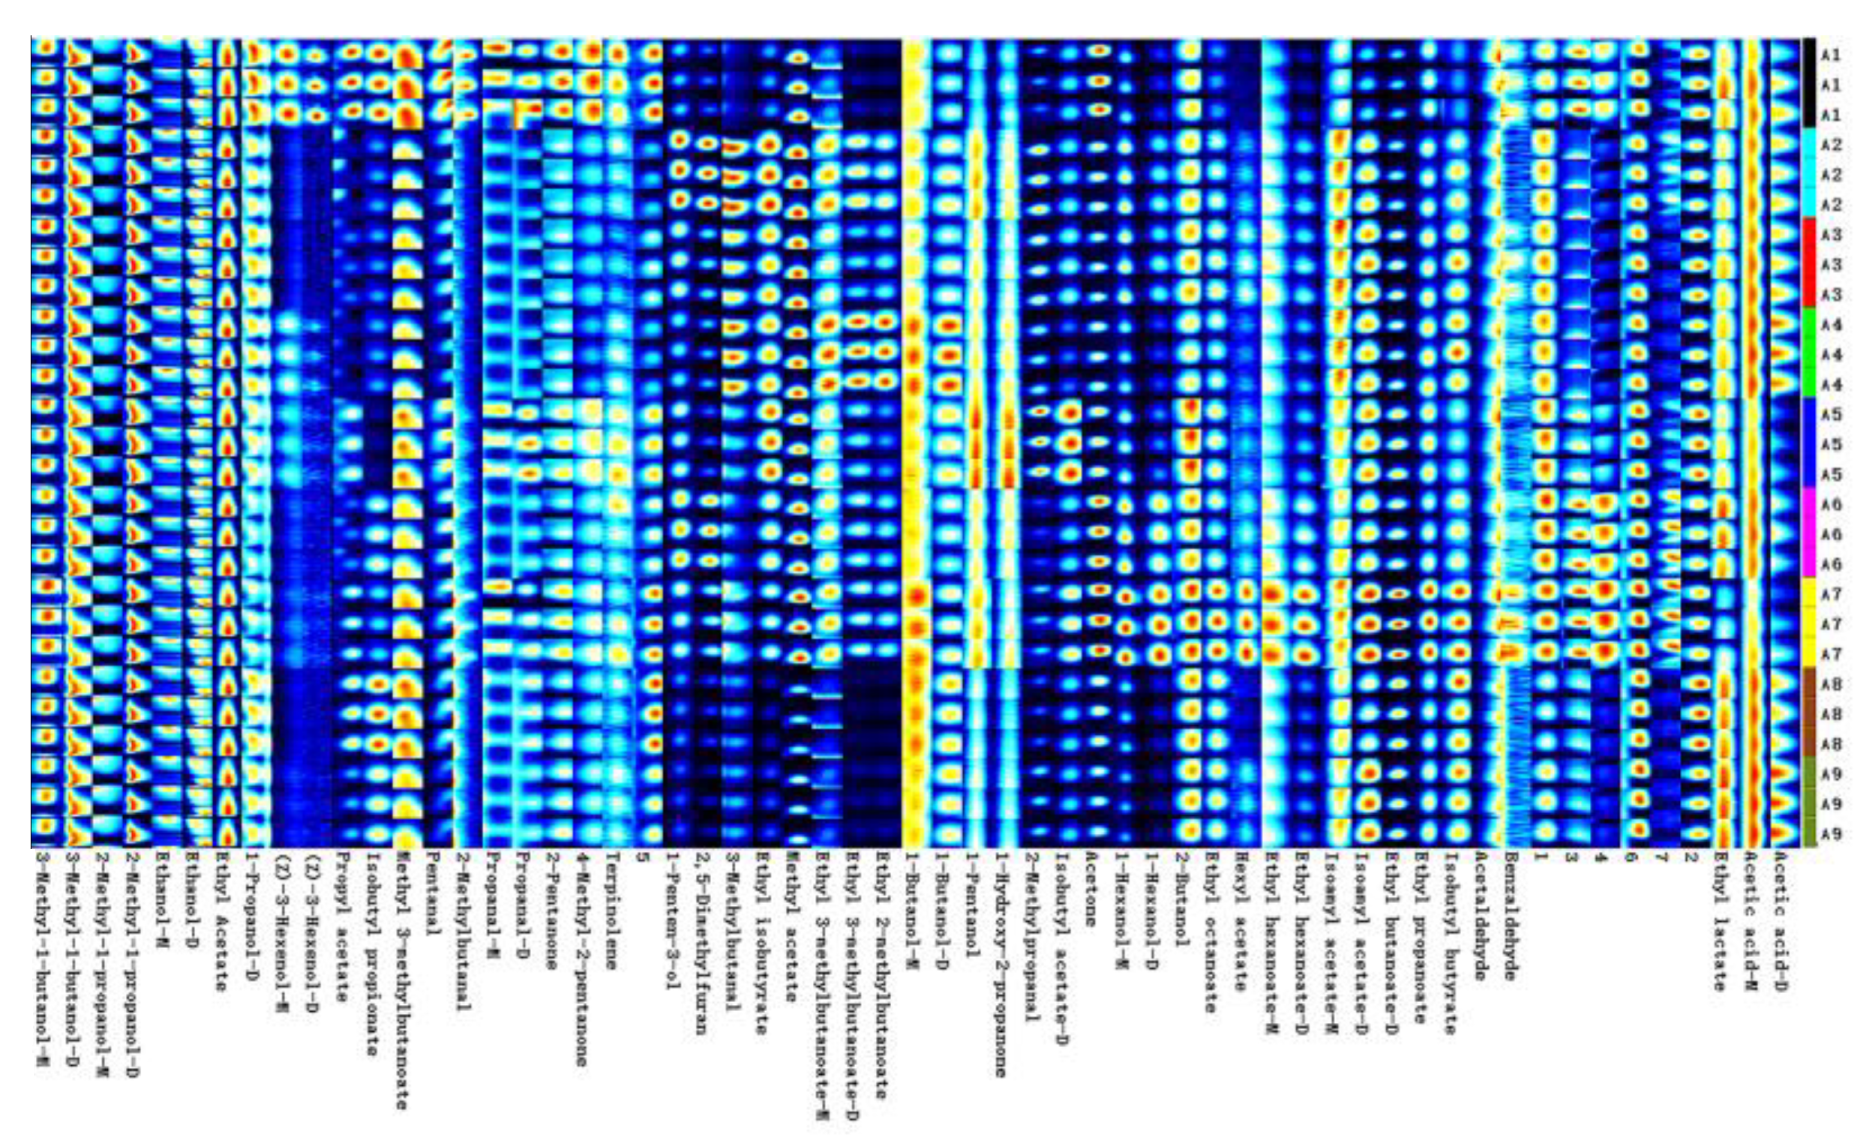
Figure 4.
Fingerprints of volatile compounds in different wine varieties. Note: From A1 to A9 are ‘Hassan’, ‘Zuoshaner’, ‘Beibinghong’, ‘Zuoyouhong’, ‘Beta’, ‘Shuanghong’, ‘Zijingganlu’, ‘Cabernet Sauvignon’, and ‘Syrah’.
Figure 4.
Fingerprints of volatile compounds in different wine varieties. Note: From A1 to A9 are ‘Hassan’, ‘Zuoshaner’, ‘Beibinghong’, ‘Zuoyouhong’, ‘Beta’, ‘Shuanghong’, ‘Zijingganlu’, ‘Cabernet Sauvignon’, and ‘Syrah’.
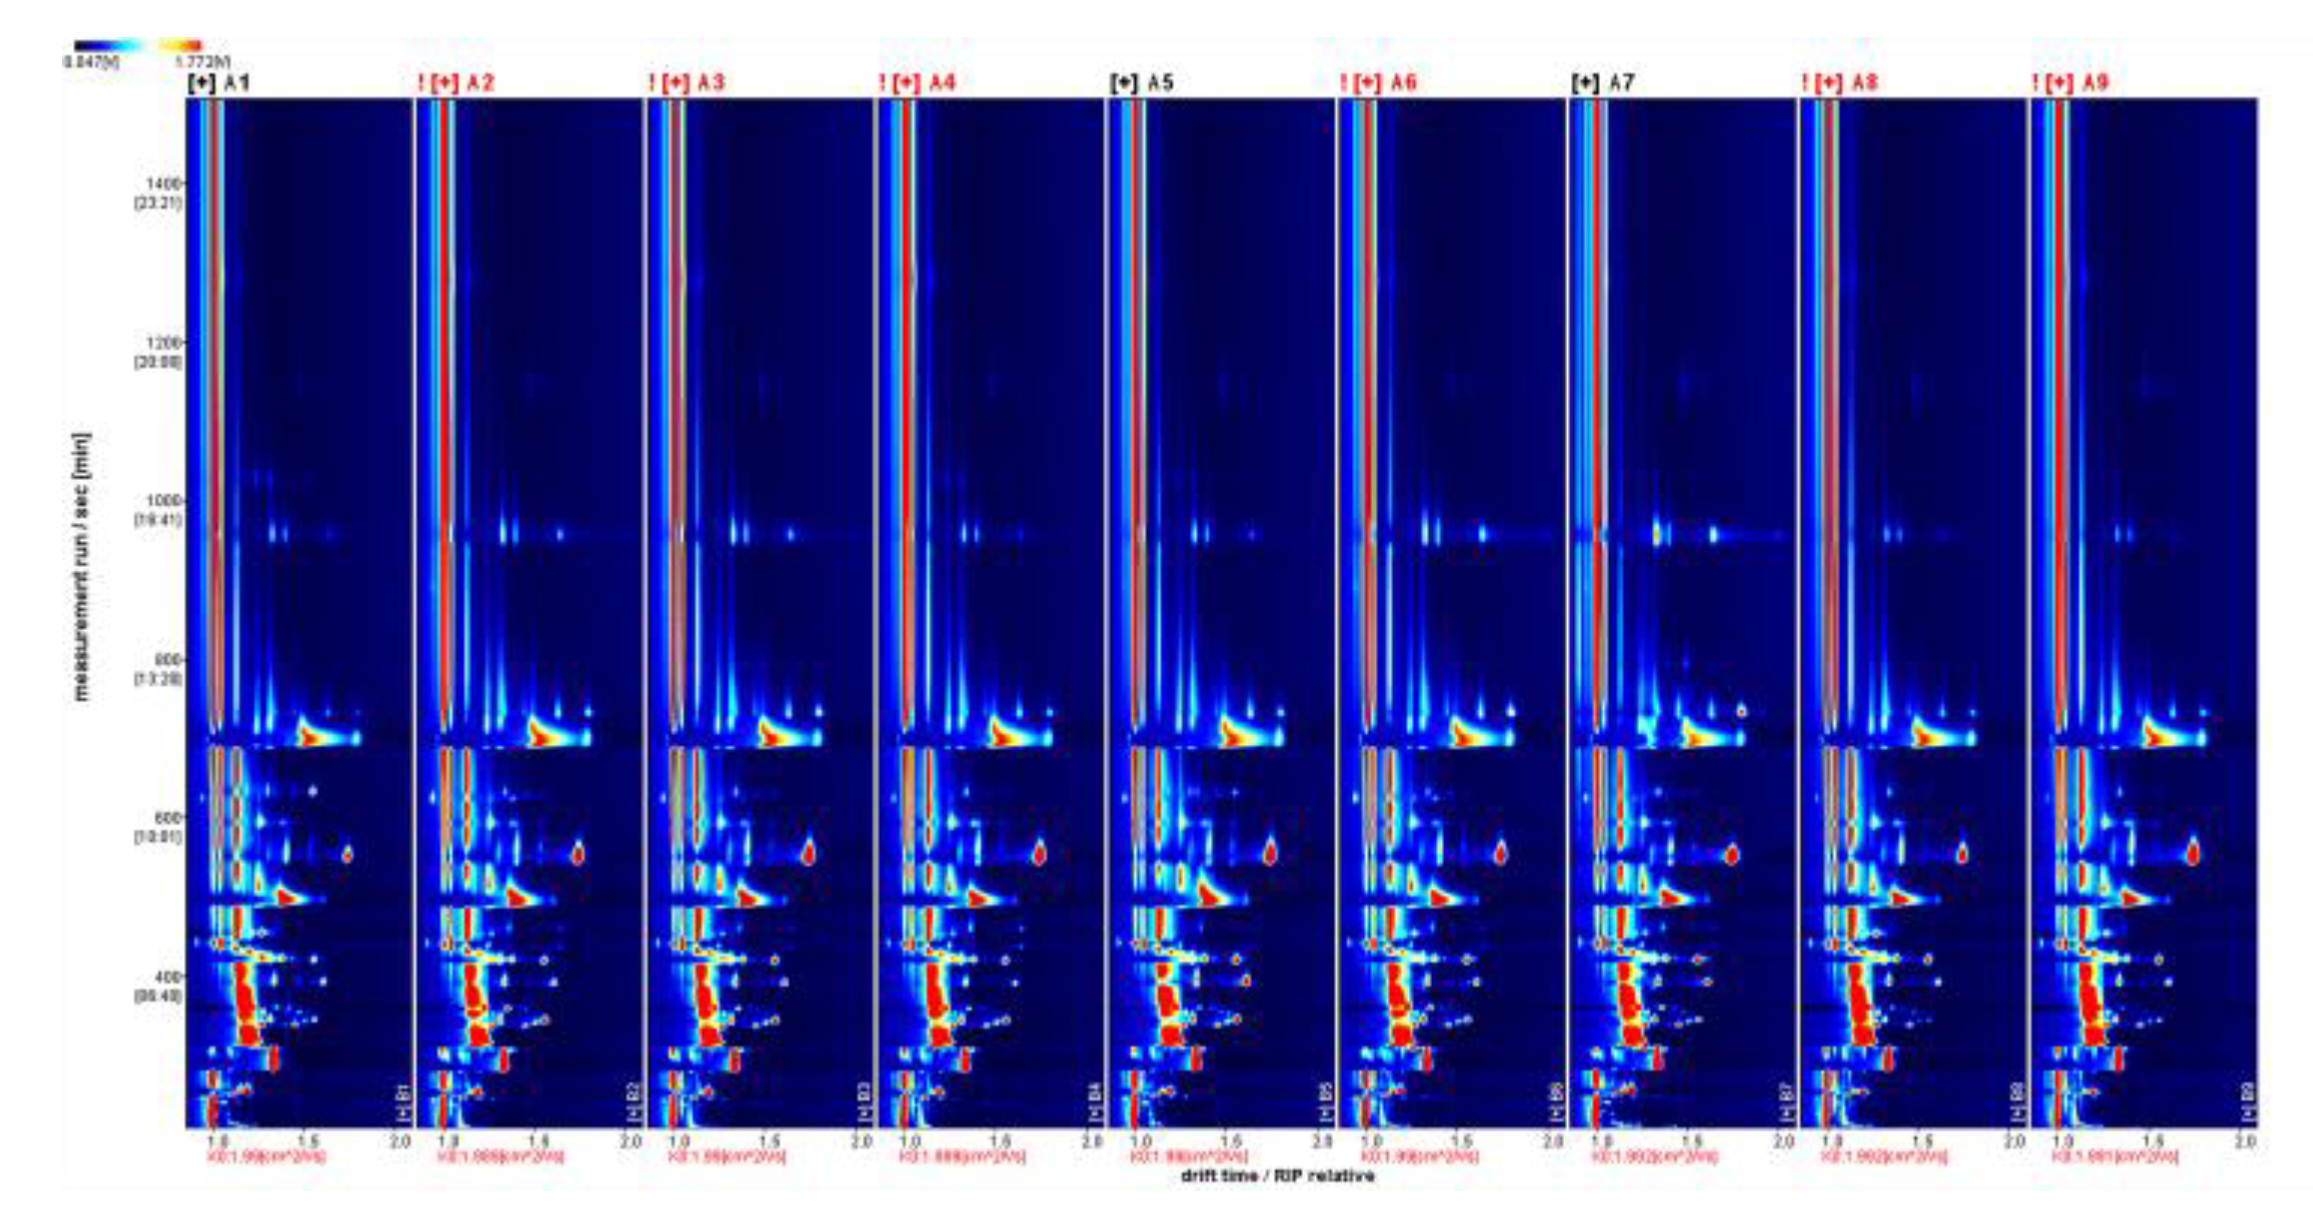
Figure 5.
HS-GC-IMS 2D spectrum (top view). Note: From A1 to A9 are ‘Hassan’, ‘Zuoshaner’, ‘Beibinghong’, ‘Zuoyouhong’, ‘Beta’, ‘Shuanghong’, ‘Zijingganlu’, ‘Cabernet Sauvignon’, and ‘Syrah’. The entire graph has a blue background, and the red vertical line at the horizontal coordinate 1.0 is the RIP peak (reactive ion peak, normalized). Each point on either side of the RIP peak represents a volatile organic compound.
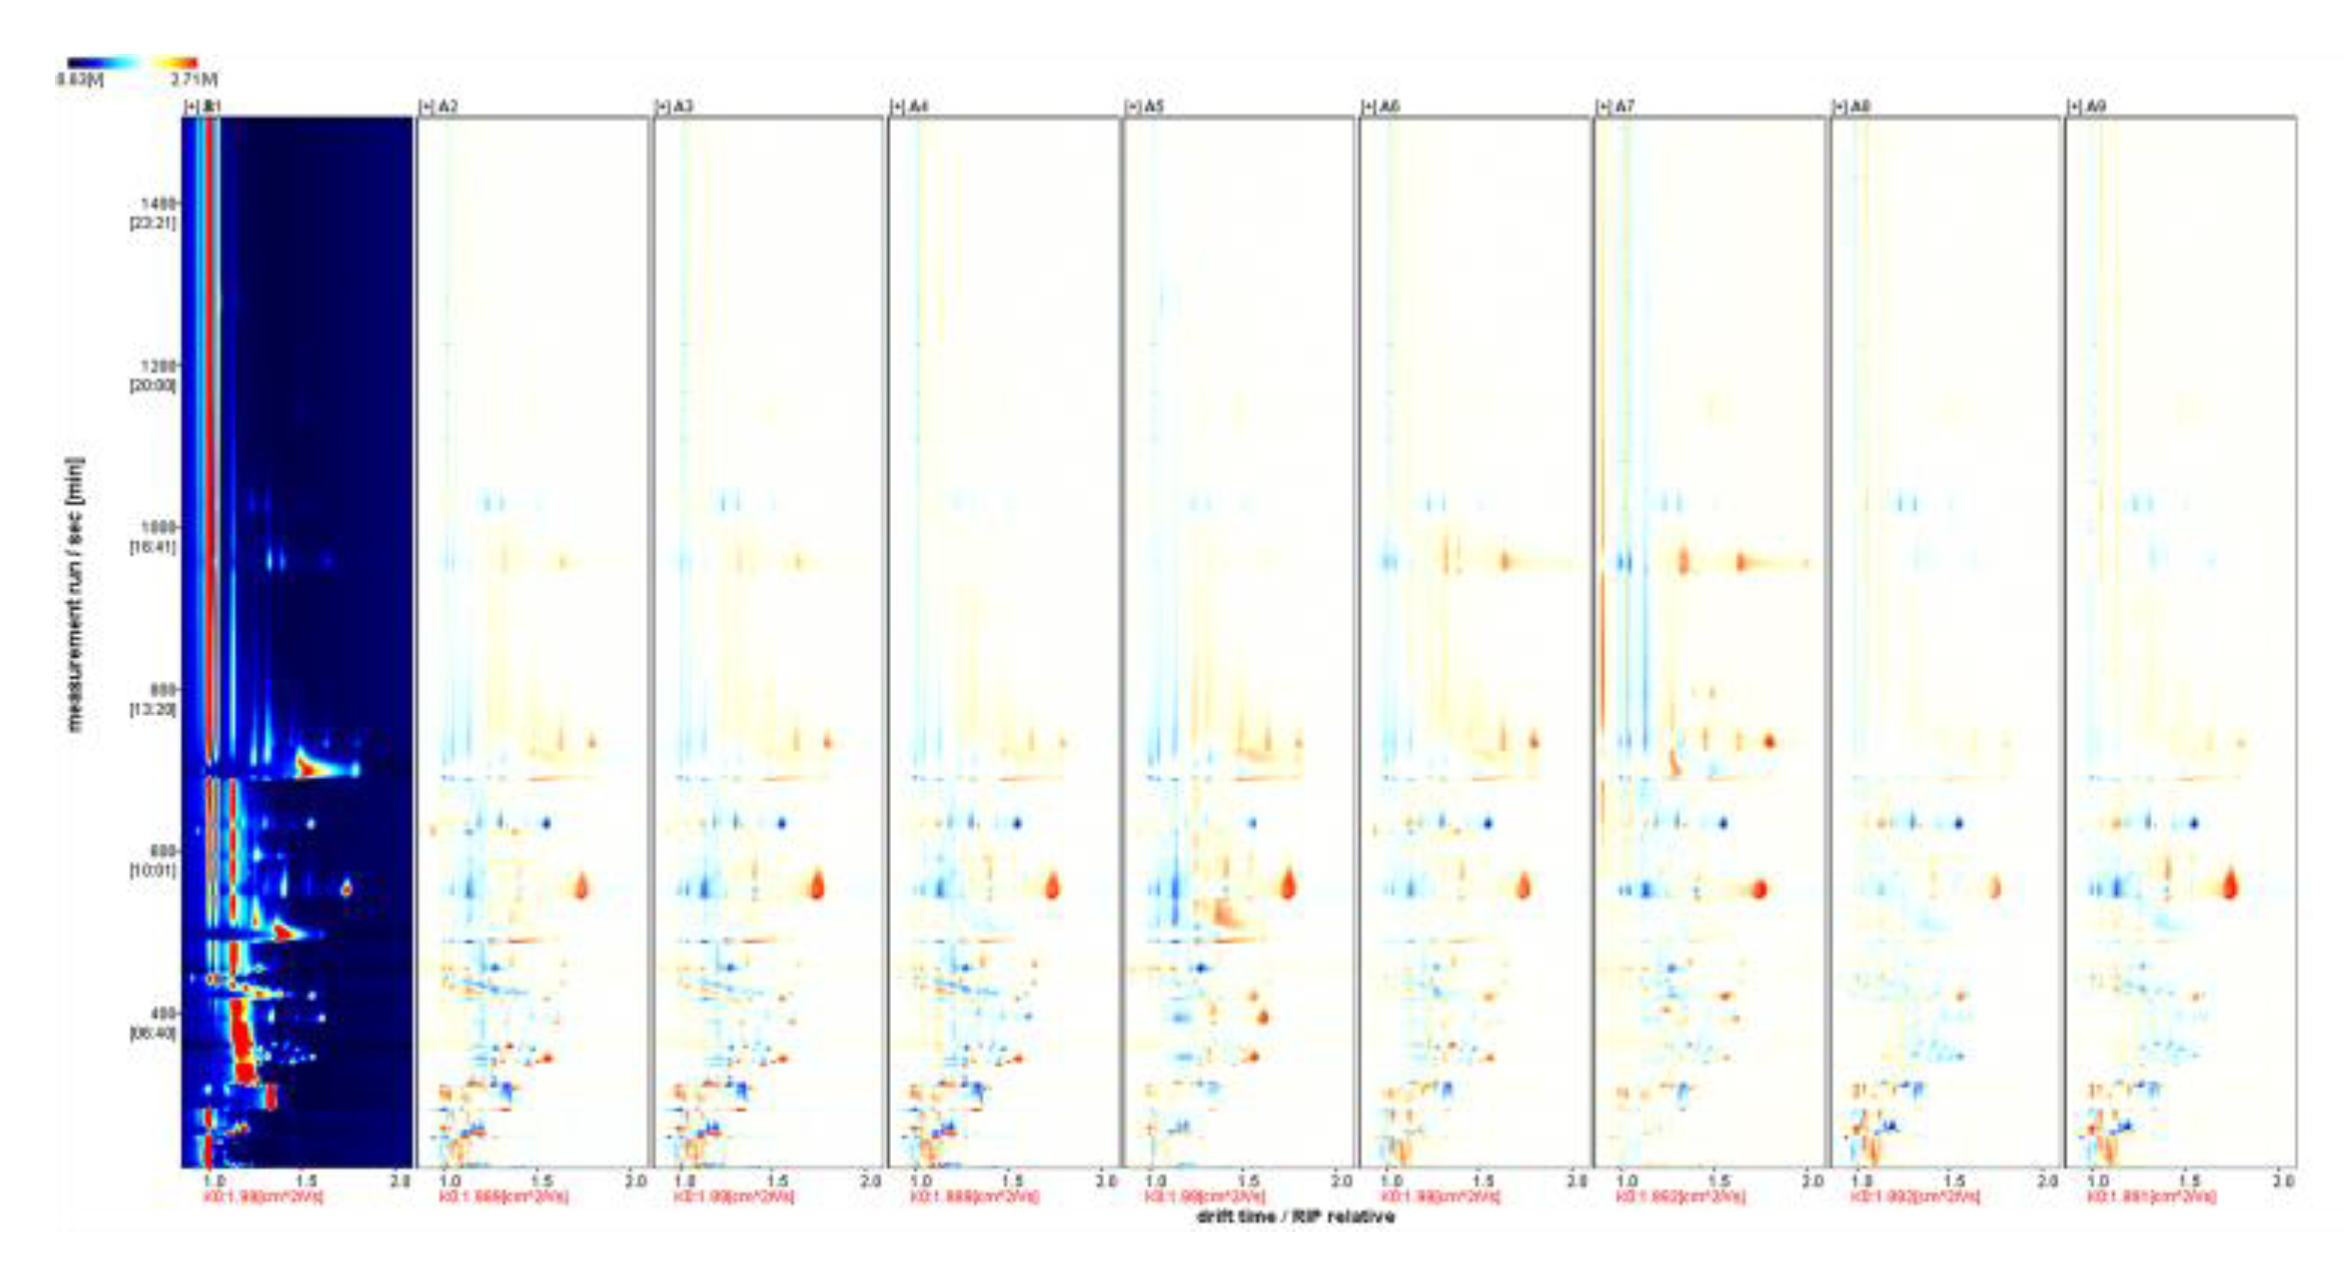
Figure 6.
HS-GC-IMS difference spectrum of the sample. Note: From A1 to A9 are ‘Hassan’, ‘Zuoshaner’, ‘Beibinghong’, ‘Zuoyouhong’, ‘Beta’, ‘Shuanghong’, ‘Zijingganlu’, ‘Cabernet Sauvignon’, ‘Syrah’. Note: From A1 to A9 are ‘Hassan’, ‘Zuoshaner’, ‘Beibinghong’, ‘Zuoyouhong’, ‘Beta’, ‘Shuanghong’, ‘Zijingganlu’, ‘Cabernet Sauvignon’, and ‘Syrah’.
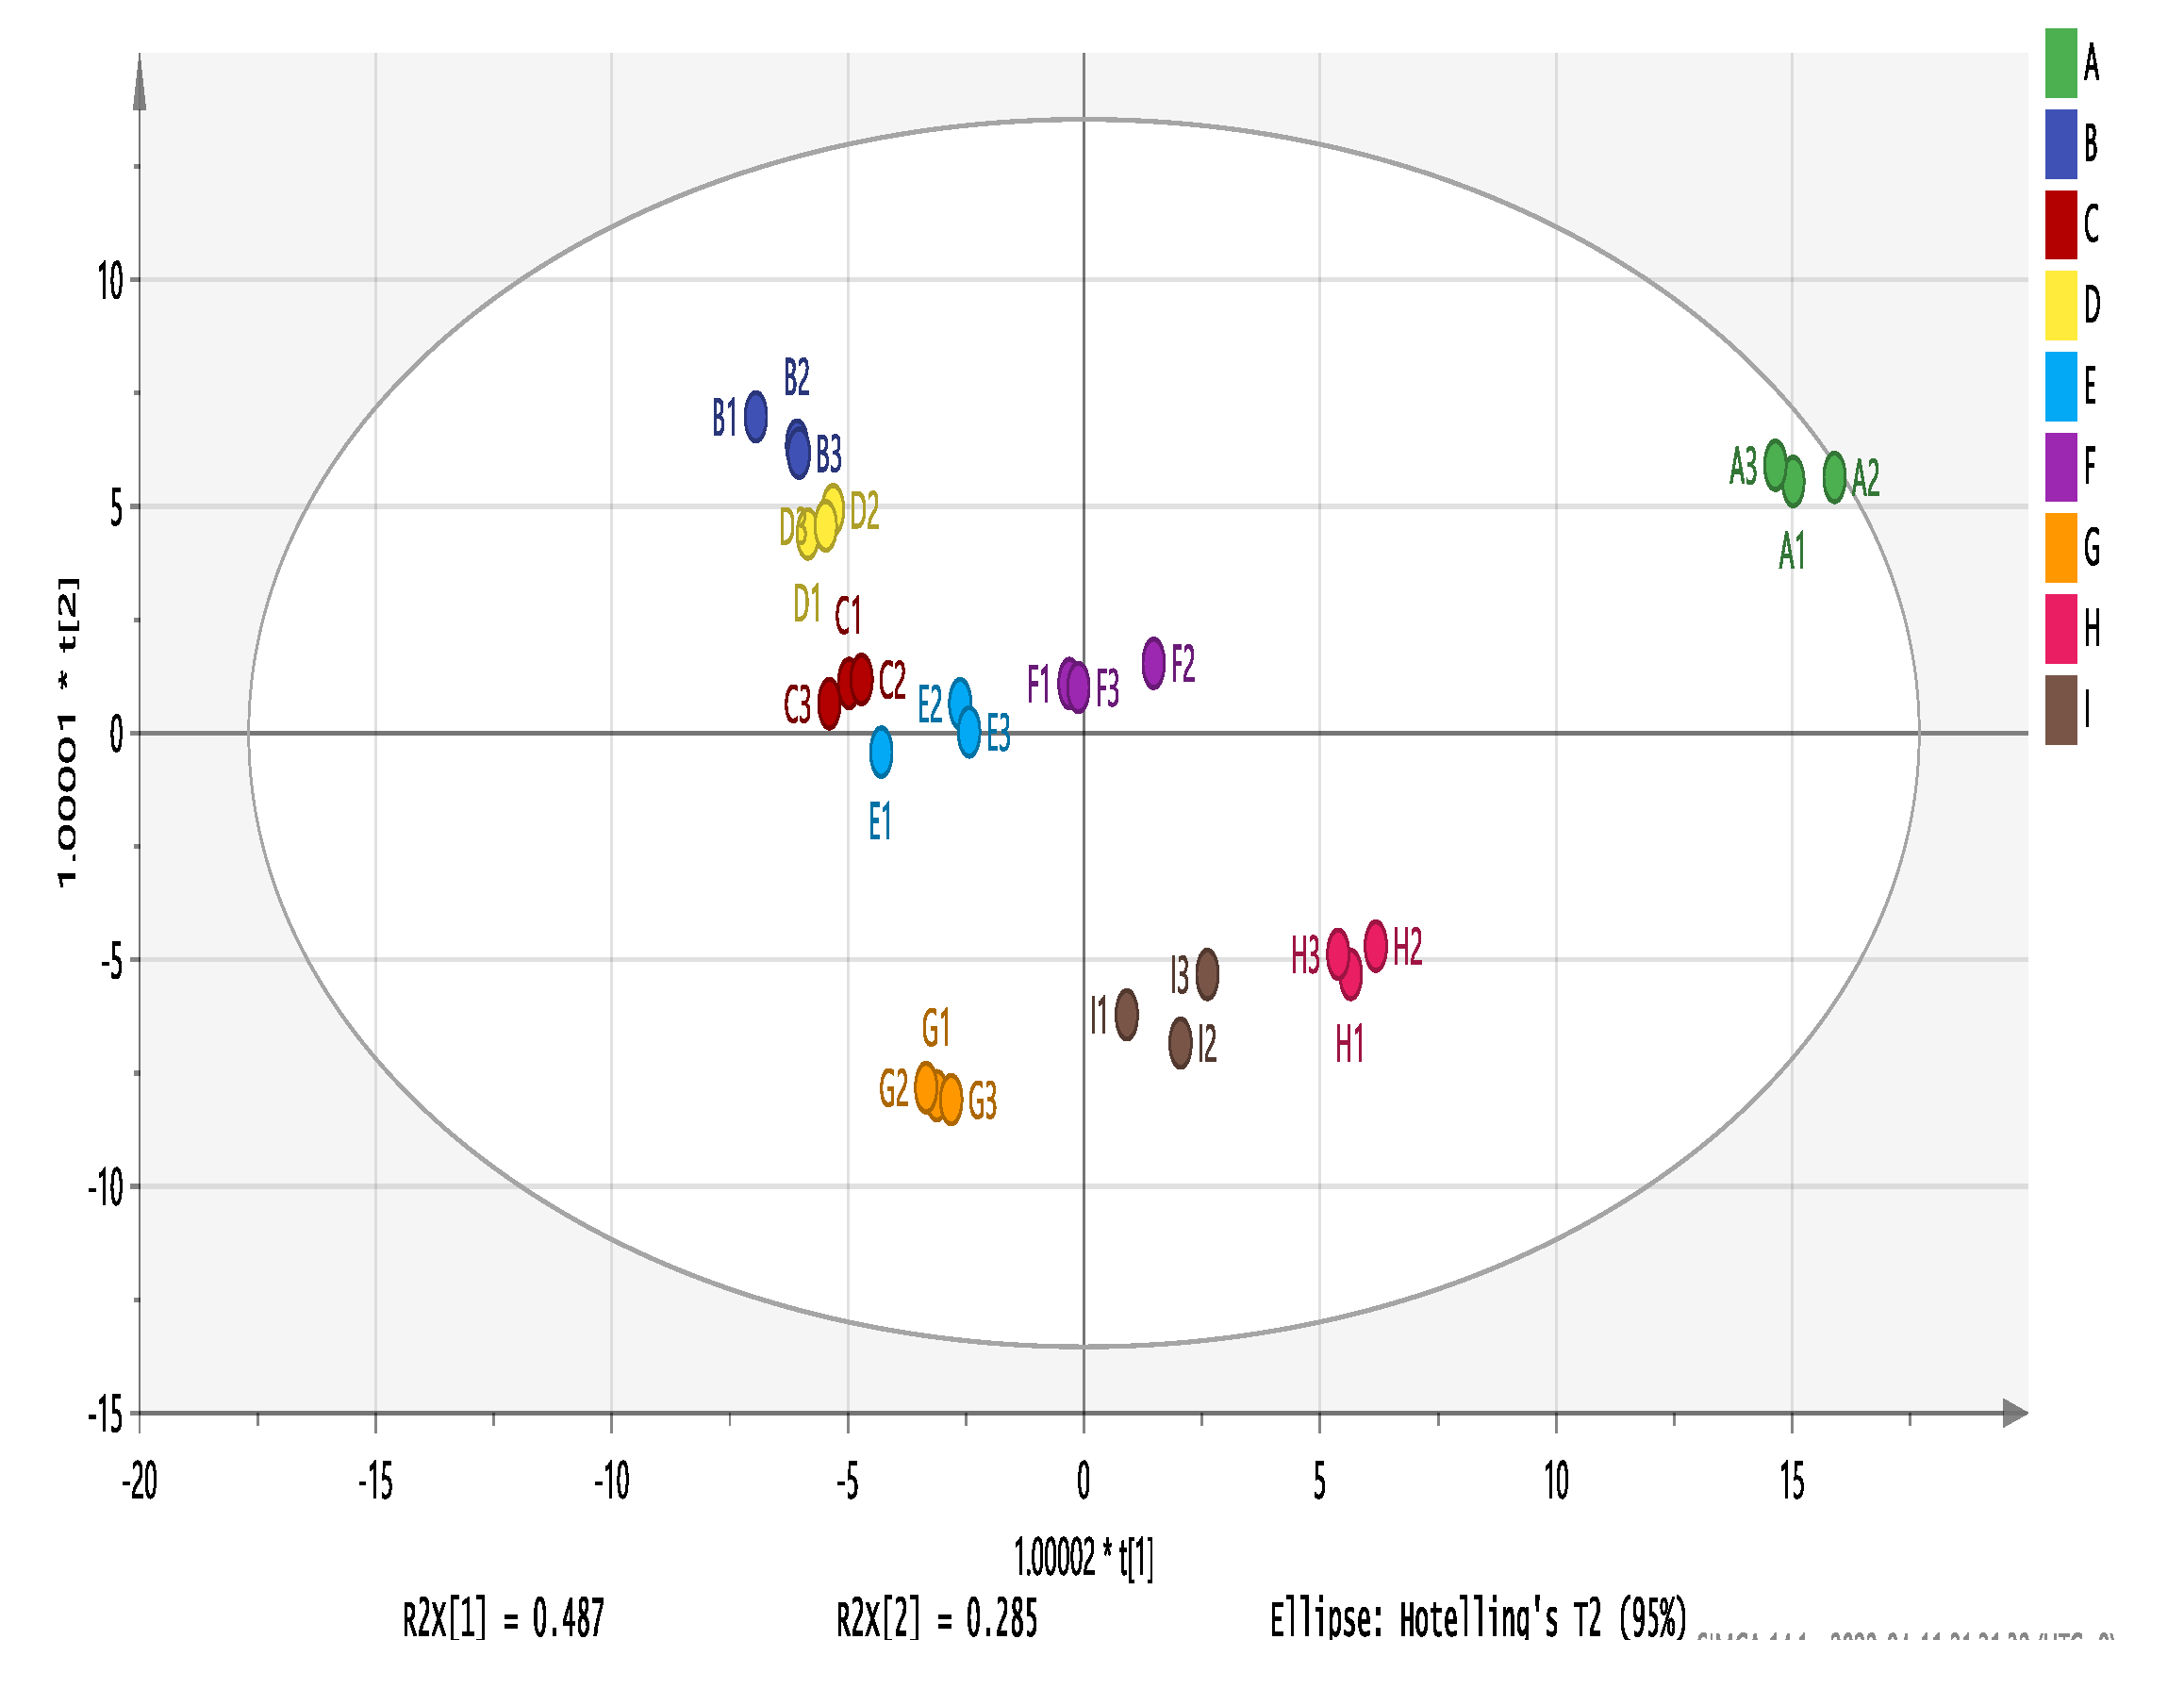
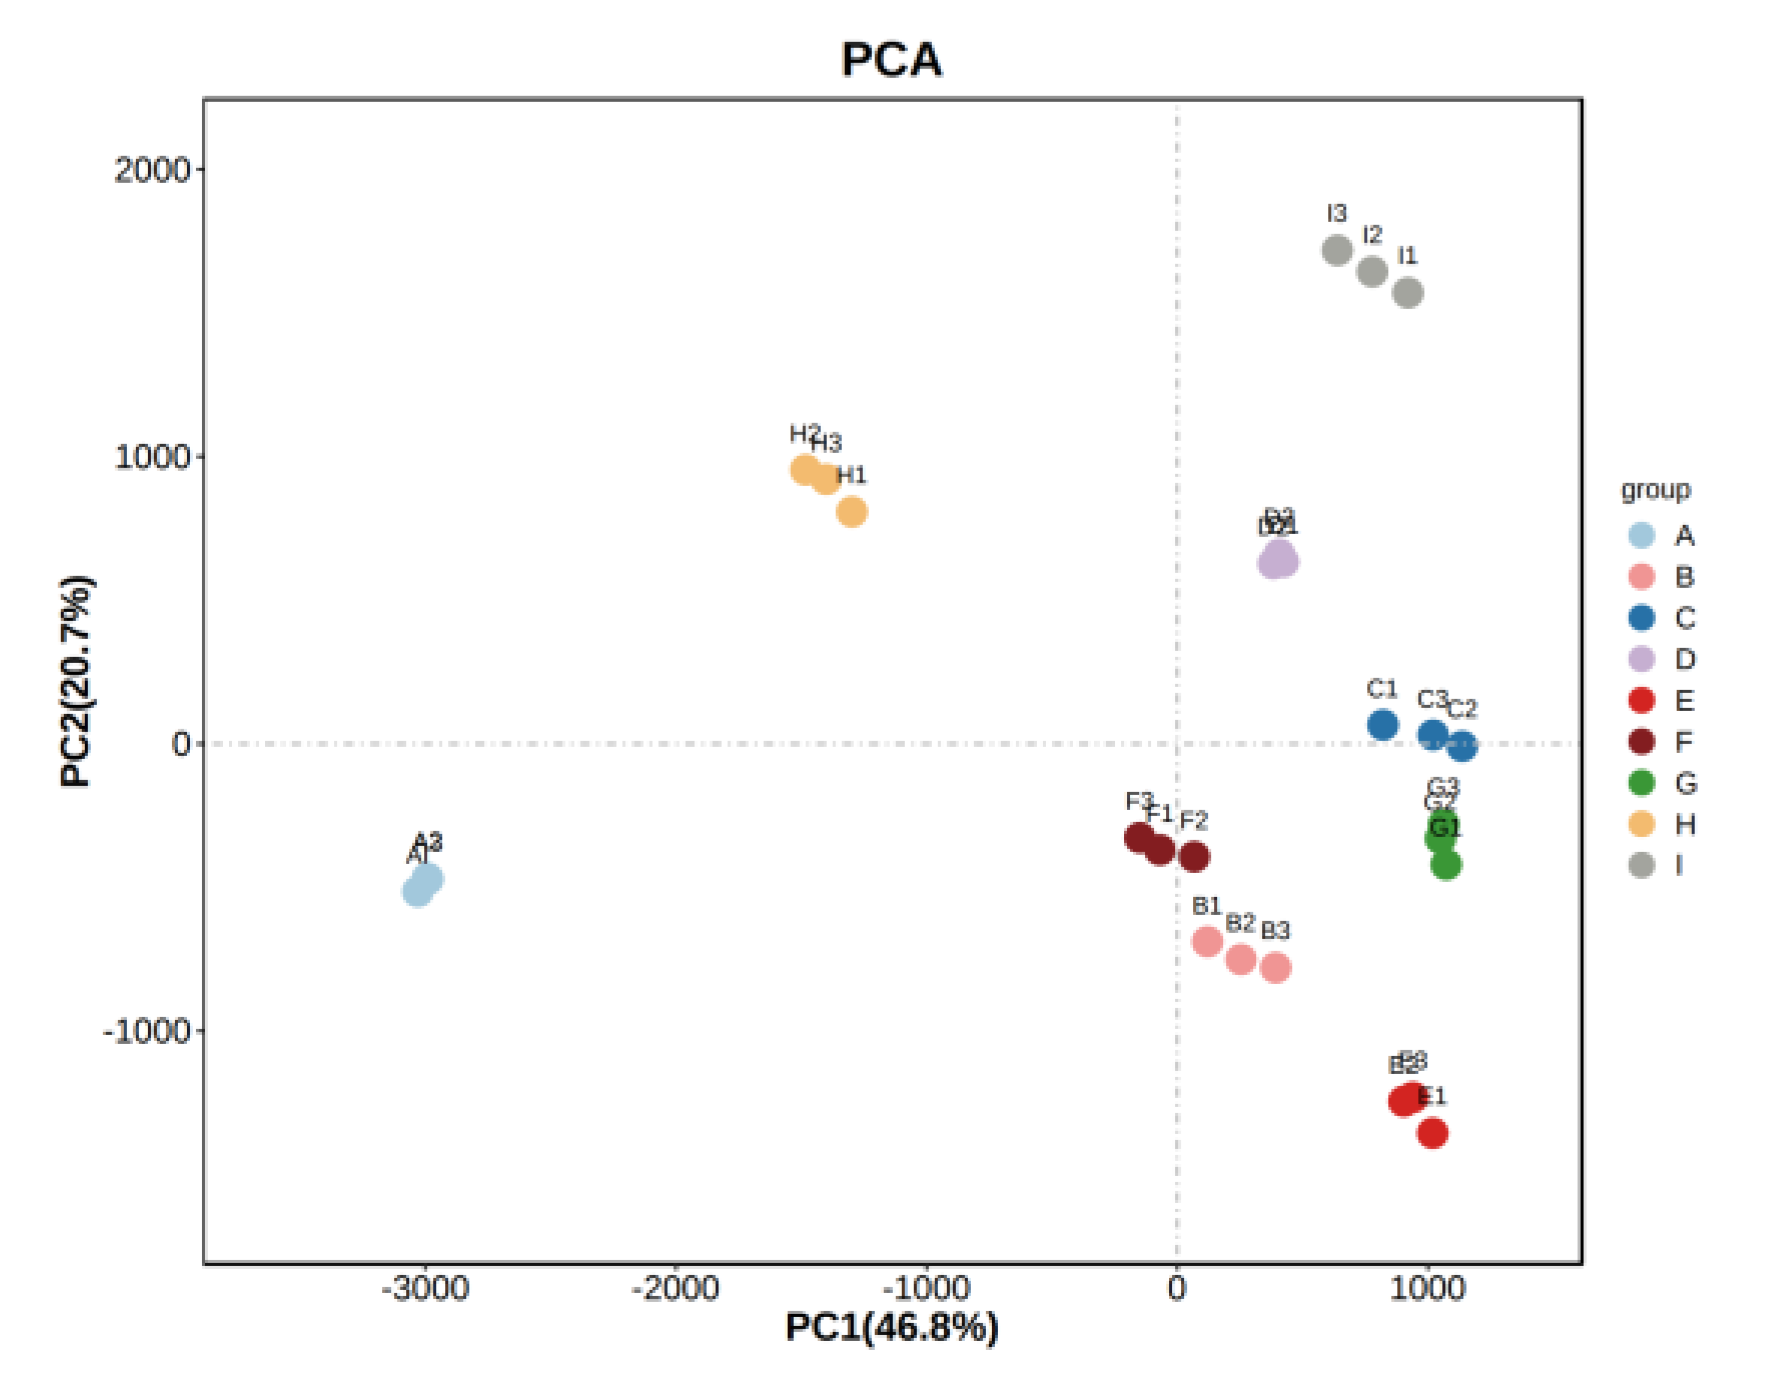
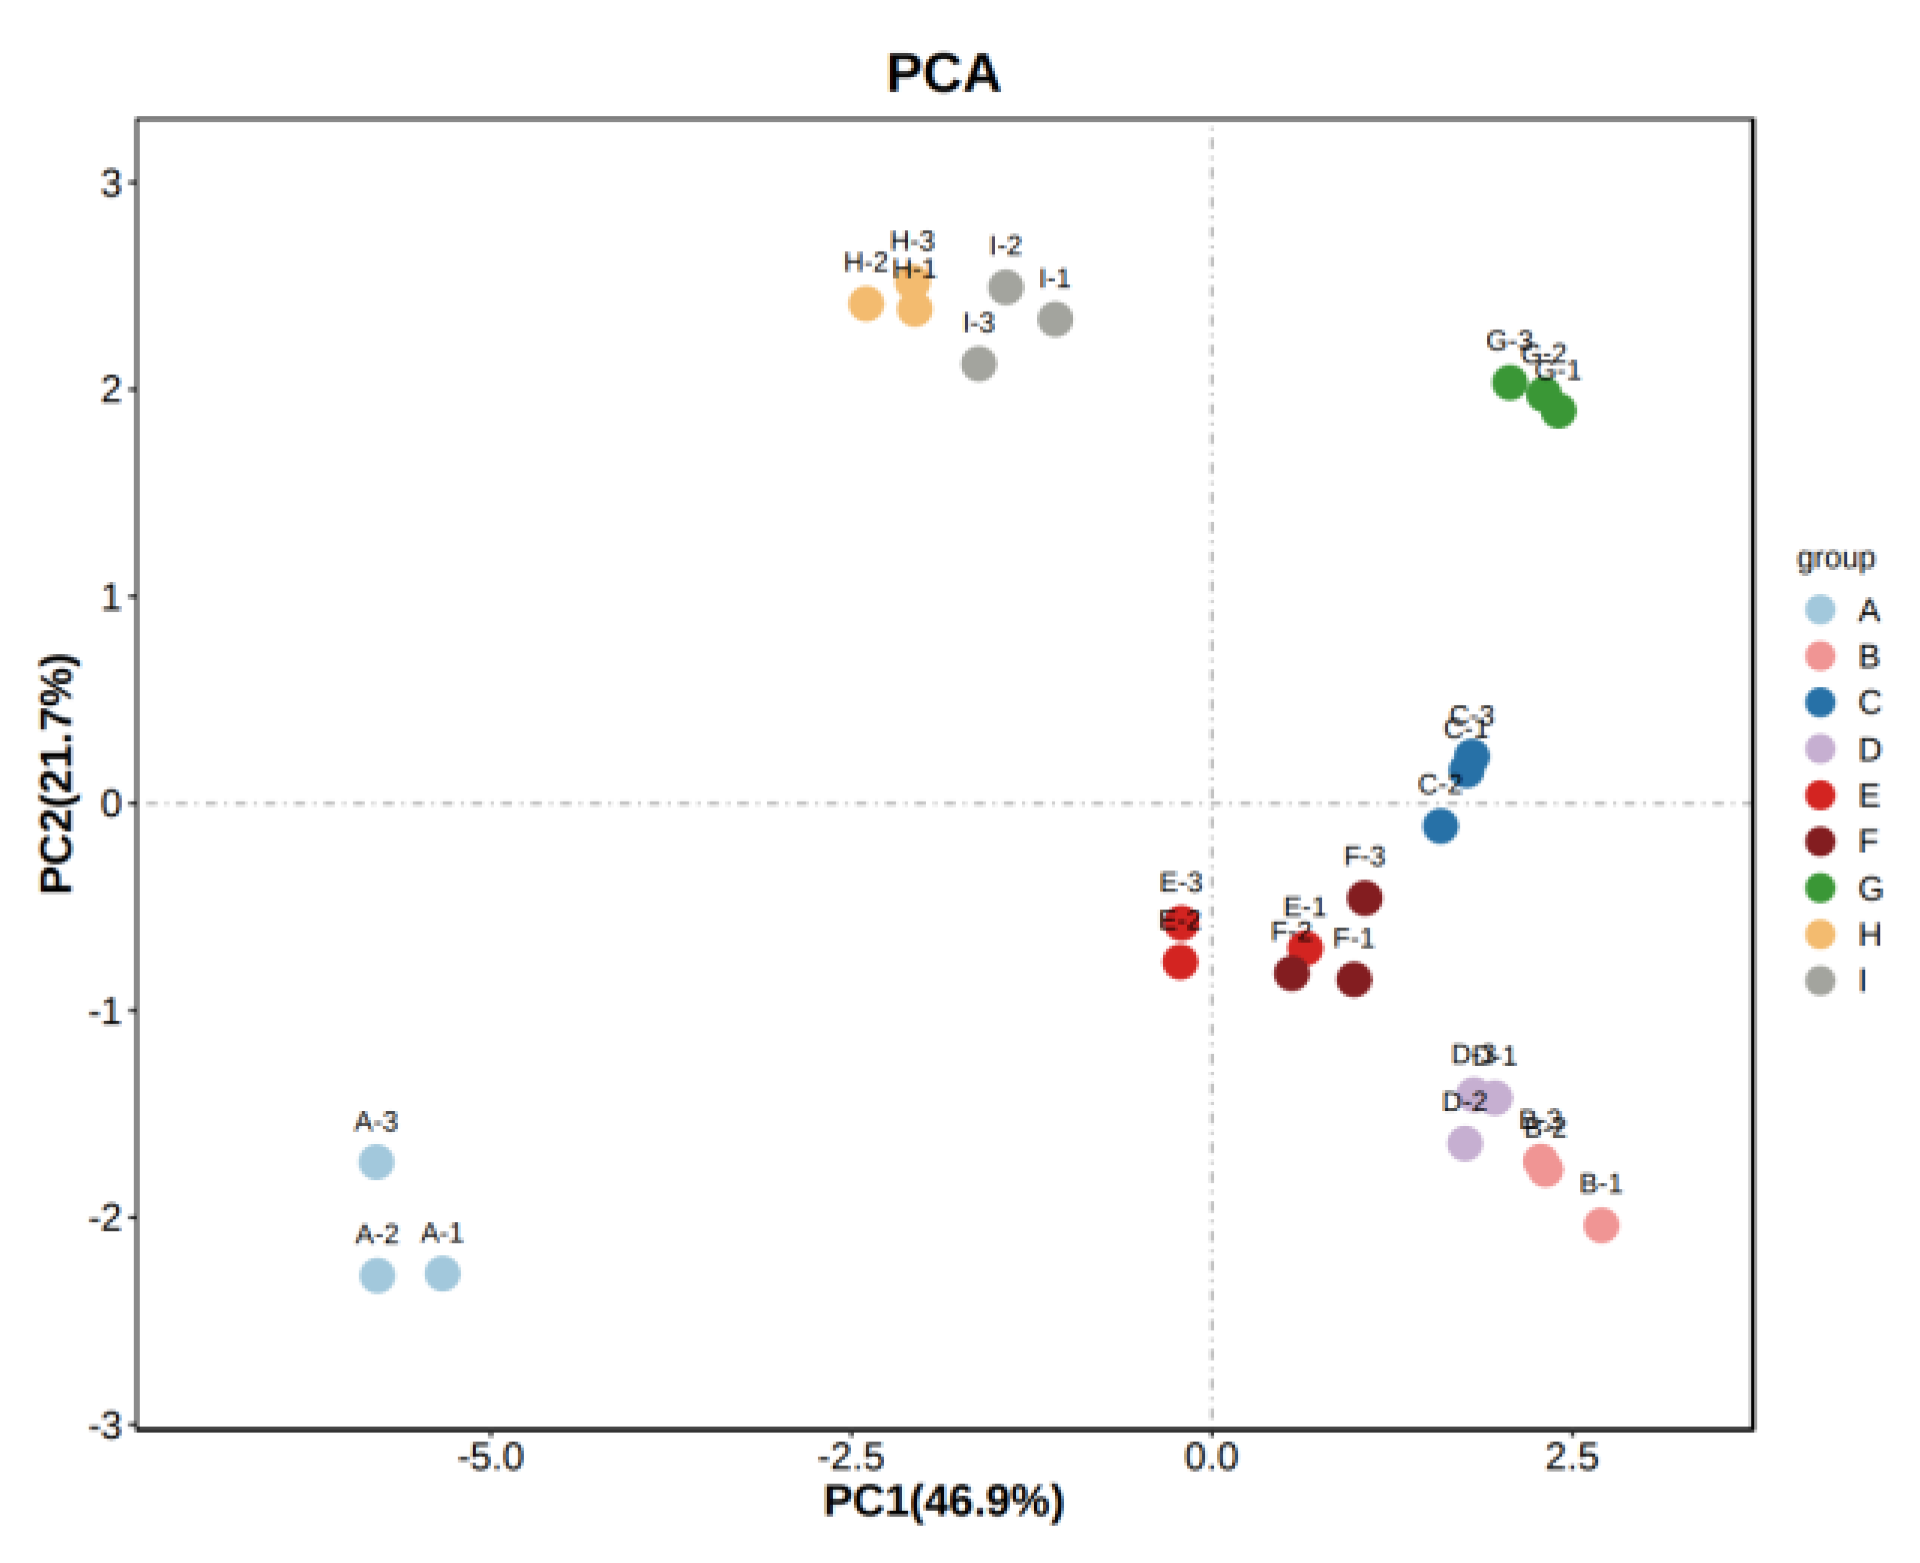
Figure 7.
PCA analysis of the sample. Note: From A to I are ‘Hassan’, ‘Zuoshaner’, ‘Beibinghong’, ‘Zuoyouhong’, ‘Beta’, ‘Shuanghong’, ‘Zijingganlu’, ‘Cabernet Sauvignon’, and ‘Syrah’.
Figure 7.
PCA analysis of the sample. Note: From A to I are ‘Hassan’, ‘Zuoshaner’, ‘Beibinghong’, ‘Zuoyouhong’, ‘Beta’, ‘Shuanghong’, ‘Zijingganlu’, ‘Cabernet Sauvignon’, and ‘Syrah’.
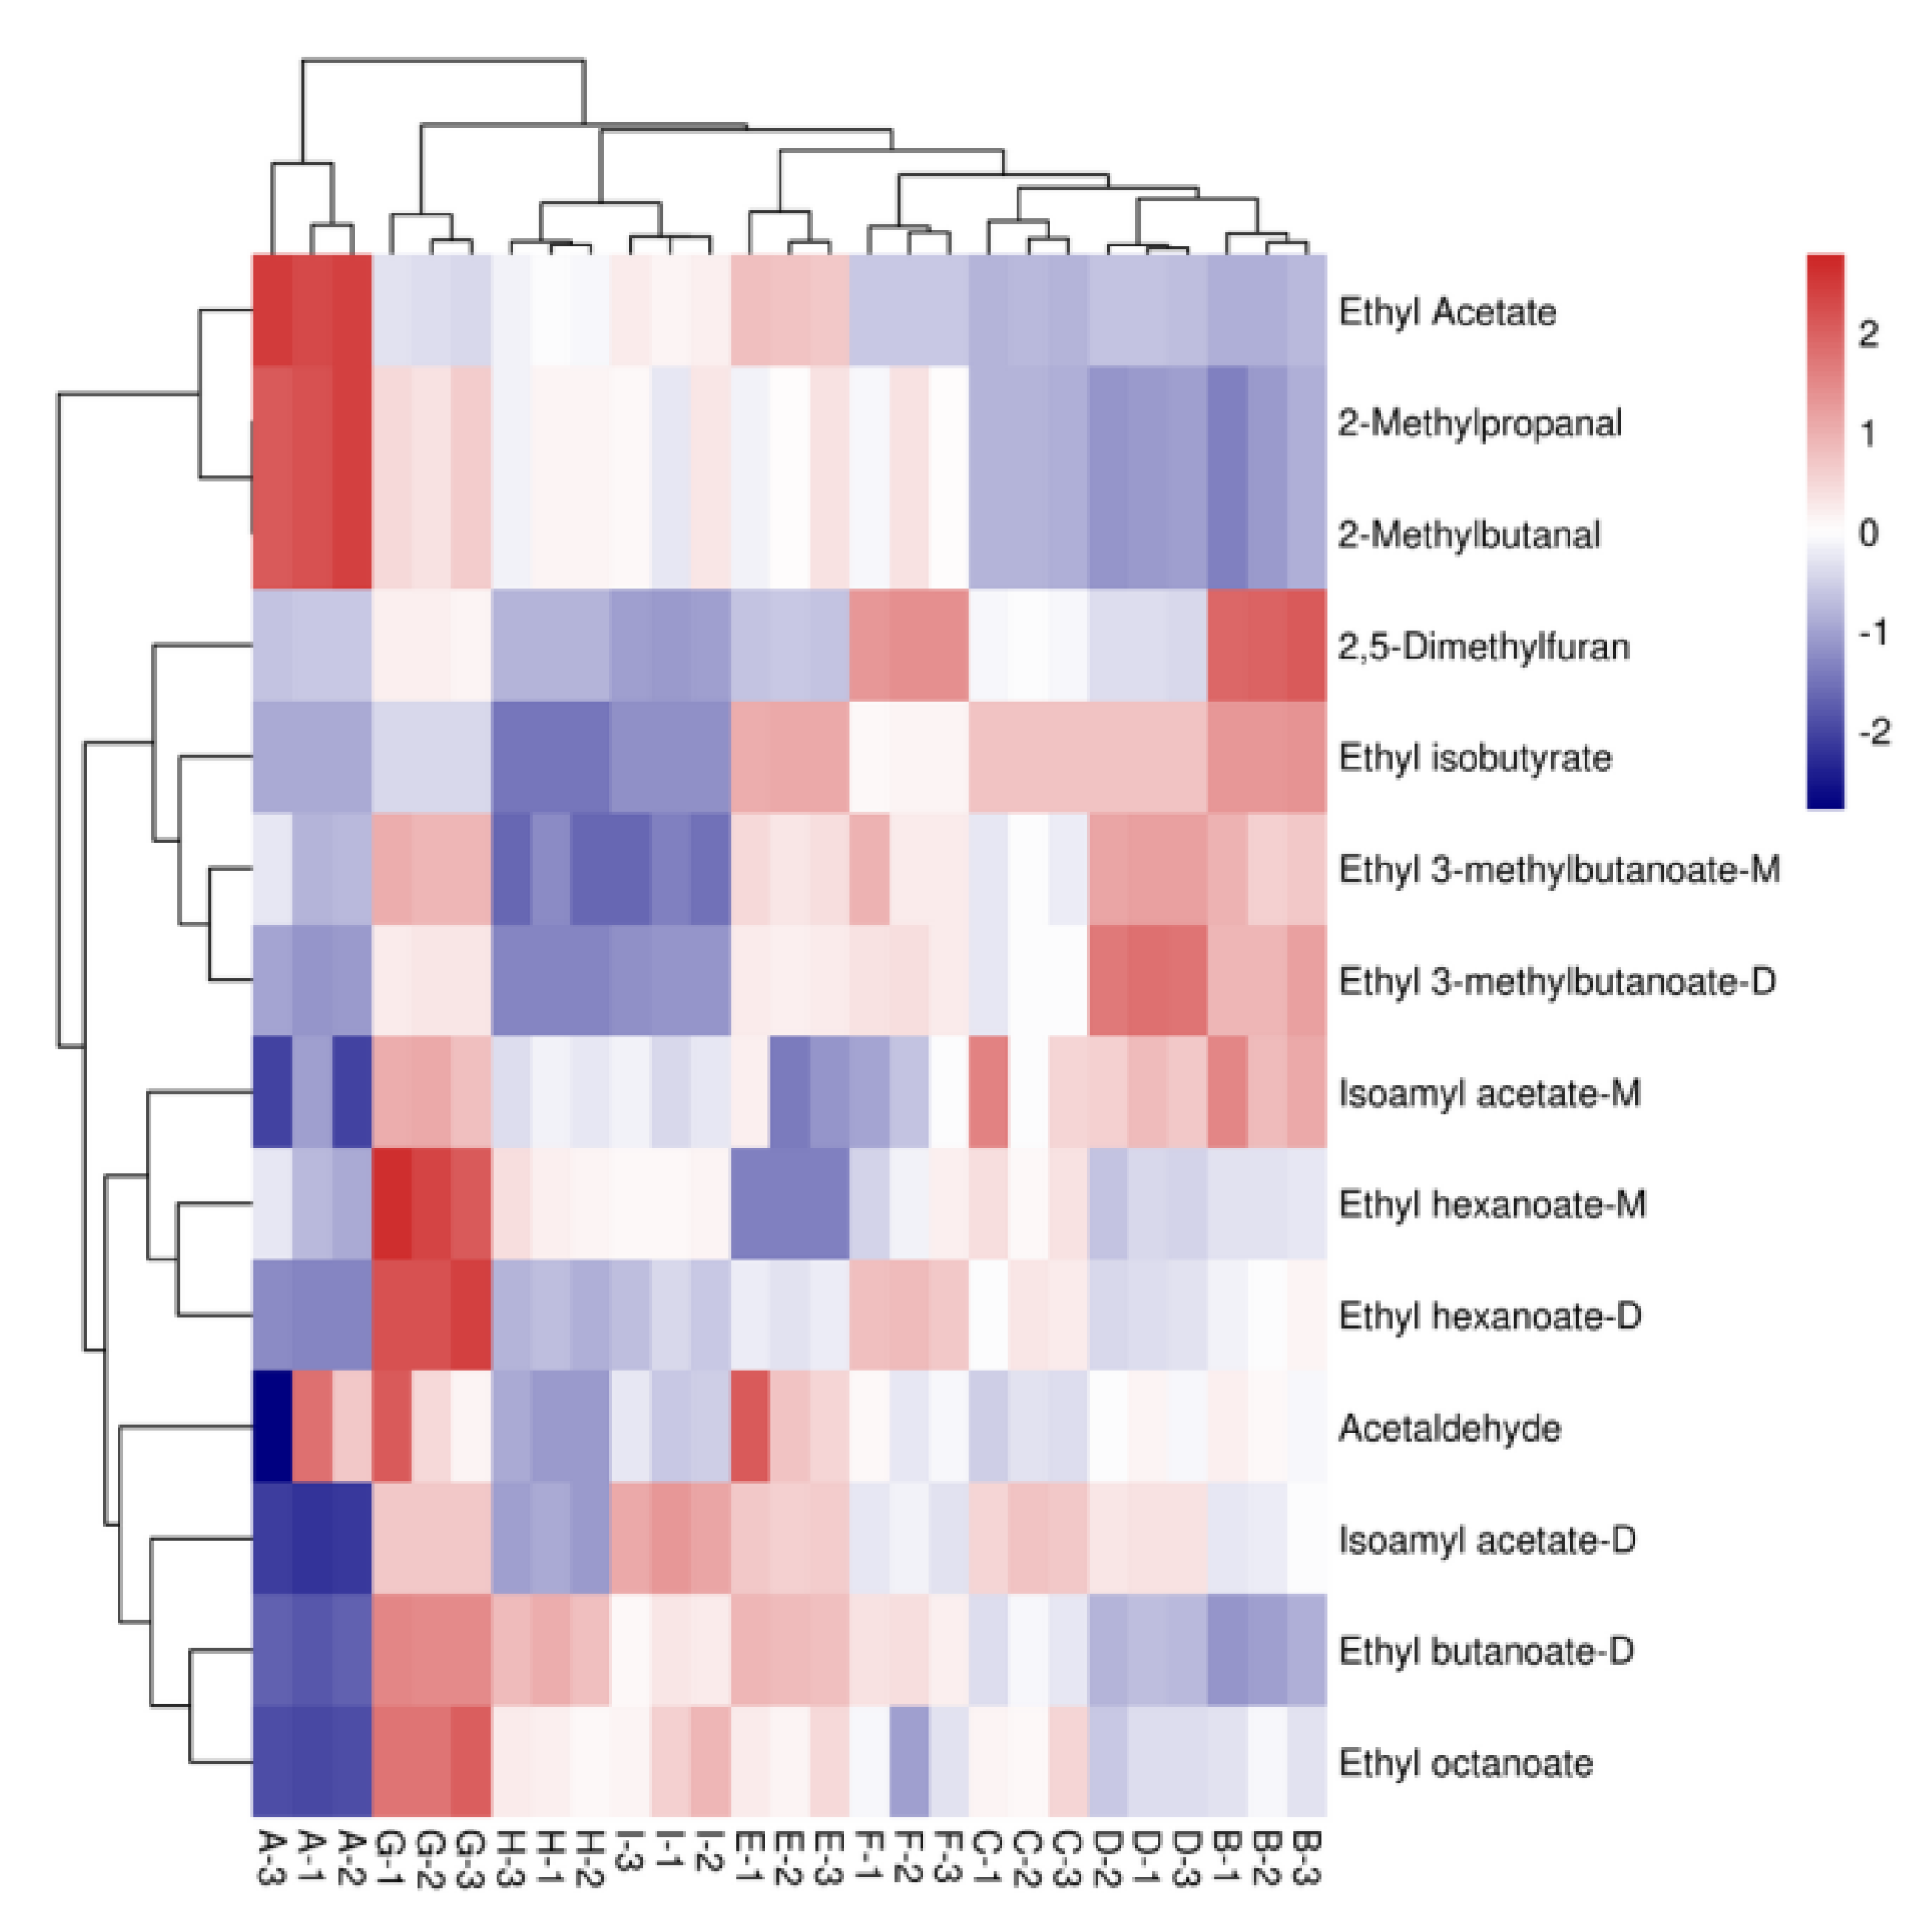
Figure 8.
Heat map analysis of aromatic compounds with OAV > 1 in nine varietal wine samples. Note: From A to I are ‘Hassan’, ‘Zuoshaner’, ‘Beibinghong’, ‘Zuoyouhong’, ‘Beta’, ‘Shuanghong’, ‘Zijingganlu’, ‘Cabernet Sauvignon’, ‘Syrah’. Note: From A to I are ‘Hassan’, ‘Zuoshaner’, ‘Beibinghong’, ‘Zuoyouhong’, ‘Beta’, ‘Shuanghong’, ‘Zijingganlu’, ‘Cabernet Sauvignon’, and ‘Syrah’.
Figure 9.
Loading diagram of PCA analysis of volatile aroma compounds with OAV values greater than 1 in nine wine varieties.
Figure 9.
Loading diagram of PCA analysis of volatile aroma compounds with OAV values greater than 1 in nine wine varieties.
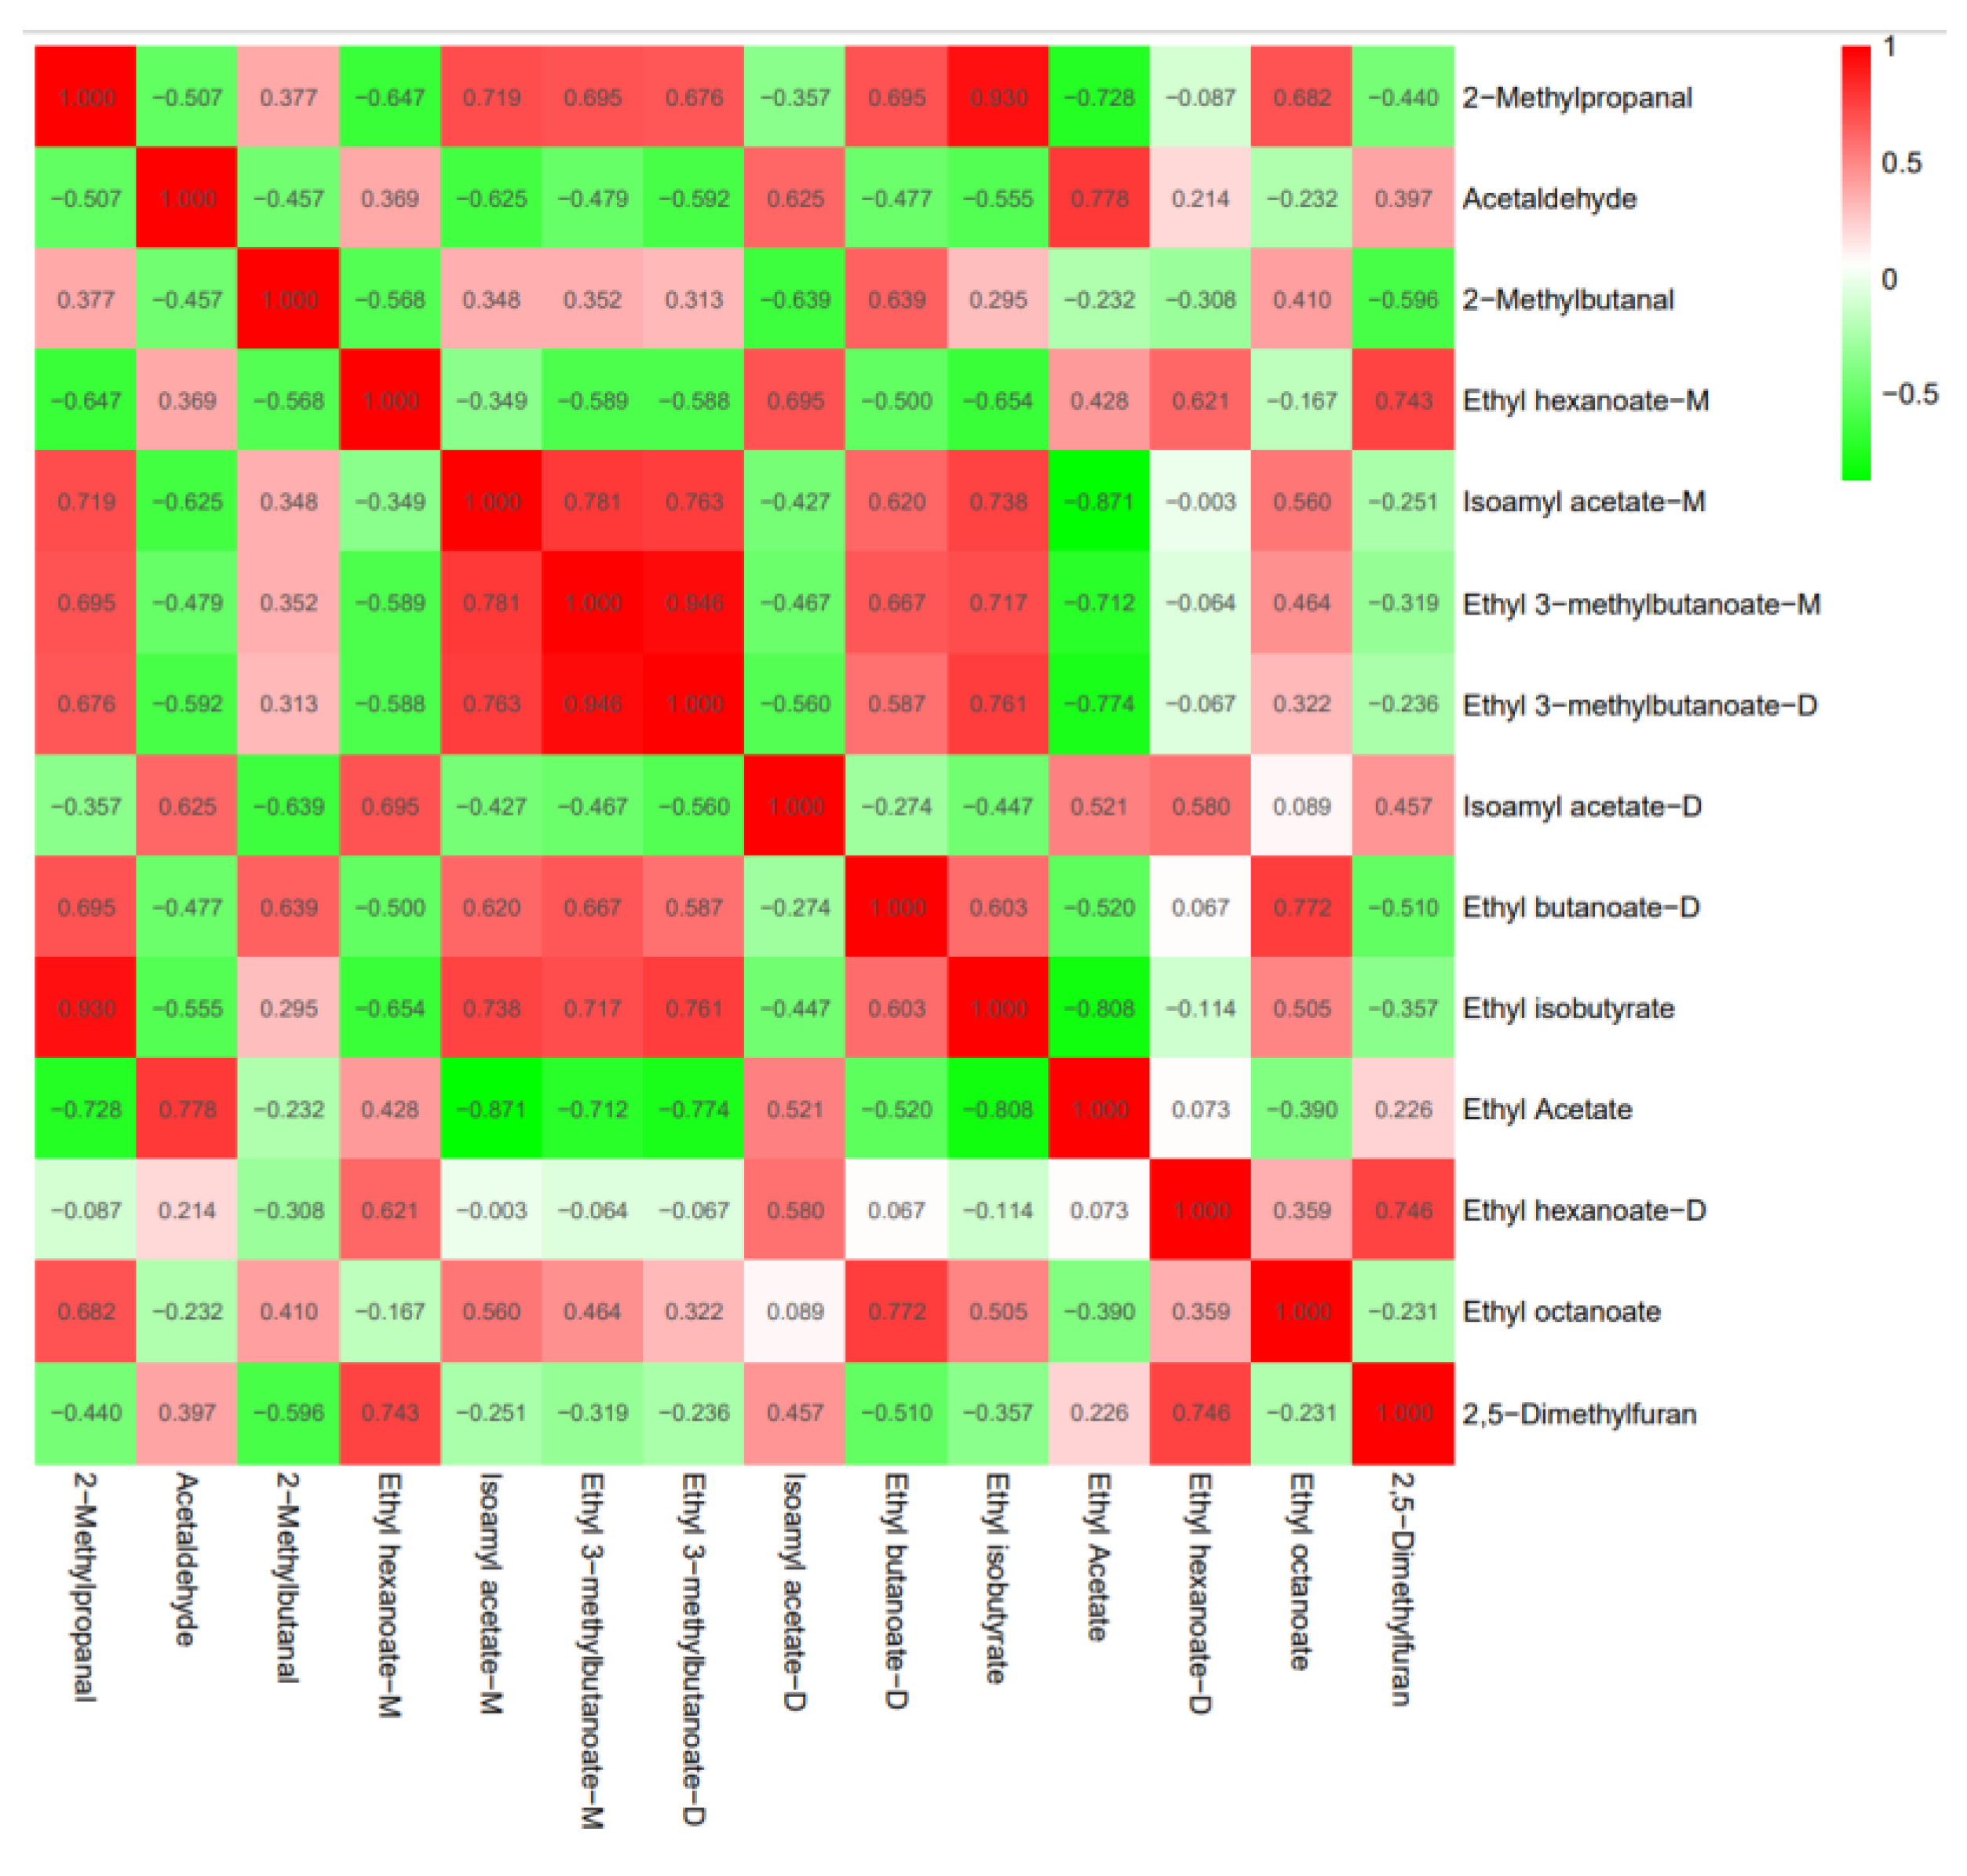
Figure 10.
Analyses of the correlation between aroma compounds and OAV greater than 1 in nine grape wine varieties.
Figure 10.
Analyses of the correlation between aroma compounds and OAV greater than 1 in nine grape wine varieties.
Figure 11.
OPLS-DA analysis of nine wine varieties. Note: From A to I are ‘Hassan’, ‘Zuoshaner’, ‘Beibinghong’, ‘Zuoyouhong’, ‘Beta’, ‘Shuanghong’, ‘Zijingganlu’, ‘Cabernet Sauvignon’, and ‘Syrah’.
Figure 11.
OPLS-DA analysis of nine wine varieties. Note: From A to I are ‘Hassan’, ‘Zuoshaner’, ‘Beibinghong’, ‘Zuoyouhong’, ‘Beta’, ‘Shuanghong’, ‘Zijingganlu’, ‘Cabernet Sauvignon’, and ‘Syrah’.
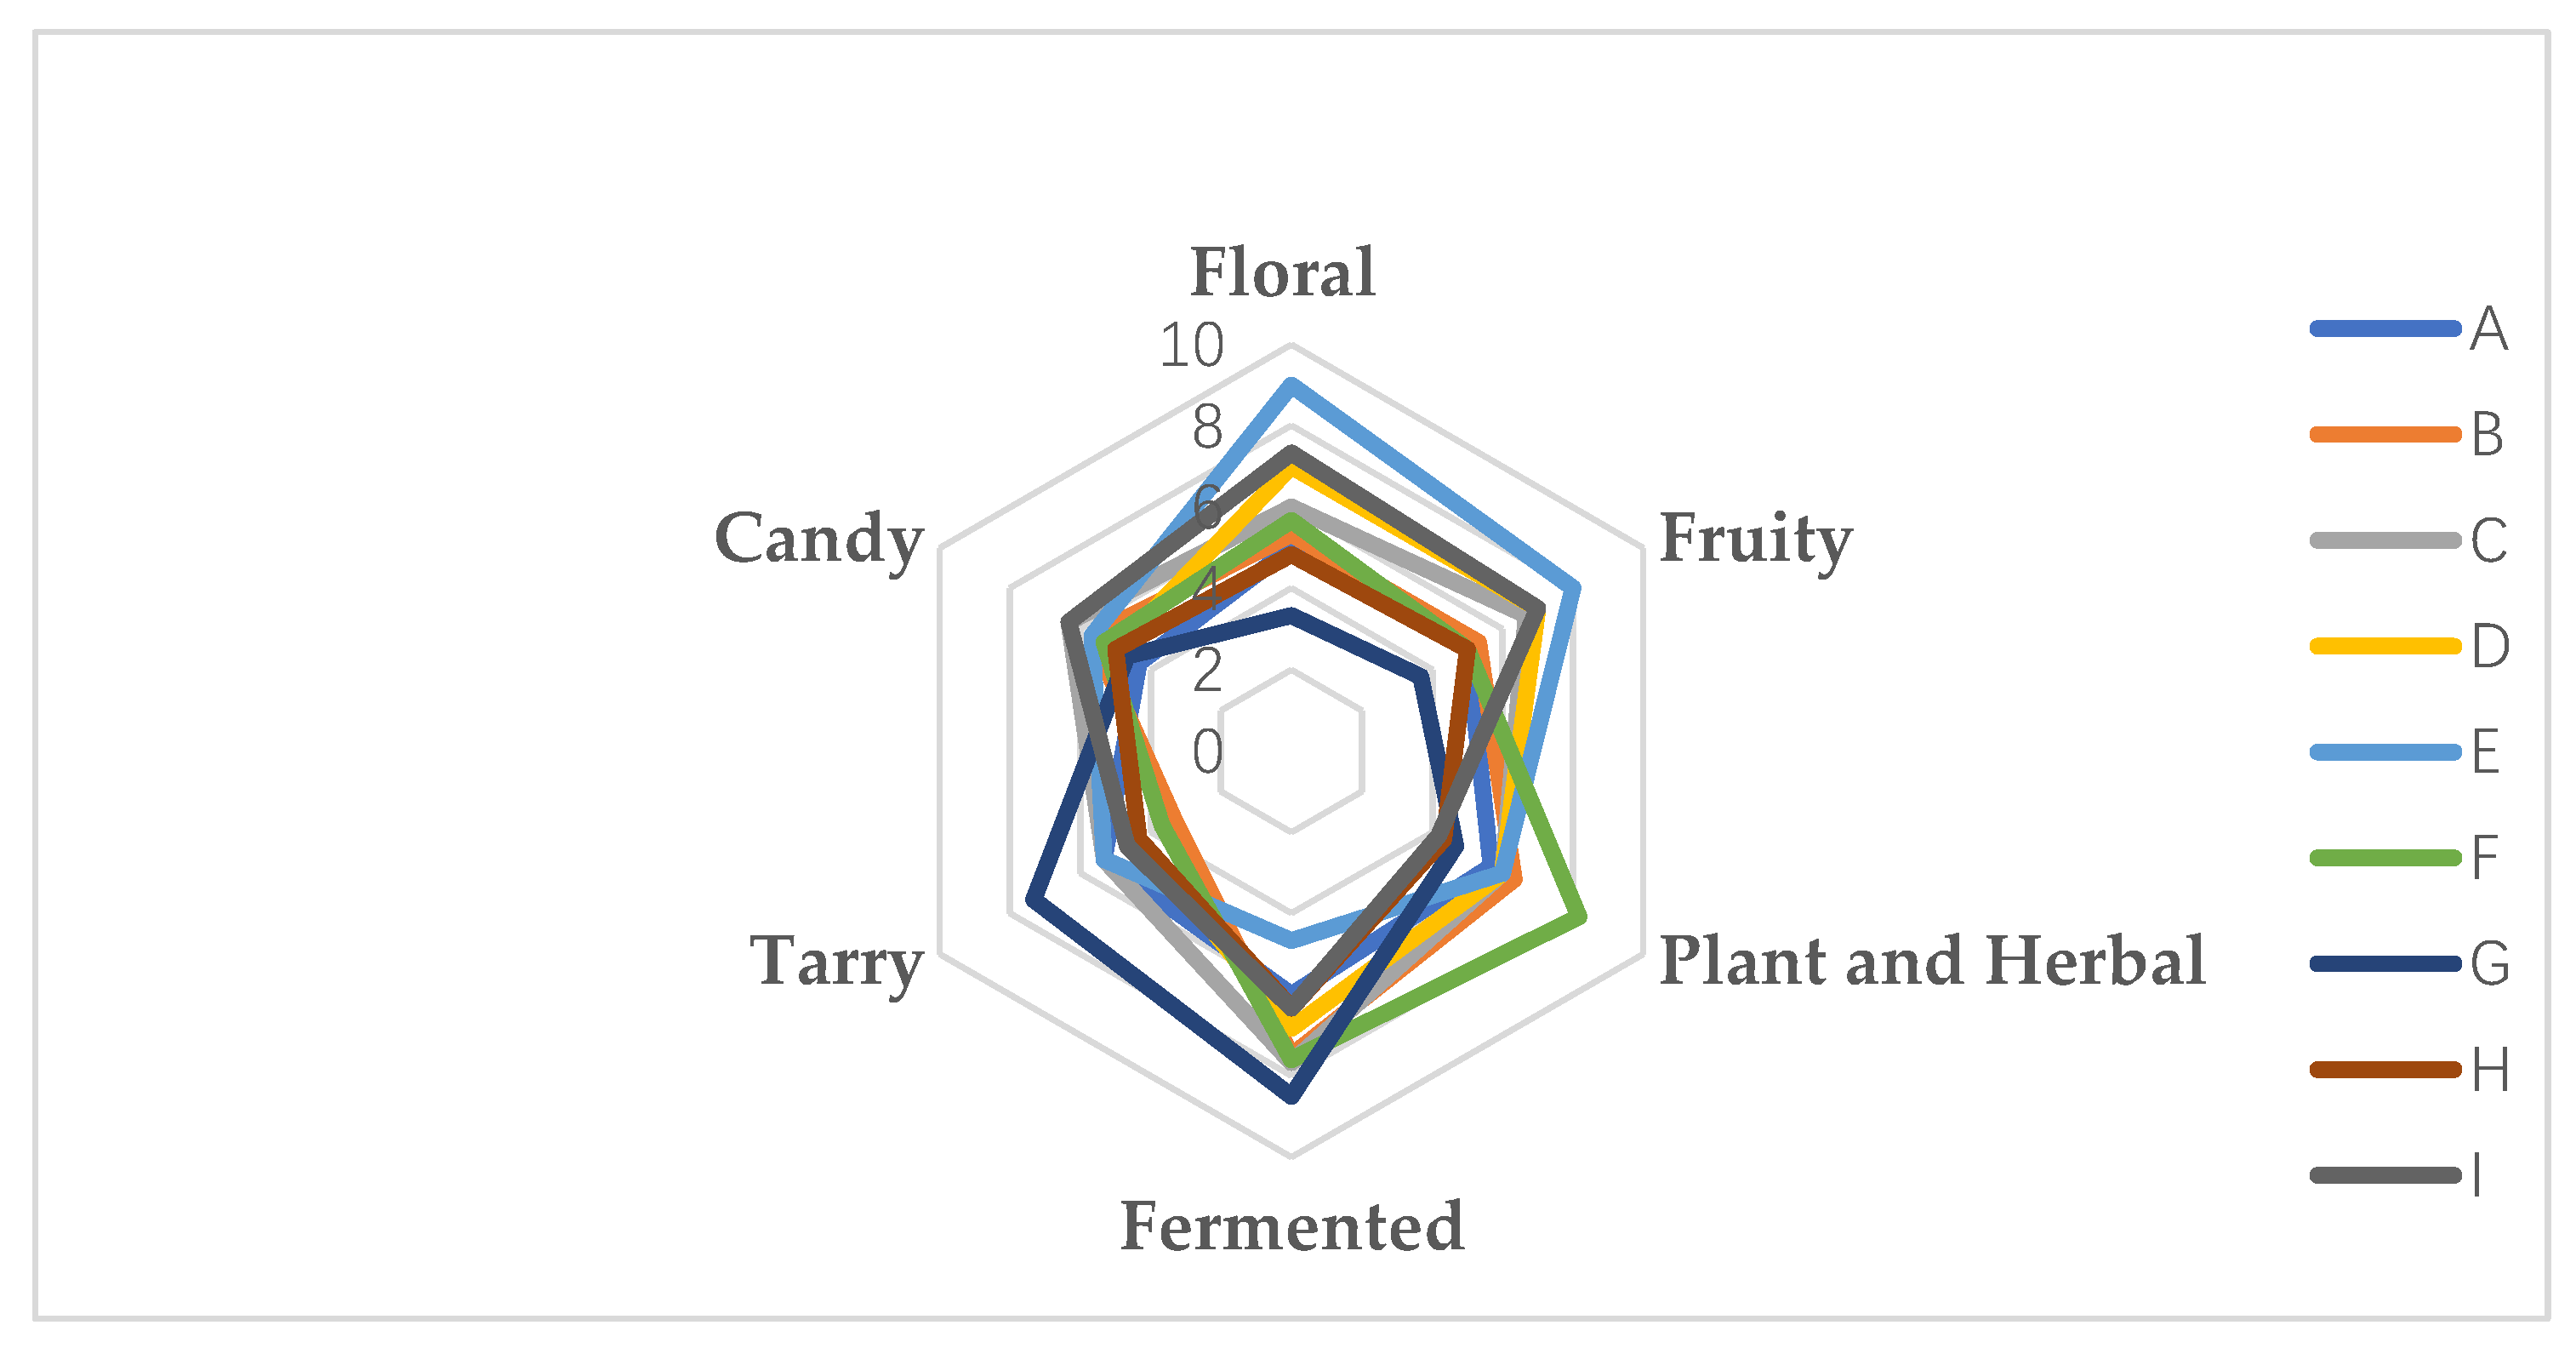
Figure 12.
Description of the quantitative aroma analysis of different wine varieties. Note: From A to I are ‘Hassan’, ‘Zuoshaner’, ‘Beibinghong’, ‘Zuoyouhong’, ‘Beta’, ‘Shuanghong’, ‘Zijingganlu’, ‘Cabernet Sauvignon’, and ‘Syrah’.
Figure 12.
Description of the quantitative aroma analysis of different wine varieties. Note: From A to I are ‘Hassan’, ‘Zuoshaner’, ‘Beibinghong’, ‘Zuoyouhong’, ‘Beta’, ‘Shuanghong’, ‘Zijingganlu’, ‘Cabernet Sauvignon’, and ‘Syrah’.
Table 1.
Organic acid standard curve.
Table 1.
Organic acid standard curve.
| Name | Standard Curves | R2 |
|---|
| Tartaric acid | f(x) = 951.0962x + 39.1049 | 0.9954 |
| Malic acid | f(x) = 524.5688x + 28.0833 | 0.9927 |
| Lactic acid | f(x) = 5993.8264x − 2.4190 | 0.9999 |
| Iceacetic acid | f(x) = 8221.6410x + 13.4295 | 0.9979 |
| Citric acid | f(x) = 1492.4554x + 3.8029 | 0.9994 |
| Succinic acid | f(x) = 873.4799x − 22.9056 | 0.9989 |
Table 2.
Gas chromatography conditions.
Table 2.
Gas chromatography conditions.
| Time (Min: Sec) | E1 (Drift Gas) | E2 (Carrier Gas) | Recording |
|---|
| 00:00,000 | 150 mL/min | 2 mL/min | rec |
| 02:00,000 | 150 mL/min | 2 mL/min | - |
| 10:00,000 | 150 mL/min | 10 mL/min | - |
| 20:00,000 | 150 mL/min | 100 mL/min | - |
| 30:00,000 | 150 mL/min | 100 mL/min | stop |
Table 3.
The basic physical and chemical indicators of the original wine.
Table 3.
The basic physical and chemical indicators of the original wine.
| Varieties | Solids (°Brix) | Titratable Acid (g/L) | Total Sugar (g/L) | Total Anthocyanin (mg/L) | Total Phenols (g/L) | Tannin (g/L) | pH Value | Dry Extract/g/L | Alcohol by Volume (v/v) |
|---|
| ‘Hassan’ | 9.40 ± 0.00 a | 11.00 ± 0.29 g | 4.10 ± 0.12 c | 151.96 ± 6.68 f | 1.61 ± 0.04 e | 2.33 ± 0.31 d | 4.13 ± 0.01 b | 31.50 ± 0.00 d | 13.00 ± 0.00 a |
| ‘Zuoshaner’ | 9.17 ± 0.06 b | 16.25 ± 0.29 a | 5.70 ± 0.35 a | 1477.85 ± 48.31 a | 3.56 ± 0.04 a | 3.59 ± 0.07 b | 3.65 ± 0.01 h | 40.80 ± 0.17 a | 11.00 ± 0.00 c |
| ‘Beibinghong’ | 8.53 ± 0.06 e | 12.69 ± 0.43 e | 2.90 ± 0.24 f | 236.57 ± 14.97 e | 1.39 ± 0.03 f | 1.76 ± 0.05 e | 3.79 ± 0.01 g | 30.90 ± 0.17 e | 12.00 ± 0.00 b |
| ‘Zuoyouhong’ | 8.77 ± 0.06 c | 13.63 ± 0.29 c | 3.60 ± 0.17 d | 600.60 ± 33.83 c | 2.17 ± 0.05 c | 2.83 ± 0.21 c | 3.65 ± 0.00 h | 33.23 ± 0.12 c | 12.00 ± 0.00 b |
| ‘Beta’ | 8.7 ± 0.10 d | 15.5 ± 0.39 b | 3.13 ± 0.23 e | 95.18 ± 9.30 h | 1.14 ± 0.04 g | 1.50 ± 0.13 g | 3.90 ± 0.01 e | 33.10 ± 0.00 c | 12.00 ± 0.00 b |
| ‘Shuanghong’ | 8.67 ± 0.58 d | 12.75 ± 0.00 d | 4.46 ± 0.21 b | 1440.56 ± 75.15 b | 3.00 ± 0.24 b | 3.64 ± 0.09 a | 3.84 ± 0.01 f | 37.13 ± 0.12 b | 13.00 ± 0.00 a |
| ‘Zijingganlu’ | 7.9 ± 0.00 g | 7.38 ± 0.29 i | 4.10 ± 0.12 c | 496.51 ± 10.74 d | 1.90 ± 0.10 d | 1.67 ± 0.10 f | 4.12 ± 0.01 c | 37.40 ± 0.17 b | 12.00 ± 0.00 b |
| ‘Cabernet Sauvignon’ | 8.1 ± 0.00 f | 8.25 ± 0.19 h | 1.65 ± 0.07 h | 108.54 ± 7.28 g | 0.82 ± 0.08 h | 1.36 ± 0.34 h | 4.39 ± 0.01 a | 27.30 ± 0.17 f | 12.00 ± 0.00 b |
| ‘Syrah’ | 8.83 ± 0.06 c | 11.31 ± 0.39 f | 2.47 ± 0.17 g | 83.49 ± 1.67 i | 0.70 ± 0.03 i | 1.30 ± 0.31 i | 4.05 ± 0.01 d | 18.70 ± 0.17 g | 13.00 ± 0.00 a |
Table 4.
CIELab parameters of different original wines.
Table 4.
CIELab parameters of different original wines.
| Varieties | L* | a* | b* | Cab* | hab* | ΔEab* |
|---|
| ‘Hassan’ | 66.91 ± 0.06 e | 40.15 ± 0.01 d | 7 ± 0.28 e | 40.75 ± 0.21 e | 9.89 ± 0.48 f | 29.16 e |
| ‘Zuoshaner’ | 41.65 ± 0.10 i | 167.48 ± 0.07 a | 21.76 ± 0.17 a | 168.89 ± 0.10 a | 7.4 ± 0.77 g | 157.30 a |
| ‘Beibinghong’ | 73.76 ± 0.12 d | 35.46 ± 0.07 f | 7.24 ± 0.30 d | 36.2 ± 0.14 f | 11.54 ± 0.28 e | 21.46 f |
| ‘Zuoyouhong’ | 59.72 ± 0.04 g | 52 ± 0.1 c | 13.12 ± 0.11 c | 53.63 ± 0.69 b | 14.16 ± 0.54 c | 43.59 c |
| ‘Beta’ | 76.97 ± 0.06 c | 28.87 ± 0.14 g | 6.87 ± 0.24 f | 29.68 ± 0.14 g | 13.39 ± 0.17 d | 14.15 g |
| ‘Shuanghong’ | 59.65 ± 0.11 h | 53.3 ± 0.26 b | 4.95 ± 0.07 h | 53.53 ± 0.24 c | 5.31 ± 0.27 h | 44.04 b |
| ‘Zijingganlu’ | 63.22 ± 0.11 f | 39.84 ± 0.07 e | 17.34 ± 0.28 b | 43.46 ± 0.19 d | 23.52 ± 0.4 a | 33.43 d |
| ‘Cabernet Sauvignon’ | 83.01 ± 0.06 b | 22.48 ± 0.06 h | 1.58 ± 0.19 i | 22.54 ± 0.07 h | 4.02 ± 0.07 i | 6.94 h |
| ‘Syrah’ | 84.65 ± 0.12 a | 17.05 ± 0.14 i | 5.57 ± 0.11 g | 17.93 ± 0.11 i | 18.09 ± 0.25 b | |
Table 5.
Comparison of Organic Acids in Different Variety Wine Samples.
Table 5.
Comparison of Organic Acids in Different Variety Wine Samples.
| Varieties | Tartaric Acid/g/L | Malic Acid/g/L | Lactic Acid/g/L | Acetic Acid/g/L | Citric Acid/g/L | Succinic Acid/g/L |
|---|
| ‘Hassan’ | 3.5 ± 0.14 f | 5.97 ± 0.2 c | 0.18 ± 0 a | 0.09 ± 0 e | 0.31 ± 0.06 i | 0.39 ± 0.04 i |
| ‘Zuoshaner’ | 7.99 ± 0.02 a | 6.26 ± 0.22 b | 0.11 ± 0.02 d | 0.13 ± 0.02 a | 0.45 ± 0.02 f | 0.85 ± 0.05 a |
| ‘Beibinghong’ | 6.13 ± 0.1 c | 5.17 ± 0.16 e | 0.13 ± 0.01 b | 0.12 ± 0 b | 0.42 ± 0.04 g | 0.83 ± 0.14 b |
| ‘Zuoyouhong’ | 6.84 ± 0.03 b | 3.28 ± 0.08 g | 0.1 ± 0 e | 0.09 ± 0 e | 0.89 ± 0.43 a | 0.64 ± 0.1 f |
| ‘Beta’ | 3.2 ± 0.51 g | 9.51 ± 0.04 a | 0.11 ± 0.02 d | 0.1 ± 0.01 d | 0.41 ± 0.02 h | 0.58 ± 0.02 g |
| ‘Shuanghong’ | 4.82 ± 0.16 d | 5.22 ± 0 d | 0.11 ± 0.01 d | 0.11 ± 0.01 c | 0.59 ± 0.07 c | 0.68 ± 0.02 e |
| ‘Zijingganlu’ | 6.08 ± 3.39 c | 4.35 ± 0.22 f | 0.18 ± 0 a | 0.12 ± 0 b | 0.54 ± 0.06 d | 0.75 ± 0.1 c |
| ‘Cabernet Sauvignon’ | 3.16 ± 0.34 g | 2.85 ± 0.21 h | 0.12 ± 0.02 c | 0.11 ± 0.02 c | 0.48 ± 0.02 e | 0.69 ± 0.02 d |
| ‘Syrah’ | 3.6 ± 0.29 e | 2.03 ± 2.2 i | 0.04 ± 0.04 f | 0.07 ± 0 f | 0.65 ± 0.1 b | 0.48 ± 0.29 h |
Table 6.
Composition of volatile compounds in different varieties of wine grapes.
Table 6.
Composition of volatile compounds in different varieties of wine grapes.
| Serial Number | Aromatic Substances | Aroma Description [61,62,63,64] | Aroma Content of Dry Wine (μg·L−1) |
|---|
| ‘Hassan’ | ‘Zuoshaner’ | ‘Beibinghong’ | ‘Zuoyouhong’ | ‘Beta’ | ‘Shuanghong’ | ‘Zijingganlu’ | ‘Cabernet Sauvignon’ | ‘Syrah’ |
|---|
| 1 | (Z)-3-Hexenol-M | Green, herbal and green leafy aromas | 219.93 ± 5.82 a | 83.6 ± 5.27 e | 75.31 ± 2.25 e, f | 146.84 ± 2.45 b | 123.7 ± 1.06 c | 71.48 ± 2.49 f | 95.83 ± 2.04 d | 56.8 ± 7.98 g | 67.5 ± 4.48 f |
| 2 | (Z)-3-Hexenol-D | Green, herbal and green leafy aromas | 111.83 ± 7.15 a | 50.28 ± 10.43 c | 45.79 ± 8.90 c | 68.03 ± 2.54 b | 57.05 ± 4.74 b, c | 53.94 ± 6.40 c | 49.75 ± 2.86 c | 44.18 ± 4.76 c | 48.35 ± 6.59 c |
| 3 | 1-Hexanol-M | Fruity, grassy notes, toast | 993.2 ± 31.14 e | 1489.47 ± 33.34 c | 1458.09 ± 27.54 c | 1047.64 ± 10.79 e | 1176.86 ± 23.21 d | 1785.85 ± 39.79 b | 2148.75 ± 22.60 a | 866.76 ± 43.55 f | 763.5 ± 54.40 g |
| 4 | 1-Hexanol-D | Fruity, grassy notes, toast | 250.77 ± 7.33 e | 531.65 ± 27.26 c | 520.52 ± 35.14 c, f | 255.52 ± 3.06 e | 334.53 ± 8.60 d | 852.4 ± 56.36 b | 1086.67 ± 44.75 a | 193.55 ± 22.34 f, g | 147.21 ± 8.75 g |
| 5 | 3-Methyl-1-butanol-M | Mellow, astringent | 943.59 ± 43.05 a | 812.45 ± 20.57 cd | 851.48 ± 58.57 a, b, c | 832.52 ± 12.27 b, c | 728.86 ± 7.58 d | 788.4 ± 26.71 c, d | 935.34 ± 105.14 a | 922.77 ± 22.03 b | 851.84 ± 34.46 a, b, c |
| 6 | 3-Methyl-1-butanol-D | Mellow, astringent | 8554.48 ± 65.80 b | 9002.29 ± 61.26 a | 8917.16 ± 29.07 a | 9007.77 ± 17.74 a | 8822.4 ± 32.81 a | 8833.33 ± 73.64 a | 7499.75 ± 226.82 c | 8501.83 ± 56.82 b | 8623.55 ± 98.46 b |
| 7 | 1-Penten-3-ol | Fruity | 180.15 ± 6.58 g | 422.62 ± 3.88 a | 273.28 ± 2.76 c | 207.08 ± 3.72 f | 253.62 ± 7.64 d | 362.33 ± 8.57 b | 231.4 ± 6.16 e | 153.23 ± 2.16 h | 126.9 ± 1.08 i |
| 8 | 1-Butanol-M | Special odors | 30.89 ± 2.21 e | 46.04 ± 0.63 b | 44.76 ± 2.24 b | 49.88 ± 0.43 a | 41.02 ± 1.30 c | 35.95 ± 1.11 d | 37.56 ± 1.29 d | 40.67 ± 0.65 c | 41.79 ± 0.70 c |
| 9 | 2-Methyl-1-propanol-M | | 599.96 ± 19.24 b, c | 485.74 ± 5.37 f | 520.61 ± 15.98 e | 569.07 ± 2.20 d | 422.76 ± 4.62 g | 592.53 ± 6.57 c | 614.99 ± 4.60 b | 672.12 ± 6.35 a | 688.27 ± 1.72 a |
| 10 | Ethanol-M | wine and the pungent, spicy odor | 1311.88 ± 4.81 d | 1412.74 ± 3.20 c | 1304.91 ± 41.78 d | 1249.25 ± 7.25 d | 1017.47 ± 42.28 e | 1400.59 ± 53.93 c | 1253.61 ± 13.68 d | 1569.31 ± 41.81 a | 1496.54 ± 39.95 b |
| 11 | Ethanol-D | wine and the pungent, spicy odor | 17,200.55 ± 166.71 e | 17,352.84 ± 34.20 d | 17,798.05 ± 26.27 b | 18,102.52 ± 22.43 a | 16,638.7 ± 46.46 g | 16,941.58 ± 25.13 f | 17,386.46 ± 12.28 d | 17,448.73 ± 89.54 d | 17,608.47 ± 82.23 c |
| 12 | 2-Butanol | Wine-like odor | 593.84 ± 8.65 e | 652.72 ± 3.55 d | 680.19 ± 7.70 c | 536.98 ± 5.95 f | 825.02 ± 4.29 a | 672.46 ± 1.25 c | 734.18 ± 5.04 b | 650.18 ± 3.60 d | 642.3 ± 1.67 d |
| 13 | 1-Propanol-D | Alcohol, ripe fruit flavors | 1927.28 ± 43.20 a | 1566.62 ± 8.78 c | 1707.77 ± 10.83 b | 1668.13 ± 6.05 b | 1355.04 ± 17.80 e | 1312.49 ± 31.82 ef | 1292.1 ± 25.09 f | 1430.85 ± 1.21 d | 1414.43 ± 26.39 d |
| 14 | 1-Butanol-D | Special odors | 140.48 ± 2.50 f | 173.58 ± 2.91 cd | 161.83 ± 8.88 d | 251.07 ± 2.13 a | 186.02 ± 3.73 c | 155.53 ± 9.21 d | 172.18 ± 2.93 d | 211.73 ± 4.79 b | 202.27 ± 13.18 b |
| 15 | 2-Methyl-1-propanol-D | Alcoholic, Solvent odor, bitter | 7330.75 ± 11.62 f | 8376.08 ± 72.80 b | 8048.6 ± 94.01 c | 7487.12 ± 14.88 e | 9058.24 ± 33.52 a | 7503.18 ± 64.89 e | 7637.66 ± 23.50 d | 7003.94 ± 79.59 g | 6898.94 ± 104.89 g |
| 16 | 1-Pentanol | | 200.64 ± 7.80 e | 312.44 ± 1.83 b | 276.91 ± 2.74 c | 277.8 ± 5.20 c | 338.53 ± 4.28 a | 271.75 ± 1.42 c | 231.89 ± 3.68 d | 230.94 ± 5.58 d | 236.83 ± 6.41 d |
| Alcohols | Subtotal | 40,590.22 | 42,771.16 | 42,685.26 | 41,757.22 | 41,379.82 | 41,633.79 | 41,408.12 | 39,997.59 | 39,858.69 |
| Percentage | 61.38% | 61.29% | 60.91% | 60.86% | 58.63% | 60.27% | 58.34% | 62.21% | 59.58% |
| 1 | Acetone | Peculiar pungent odor | 1343.69 ± 8.95 b | 796.44 ± 5.12 f | 690.35 ± 4.18 h | 734.68 ± 7.79 g | 961.93 ± 17.62 d | 1273.48 ± 6.76 c | 1400.14 ± 22.29 a | 862.79 ± 12.17 e | 756.29 ± 6.78 g |
| 2 | 4-Methyl-2-pentanone | Pleasant keto-like fragrance | 108.68 ± 0.44 a | 44.75 ± 1.02 e | 44.49 ± 0.53 e | 38.13 ± 1.20 f | 92.75 ± 0.55 b | 56.24 ± 0.82 d | 59.14 ± 3.98 d | 62.94 ± 2.04 c | 63.08 ± 2.42 c |
| 3 | 2-Pentanone | | 115.41 ± 7.70 a | 89.19 ± 1.89 d, e | 88.68 ± 2.38 d, e, f | 92.82 ± 2.59 c, d | 103.18 ± 1.06 b | 80.53 ± 5.79 f, g | 98.7 ± 1.31 b, c | 73.21 ± 2.79 g | 83.68 ± 5.43 e, f |
| 4 | 1-Hydroxy-2-propanone | | 131.49 ± 6.64 e | 154.86 ± 3.78 c | 144.97 ± 0.98 d | 167.15 ± 1.03 b | 193.62 ± 5.02 a | 150.96 ± 3.03 cd | 157.11 ± 6.42 c | 119.97 ± 6.75 f | 127.01 ± 2.74 e, f |
| Ketones | Subtotal | 1699.27 | 1085.24 | 968.49 | 1032.78 | 1351.48 | 1561.21 | 1715.09 | 1118.91 | 1030.06 |
| Percentage | 2.57% | 1.56% | 1.38% | 1.51% | 1.91% | 2.26% | 2.42% | 1.74% | 1.54% |
| 1 | 2-Methylpropanal | Pungent odor | 30.59 ± 1.15 f | 60.48 ± 0.41 b | 52.04 ± 0.62 c | 40.2 ± 0.99 d | 64.01 ± 1.66 a | 32.19 ± 0.57 ef | 41.1 ± 3.31 d | 25.19 ± 0.56 g | 34.29 ± 1.49 e |
| 2 | Propanal-M | | 119.46 ± 29.61 a | 78.61 ± 0.81 b | 77 ± 2.68 b | 70.94 ± 0.43 b | 123.98 ± 12.54 a | 73.21 ± 0.36 b | 113.58 ± 16.29 a | 85.86 ± 1.20 b | 76.04 ± 1.34 b |
| 3 | Propanal-D | | 70.89 ± 28.49 a | 34.77 ± 0.72 d | 43.08 ± 2.16 c, d | 41.63 ± 1.56 c, d | 66.61 ± 10.15 a, b | 49.13 ± 4.08 a, b, c, d | 46.83 ± 12.25 b, c, d | 58.45 ± 2.62 a, b, c | 51.27 ± 0.52 a, b, c, d |
| 4 | Acetaldehyde | Fruity, coffee aroma | 1937.65 ± 475.32 a, b | 1968.56 ± 28.65 a, b | 1879.14 ± 22.19 a, b | 1957.42 ± 21.52 a, b | 2179.87 ± 170.56 a | 1941.76 ± 33.16 a, b | 2133.78 ± 205.86 a, b | 1751.3 ± 16.99 b | 1864.54 ± 33.56 a, b |
| 5 | 2-Methylbutanal | Stimulating, chocolatey | 60.32 ± 1.68 a | 29.19 ± 2.38 d | 31.73 ± 0.22 d | 29.24 ± 0.64 d | 40.21 ± 2.35 b, c | 40.44 ± 2.02 bc | 44.02 ± 1.25 b | 39.95 ± 1.40 c | 39.75 ± 2.63 c |
| 6 | 3-Methylbutanal | Apple Scent | 22.26 ± 1.65 g | 84.87 ± 1.16 a | 63.59 ± 0.74 c | 76.37 ± 0.87 b | 45.89 ± 0.89 d | 39.61 ± 1.97 e | 65.12 ± 0.44 c | 33.24 ± 1.10 f | 35.86 ± 2.20 f |
| 7 | Pentanal | Pungent odor | 126.14 ± 6.45 a | 61.69 ± 1.85 d | 57.87 ± 1.66 d | 45.71 ± 0.85 e | 85.07 ± 0.52 b | 71.37 ± 2.20 c | 75.55 ± 0.78 c | 70.98 ± 2.09 c | 49.46 ± 2.15 e |
| 8 | Benzaldehyde | Bitter almond, cherry, nutty aroma | 68.81 ± 4.51 a | 35.84 ± 0.52 d | 59.19 ± 1.93 b | 49.39 ± 4.36 c | 40.27 ± 6.08 c, d | 48.03 ± 4.93 c | 73.65 ± 5.17 a | 47.81 ± 6.73 c | 38.19 ± 3.10 d |
| Aldehydes | Subtotal | 2436.12 | 2354.01 | 2263.64 | 2310.9 | 2645.91 | 2295.74 | 2593.63 | 2112.78 | 2189.4 |
| Percentage | 3.68% | 3.37% | 3.23% | 3.37% | 3.75% | 3.32% | 3.65% | 3.29% | 3.27% |
| 1 | Ethyl hexanoate-M | Currant, pineapple aroma | 120.68 ± 7.68 e | 128.09 ± 0.46 c, d, e | 139.55 ± 3.89 b | 123.31 ± 2.49 d, e | 106.12 ± 0.41 f | 130.75 ± 6.86 b, c, d | 181.84 ± 5.76 a | 139.11 ± 3.07 b | 136.07 ± 0.90 b, c |
| 2 | Isoamyl acetate-M | | 165.22 ± 12.28 d | 226.87 ± 7.65 a | 216.88 ± 17.25 a, b | 217.1 ± 2.93 a, b | 184.85 ± 18.82 c, d | 189.96 ± 10.19 c | 223.1 ± 3.45 a | 196.68 ± 2.20 b, c | 196.31 ± 2.81 b, c |
| 3 | Ethyl 3-methylbutanoate-M | Fragrant and fruity with aromas of wine | 129.41 ± 13.88 e | 193.65 ± 10.56 b, c | 150.77 ± 5.84 d | 214.36 ± 2.11 a | 176.46 ± 3.01 c | 181.36 ± 19.43 c | 203.01 ± 4.04 a, b | 86.33 ± 10.13 f | 86.35 ± 6.43 f |
| 4 | Ethyl 3-methylbutanoate-D | Fragrant and fruity with aromas of wine | 21.57 ± 2.67 e | 95 ± 5.08 b | 56.12 ± 4.63 d | 121.4 ± 2.46 a | 68.08 ± 0.80 c | 71.79 ± 2.46 c | 69.68 ± 1.28 c | 13.65 ± 0.72 f | 18.95 ± 0.82 e, f |
| 5 | Isoamyl acetate-D | Banana odor | 1890.69 ± 68.65 f | 4244.71 ± 131.95 d | 5204.44 ± 149.57 b | 4833.19 ± 23.81 c | 5168.42 ± 53.54 b | 4176.63 ± 98.52 d | 5264.53 ± 5.76 b | 3254.9 ± 85.74 e | 5813.75 ± 112.82 a |
| 6 | Ethyl butanoate-D | Sour fruit, banana and strawberry flavors, floral and fruity aromas | 631.01 ± 12.13 g | 785.32 ± 30.82 f | 955.85 ± 32.11 d | 845.43 ± 12.87 e | 1190.59 ± 11.08 b | 1075.47 ± 23.48 c | 1328.06 ± 9.43 a | 1201.34 ± 20.78 b | 1049.94 ± 26.47 c |
| 7 | Isobutyl acetate-D | Ripe fruit aroma | 540.83 ± 12.29 f | 589.71 ± 18.34 d | 658.25 ± 15.16 c | 330.02 ± 4.15 i | 1472.49 ± 5.54 a | 566.8 ± 9.54 e | 810.33 ± 1.95 b | 513.2 ± 11.46 g | 490.21 ± 9.16 h |
| 8 | Propyl acetate | Fruity scent | 141.04 ± 1.59 a | 79.25 ± 1.92 e, f | 75.6 ± 1.43 f | 55.65 ± 1.17 h | 119.18 ± 2.83 b | 82.71 ± 1.87 d, e | 84.52 ± 1.67 d | 99.86 ± 0.99 c | 63.08 ± 2.40 g |
| 9 | Ethyl isobutyrate | | 325.2 ± 6.02 f | 1172.6 ± 16.99 a | 955.3 ± 3.57 c | 955.2 ± 7.34 c | 1079.03 ± 5.25 b | 726.55 ± 14.97 d | 513.88 ± 1.89 e | 126.34 ± 0.52 h | 225.32 ± 1.63 g |
| 10 | Ethyl propanoate | Pineapple scent | 372.18 ± 11.97 e | 358.38 ± 4.07 e, f | 382.63 ± 14.51 e | 410.04 ± 4.15 c | 444.94 ± 6.58 b | 368.5 ± 25.00 d, e, f | 537.94 ± 6.57 a | 343.44 ± 11.57 f | 400.61 ± 12.72 c, d |
| 11 | Ethyl Acetate | Sweet and fruity | 10,418.17 ± 58.61 a | 8558.08 ± 29.86 g | 8580.84 ± 32.12 g | 8666.27 ± 26.45 f | 9466.89 ± 24.73 b | 8695.02 ± 1.68 f | 8820.4 ± 25.45 e | 8984.57 ± 44.27 d | 9151.87 ± 29.06 c |
| 12 | Methyl acetate | | 1770.32 ± 18.12 c | 1876.34 ± 13.17 b | 1709.77 ± 2.66 e | 1634.92 ± 3.14 f | 1424.28 ± 5.12 g | 1747.63 ± 2.77 d | 1952.51 ± 1.96 a | 806.49 ± 9.20 i | 871.49 ± 2.42 h |
| 13 | Ethyl hexanoate-D | Currant and pineapple aroma | 175.03 ± 8.00 h | 484.28 ± 33.10 c, d | 531.94 ± 41.84 c | 401.35 ± 9.05 e, f | 432.93 ± 14.47 d, e | 678.16 ± 19.57 b | 1033.31 ± 28.26 a | 302.95 ± 19.12 g | 354.26 ± 34.39 f, g |
| 14 | Methyl 3-methylbutanoate | | 435.08 ± 3.61 a | 272.37 ± 3.18 f | 306.73 ± 6.35 e | 276.45 ± 3.92 f | 349.16 ± 4.65 c | 314.83 ± 11.15 d, e | 371.53 ± 18.05 b | 374.51 ± 7.22 b | 331.76 ± 6.06 d |
| 15 | Ethyl octanoate | Fruity aromas with pineapple, apple-like notes and brandy wine notes | 156.27 ± 2.14 i | 246.98 ± 6.90 f | 272.98 ± 14.03 d | 236.65 ± 6.81 g | 275.49 ± 8.84 c | 234.34 ± 26.46 h | 359 ± 8.31 a | 268.22 ± 4.52 e | 289.98 ± 20.82 b |
| 16 | Isobutyl propionate | Rum and pineapple aromas | 655.31 ± 8.26 a | 242.04 ± 5.79 f | 233.95 ± 1.55 f | 251.44 ± 3.93 f | 103.33 ± 3.32 g | 421.49 ± 17.66 d | 288.05 ± 3.79 e | 629.72 ± 12.81 b | 470.76 ± 9.78 c |
| 17 | Hexyl acetate | Fruity scent | 22.95 ± 2.40 e | 41.3 ± 2.55 d | 62.63 ± 4.27 b | 39.07 ± 1.84 d | 34.5 ± 0.57 d | 59.1 ± 5.90 b, c | 96.94 ± 1.31 a | 34.09 ± 4.90 d | 53.86 ± 5.31 c |
| 18 | Ethyl lactate | Pungent odor | 491.84 ± 47.44 b, c | 422.79 ± 6.86 d | 452.63 ± 28.74 c, d | 486.03 ± 5.84 b, c | 433.68 ± 22.02 d | 486.22 ± 21.90 b, c | 268.27 ± 29.62 e | 533.47 ± 4.14 a, b | 561.66 ± 7.30 a |
| 19 | Isobutyl butyrate | Pineapple, grape skin aromas, and etheric notes | 117.43 ± 5.33 e | 196.12 ± 9.54 c | 196.16 ± 9.10 c | 232.18 ± 19.26 b | 145.69 ± 3.73 d | 187 ± 8.19 c | 235.69 ± 5.18 b | 259.67 ± 12.07 a | 247.36 ± 15.40 a, b |
| 20 | Ethyl 2-methylbutanoate | Aromas of apple skin, pineapple skin, and unripe plum skin | 27.55 ± 1.55 f, g | 113.03 ± 6.01 b | 83.84 ± 3.15 d | 168.06 ± 1.68 a | 55.25 ± 1.71 e | 85.27 ± 1.63 c, d | 89.62 ± 0.36 c | 23.32 ± 0.84 g | 29.4 ± 1.65 f |
| Esters | Subtotal | 18,607.78 | 20,326.91 | 21,226.86 | 20,498.12 | 22,731.36 | 20,479.58 | 22,732.21 | 18,191.86 | 20,842.99 |
| Percentage | 28.14% | 29.13% | 30.29% | 29.88% | 32.21% | 29.65% | 32.03% | 28.29% | 31.16% |
| 1 | Acetic acid-M | Sour and pungent odor in vinegar | 2377.63 ± 155.71 b | 2390.38 ± 32.60 b | 2444.41 ± 37.53 a, b | 2540.6 ± 14.61 a, b | 2162.19 ± 101.49 c | 2409.18 ± 48.41 b | 2056.72 ± 215.15 c | 2510.27 ± 20.88 a, b | 2612.47 ± 5.78 a |
| 2 | Acetic acid-D | Sour and pungent odor in vinegar | 166.65 ± 33.73 c | 169.32 ± 4.25 c | 176.75 ± 6.41 c | 209.31 ± 8.56 a, b | 79.75 ± 13.71 e | 120.48 ± 8.51 d | 100.68 ± 23.02 d, e | 179.06 ± 8.49 b, c | 222.12 ± 2.00 a |
| Acids | Subtotal | 2544.28 | 2559.7 | 2621.16 | 2749.91 | 2241.94 | 2529.66 | 2157.4 | 2689.33 | 2834.59 |
| Percentage | 3.85% | 3.67% | 3.74% | 4.01% | 3.18% | 3.66% | 3.04% | 4.18% | 4.24% |
| 1 | Terpinolene | Resinous pine wood scent | 48.02 ± 6.56 a | 27.67 ± 3.35 b, c | 19.57 ± 1.41 d | 23.58 ± 0.76 b, c, d | 30.03 ± 2.24 b | 22.26 ± 3.45 c, d | 29.74 ± 5.98 b | 24.99 ± 1.99 b, c, d | 25.41 ± 0.87 b, c, d |
| Terpenoids | Subtotal | 48.02 | 27.67 | 19.57 | 23.58 | 30.03 | 22.26 | 29.74 | 24.99 | 25.41 |
| Percentage | 0.07% | 0.04% | 0.03% | 0.03% | 0.04% | 0.03% | 0.04% | 0.04% | 0.04% |
| 1 | 2,5-Dimethylfuran | Pungent aroma of fried flowers and the smell of chocolate and cream | 199.03 ± 4.17 f | 662.49 ± 11.18 a | 289.7 ± 6.39 d | 235.49 ± 8.54 e | 194.62 ± 3.32 f | 551.15 ± 10.22 b | 341.04 ± 6.08 c | 159.62 ± 2.09 g | 117.35 ± 5.38 h |
| Furans | Subtotal | 199.03 | 662.49 | 289.7 | 235.49 | 194.62 | 551.15 | 341.04 | 159.62 | 117.35 |
| Percentage | 0 | 0.01 | 0 | 0 | 0 | 0.01 | 0 | 0 | 0 |
| | Total | 58,160.24 | 42,201.41 | 34,187.72 | 37,576.72 | 53,287.78 | 39,846.59 | 43,863.56 | 43,678.17 | 52,144.75 |
Table 7.
OAV Analysis of Main Aroma Compounds in Different Variety Wine Samples.
Table 7.
OAV Analysis of Main Aroma Compounds in Different Variety Wine Samples.
| No. | Substance Name | ‘Hassan’ | ‘Zuoshaner’ | ‘Beibinghong’ | ‘Zuoyouhong’ | ‘Beta’ | ‘Shuanghong’ | ‘Zijingganlu’ | ‘Cabernet Sauvignon’ | ‘Syrah’ |
|---|
| (Aldehydes)1 | 2-Methylpropanal | 33.99 ± 1.28 | 67.2 ± 0.46 | 57.82 ± 0.69 | 44.67 ± 1.1 | 71.12 ± 1.84 | 35.77 ± 0.63 | 45.66 ± 3.68 | 27.99 ± 0.62 | 38.1 ± 1.65 |
| 2 | Acetaldehyde | 3.88 ± 0.95 | 3.94 ± 0.06 | 3.76 ± 0.04 | 3.91 ± 0.04 | 4.36 ± 0.34 | 3.88 ± 0.07 | 4.27 ± 0.41 | 3.5 ± 0.03 | 3.73 ± 0.07 |
| 3 | 2-Methylbutanal | 46.4 ± 1.29 | 22.46 ± 1.83 | 24.41 ± 0.17 | 22.49 ± 0.49 | 30.93 ± 1.8 | 31.11 ± 1.55 | 33.86 ± 0.96 | 30.73 ± 1.07 | 30.57 ± 2.02 |
| (Esters)1 | Ethyl hexanoate-M | 8.62 ± 0.55 | 9.15 ± 0.03 | 9.97 ± 0.28 | 8.81 ± 0.18 | 7.58 ± 0.03 | 9.34 ± 0.49 | 12.99 ± 0.41 | 9.94 ± 0.22 | 9.72 ± 0.06 |
| 2 | Isoamyl acetate-M | 55.07 ± 4.09 | 75.62 ± 2.55 | 72.29 ± 5.75 | 72.37 ± 0.97 | 61.62 ± 6.27 | 63.32 ± 3.4 | 74.37 ± 1.15 | 65.56 ± 0.74 | 65.44 ± 0.94 |
| 3 | Ethyl 3-methylbutanoate-M | 12.94 ± 1.39 | 19.36 ± 1.06 | 15.08 ± 0.58 | 21.44 ± 0.21 | 17.65 ± 0.3 | 18.14 ± 1.94 | 20.3 ± 0.4 | 8.63 ± 1.01 | 8.63 ± 0.64 |
| 4 | Ethyl 3-methylbutanoate-D | 2.16 ± 0.27 | 9.5 ± 0.51 | 5.61 ± 0.46 | 12.14 ± 0.25 | 6.81 ± 0.08 | 7.18 ± 0.25 | 6.97 ± 0.13 | 1.37 ± 0.07 | 1.89 ± 0.08 |
| 5 | Isoamyl acetate-D | 20.11 ± 0.73 | 45.16 ± 1.40 | 55.37 ± 1.59 | 51.42 ± 0.25 | 54.98 ± 0.57 | 44.43 ± 1.05 | 56.01 ± 0.06 | 34.63 ± 0.91 | 61.85 ± 1.2 |
| 6 | Ethyl butanoate-D | 31.55 ± 0.61 | 39.27 ± 1.54 | 47.79 ± 1.61 | 42.27 ± 0.64 | 59.53 ± 0.55 | 53.77 ± 1.17 | 66.4 ± 0.47 | 60.07 ± 1.04 | 52.5 ± 1.32 |
| 7 | Ethyl isobutyrate | 16.26 ± 0.3 | 58.63 ± 0.85 | 47.76 ± 0.18 | 47.76 ± 0.37 | 53.95 ± 0.26 | 36.33 ± 0.75 | 25.69 ± 0.09 | 6.32 ± 0.03 | 11.27 ± 0.08 |
| 8 | Ethyl Acetate | 1.39 ± 0.01 | 1.14 ± 0.00 | 1.14 ± 0.00 | 1.16 ± 0 | 1.26 ± 0 | 1.16 ± 0 | 1.18 ± 0 | 1.2 ± 0.01 | 1.22 ± 0 |
| 9 | Ethyl hexanoate-D | 12.5 ± 0.57 | 34.59 ± 2.36 | 38 ± 2.99 | 28.67 ± 0.65 | 30.92 ± 1.03 | 48.44 ± 1.4 | 73.81 ± 2.02 | 21.64 ± 1.37 | 25.3 ± 2.46 |
| 10 | Ethyl octanoate | 31.25 ± 0.43 | 49.4 ± 1.38 | 54.6 ± 2.81 | 47.33 ± 1.36 | 55.1 ± 1.77 | 46.87 ± 5.29 | 71.8 ± 1.66 | 53.64 ± 0.9 | 58 ± 4.16 |
| (Furans) 1 | 2,5-Dimethylfuran | 2.49 ± 0.05 | 8.28 ± 0.14 | 3.62 ± 0.08 | 2.94 ± 0.11 | 2.43 ± 0.04 | 6.89 ± 0.13 | 4.26 ± 0.08 | 2 ± 0.03 | 1.47 ± 0.07 |
Table 8.
Analysis of VIP Values of Aroma Compounds in Different Varieties of Wine.
Table 8.
Analysis of VIP Values of Aroma Compounds in Different Varieties of Wine.
| Compound Name | ‘Hassan’ vs. ‘Zuoshaner’ vs. ‘Beibinghong’ vs. ‘Zuoyouhong’ vs. ‘Beta’ vs. ‘Shuanghong’ vs. ‘Zijingganlu’ vs. ‘Cabernet Sauvignon’ vs. ‘Syrah’ |
|---|
| Ethyl isobutyrate | 1.76542 |
| Ethyl hexanoate-D | 1.46159 |
| 2-Methylpropanal | 1.37144 |
| Ethyl octanoate | 1.29694 |
| Ethyl butanoate-D | 1.24456 |
| Isoamyl acetate-D | 1.15269 |


