Article

Spatiotemporal Variations of Drought and the Related Mitigation Effects of Artificial Precipitation Enhancement in Hengyang-Shaoyang Drought Corridor, Hunan Province, China

1
Hunan Weather Modification Office, Changsha 410118, China
2
Hunan Key Laboratory of Meteorological Disaster Prevention and Mitigation, Changsha 410118, China
3
College of Geography and Tourism, Hengyang Normal University, Hengyang 421002, China
4
International Centre on Space Technologies for Natural and Cultural Heritage (HIST) under the Auspices of UNESCO, Hengyang Base, Hengyang 421002, China
5
Hunan Key Laboratory of Geospatial Big Data Mining and Application, Hunan Normal University, Changsha 410081, China
*
Author to whom correspondence should be addressed.
Atmosphere 2022, 13(8), 1307; https://doi.org/10.3390/atmos13081307
Submission received: 14 July 2022 / Revised: 13 August 2022 / Accepted: 14 August 2022 / Published: 17 August 2022
(This article belongs to the Section Climatology)

Abstract

:
It is important to reveal the spatial and temporal variations of drought and evaluate the alleviating effects of artificial precipitation on drought severity, as it will contribute immensely to the formulation of drought prevention and mitigation measures and the provision of guidance to artificial precipitation enhancement operation. Based on the monthly precipitation data of 28 meteorological stations in Hengyang-Shaoyang Drought Corridor (HSDC) from 1960 to 2019, the standardized precipitation index (SPI) at multiple time scales were calculated to estimate drought frequency, drought station ratio, and drought intensity. Then the spatiotemporal variations of drought in the study area were unveiled, and the effects of artificial precipitation enhancement were evaluated in line with the relevant data from 2005 to 2019. The results show that at the annual scale, drought occurred in 3/4 of past sixty years in the study area, where almost 1/3 of such years experienced area-wide droughts. Drought coverage in HSDC exhibited a decreasing trend, but drought intensity, as well as the number of area-wide droughts and regional droughts showed an increasing one. Mild and moderate droughts occurred in an extensive part of the HSDC, whereas severe and extreme droughts were mainly found in a few stations. At the seasonal scale, winter drought occurred most frequently, followed by summer and autumn droughts, while spring drought events had the lowest frequency. Overall, drought is more serious in spring, autumn, and winter, but less severe in summer; although drought intensity decreased slightly in summer, both its intensity and coverage showed an increasing trend in other seasons. At the monthly scale, the ratio of positive to negative SPI values in HSDC was basically balanced in the past six decades, exhibiting no distinct variation characteristics. In addition, artificial precipitation enhancement effectively eased monthly and even seasonal drought in HSDC. These findings, which fully reflect the characteristics of drought in the study area, can also raise awareness of the contribution that artificial precipitation could make to drought mitigation, which in turn will contribute to the formulation of appropriate strategies for climate change mitigation and adaptation.

1. Introduction

As global warming continues, it may increase the occurrence probability of extreme hydrological events [1], such as drought and flood, by changing the hydrological cycle on the surface of earth [2,3], and therefore become one of the major climate threats to human development [4,5]. Among them, drought is considered a common natural disaster worldwide [6], especially in Asia, Africa, and Australia, where extreme drought events occur most frequently [7]. Compared with other common disasters, drought does not happen all of a sudden; it is a slow-onset “creeping” disaster [8] that can have far-reaching effects on a community [9]. Drought risk will continue to rise due to the long-term impacts of climate change and population growth [10,11]. Generally, if a region’s precipitation falls below a normal level, it may result in meteorological drought, which is easy to evolve into agricultural or hydrological drought [12,13,14], triggering significant impacts on agricultural production and regional sustainable development [1,4,15,16].
Precipitation, a decisive factor that contributes to meteorological drought, is also an essential input parameter for drought index calculation [17,18]. Drought index is an important index to quantify and assess drought severity. For example, standardized precipitation index (SPI) [19] can be used to measure precipitation deficiencies on a variety of time scales [20], which is recommended mainly to evaluate meteorological drought [21]. Standardized precipitation evaporation index (SPEI), which, like SPI, also allows the flexibility to choose duration series (such as 1-, 3-, and 12-month time scale), is suitable for monitoring meteorological or hydrological drought [22]. Palmer drought severity index is a potential agricultural drought index [23]. However, these drought indices vary in features, limitations, and applications. Additionally, subject to the limited spatial data resources, different indices also vary in their adaptability to actual climate conditions. These factors, together with the uneven spatio-temporal distribution of climate variables, may contribute to big regional differences in the selection of drought indices [5]. After doing a case study of Pakistan, Adnan et al. [24] believed that in comparison with other drought indices, SPI, SPEI, and RDI had better capability in monitoring drought. Haile et al. [25] used SPEI to predict future drought characteristics over East Africa upon a comparison between SPI and SPEI indices. Aghelpour et al. [18] found that SPI served as an important drought index in the study of snow cover areas. Spinoni, et al. [26] used SPI to monitor the frequency, duration, and severity of drought in different parts of the world from 1951 to 2010. Kobrossi et al. [19] utilized SPI to analyze the characteristics of long-term drought in Lebanon which has a Mediterranean climate.
In China, drought poses more pronounced impacts on agriculture than flood [1]. The spatiotemporal characteristics of drought in China noticeably vary over regions [27]. Northern China is most vulnerable to drought [12], but other parts of China also face drought risk [5,21,28]. Because of environmental changes and human activities, the 400 mm and 800 mm isohyets in China have been constantly shifting [29,30]. The impacts of drought on southern China are worsening [27,31] with increasing stricken areas [32] and a great number of “flash” droughts [33]. However, it is difficult to describe the drought conditions in a local area through characteristics of drought at a large or area-wide scale. In addition, soil moisture changes caused by climate warming at the regional scale may affect the variability of precipitation through complex land-atmosphere coupling, thus extending the duration of drought [34] and potentially affecting the characteristics of area-wide drought. In this connection, the study of meteorological drought characteristics at regional scale plays an important role in understanding and verifying area-wide drought throughout a larger scale.
Humid areas generally receive abundant precipitation, which however does not mean such areas would not experience drought in certain period or certain location. This is especially the case in areas of monsoon climate. High precipitation variability in such areas leads to frequent drought and flood, which may have devastating impacts on the natural ecosystem, agricultural production, and people’s livelihood [1,35]. Hunan Province (HP), one of China’s major agricultural provinces located in the monsoon area, has witnessed high frequency of severe and extreme drought in recent years [31,32]; moreover, the area affected by extreme drought tends to be expanding [36]. Note-worthily, Hengyang-Shaoyang Drought Corridor (HSDC), also referred to as “Hengshao Basin” or “Hengshao Region”, is the area having the greatest number of average annual extreme drought days in HP [37], with the sharpest increase in the frequency of extreme drought [36]. Compared with other parts of HP, the corridor experienced more severe drought, especially in summer and autumn [38], where the persistent drought was primarily caused by high temperatures and low precipitation [38,39]. Importantly, artificial precipitation is an effective way to reduce risks of regional drought [40], as it can alleviate the current shortage of regional precipitation and mitigate the negative effects of high temperatures and drought [41].
SPI has been widely used in drought monitoring and assessment at multiple spatiotemporal scales owing to its advantage of simplicity [18,19,20,42]. Previous studies focused on the analysis of drought characteristics at regional and even global scale, but there were few studies on how to reduce risks of drought. It should be pointed out that local drought events have unignorable impacts on risk of area-wide drought, and to what extent artificial precipitation enhancement can ease drought risk is yet to be quantitatively assessed. For these reasons, this research aims to: (a) Classify drought events by severity (including no, mild, moderate, severe, and extreme drought) through calculating SPI; (b) reveal spatiotemporal patterns of annual, seasonal, and monthly droughts in HSDC; and (c) explore the mitigation effects of artificial precipitation on drought.

2. Materials and Methods

2.1. Study Area

Located in south-central HP in southern China, HSDC covers 33 county-level administrative regions, making up 24.17% of the land area of the province (Figure 1a–c). The region is surrounded by mountains, including Luoxiao Mountains in the east, Xuefeng Mountains in the west, Nanling Mountains in the south, and Hengshan Mountain in the north. The study area is mainly composed of basins and hills, which primarily include Hengyang Basin and Shaoyang Basin, covering the vast hilly area with the drainage divide separating Xiangshui and Zishui drainage watersheds as the axis (Figure 1c). The topography of the area can be characterized as high in the west and low in the east, and high in the south and low in the north (Figure 1c). Moreover, HSDC has a wide variety of vegetation, including subtropical coniferous forests represented by fir and masson pine, broad-leaved forests represented by castanopsis carlesii and oak, and cultivated vegetation such as double-cropping rice, winter wheat, sweet potato, sesame, yam bean, tea, camellia oleifera, and tangerine. In the past six decades (1960−2019), the average precipitation in the area was 1363.4 mm, which was lower than that of HP in the same period (−44.2 mm) (Figure 1b).
HSDC is also located in a subtropical humid zone; however, under the influence of the mountainous terrain in eastern Hunan, it is difficult for humid airflow to enter the two basins in summer and autumn, which results in little precipitation in the area and further leads to a great number of extremely dry days and relatively severe drought [37] (Figure 1b). The land use in HSDC is predominately used as woodland and arable land, where the two types together account for more than 90% of the total, and the arable land alone accounts for over 1/3 (Figure 1d). Apart from these, the study area is an important grain production base in HP, which however has the fewest water resources across the province due to drought, especially in summer and autumn. According to Encyclopedia of Meteorological Disasters in China—Hunan, the drought in HSDC, which occurred frequently, has consecutively affected a wide range of area, causing serious damage. The study area, named “Hengyang-Shaoyang Drought Corridor” due to its association with the two topographic areas—Hengyang Basin and Shaoyang Basin, has become one of the key areas that need artificial precipitation enhancement in HP (Figure 1d).

2.2. Data

2.2.1. Meteorological Data

Monthly precipitation data, sourced from Hunan Meteorological Bureau (HMB), of 28 meteorological stations in the study area from January 1960 to February 2020, whose distribution was shown in Figure 1c, were used as the data in this study after quality control. As four of the 28 stations, namely Hengdong, Lengshuijiang, Lengshuitan, and Loudi, were established at a later time, the precipitation data after their establishment were used. In order to accurately simulate the spatial distribution of drought, Nanyue station (high-altitude station) is also discussed. At the meanwhile, Excel was used to sort the precipitation data, and a few missing values were interpolated with the linear interpolation method. Further, SPI time series at monthly, seasonal, and annual scales (SPI1, SPI3, and SPI12 respectively) were calculated based on the processed precipitation data. Last, considering the climatic characteristics of the study area, March–May, June–August, September–November, and December–February are defined, in line with the climate standard of the Northern Hemisphere, as spring, summer, autumn, and winter, respectively.

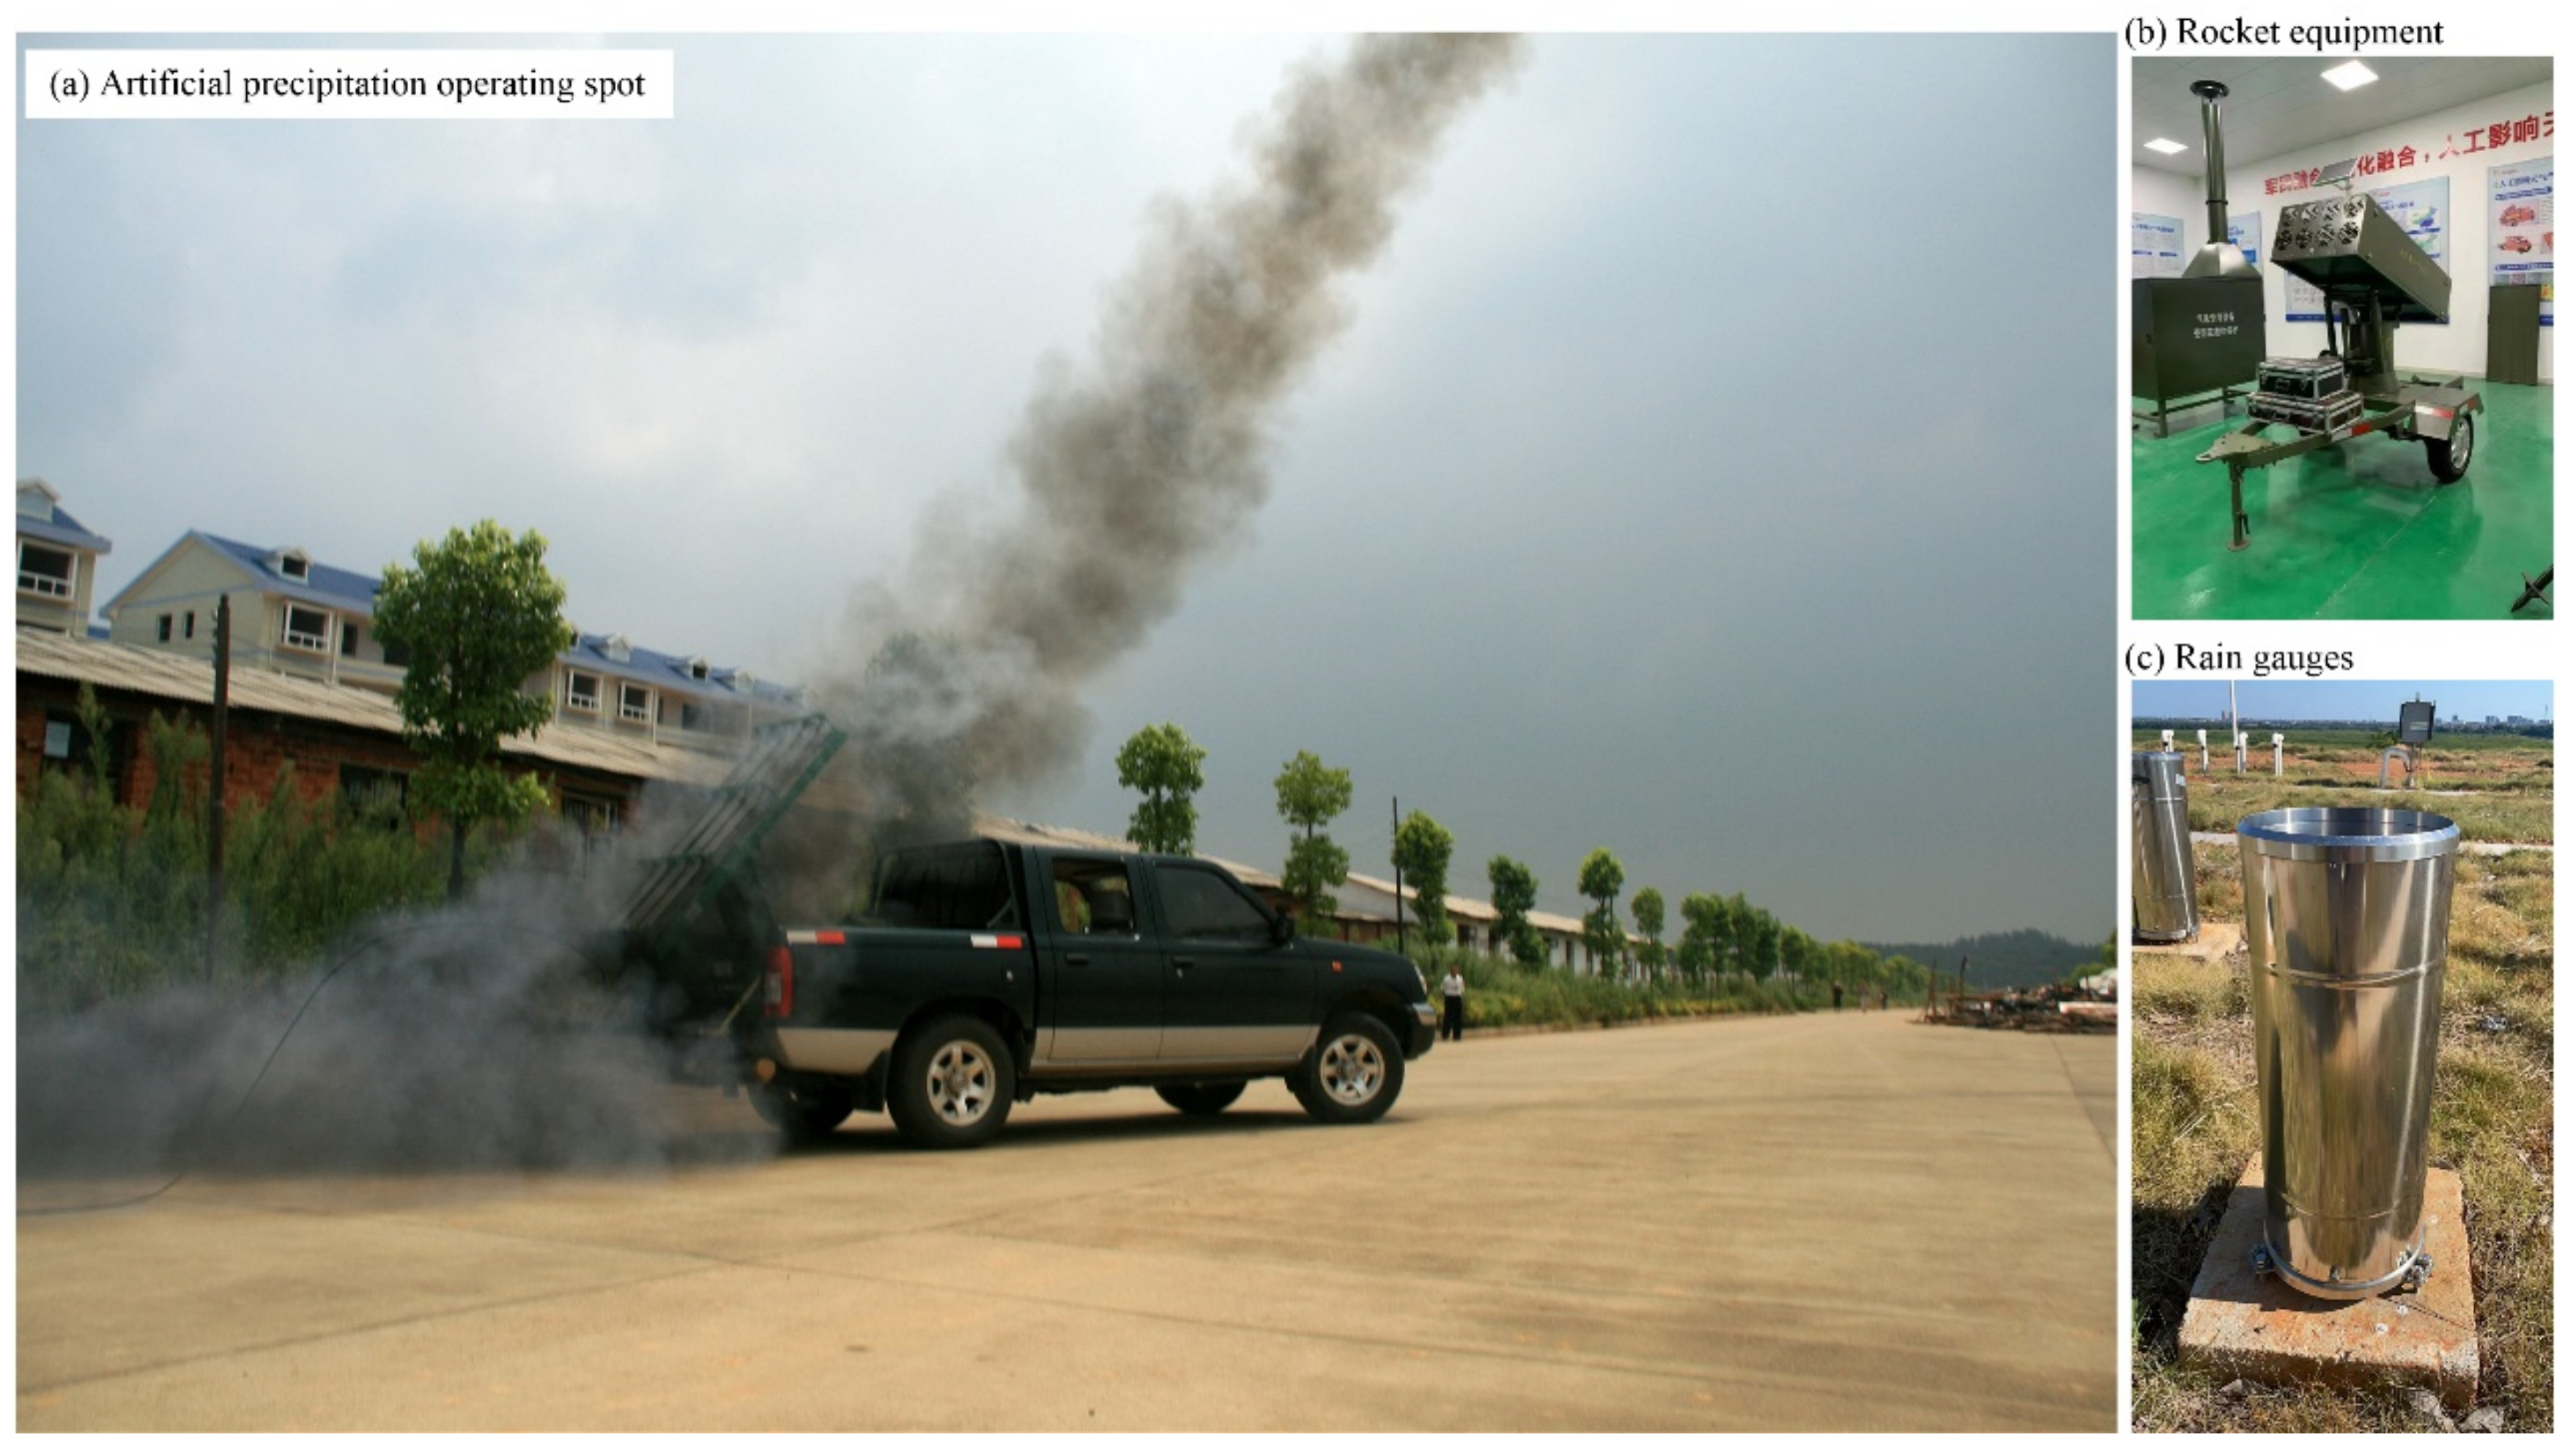
2.2.2. Artificial Precipitation Data

HP has carried out experimental research on artificial precipitation by aircraft since 1959, aiming to effectively prevent and reduce meteorological drought disasters, better prevent and mitigate such disasters, and properly develop and utilize atmospheric water resources. The information about artificial precipitation operation stations (as of 2021) and rainfall enhancement data were provided by Hunan Weather Modification Office. A total of 195 operation stations, including 95 permanent ones and 100 mobile ones, were set up in the study area, accounting for 29.15% of the stations province-wide (Figure 1d). In this research, the artificial precipitation operating spot closest to the meteorological station was selected for estimation and analysis (Figure 2a,b), and ground-placed rain gauges were used for observations (Figure 2c). Given the completeness of the rainfall enhancement data since 2005, the data from 2005 to 2019 were selected as the basis to analyze the mitigation of drought risk in the study area.
According to statistics, in the past 15 years, 191 artificial rainfall enhancement operations have been carried out in the study area with noticeable results. The years without obvious drought throughout in the study area, such as 2006, 2009, and 2014, were not covered in the statistics of this research in view of the small number of rainfall enhancement operations performed. In addition, the number of artificial precipitation operations in the study area vary widely from year to year, with the greatest number (47) in 2018, the second greatest (28) in 2013, and the least (only 2) in 2008, 2012, and 2015. The effects of artificial precipitation enhancement will be evaluated by comparing the changes of SPI1 and SPI3 values before and after rainfall enhancement during the period 2005–2019. It should be noted that the aforementioned precipitation data (i.e., total precipitation) provided by HMB actually includes two components: natural precipitation and artificial precipitation. Therefore, the SPI values before precipitation enhancement were calculated by subtracting the amount of rainfall created through artificial precipitation from the total precipitation, while the monthly precipitation data were directly used as those after such operations.

2.2.3. Other Data

Free ASTER GDEM 30-m-resolution elevation data were collected from the Geospatial Data Cloud (http://www.gscloud.cn, accessed on 14 July 2022). Statistics on economic and social development were sourced from CNKI (https://data.cnki.net, accessed on 14 July 2022). Vector data for the Chinese administrative divisions, as well as data of vegetation and land use/land cover were obtained from Resource and Environment Science and Data Center, Chinese Academy of Sciences (http://www.resdc.cn, accessed on 14 July 2022).

2.3. Methods

2.3.1. Standardized Precipitation Index

SPI is an index used to characterize the probability of precipitation in a given time period. The SPI is applicable to quantitative monitoring and evaluation of drought in a range of timescales and regions. The calculation and basic principles are as follows [43,44,45,46,47]:
Assuming that the precipitation in a given time period is a random variable x , the probability density function for samples which follow Γ distribution is defined as
f ( x ) = 1 β γ Γ ( x ) x γ 1 e x / β ,   ( x > 0 )
Γ ( γ ) = 0 x γ 1 e x d x
where β > 0 , γ > 0 are the scale parameter and the shape parameter, respectively. β and γ are calculated using the maximum likelihood estimation method as follows [48]:
γ = 1 + 1 + 4 A / 3 4 A
β = x ¯ / γ
A = lg x ¯ 1 n i = 1 n lg x i
where x i is the precipitation data sample; x ¯ is the multi-year average precipitation; and n is the sample series size.
When the parameters in the probability density function are defined, the precipitation at the time scale x 0 is given, the probability of the event at x < x 0 is obtained and expressed as
F ( x < x 0 ) = 0 f ( x )   d x
Given that the precipitation can have a value of 0, and the event at x = 0 is not included in Formula (6), the probability of the event at x = 0 is defined as
F ( x = 0 ) = m / n
where m is the number of samples at x = 0 , n is the total number of samples. The probability value obtained from Formulas (6) and (7) is substituted into the standard normal distribution function, i.e.:
F ( x < x 0 ) = 1 2 π 0 e Z 2 / 2 d x
The following is obtained via an approximate solution to Formula (8):
Z = S P I = t c 0 + c 1 t + c 2 t 2 1 + d 1 t + d 2 t 2 + d 3 t 3   0 < F 0.5
Z = S P I = + t c 0 + c 1 t + c 2 t 2 1 + d 1 t + d 2 t 2 + d 3 t 3   0.5 < F < 1
where F is the probability value obtained from Formulas (6) and (7); at 0 < F 0.5 , t = In 1 F 2 ; at 0.5 < F < 1 , t = In 1 1 F 2 ; c 0 , c 1 , c 2 , d 1 , d 2 , d 3 are constants.
Positive SPI values denote wet conditions, while negative values denote dry conditions. In this study, according to China National Standard of the Grades of Meteorological Drought (GB/T 20481-2017), the thresholds −0.5, −1.0, −1.5, and −2.0 were set to define the corresponding drought grades as No drought ( 0.5 < S P I ), Mild drought ( 1.0 < S P I 0.5 ), Moderate drought ( 1.5 < S P I 1.0 ), Severe drought ( 2.0 < S P I 1.5 ), and Extreme drought ( S P I 2.0 ). In addition, the average SPI for the whole area was calculated by the Thiessen polygon method and the area-weighted average method.

2.3.2. Drought Frequency

Drought frequency indicates the ratio of the number of years of actual drought events at a meteorological station to the total number of years in the statistical period. This indicator was used in this study to measure the frequency of drought occurrence at 28 meteorological stations in HSDR from 1960 to 2019. It can be calculated as follows [42]:
P i = n / N × 100 %
where P i is the drought frequency at site i ; N is the total number of years in the study period at site i , taking N = 60 ; n is the cumulative number of years of drought events at site i . In this research, the drought frequency of each site corresponding to different grades of drought events was calculated.

2.3.3. Drought Station Ratio

Drought station ratio is defined as the ratio of the number of stations with actual drought events to the total number of stations in the study area. It can indirectly reflect the impact severity of drought event and is used to measure the impact scope of drought event. The method can be computed as follows [49]:
P j = m j / M × 100 %
where P j is the drought station ratio in year j ; M is the total number of meteorological stations in the study area, taking M = 28 ; m j is the number of stations with actual drought events in year j . In this study, based on the thresholds of 10%, 25%, 33%, and 50%, the impact scope of drought events was divided into: area-wide no drought ( P j < 10 % ), local drought ( 10 %   P j < 25 % ), partially regional drought ( 25 %   P j < 33 % ), regional drought ( 33 %   P j < 50 % ), and area-wide drought ( P j   50 % ).

2.3.4. Drought Intensity

Drought intensity indicates the severity of drought at each meteorological station in the study area within a given time, and can be calculated by S P I , i.e., the larger the S P I , the more severe the drought. It can be written as follows [49]:
S i j = 1 m i = 1 m S P I i
where S i j is the drought intensity at site j in year i ; m is the cumulative number of years of drought events during the study period; S P I i is the S P I value of the site with drought events in year i . When 0.5   S i j < 1 , the drought intensity is mild; when 1   S i j < 1.5 , the drought intensity is moderate; and when S i j     1.5 , the drought intensity is severe. In this case, the average of drought intensity at all sites with drought events was taken as the annual and seasonal drought intensity in the study area to analyze the interannual variation of regional drought intensity.

3. Results and Analysis

3.1. Temporal Variability of Droughts

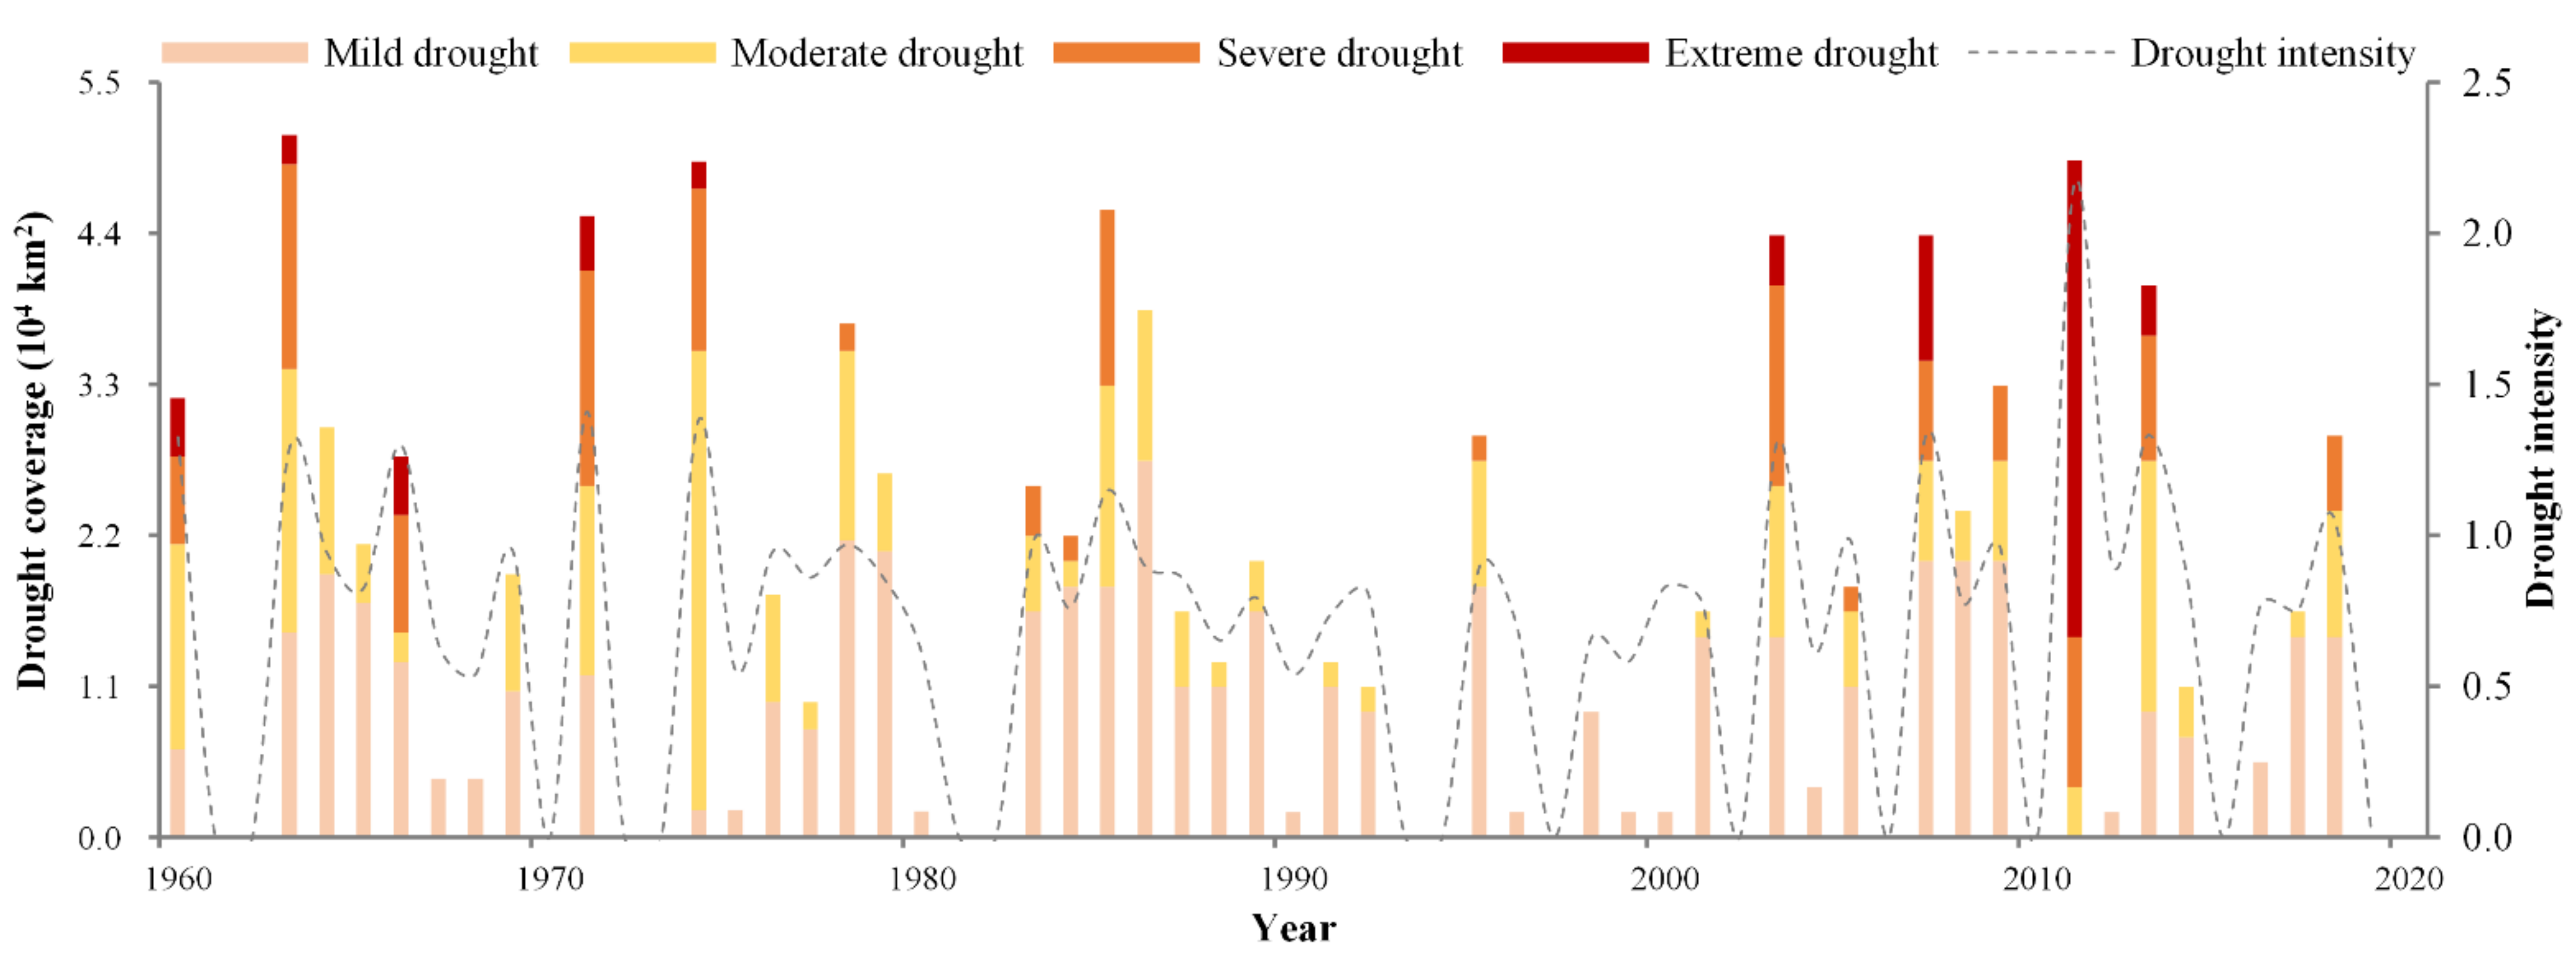
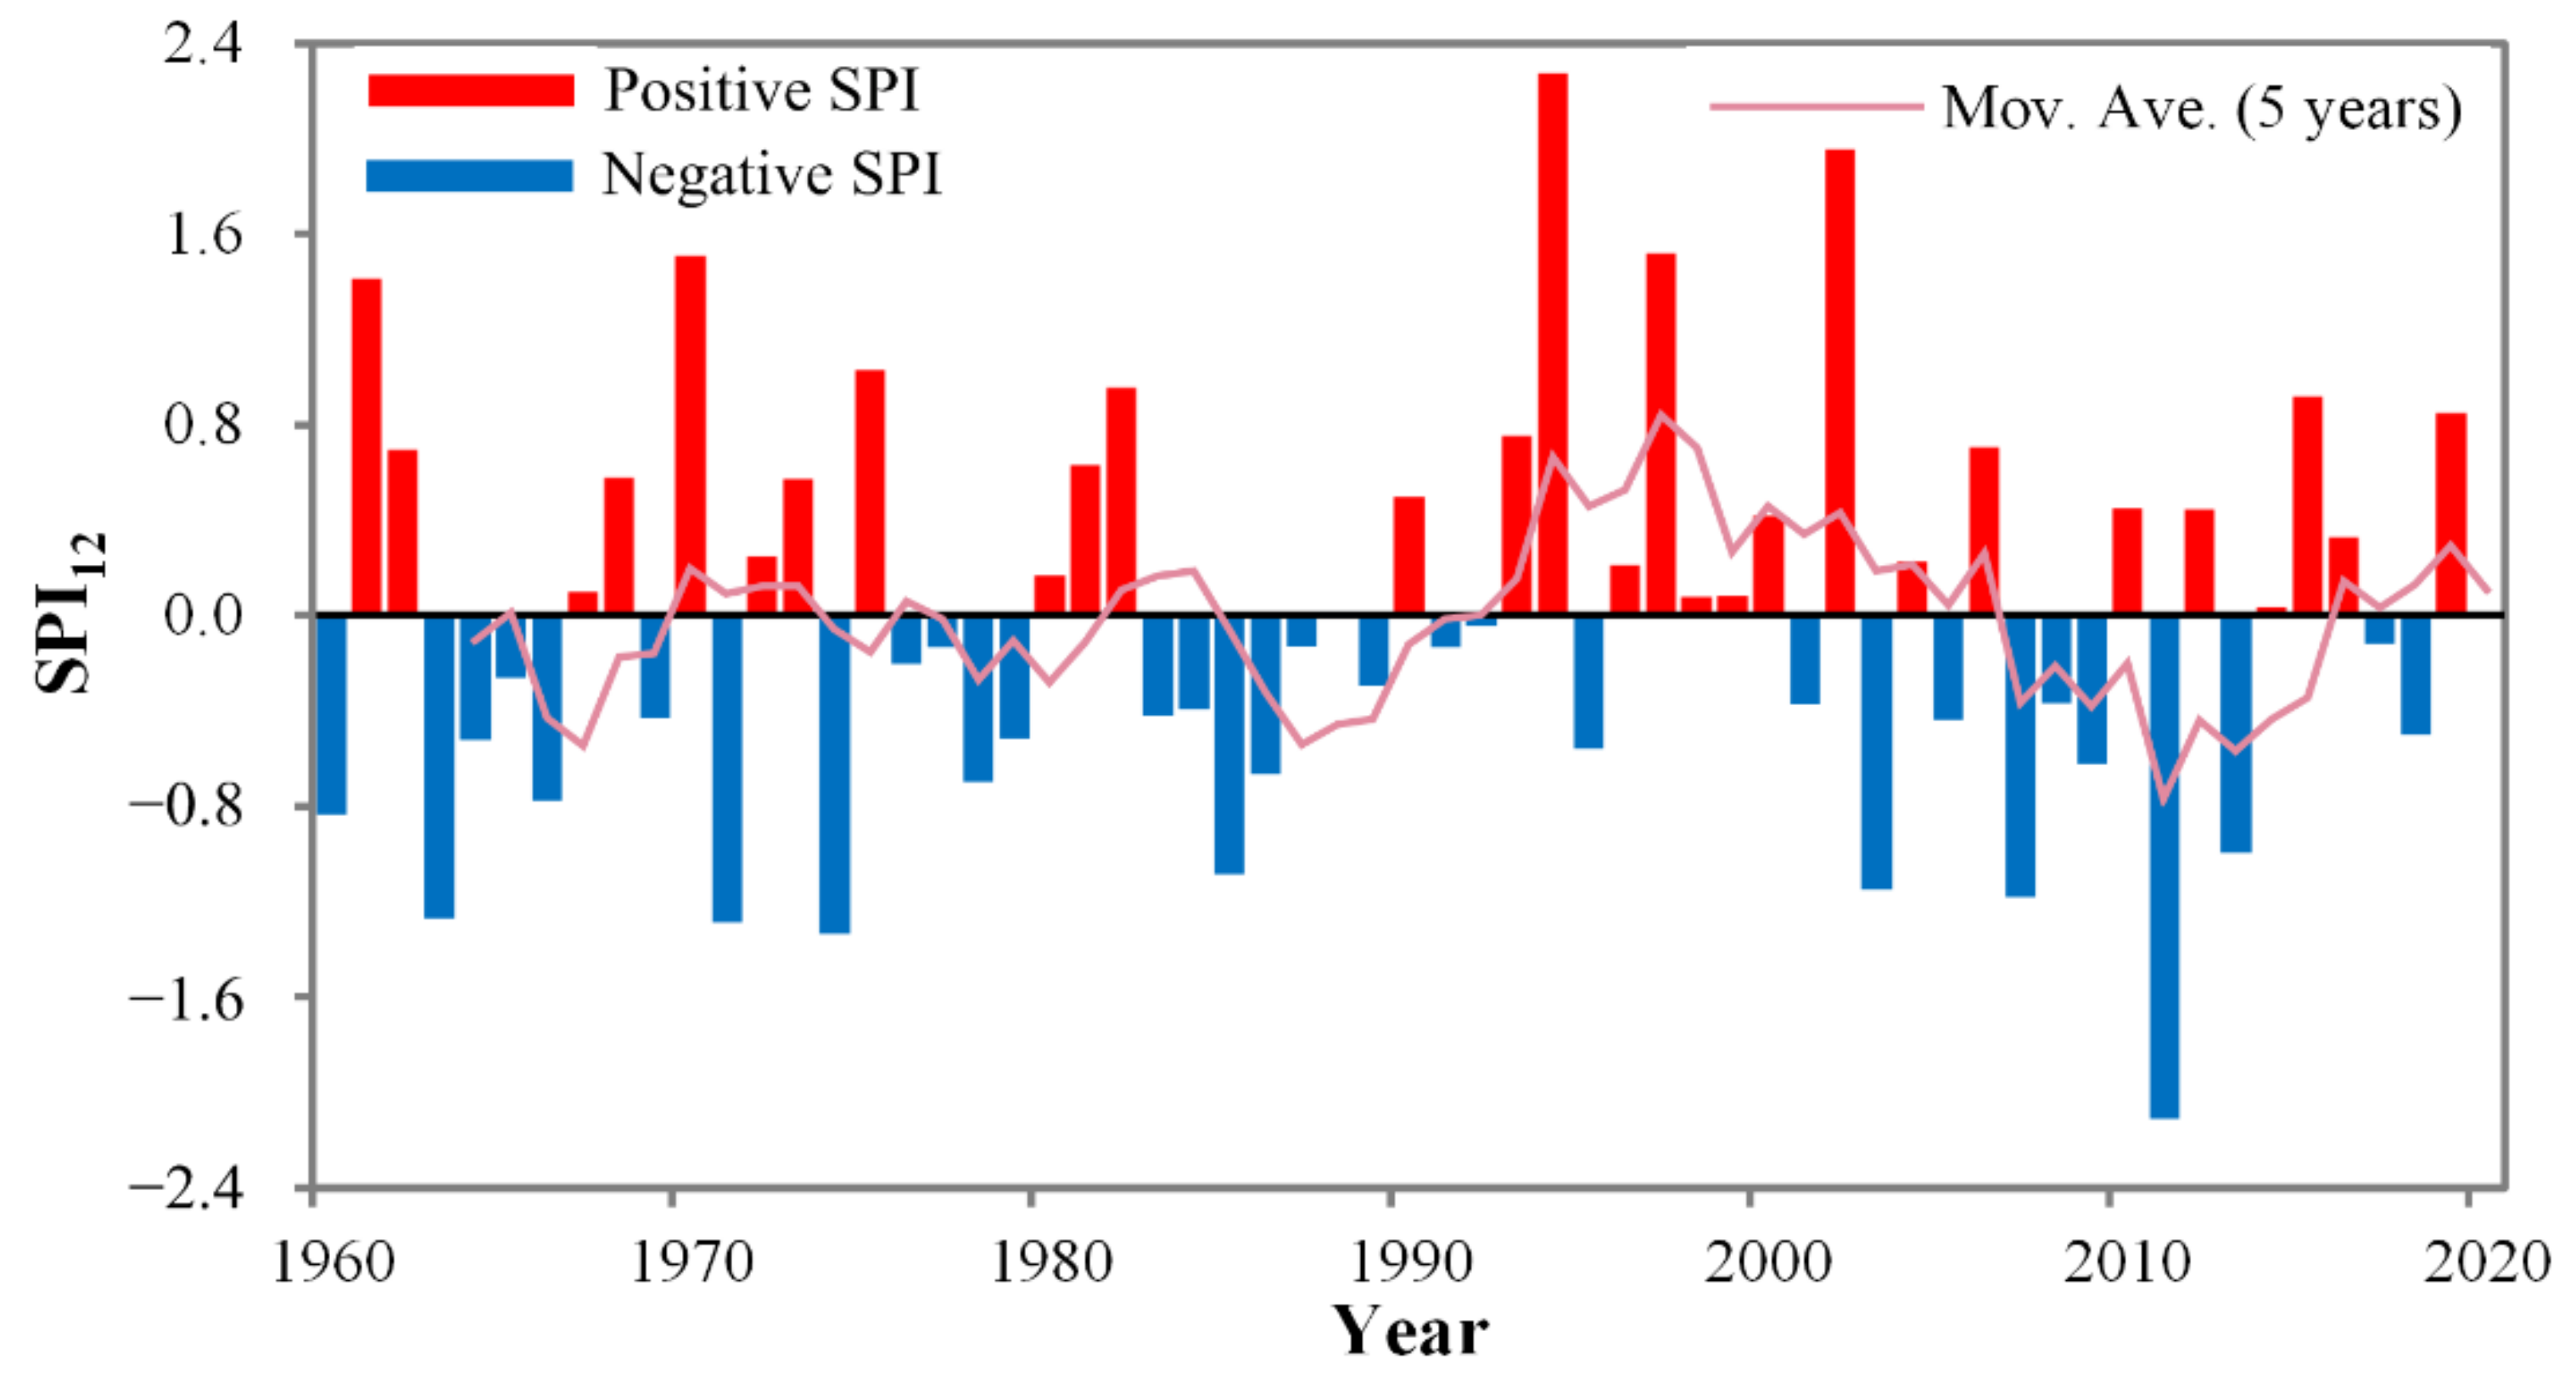
3.1.1. Interannual Variation

From 1960 to 2019, the average annual value of SPI12 in the study area was −0.0042, indicating that there was a precipitation deficit in the area during the past six decades. As shown in Figure 3, the total number of years when the study area experienced mild, moderate, and extreme drought events was 10, 6, and 1, respectively. The highest value of SPI12 (2.27) appeared in 1994, which indicates an extreme flood event. The lowest value (−2.11) occurred in 2011, indicating an extreme drought event. Drought occurred frequently from 1960 to 1966, with four drought events having occurred in only 7 years, of which, 1963 witnessed the most severe one, which was moderate drought. The frequency of drought was low from 1967 to 2006, with only eight drought events, mild or moderate, in four decades. Drought also occurred frequently from 2007 to 2013, with four drought events in 7 years, of which, 2007 and 2011 witnessed moderate and extreme drought events, respectively. In the period 2014–2019, only one drought event occurred in 2018, which was mild drought. In addition, the 5-year moving average of SPI12 indicates that the values fluctuated slightly before 1986, followed by a distinct upward trend, which turned into a distinct downward trend starting from 1997, and a distinct upward trend after 2010.
In the past six decades, 45 years has witnessed drought events of varying severity at the meteorological stations in the study area. Specifically, Hengnan was with the highest mild drought years (15 years), whereas Xinshao and Dongan were with the lowest (5 years). Suining recorded the greatest number of years (9) with moderate drought; on the other hand, the least number of years (2) was recorded in Changning and Shaodong. With respect to the number of severe drought years, Xinning stood in the first position with 6 years, while Hengdong and Longhui stood in the last with no severe drought at all. In terms of extreme drought years, Shaodong stood in the first with 3 years, whereas Loudi, Nanyue, Shaoyang County, and Xinning never experienced extreme drought during the period.
Figure 4 shows that the drought intensity in the study area fluctuated between 0.54 and 2.17: First, the years with mild intensity were 34 years, accounting for 75.6% of the total; second, the number of years with moderate intensity was 10, accounting for 22.2%; and the last was years of severe intensity (1 year), accounting for 2.2%. Additionally, the number of years with area-wide drought was 18 years, accounting for 30%; the number of years with regional drought was 7, accounting for 11.67%; the number of years with partially regional drought was 5, accounting for 8.33%; the number of years with local drought was 5, accounting for 8.33%; and the number of years with area-wide no drought was 25 years, accounting for 41.67%. Notably, area-wide drought and regional drought have shown an upward tendency, especially since the beginning of the 21st century, area-wide droughts occurred frequently such as in 2003, 2007, 2009, 2011, 2013, and 2018. Note-worthily, the extreme drought event of 2011 covered an overwhelming majority (over 2/3) of the study area. Statistics show that the maximum coverage of mild, moderate, severe, and extreme drought was 2.74 × 10⁴ km2 (in the year of 1986, accounting for 53.6% of the whole area), 3.35 × 10⁴ km2 (in 1974, accounting for 65.4%), 1.57 × 10⁴ km2 (in 1971, accounting for 30.8%), 3.47 × 10⁴ km2 (in 2011, accounting for 67.9%), respectively. Furthermore, the coverage of extreme drought showed an expanding trend, while the area covered by drought of other severity exhibited a decreasing trend.

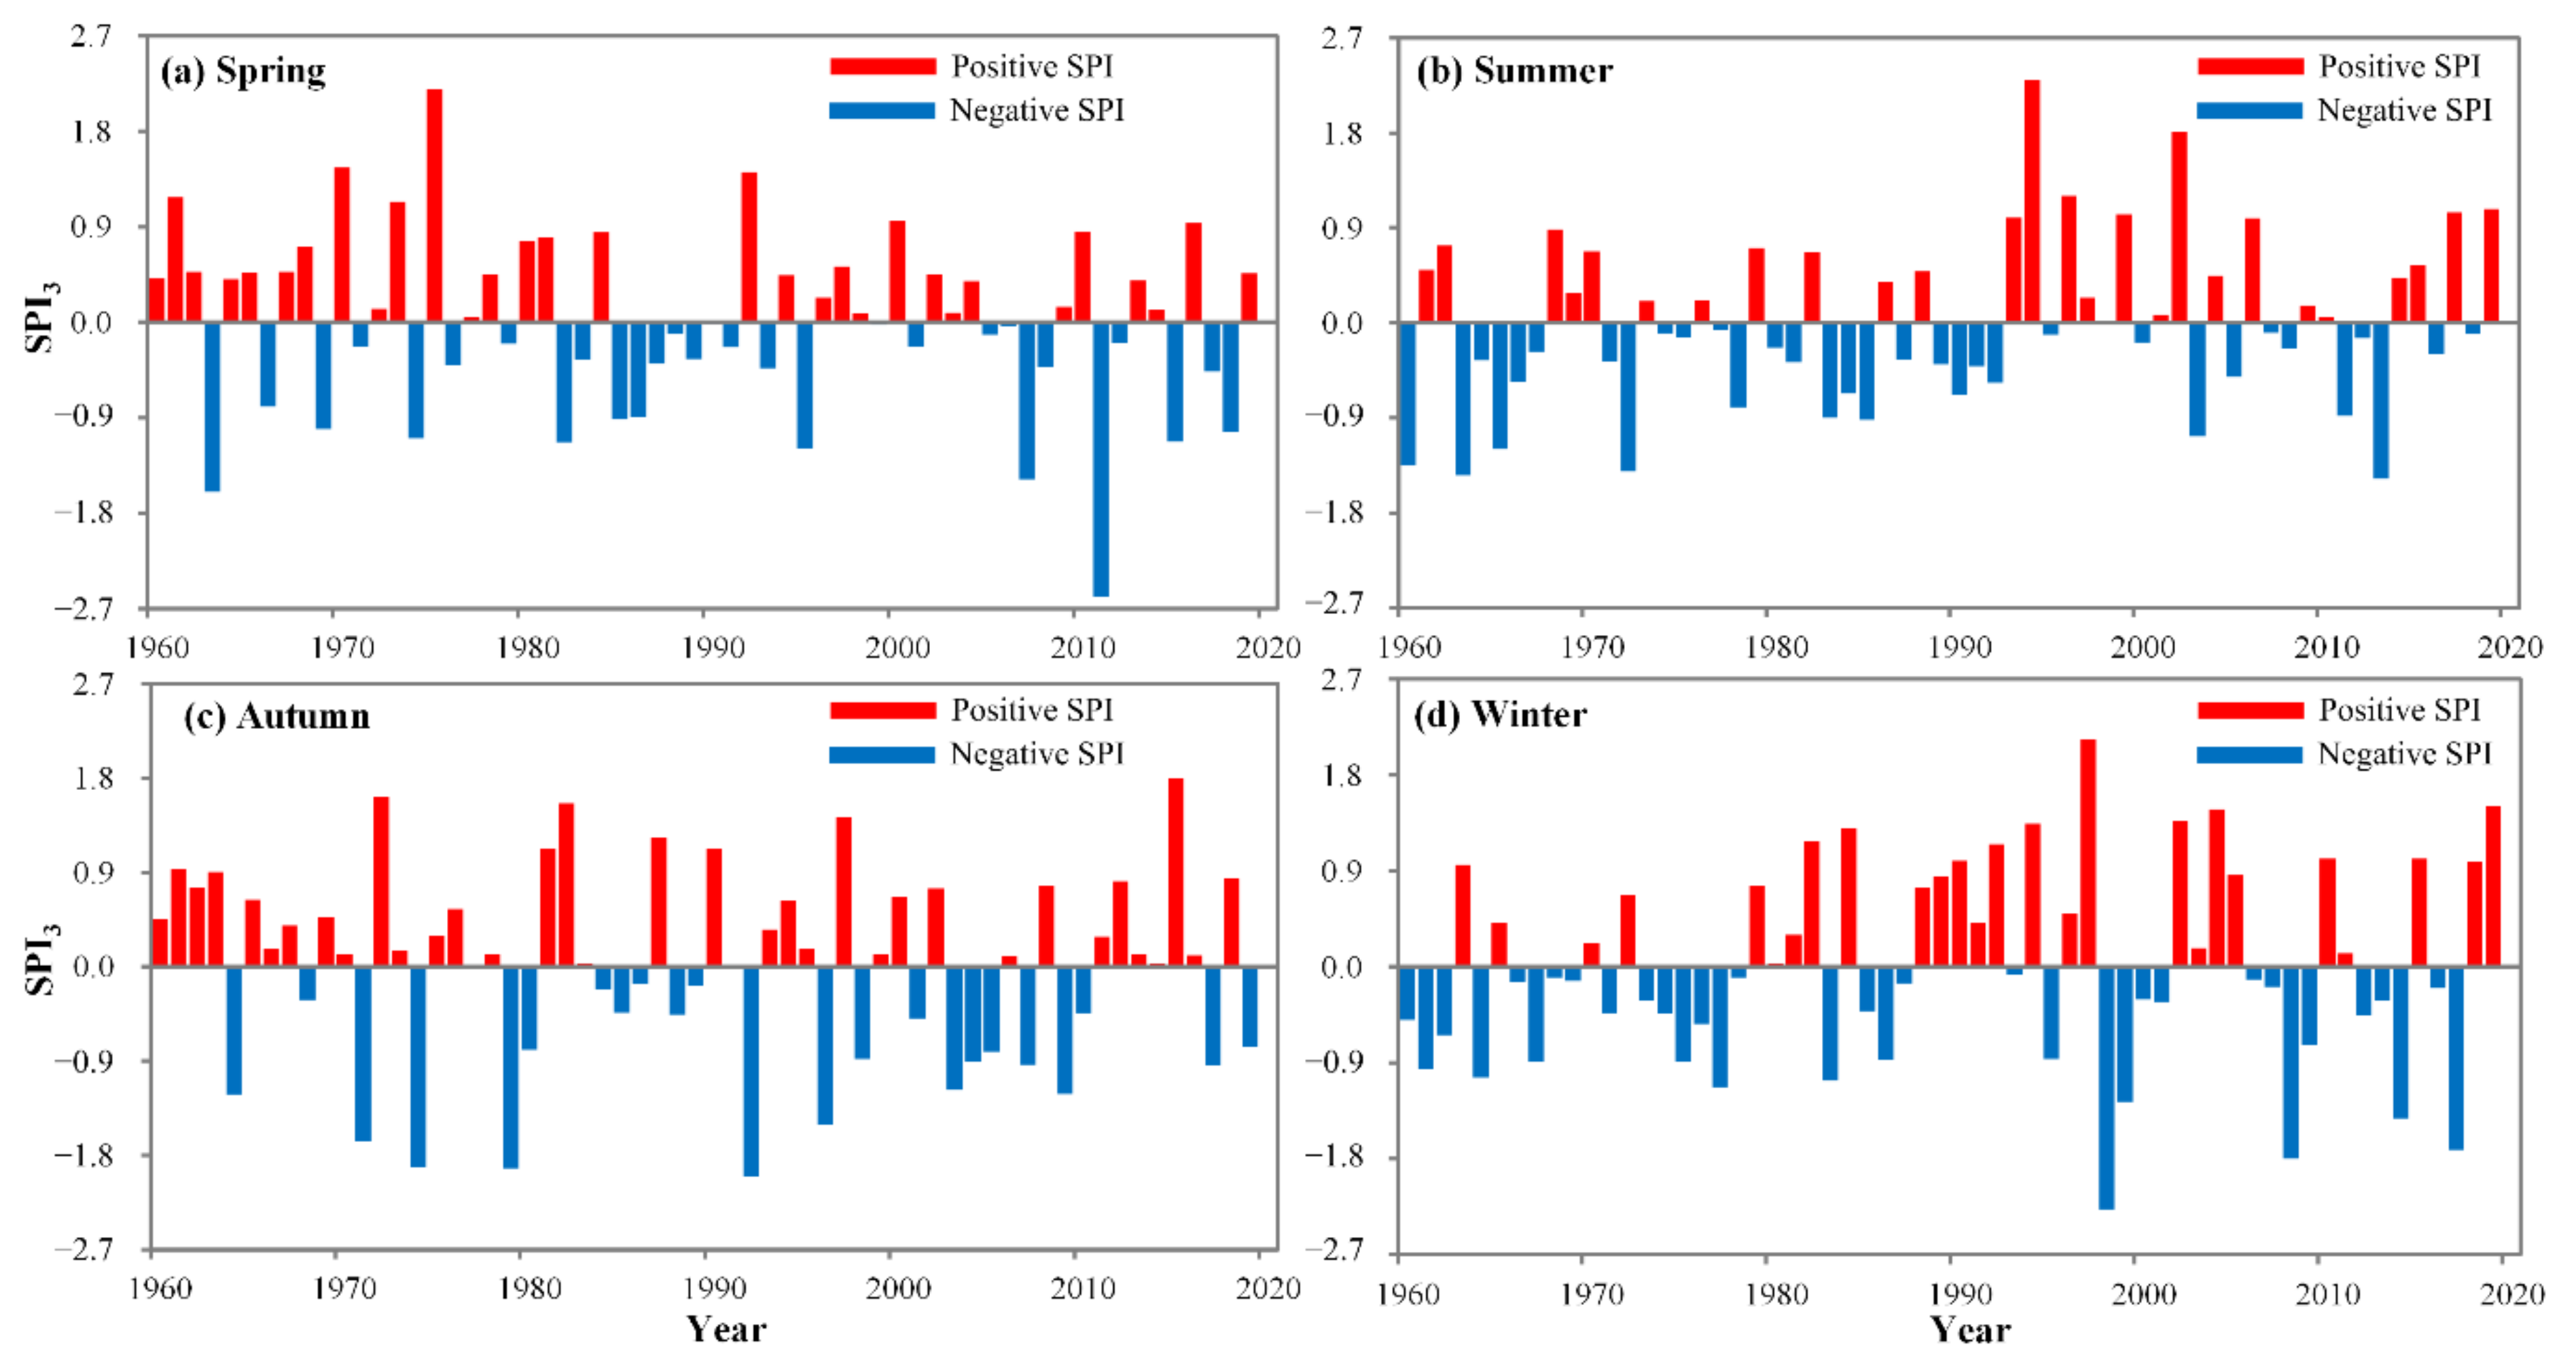
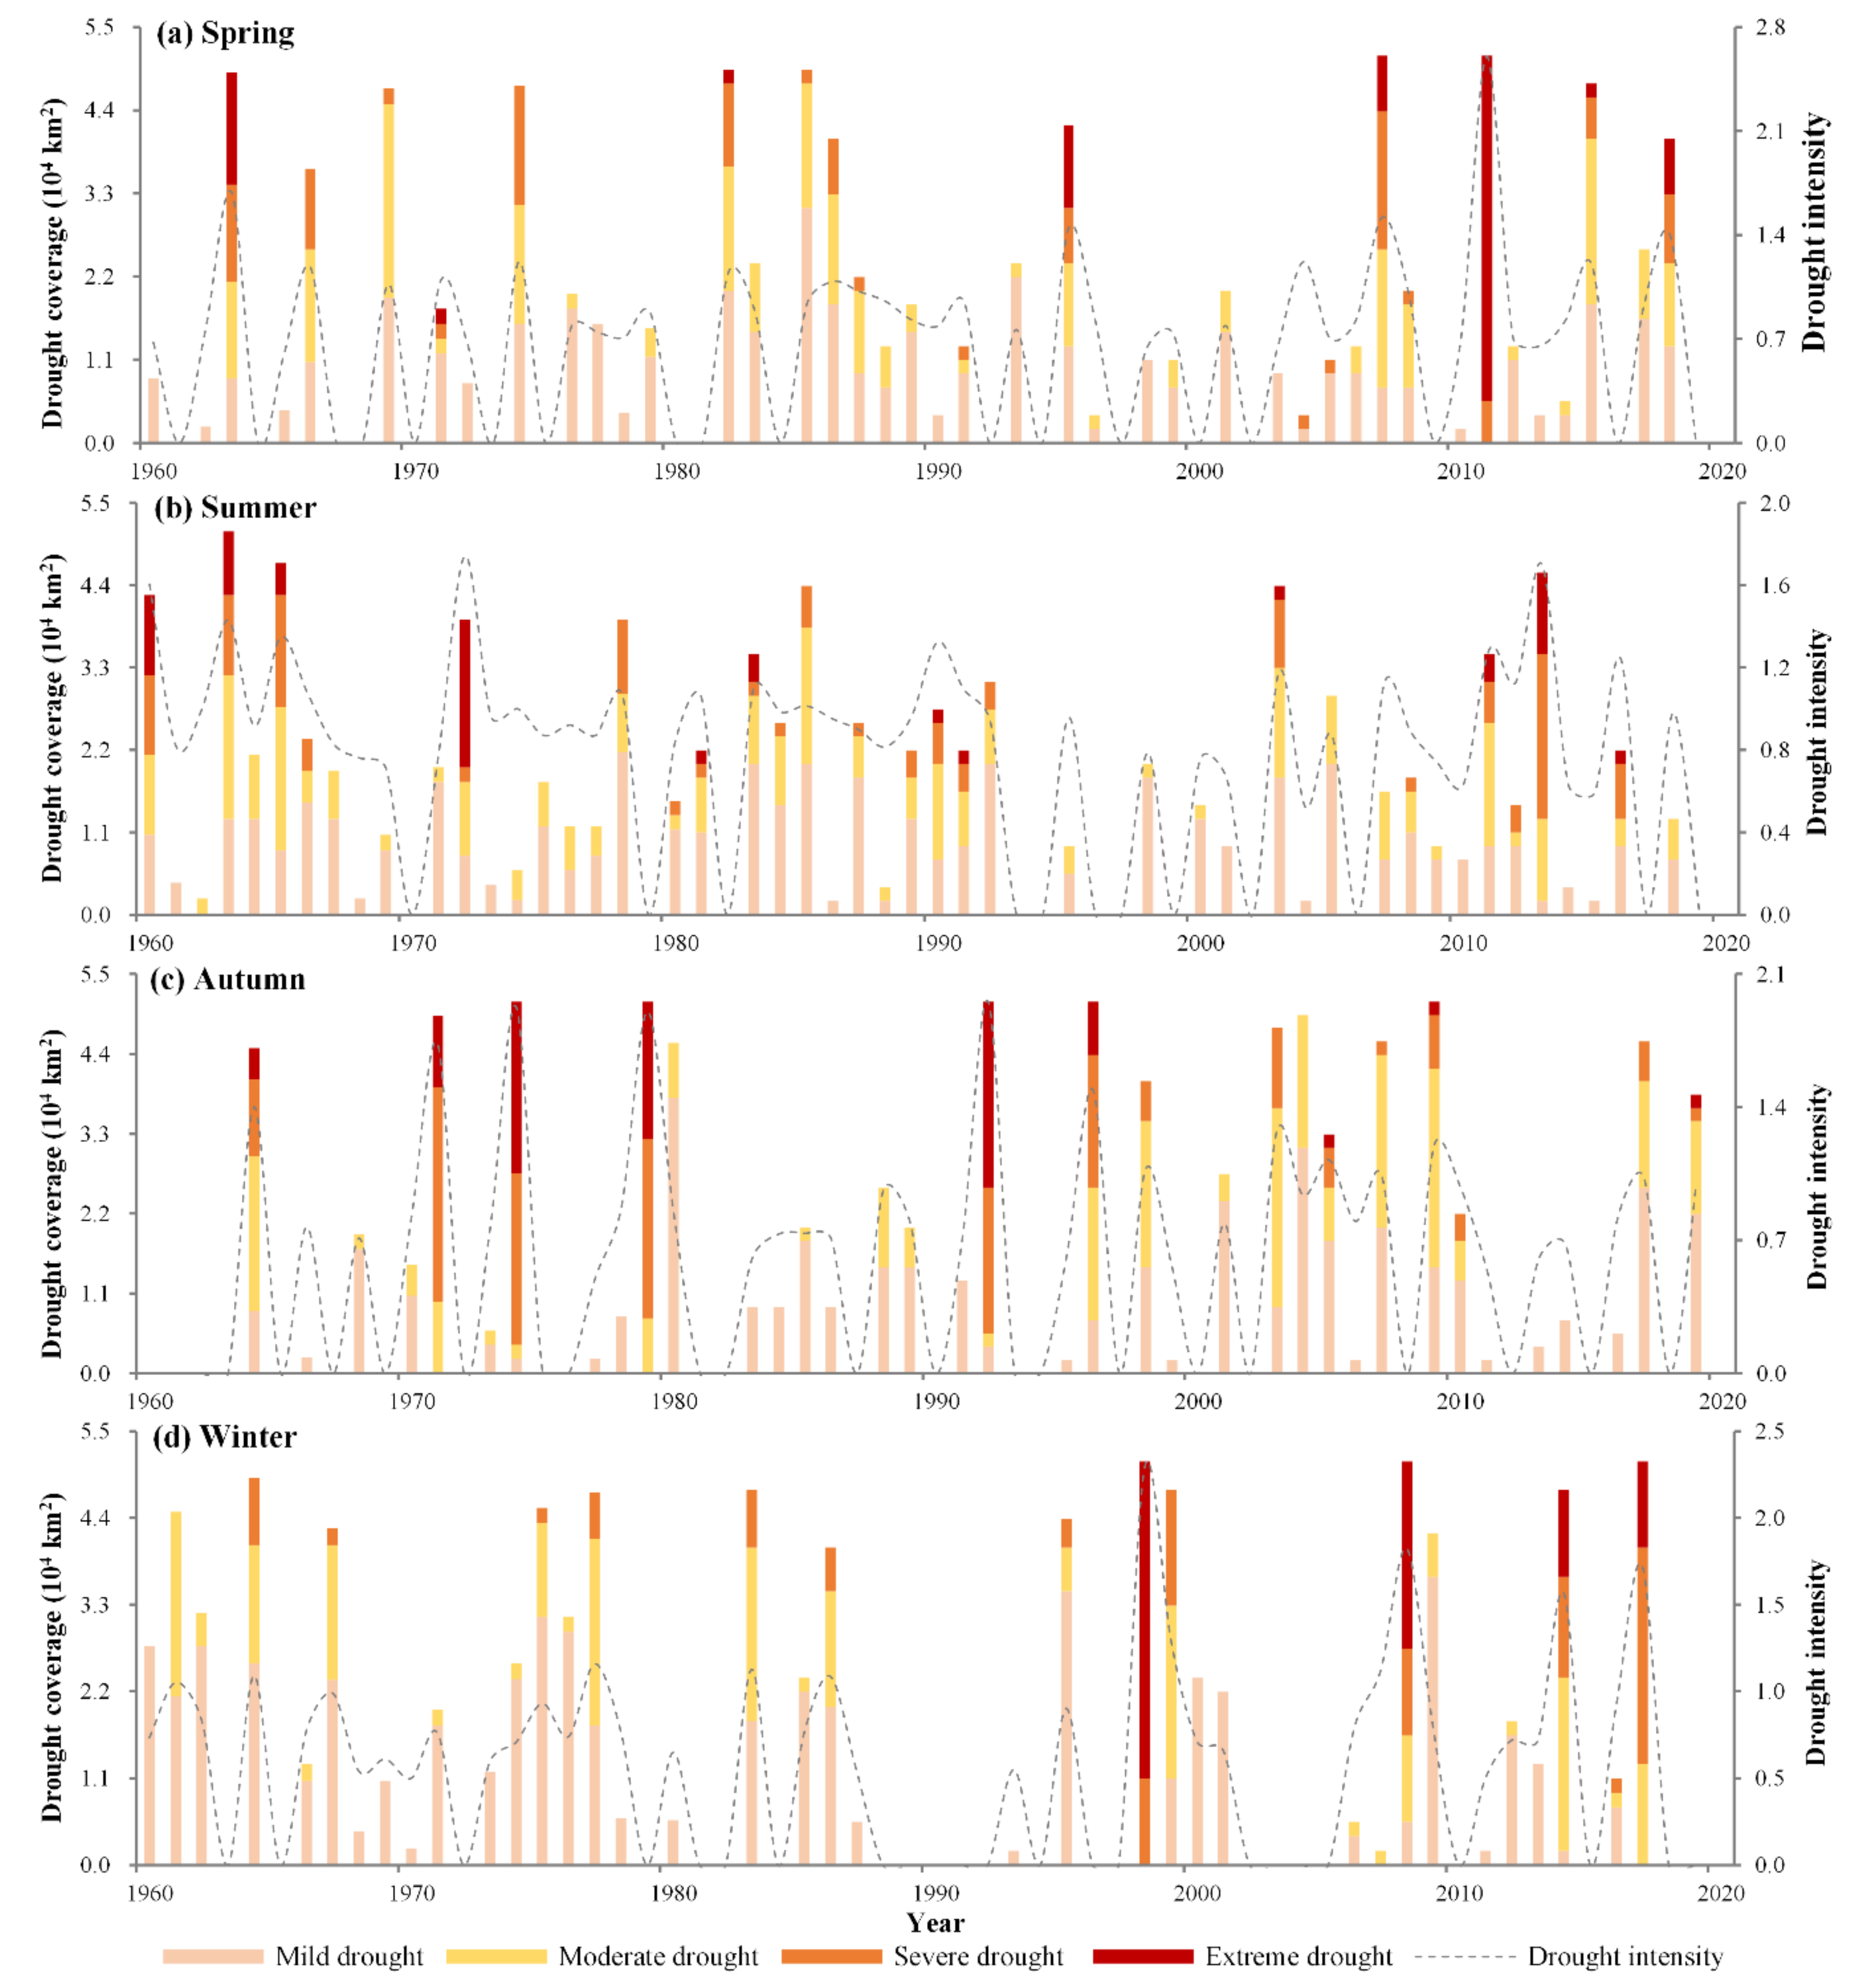
3.1.2. Seasonal Variation

In the period 1960–2019, spring drought occurred in 1963, 1966, 1969, 1974, 1982, 1985–1986, 1995, 2007, 2011, 2015, and 2018, among which 2011 experienced extreme drought with an SPI3 value of −2.59 (Figure 5a). In the same period, summer drought occurred in 1960, 1963, 1965–1966, 1972, 1978, 1983–1985, 1990, 1992, 2003, 2005, 2011, and 2013, where 1960, 1963, 1965, 1972, and 2013 saw the most severe one with moderate dry conditions (Figure 5b). Autumn drought occurred in 1964, 1971, 1974, 1979–1980, 1992, 1996, 1998, 2003–2005, 2007, 2009, 2017, and 2019, among which 1992 experienced extreme drought with an SPI3 value of −2 (Figure 5c). Winter drought occurred in 1960–1962, 1964, 1967, 1975–1977, 1983, 1986, 1995, 1998–1999, 2008–2009, 2014, and 2017, among which 1998 suffered the most severe one with an SPI3 value of −2.28 (Figure 5d). In addition, the SPI3 values for each season in 1970, 1994, 1997, and 2002 were all positive, indicating there was no drought or there was flood.
Figure 6a reveals that during the period 1960–2019, 42 years saw spring drought at various meteorological stations in the study area, including 13 years of area-wide spring drought, 8 years of regional spring drought, 6 years of partially regional spring drought, 7 years of local spring drought, and 8 years of area-wide no drought. Specifically, there were 3 years of area-wide spring drought both in the 1960s and the 1980s, among which the spring drought in 1963, 1982, and 1985 was relatively severe with a coverage of more than 4.9 × 10⁴ km2 each time. There was also spring drought across the whole study area in 1974 and 1995. There have been five area-wide spring drought events since 2000; in particular, spring drought occurred throughout the study area in 2007 and 2011. According to the intensity curve, spring drought intensity fluctuated between 0.6 and 2.6 in the past six decades with a mean value of 0.97, among which 27 years were mild, 12 years were moderate, and 3 years were severe. The change of drought intensity was basically consistent with that of drought station ratio, that is, the year with high drought station ratio had relatively high drought intensity. For example, in 1963, 1982, 1985, 2007, and 2011 when spring drought happened across the whole study area, the spring drought intensity, with values of 1.68, 1.15, 0.94, 1.52, and 2.60, respectively, was relatively high in the study period.
Figure 6b shows that in the period 1960–2019, 48 years have seen summer drought at various stations in the study area, including 15 years of area-wide summer drought, 11 years of regional summer drought, 5 years of partially regional summer drought, 8 years of local summer drought, and 9 years of area-wide no drought. There were 2, 3, 2 and 4 area-wide summer droughts in the 1960s, 1970s, 1980s and 1990s, respectively. Four area-wide summer droughts have afflicted the area after 2000, and the one of 1963 occurred throughout the study area. At the meanwhile, the droughts in 1965, 1985, 2003 and 2013 covered a large area of more than 4.3 × 10⁴ km2. According to the intensity curve, the summer drought intensity fluctuated between 0.52 and 1.74 in the past six decades, with a mean value of 0.99, of which 29 years were mild, 16 years were moderate, and 3 years were severe. In the 1980s and 1990s, the drought intensity was relatively low and the variation range was relatively small. The summer drought intensity fluctuated noticeably in the 1960s and 1970s. In 1972, the drought intensity reached the highest value of 1.74 in the study period. After 2000, summer drought intensity showed an upward trend, with only 4 years (2002, 2006, 2017, and 2019) having no drought. In 2004, the drought intensity was only 0.52, while in 2013, the drought intensity reached 1.70, the second highest value in the study period.
Figure 6c shows that in the period 1960–2019, 37 years witnessed autumn drought at various stations in the study area, including 17 years of area-wide autumn drought, 4 years of regional autumn drought, 2 years of partially regional autumn drought, 7 years of local autumn drought, and 7 years of area-wide no drought. There were 1, 3, 2, and 3 area-wide autumn droughts in 1960s, 1970s, 1980s, and 1990s, respectively. The autumn droughts in 1971 and 2004 were more serious, with an coverage of over 4.9 × 10⁴ km2. Eight area-wide summer droughts have afflicted the area after 2000. In 1974, 1979, 1992, 1996 and 2009, autumn drought events occurred in every station of the study area. In accordance with the intensity curve, the autumn drought intensity fluctuated between 0.5 and 1.95 in the past six decades, with a mean value of 0.95, of which 25 years were mild, 8 years were moderate, and 4 years were severe. The drought intensity reached the lowest value in 1977 and the highest in 1992. It has been predominantly mild since the beginning of the 21st century.
Figure 6d shows that in the period 1960–2019, 37 years witnessed winter drought at various stations in the study area, including 18 years of area-wide winter drought, 5 years of regional winter drought, 2 years of partially regional winter drought, 7 years of local winter drought, and 5 years of area-wide no drought. There were 5, 4, 2, and 3 area-wide winter droughts in 1960s, 1970s, 1980s, and 1990s, respectively. Four area-wide winter droughts have afflicted the area after 2000. In 1998, 2008, and 2017, winter drought events occurred in every station of the study area. The winter drought in 1964 affected a large area, with an coverage of over 4.9 × 10⁴ km2. The intensity of winter drought was relatively high in a year with high winter drought station ratio. According to the winter drought intensity curve, the winter drought intensity fluctuated between 0.5 and 2.30 in the past six decades, with a mean value of 0.92, of which 26 years were mild, 7 years were moderate, and 4 years were severe. The drought intensity remained relatively stable during 1960–1987, with the lowest value in 1970 and 2011, the highest in 1998, whereas it fluctuated upward after 2000.

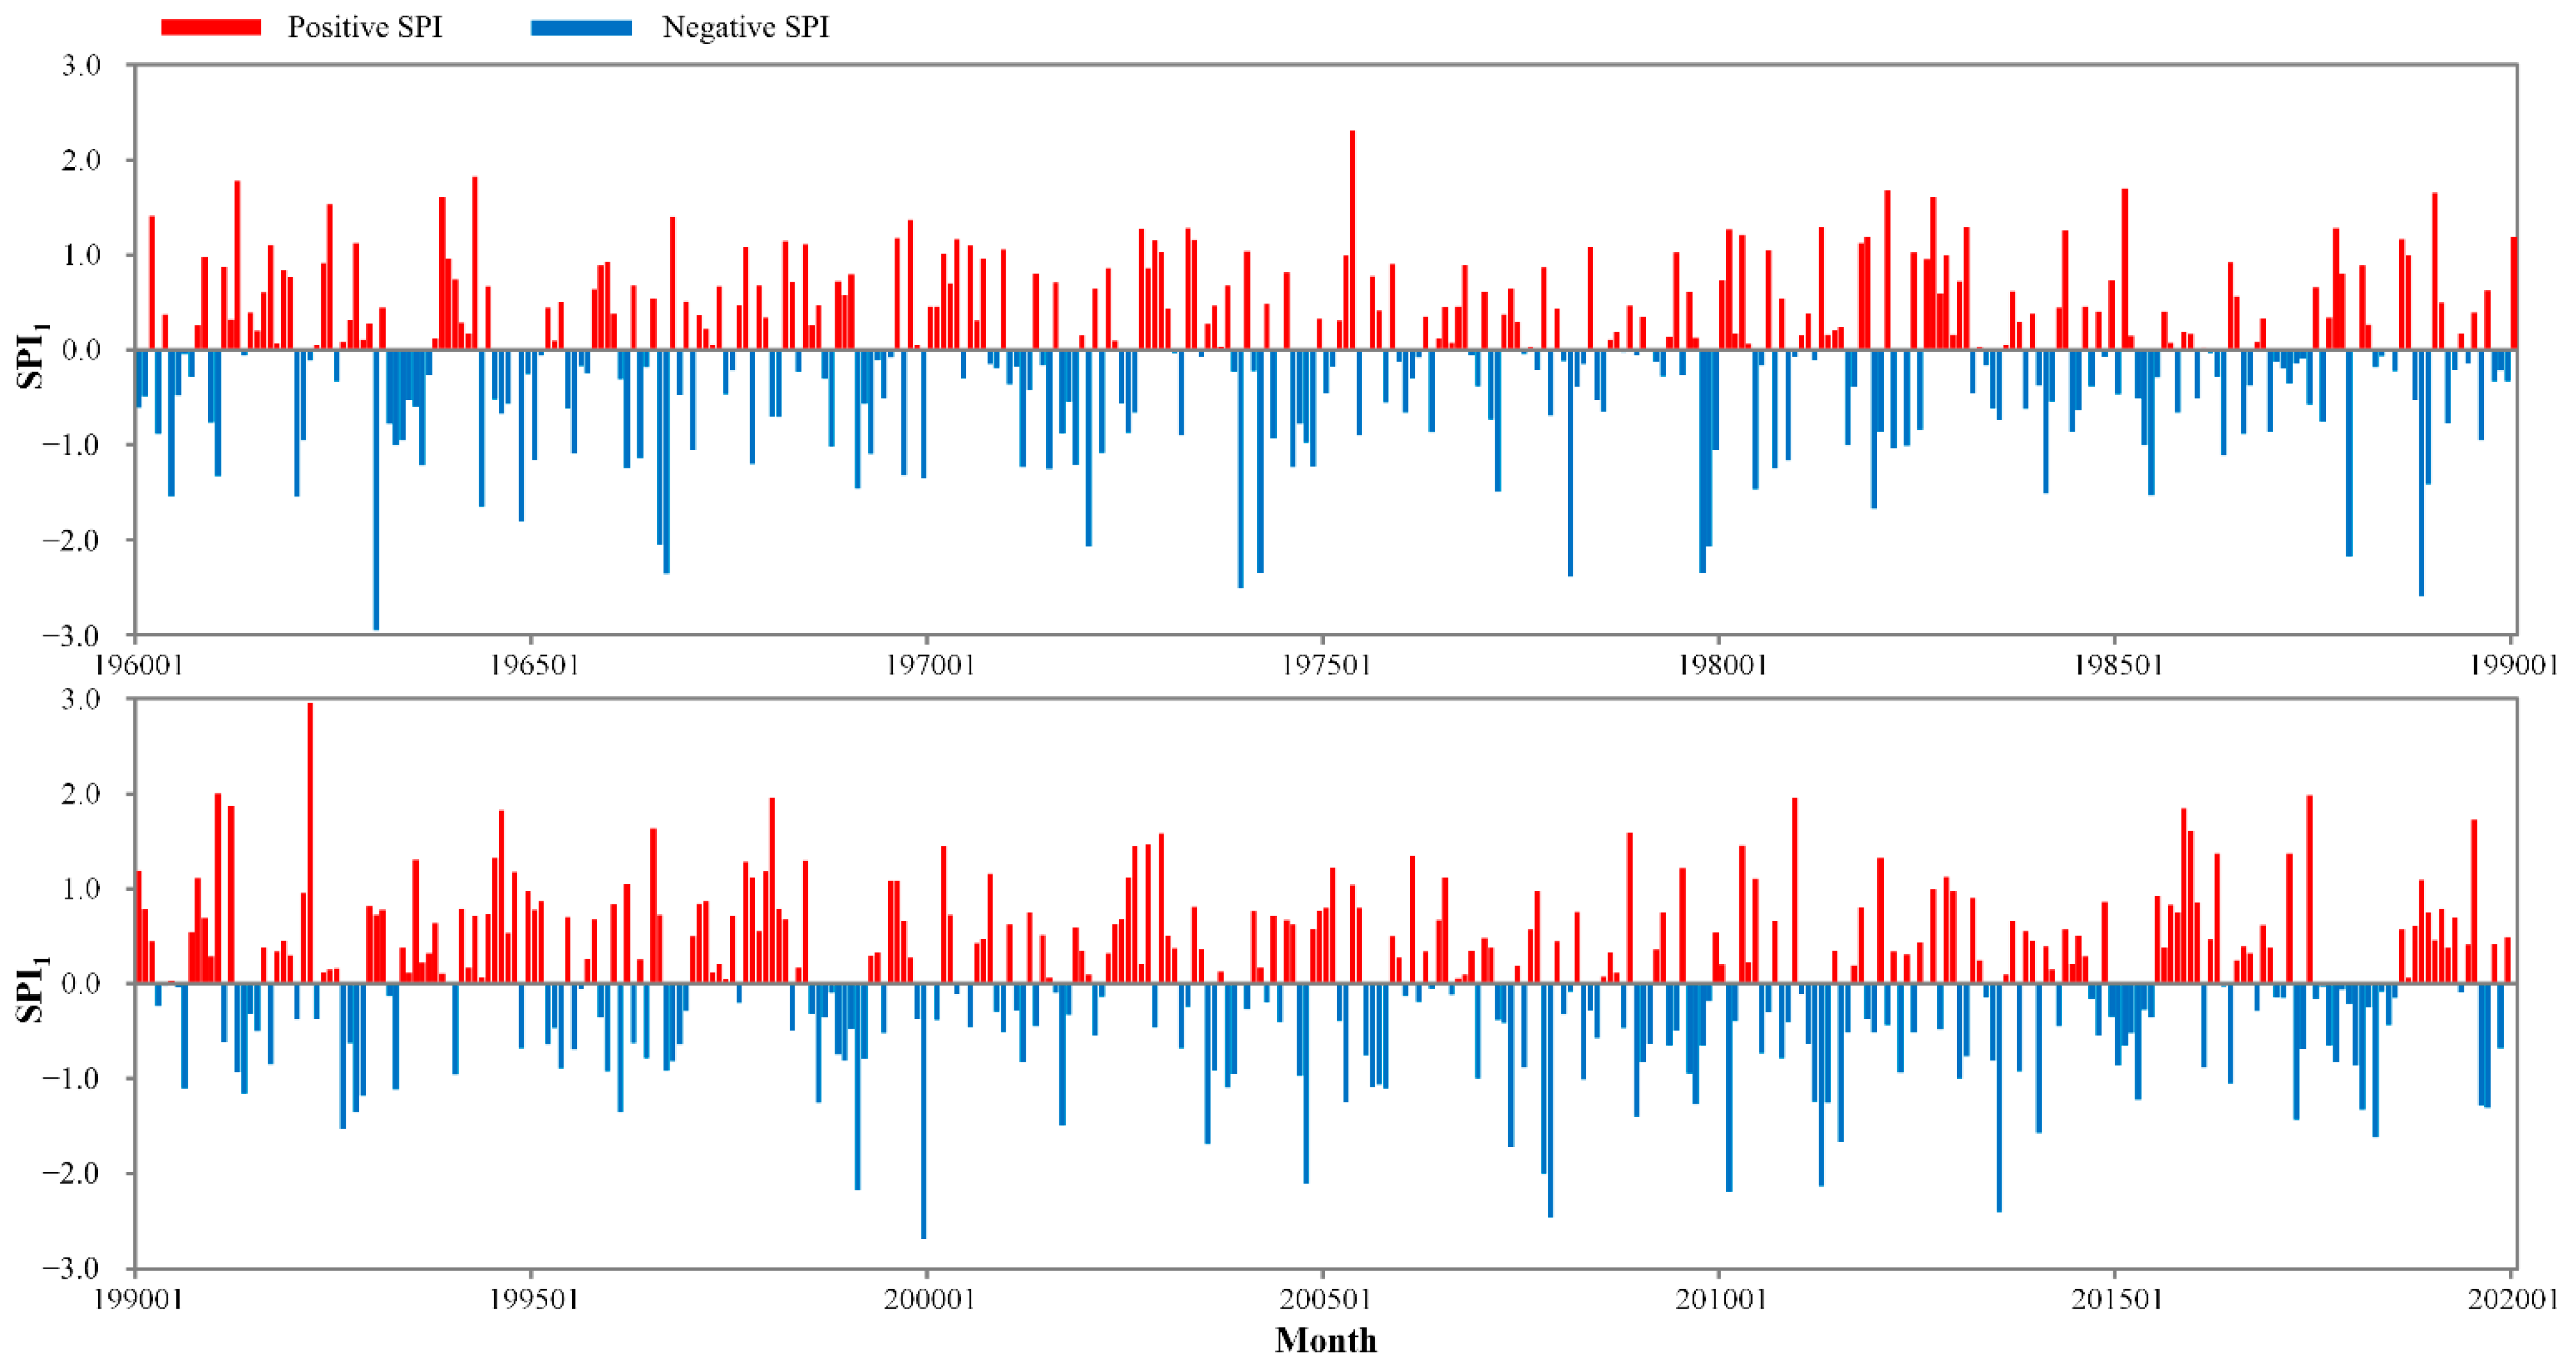
3.1.3. Monthly Variation

As illustrated in Figure 7, the ratio of positive to negative SPI1 values in the study area was basically balanced from 1960 to 2019. The number of occurrences of mild, moderate, severe, and extreme drought accounted for 15%, 7.64%, 0.42%, and 2.64% of the total number of droughts in the study period, respectively. The drought was the most severe in 1963 and 2011 with 7 months of drought with varying severity each year, resulting in consecutive seasons (spring and summer) of drought. The drought condition in 2011 was particularly serious, with one extreme drought (April), one severe drought (July), and two moderate droughts (March and May). As shown in the SPI1 curve, the value was prone to peak in spring (March–May), and reach a trough value in winter (December–February). Furthermore, SPI1 is a short-term value, which means that the severity of drought is greatly affected by the precipitation in a short period. For this reason, SPI1 values frequently fluctuate up and down along the zero-value line, which leads to a large variation range from month to month, as well as subtle variation characteristics of SPI1.
Table 1 reflects that drought occurred in every month in the study area, with two peak frequency values shown in June (31.9%) and October (31.1%). The frequency of mild drought was higher in January, March, June, and October than any other month. In the case of moderate drought, the frequency was higher in March, June, and October. In the case of severe drought, the frequency value was higher in April, June, August, and September. With respect to extreme drought, its frequency was higher in February, November, and December. Moderate drought, as well as drought of higher severity, occurred mainly in April, May, June, September, and October, each of which had a drought frequency of more than 15.5%. Noticeably, April, May, and June witnessed a higher drought frequency of over 16%. Severe and extreme drought primarily occurred in August, September, and December, each of which had a drought frequency of over 7.9%; additionally, August saw the highest frequency of 8.5% and March the lowest of 5.7%.

3.2. Spatial Patterns of Droughts

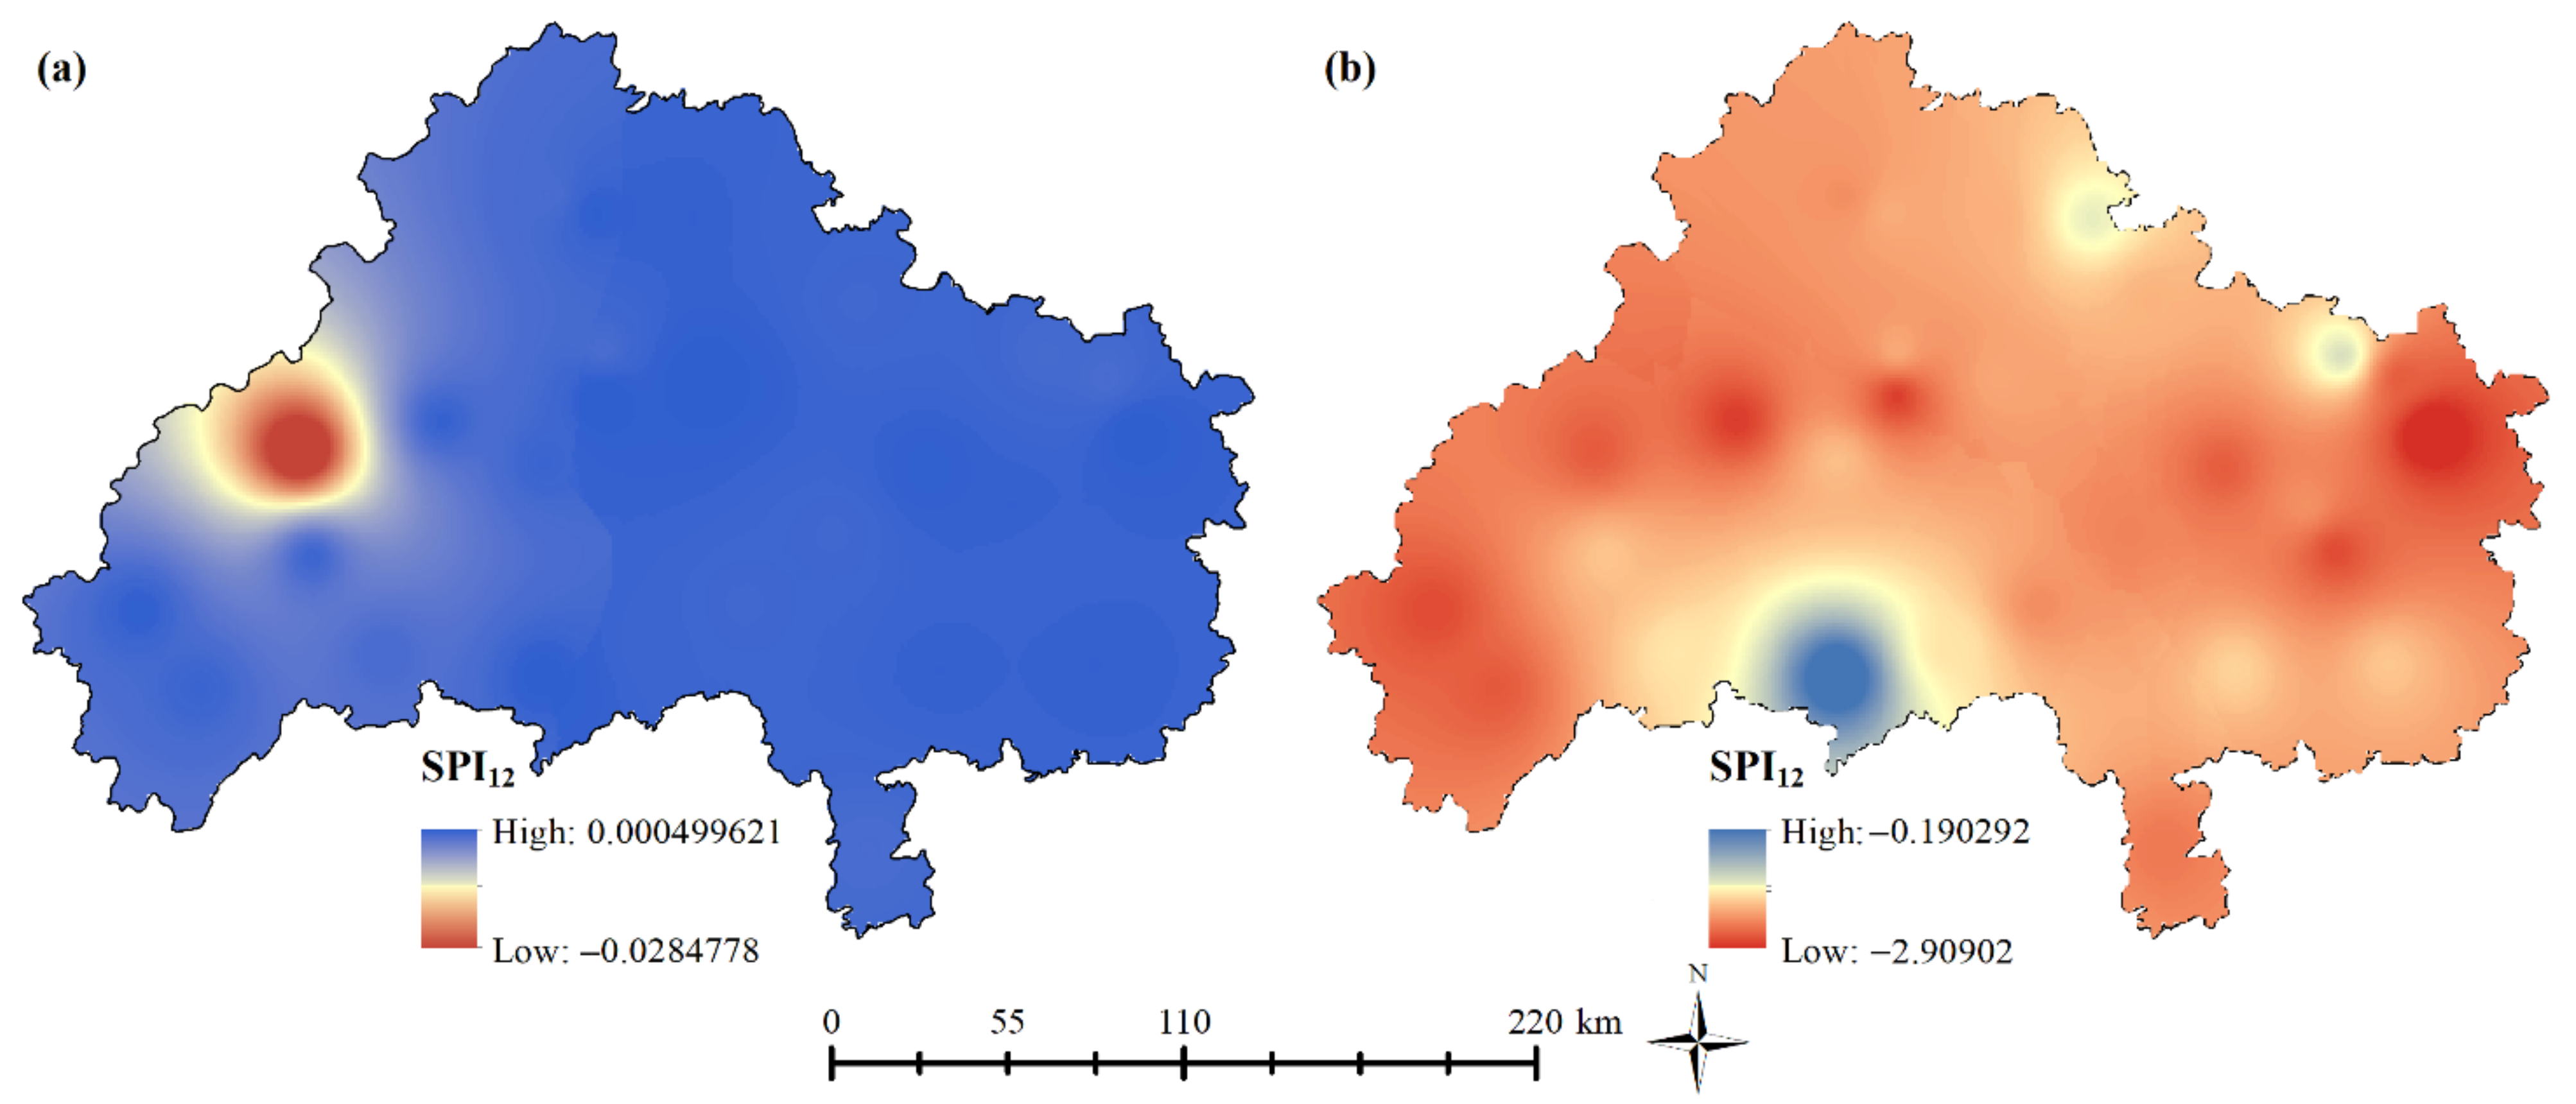
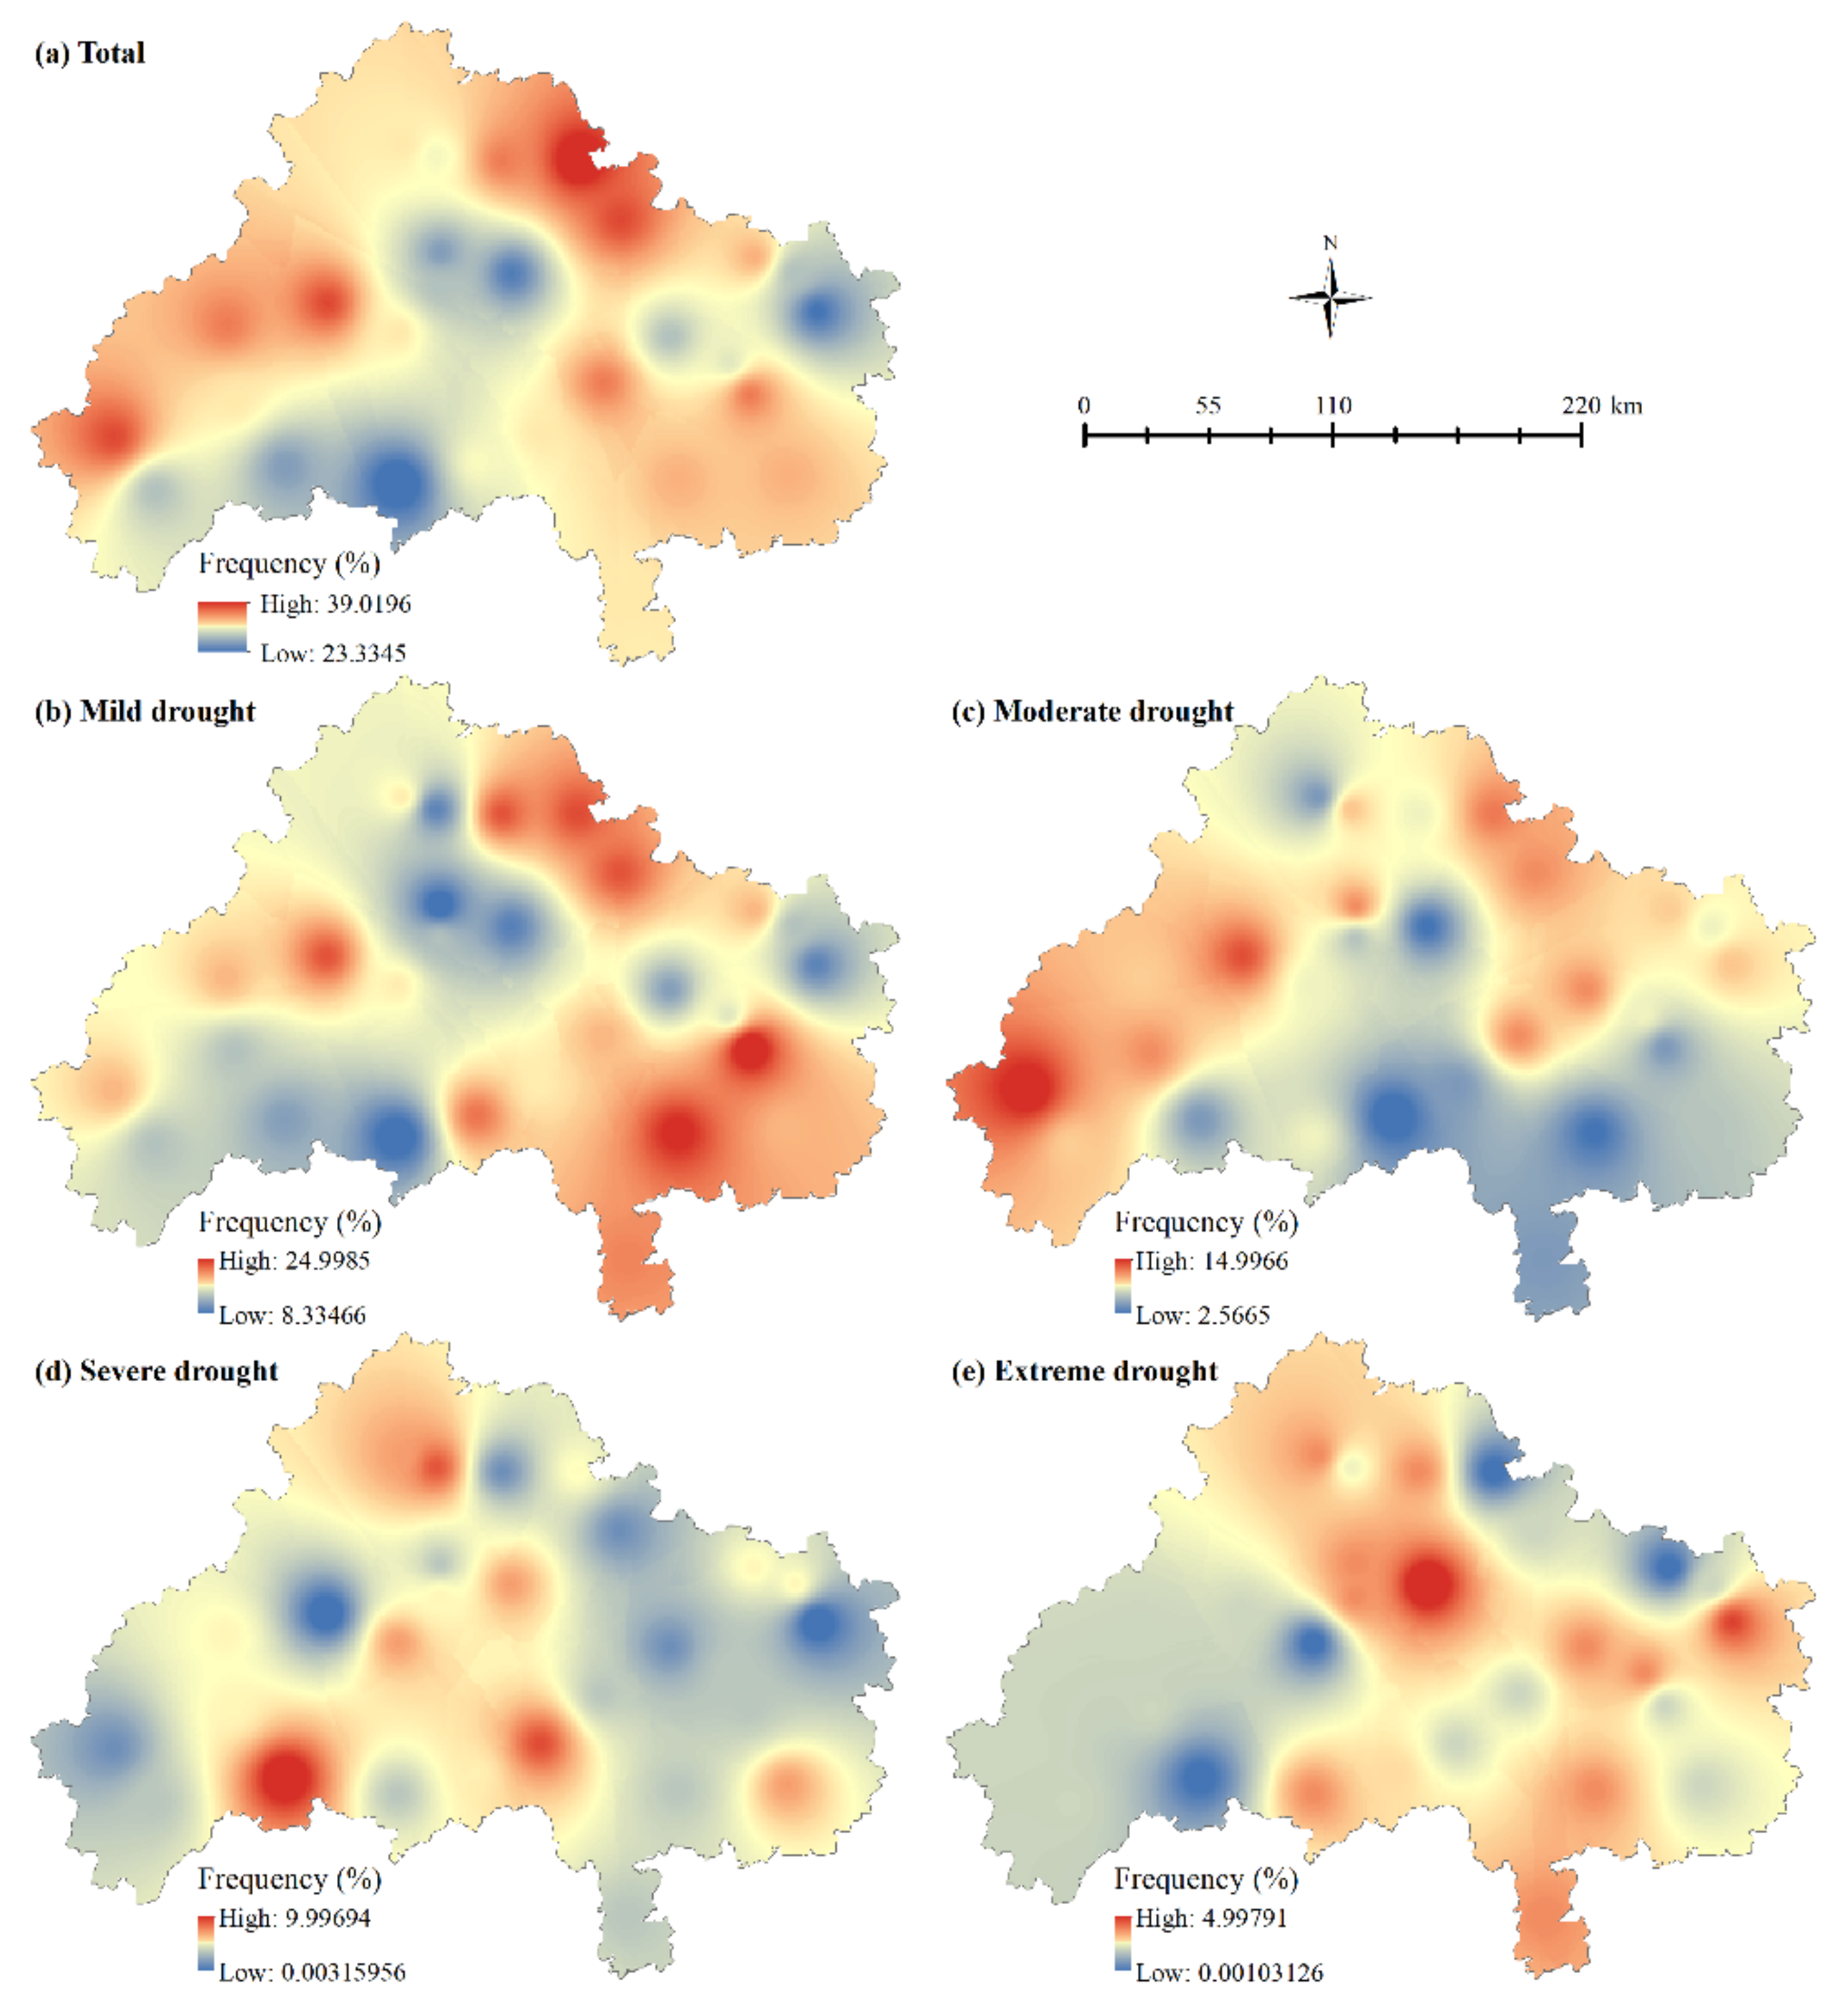
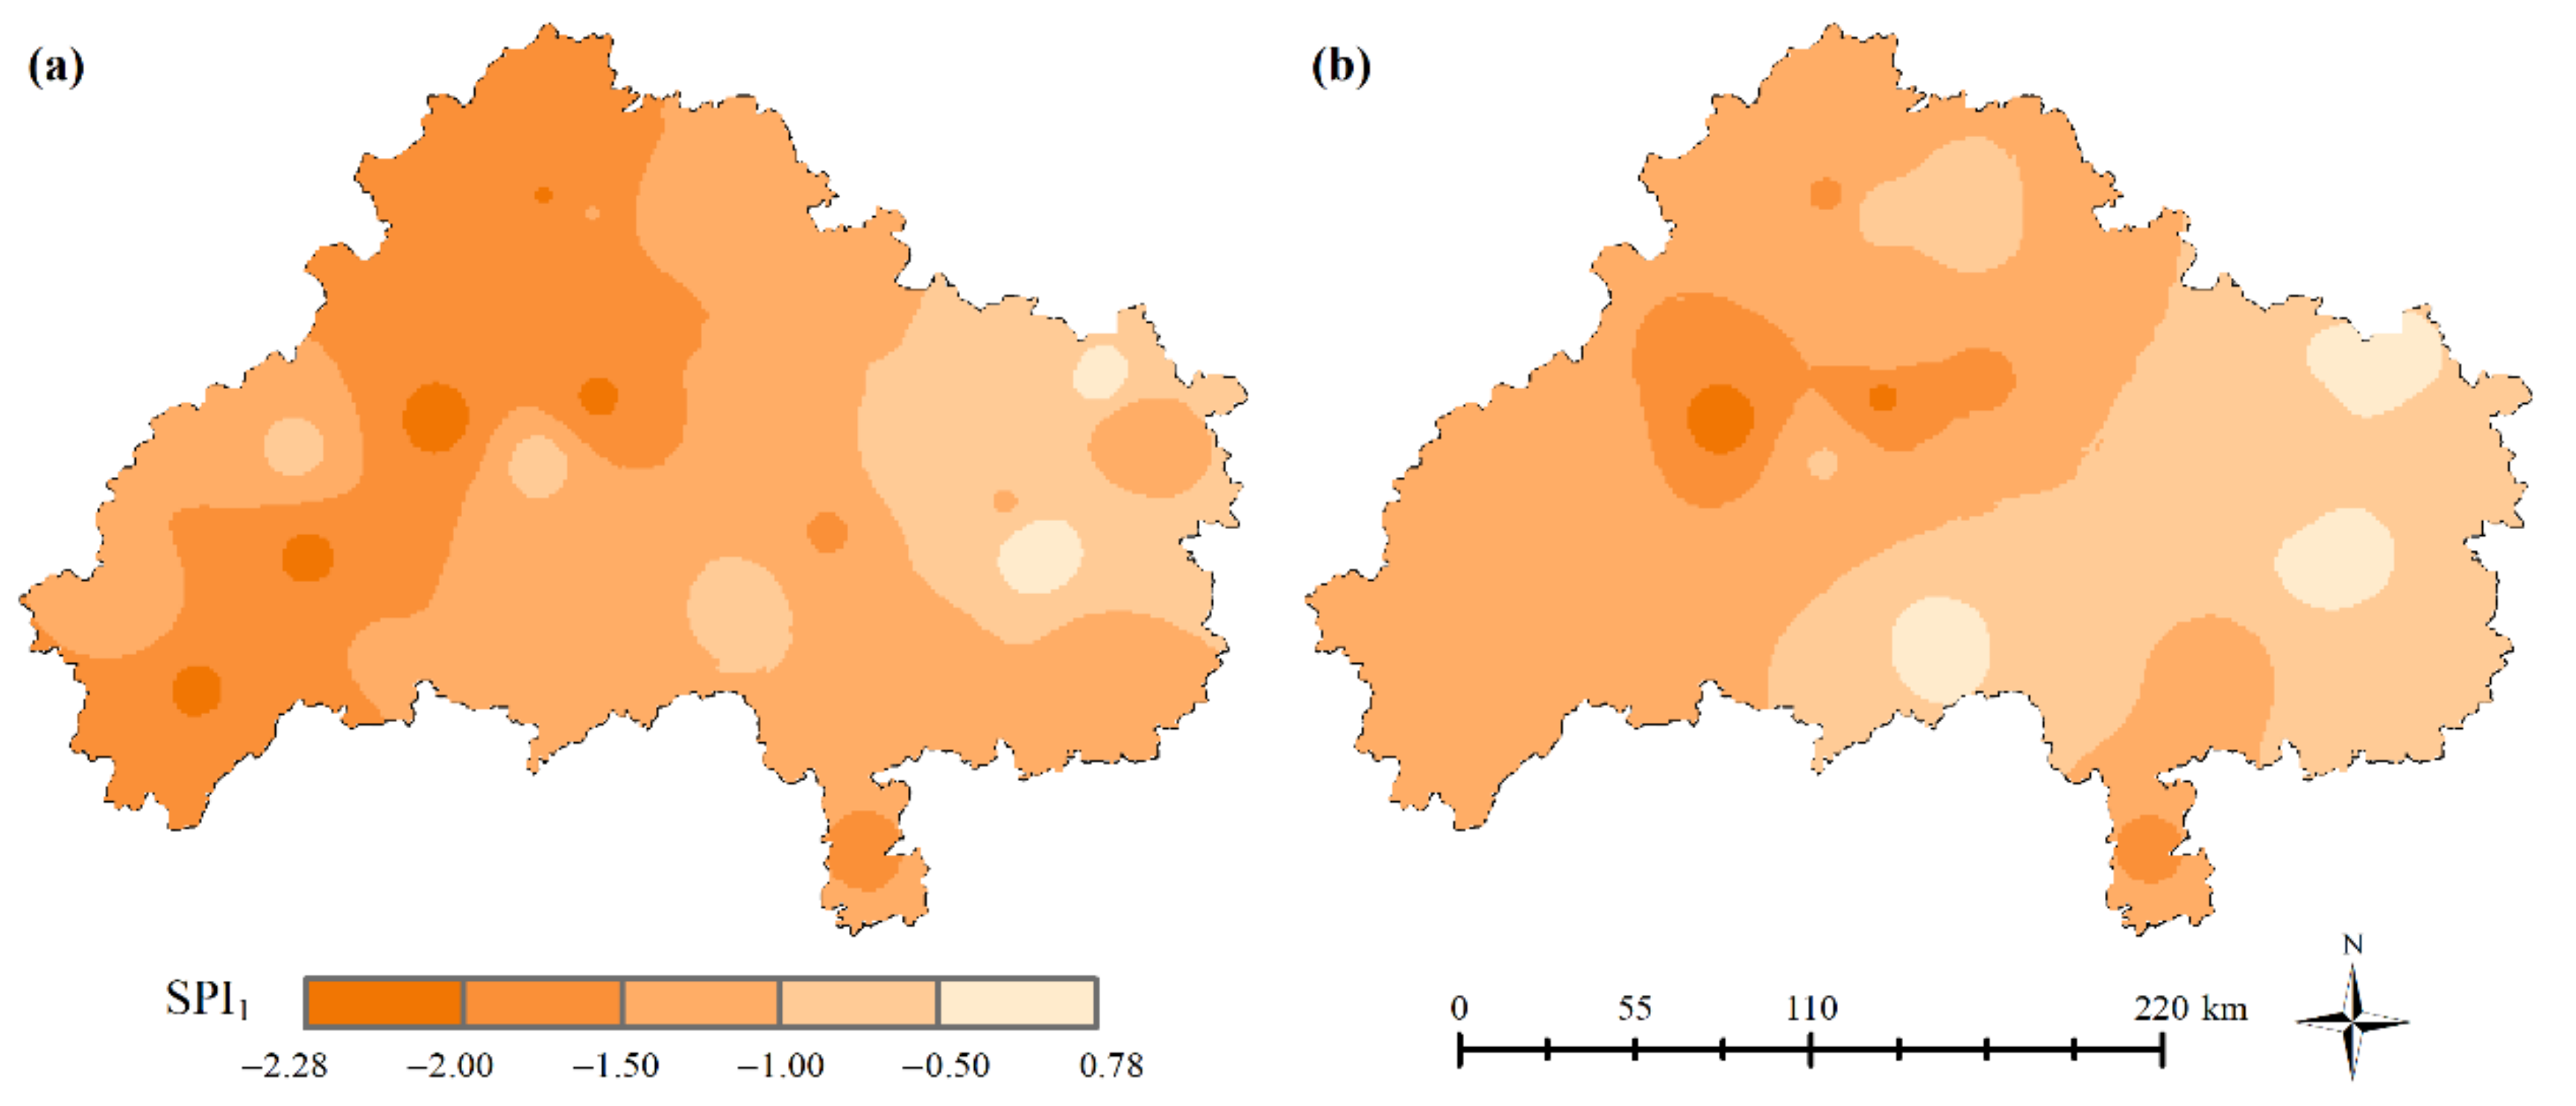
3.2.1. Spatial Analysis of Annual Drought

The average SPI12 for each meteorological station in the period 1960–2019 is considered the climate normal for each station in the study area. As presented in Figure 8a, the SPI12 value was negative at most stations (especially Dongkou) in the study area, indicating that there was a certain annual precipitation deficit in the area. 2011 is regarded as an exceptional drought year, as it is the only year with large-scale extreme drought in the study area in the past six decades. As shown in Figure 8b, the SPI12 value throughout the study area was less than 0, indicating that the overall precipitation was low in 2011, when moderate, severe, or extreme drought occurred in all stations except Dongan (no drought). The area with moderately dry conditions was mainly located in Nanyue and Loudi, while the one with severely dry conditions was scattered in counties such as Changning, Leiyang, Lengshuitan, Shaoyang, Wugang, and Xinning. Remarkably, the area affected by extreme drought is the most extensive, covering more than 2/3 of the whole study area.
In the past six decades, the drought years in the study area totaled 17 years, accounting for 28.3% of the entire study period, including 16.7% of mild drought years, 10% of moderate drought years, and 1.7% of extreme drought years. Overall, the frequency of drought events of all categories in the study area was between 23.33% and 39.02%. It was relatively high in the east of Loudi City, north of Hengyang City and northwest of Shaoyang City, with the highest value detected in Loudi, Longhui, Shuangfeng and Suining. On the other hand, it is relatively low in the northeast of Hengyang City, the northwest of Yongzhou City, and the east and southeast of Shaoyang City, with the lowest found in Dongan, Hengdong, Shaodong, Xinshao, Xinning, and other counties (Figure 9a). Next, the frequency of mild drought events ranged from 8.33% to 25%: the high values were mainly distributed in the majority of the eastern part of the study area and a tiny part in its northwest, including the vast areas lying in the south of Hengyang City, the east of Loudi City, and the northeast of Yongzhou City, as well as a small part of the northwestern Shaoyang City; the low values were primarily found in northwestern Yongzhou City, northeastern and southern Shaoyang City, along with northern Hengyang City (Figure 9b). Third, the frequency of moderate drought ranged from 2.56% to 15%: it was generally higher in the west and north than in the central and southern part, and it was found to be relatively high in most parts of Shaoyang City and Loudi City, as well as the northern part of Hengyang City (Figure 9c). Fourth, the frequency of severe drought was between 0% and 10%: the high values were mainly found in Xinning, Qiyang, and Lengshuijiang, while the frequency was relatively low in most other areas (Figure 9d). Last, extreme drought occurred in most stations, but the occurrence frequency was the lowest (0~5%): the high values were mainly distributed in Shaodong and Hengdong, while the low values were found in most parts of Shaoyang City, eastern Loudi City, and a small part of northern Hengyang City (Figure 8e).

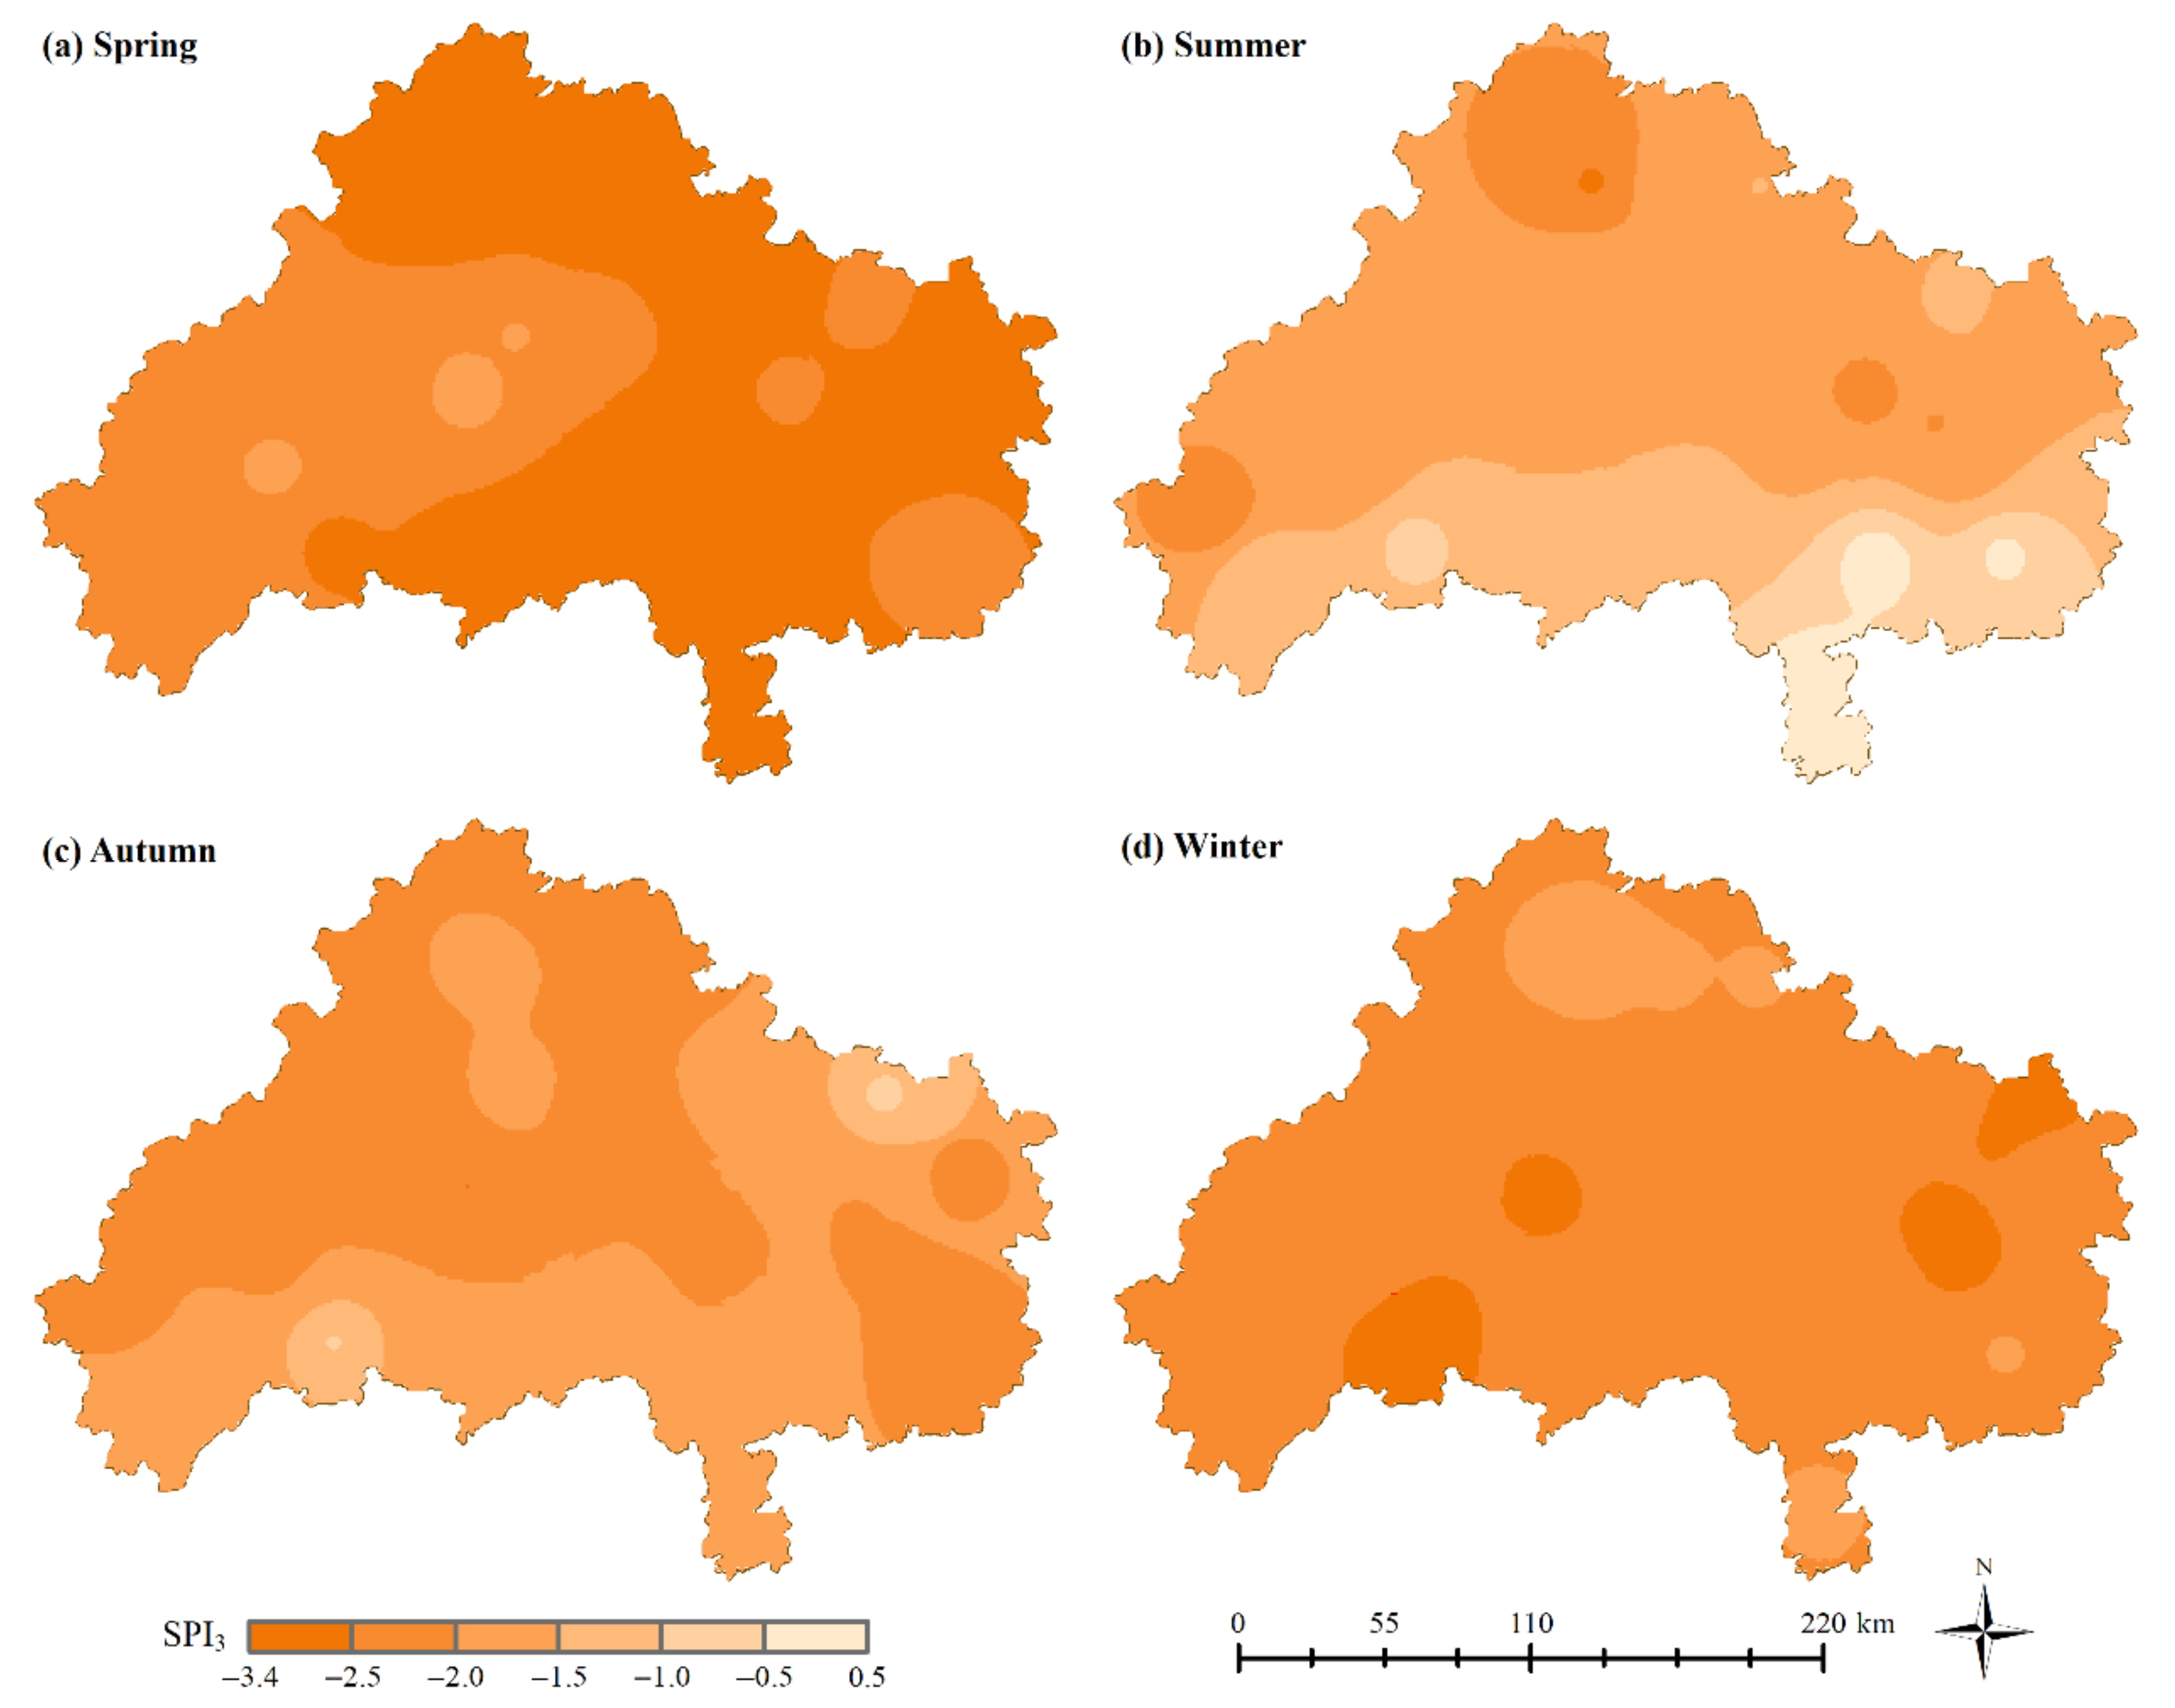
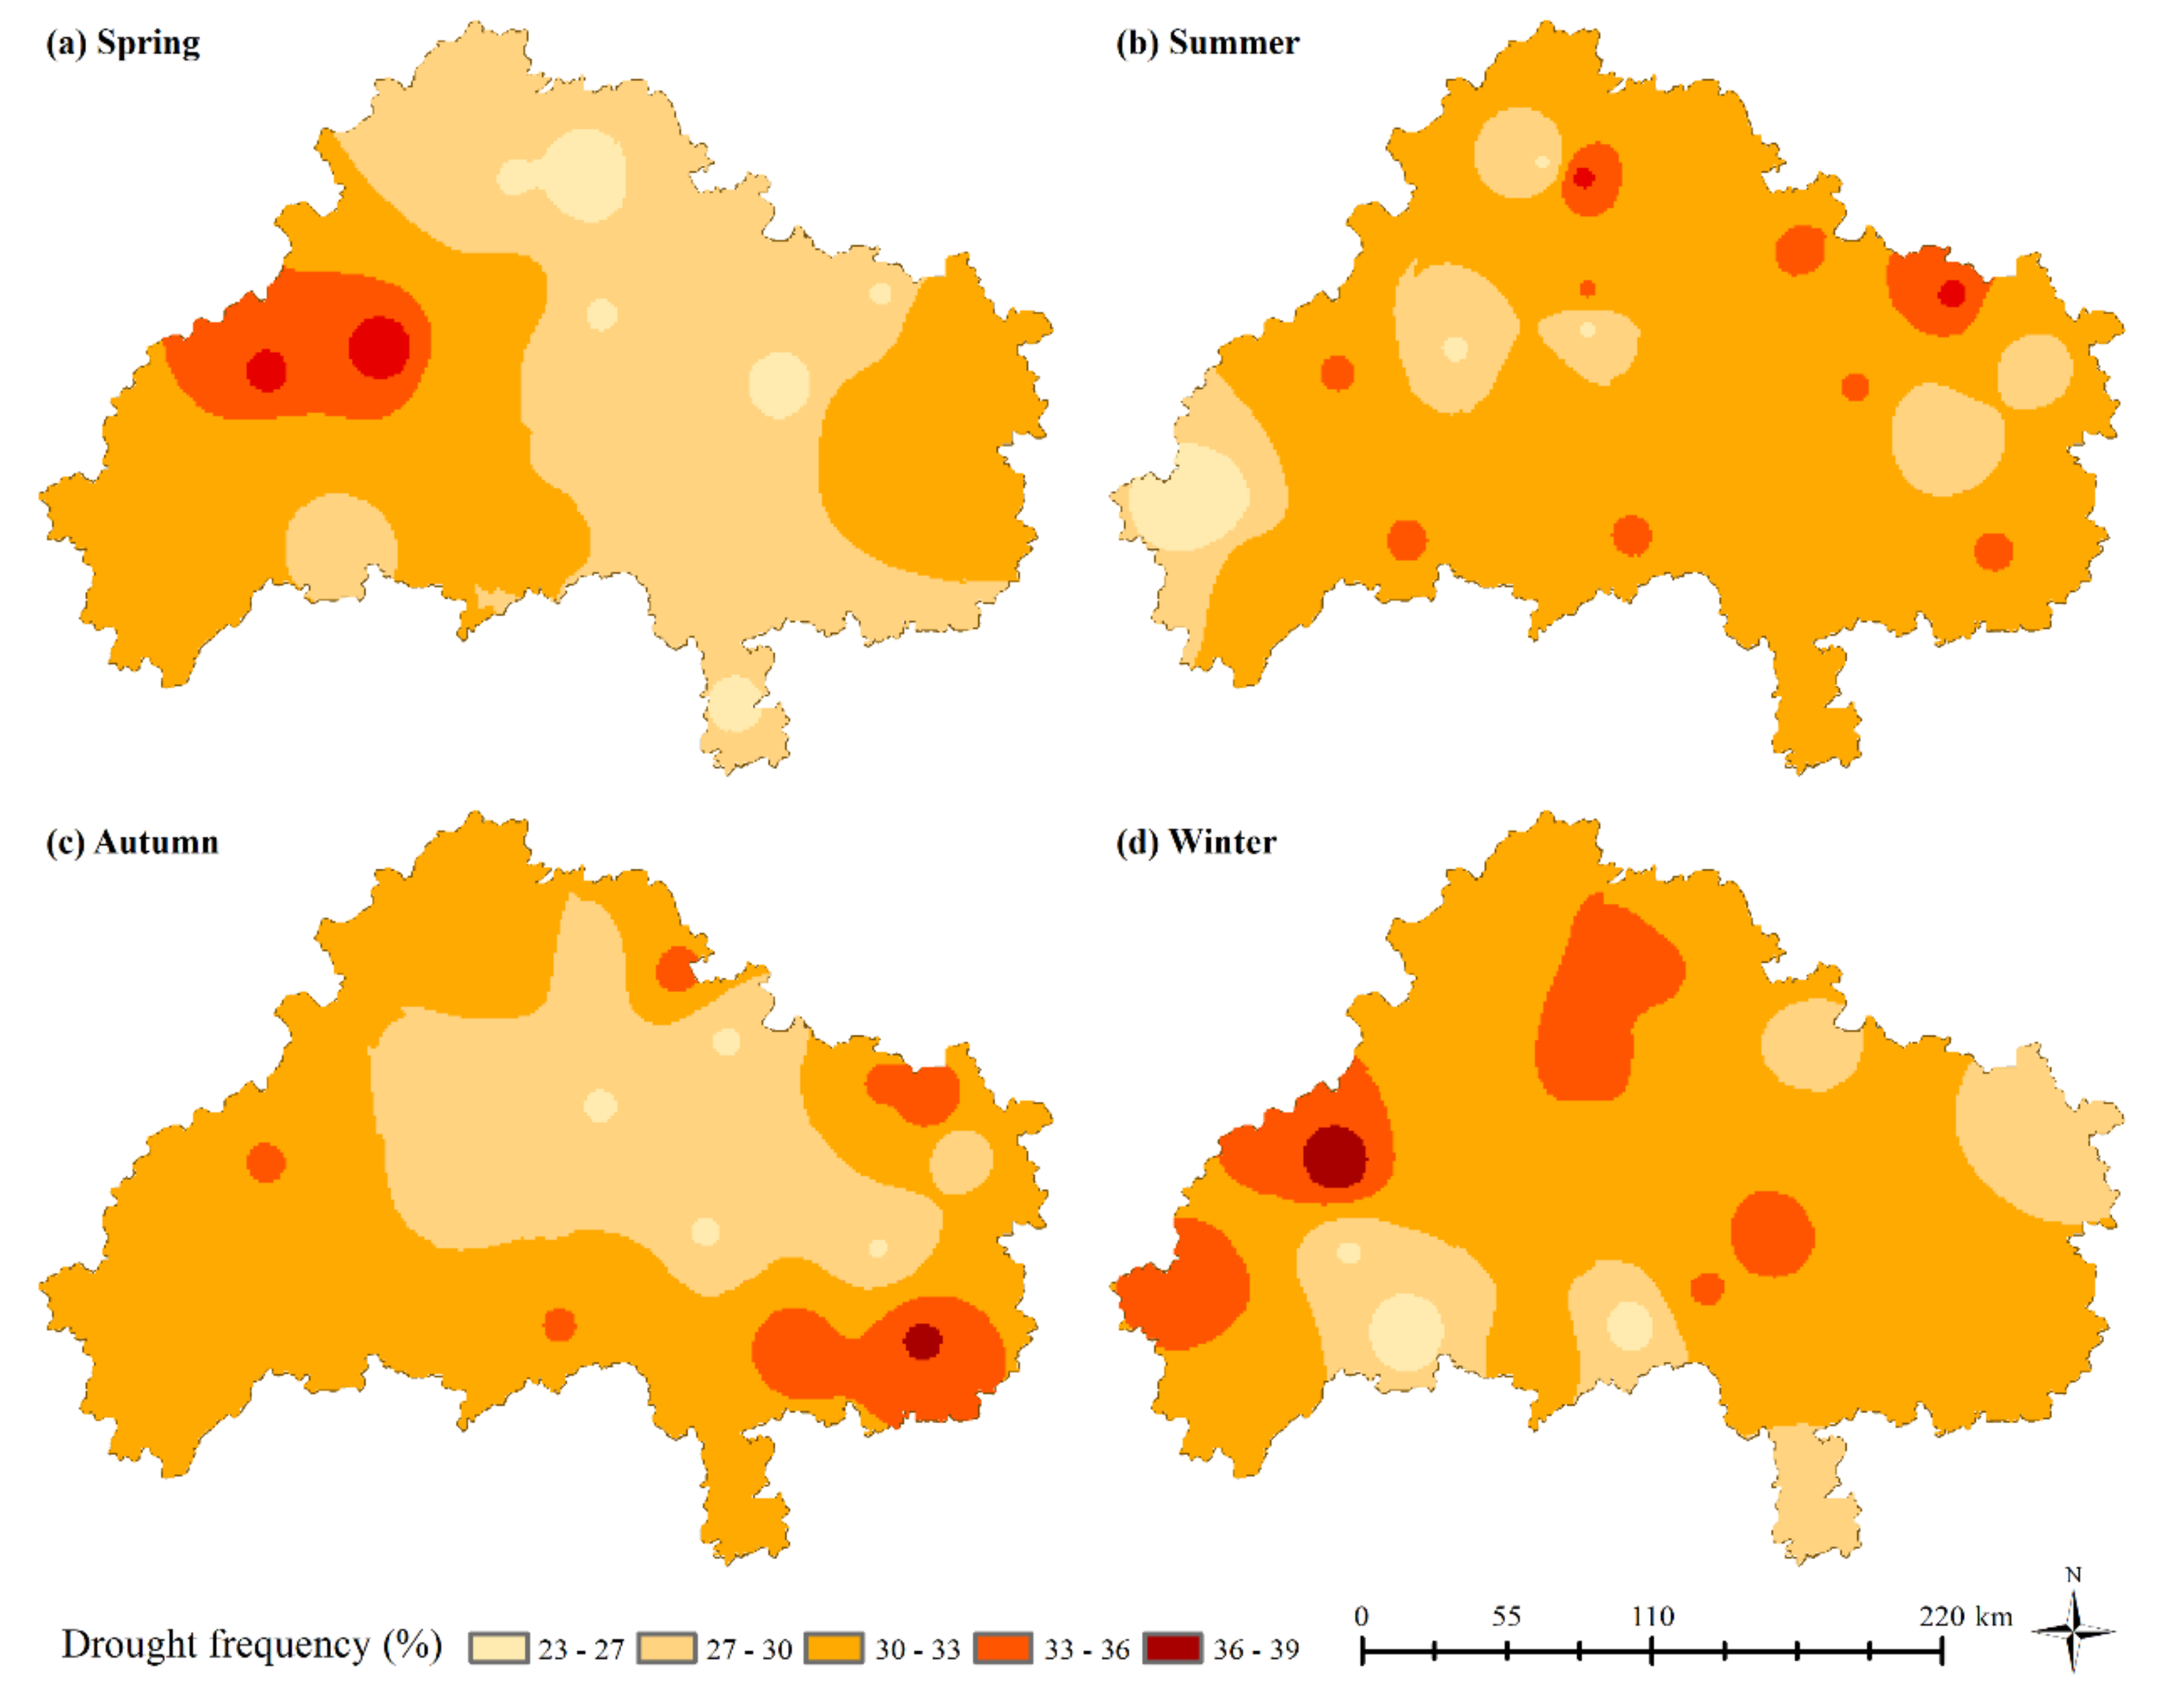
3.2.2. Spatial Analysis of Seasonal Drought

In the period 1960–2019, the year with the most severe spring drought was 2011. In the case of the worst summer, autumn, or winter drought, it was 2013, 1992, and 1998 respectively. Consequently, these four years were selected as typical seasonal drought years. In spring of 2011, severe and extreme drought events occurred throughout the study area: extreme drought covered 89.29% of the whole area; Hengyang City, Loudi City, and Yongzhou City experienced more serious drought than Shaoyang City, exhibiting an overall tendency of high in the east and low in the west (Figure 10a). In the summer of 2013, all stations in the study area, except Changning, Leiyang, and Xintian which were free from drought, experienced mild drought or drought of higher severity: the drought was more severe in the western part of Yongzhou City, Hengyang County, and Suining County, showing a gradual increase from south to north in severity (Figure 10b). In the autumn of 1992, all stations, except Nanyue and Xinning which experienced only mild drought, suffered moderate drought or drought of higher severity: the distribution pattern of drought severity was “high-low-high” from northwest to southeast (Figure 10c). In the winter of 1998, severe and extreme drought events occurred throughout the study area, of which 78.57% were extreme drought; the distribution of drought severity was highly homogeneous, with a relatively high value in a small area in eastern Shaoyang City and northeastern Hengyang City, and a low value in a small area in central Loudi City and eastern Yongzhou City (Figure 10d).
In the recent six decades, the frequency of spring drought in the study area was between 25% and 38.33%: it was relatively high in the east and west of the study area, and low in the part running through the center of the area from the north to the south, with the highest value found in Longhui and Dongkou, the second highest predominantly in the east of Hengyang City and the most of western Shaoyang City, and low values in the central part of Loudi City and the north-central part of Hengyang City (Figure 11a). The frequency of summer drought ranged from 23.33% to 36.74%, with most stations having a frequency of above 30%: high values were detected to be scattered in Lengshuijiang, Nanyue, Hengyang, Leiyang, Shuangfeng, Xinhua, Dongkou, Xining, and Lengshuitan, while low values were found in the southwest of Shaoyang City (Figure 11b). The frequency of autumn drought was between 26.67% and 36.66%, with most stations having a frequency of above 30%. Its distribution roughly followed the pattern of “high in the four corners and low in the middle”: the highest value of frequency was found in southern Hengyang City as well as some parts of its northern area, the second highest was chiefly scattered in Dongan, Dongkou, Wugang, Suining, Loudi, and Lengshuitan, and the relatively low was detected in eastern Shaoyang City, southeastern Loudi City, and west-central Hengyang City (Figure 11c). The frequency of winter drought ranged from 25% to 38.33%, with the overwhelming majority of stations having a frequency of above 30%: the high values were scattered in Dongkou, Qidong, Suining, Xinshao, Lengshuijiang, and Lianyuan, among which Dongkou was the highest; in contrast, the low values were found in southeastern Shaoyang City and a small part of northern Yongzhou City (Figure 11d).

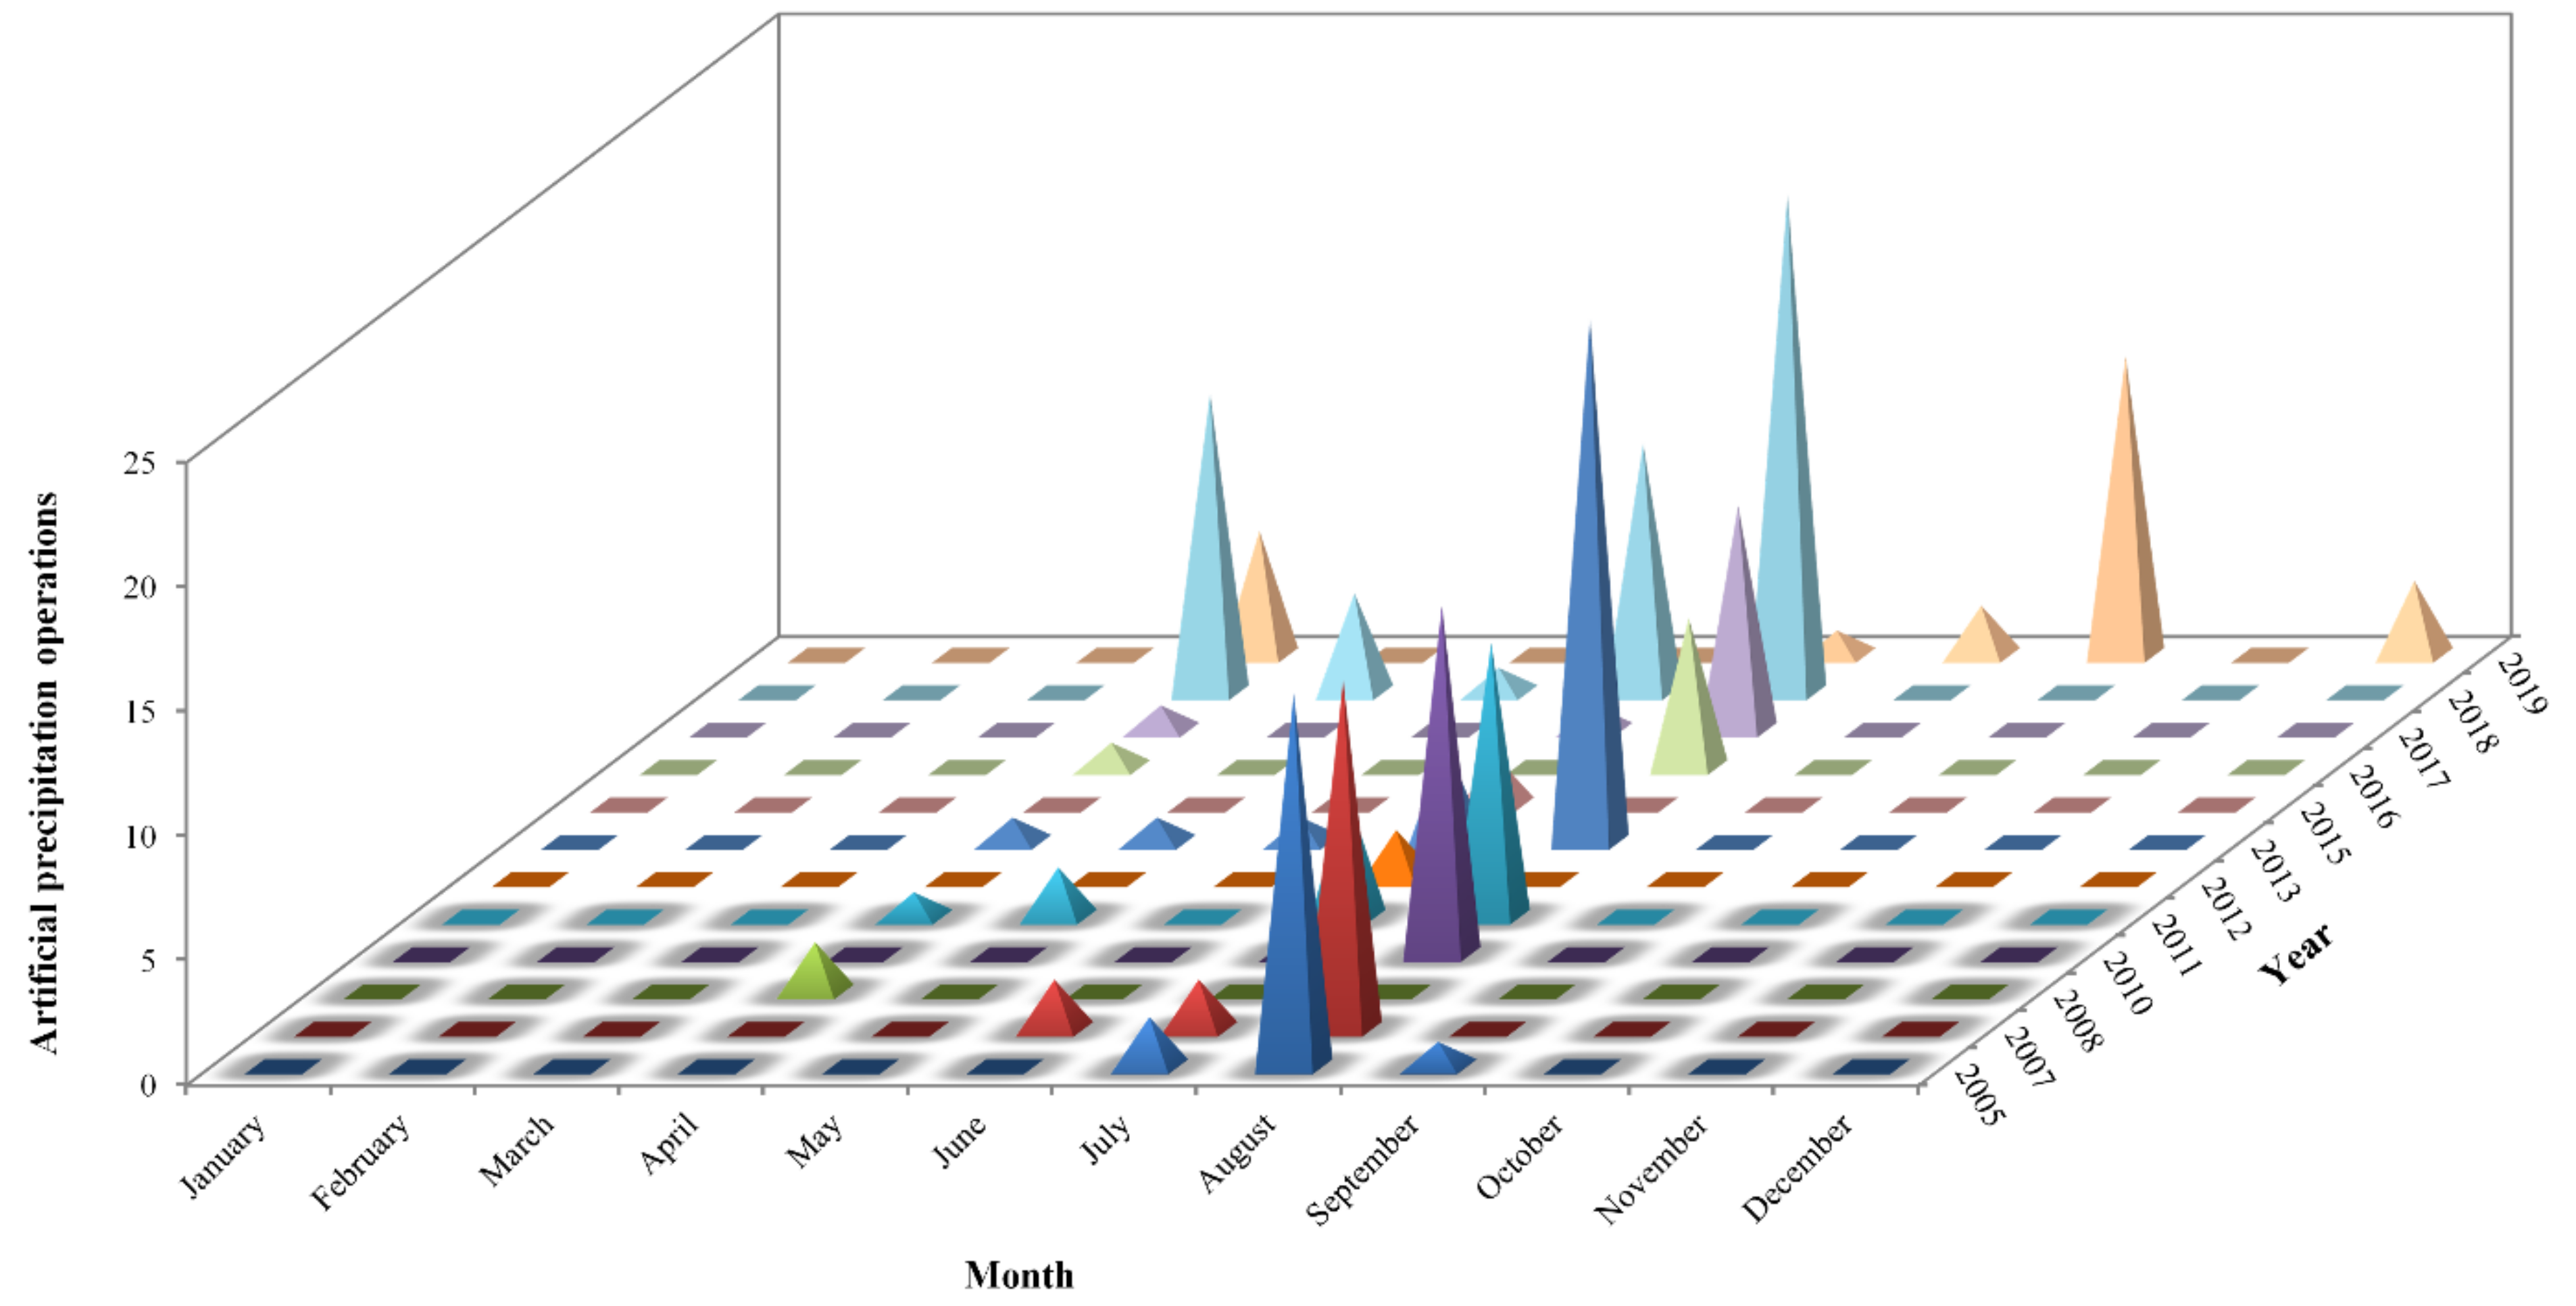
3.3. Mitigation Effects of Artificial Precipitation on Droughts

Figure 12 shows that from 2005 to 2019, artificial precipitation enhancement operations were executed in a total of 34 months in the study area, where 22 months (i.e., effective months) saw effective reduction of drought severity, accounting for 64.71% of the total. Such operations were performed most frequently in Augusts (88.89% of effective months), and second most frequently in Julys (75% of effective months). Despite the relatively great number of operations in Aprils, only 3 years had their drought conditions partially relieved. Additionally, it is kind of impossible to assess the effectiveness of the operations done in other months, due to its small number. One perfect example in this case is the operation of August 2005, which mitigated the drought so remarkably that drought severity declined in nearly half of the study area: moderate drought events in most stations were reduced to mild ones after the operation. Another good example is the operation of April 2018, which reduced the severity of drought in 36.64% of the study area: extreme drought events in some stations were reduced to severe ones after the operation.
Seasonal precipitation enhancement operations were calculated on the basis of the operations at the monthly scale. In the recent 15 years, artificial precipitation operations were executed in a total of 24 seasons in the study area, where 11 seasons (i.e., effective seasons) saw effective reduction of drought severity, accounting for 52.38% of the total. Such operations were performed most frequently in summers (63.64% of effective seasons), and second most frequently in springs with a low percentage (18.18%) of effective seasons. Additionally, it is kind of impossible to assess the effectiveness of the operations done in autumns (2 operations) and winters (only 1 operation), due to the tiny number of operations. One perfect example is the operation done in the summer of 2018. That operation mitigated the severe and extreme drought covering 17.91% of the study area so remarkably that drought severity reduced to mild or even zero in 75.37% of the study area where rainfall enhancement operation was performed. Two other examples include those done in the summer of 2011 and the spring of 2018, which both brought the drought severity level down a notch in the relevant stations.
According to statistics, Lengshuitan received the greatest number (15) of artificial precipitation enhancement operations, which brought the moderate drought in August 2005 and the mild one in August 2007 down to “no drought”, the severe drought in August 2010 and moderate one in July 2012 to mild drought, moderate drought in the summer of 2007 and 2010 to mild one, and moderate drought in the summer of 2016 to “no drought”. Qiyang received the second greatest number (13) of operations, which brought the severe droughts in August 2007, 2010 and 2011 down to “no drought”, the extreme droughts in July 2013 and April 2018 down to severe ones, the mild drought in August 2017 to “no drought”, the moderate drought in the summer of 2007 to “no drought”, the mild droughts in the summer of 2010 and spring of 2018 to “no drought”, the moderate drought in the summer of 2011 to mild one, the severe drought in the autumn of 2019 to moderate one. Next, Hengnan received 12 operations, which brought the moderate droughts in July 2007 and 2012 down to mild drought and “no drought”, respectively, and also the mild drought in August 2010 down to “no drought”, the extreme droughts in May and August of 2011 to moderate one and “no drought” respectively, the severe drought in August 2017 to moderate one, the extreme drought in July 2018 and the mild one in August of the same year to “no drought”, and the extreme droughts in the summer of 2011 and 2018 down to moderate ones. Third, Shaoyang County received 11 operations, which brought the extreme drought in August 2010 down to “no drought”, the extreme drought in May 2011 to moderate one, the moderate drought in August 2011 to “no drought”, the extreme drought in June 2013 down to severe one, the moderate drought in August 2017 to “no drought”, the extreme droughts in April and August of 2018 to severe drought and “no drought” respectively, the moderate drought in the summer of 2010 down to “no drought”, the severe one in the summer of 2011 to moderate, the extreme droughts in the spring of 2011 and summer of 2013 to severe ones, and the severe drought in the spring of 2018 and the extreme drought in the summer of the same year to mild and moderate droughts, respectively. Fourth, Dongan received ten operations, which brought the moderate drought in August 2005 down to “no drought”, the severe droughts in August 2007 and July–August of 2011 to “no drought”, the extreme drought in April 2018 to severe, the extreme drought in the summer of 2007 to moderate one, and the mild drought in the summer of 2011 to “no drought”. In other stations of the study area, the local drought was eased to a certain extent by operations, despite of their relatively small number. In addition, artificial rainfall operations were performed continuously in the summer of 2018 in Xinshao, in spite of the absence of distinct drought. These operations helped improve grain yield, as they were carried out in the early growth stage of late rice which requires a lot of water.
In order to reveal how artificial precipitation can effectively alleviate drought, a comparison was made between the drought severity in the study area before and after artificial rainfall operations in August 2005. According to Figure 13a, before artificial precipitation enhancement, only Hengnan and Hengshan stations had no drought, accounting for the least part (7.14%) of the whole study area; in contrast, the stations with moderate dry conditions comprised the largest part (46.43%) of the study area, those with mild drought accounted for 17.86%, and those with severe and extreme droughts made up 28.57% together. In line with Figure 13b, after artificial precipitation enhancement, the percentage of stations with no drought and mild drought soared, while that of moderate and extreme drought slumped. Noticeably, five stations including Chengbu, Lengshuitan, Lianyuan, Qidong, and Wugang had their drought severity brought down two levels (Figure 13b): the extreme droughts in Chengbu and Wugang were brought down to moderate ones, the severe drought in Qidong was brought down to mild one, and the moderate droughts in Lengshuitan and Lianyuan were brought down to “no drought”. In addition, eight stations including Dongan, Hengdong, Hengyang, Leiyang, Lengshuijiang, Nanyue, Xinhua, Xinshao had their drought severity brought down one notch: the extreme drought in Xinhua was reduced to severe drought, the severe drought in Xinshao to moderate one, and the moderate droughts in the other six stations to mild ones. All these demonstrate that drought severity in the study area has been greatly eased by artificial precipitation.

4. Discussion and Future Perspectives

Despite of being located in a subtropical humid zone, HSDR is one of the relatively arid areas in HP, which was caused by a combination of factors such as topography, subtropical high, and local economic development. This feature has been confirmed by numerous studies [36,37,38,50]. In the study area, winter drought occurred most frequently, while spring drought events happened least frequently, which was probably because precipitation in the region mainly occurred in the period from April to June [39]. In 2003, 2007, 2009, 2011, 2013, and 2018, droughts occurred throughout the study area. The events of moderate or more severe drought in 2003, 2011, and 2013 were basically consistent with the research results of Gu and Liu [51]. Furthermore, the drought events in the study area in 2017 and 2018 also complied with the prediction of Gu and Liu [51] on the agricultural drought years (2017 and 2018) of HP. Last, the study area received the greatest number of artificial precipitation enhancement operations in 2013 and 2018, which partially indicated that the drought was relatively serious in these years.
Spring and summer are critical seasons for crop growth in the study area—HSDR, which belongs to a double-cropping rice area in central China, and also an important grain-producing area in HP. However, under the influence of topographic factors, it is difficult for monsoon moist airflow to enter the basins, leading to little precipitation in the busy farming season for rush-planting and rush-harvesting, especially in July and August (summer drought) [39], which is likely to cause agricultural losses. The analysis above shows that artificial rainfall operations in the study area were primarily performed in April, July and August, indicating that such operations, aligned with farming seasons, helped mitigate agricultural drought. The summer drought in the study area was relatively mild, thanks partly to the frequent rainfall enhancement operations executed in July and August. It should be noted that artificial precipitation can not only alleviate meteorological drought, but also control air pollution. For example, despite the absence of obvious drought in 2019, artificial precipitation was applied in October and December for the first time, with the purpose of using wet scavenging effect to purify air.
SPI index was utilized to evaluate the drought in the study area, which can show drought severity in the area, but cannot directly reflect the impacts of drought on the regional ecological environment. Generally, on the one hand, precipitation is a major source of soil moisture, on the other hand, high temperature will intensify evapotranspiration [52], which will have a direct impact on vegetation growth, especially crop growth. When high temperature and low precipitation occur simultaneously in a location, the location is prone to drought, which is extremely detrimental to agricultural production. Apart from that, streamflow also significantly affects agricultural irrigation. Therefore, future studies should consider streamflow, vegetation index, evapotranspiration, temperature, and other indicators in order to further explore the characteristics of drought and evaluate its environmental effects. Last, when analyzing the effect of artificial precipitation, this study only discussed how drought severity was reduced at the stations having received artificial rainfall by subtracting the amount of artificial precipitation from the total precipitation; but it failed to evaluate the ecological and environmental effects of weather modification, which requires further exploration in the future.

5. Conclusions

A study of the spatiotemporal characteristics of drought in HSDR from 1960 to 2019 showed the severity of drought in the area. Additionally, a quantitative evaluation of the alleviating effects of artificial precipitation on drought in the area proved that weather modification was effective. These findings demonstrate that even a place situated in a humid zone, especially its agricultural production, could be affected by drought in some periods. In the recent six decades, the study area exhibited a decreasing trend in drought coverage, but a weak increasing trend in drought intensity, as well as an increasing trend in area-wide and regional droughts. Winter drought occurred most frequently in HSDR, followed by summer and autumn drought, while spring drought events happened least frequently. When seasonal drought happened, it afflicted the whole study area in most of the years, and affected a large part of the study area in the second most of years, indicating that the overall drought was serious in the area. The monthly SPI curve, which showed no obvious variation characteristics, was prone to peak in spring and reach a trough value in winter. June was vulnerable to moderate drought or drought of a higher severity, and August was vulnerable to severe and extreme drought. In the period 2015–2019, artificial precipitation enhancement operations were mainly performed in April, July, and August in the study area, which were aligned to the local farming seasons and significantly relieved the drought in the area.

Author Contributions

Conceptualization and methodology, Z.Z., J.F. and W.T.; software, W.T. and Y.L; validation, W.T., H.Z. and X.F.; formal analysis, Z.Z., J.F. and Y.L.; investigation, H.Z., Y.L. and X.F.; resources, Z.Z. and H.Z.; data curation, Z.Z. and X.F.; writing—original draft preparation, Z.Z. and J.F.; writing—review and editing, J.F.; visualization, W.T., Y.L. and J.F.; supervision, J.F. and W.T.; project administration, J.F.; funding acquisition, Z.Z. and J.F. All authors have read and agreed to the published version of the manuscript.

Funding

This research was supported by the Scientific Research Project of Hunan Meteorological Bureau, grant number XQKJ20B037; Scientific Research Fund of Hunan Provincial Education Department, grant number 19A062; Open Fund of Hunan Key Laboratory of Geospatial Big Data Mining and Application, grant number 2020-01; and Open Fund Project of HIST Hengyang Base, grant number 2021HSKFJJ028.

Data Availability Statement

The estimated SPI values are available on request from the corresponding author.

Acknowledgments

The authors would like to thank the editors and referees for their valuable comments on this article. Thanks also go to the field workers for their hard and dangerous weather modification operation.

Conflicts of Interest

The authors declare no conflict of interest.

References

  1. Guan, X.; Zang, Y.; Meng, Y.; Liu, Y.; Lv, H.; Yan, D. Study on spatiotemporal distribution characteristics of flood and drought disaster impacts on agriculture in China. Int. J. Disaster Risk Reduct. 2021, 64, 102504. [Google Scholar] [CrossRef]
  2. Gu, L.; Chen, J.; Yin, J.; Xu, C.Y.; Zhou, J. Responses of precipitation and runoff to climate warming and Implications for future drought changes in China. Earths Future 2020, 8, e2020EF001718. [Google Scholar] [CrossRef]
  3. Pascolini-Campbell, M.; Reager, J.T.; Chandanpurkar, H.A.; Rodell, M. A 10 per cent increase in global land evapotranspiration from 2003 to 2019. Nature 2021, 593, 543–547. [Google Scholar] [CrossRef] [PubMed]
  4. Lesk, C.; Rowhani, P.; Ramankutty, N. Influence of extreme weather disasters on global crop production. Nature 2016, 529, 84–87. [Google Scholar] [CrossRef]
  5. Wang, K.; Li, T.; Wei, J. Exploring drought conditions in the Three River Headwaters Region from 2002 to 2011 using multiple drought indices. Water 2019, 11, 190. [Google Scholar] [CrossRef]
  6. Naumann, G.; Alfieri, L.; Wyser, K.; Mentaschi, L.; Betts, R.A.; Carrao, H.; Spinoni, J.; Vogt, J.; Feyen, L. Global changes in drought conditions under different levels of warming. Geophys. Res. Lett. 2018, 45, 3285–3296. [Google Scholar] [CrossRef]
  7. Khan, R.; Gilani, H. Global drought monitoring with drought severity index (DSI) using Google Earth Engine. Theor. Appl. Climatol. 2021, 146, 411–427. [Google Scholar] [CrossRef]
  8. IPCC. Managing the Risks of Extreme Events and Disasters to Advance Climate Change Adaptation: Special Report of the Intergovernmental Panel on Climate Change; Cambridge University Press: Cambridge, UK; New York, NY, USA, 2013; p. 582. [Google Scholar]
  9. UNCCD. Land and Drought. Available online: https://www.unccd.int/issues/land-and-drought (accessed on 18 October 2018).
  10. Parsons, L.A. Implications of CMIP6 projected drying trends for 21st century amazonian drought risk. Earths Future 2020, 8, e2020EF001608. [Google Scholar] [CrossRef]
  11. Kim, D.; Ha, K.J.; Yeo, J.H. New drought projections over East Asia using evapotranspiration deficits from the CMIP6 warming scenarios. Earths Future 2021, 9, e2020EF001697. [Google Scholar] [CrossRef]
  12. Cao, S.; Zhang, L.; He, Y.; Zhang, Y.; Chen, Y.; Yao, S.; Yang, W.; Sun, Q. Effects and contributions of meteorological drought on agricultural drought under different climatic zones and vegetation types in Northwest China. Sci. Total Environ. 2022, 821, 153270. [Google Scholar] [CrossRef]
  13. Hao, Z.; Hao, F.; Singh, V.P.; Zhang, X. Quantifying the relationship between compound dry and hot events and El Niño-Southern Oscillation (ENSO) at the global scale. J. Hydrol. 2018, 567, 332–338. [Google Scholar] [CrossRef]
  14. Sattar, M.N.; Lee, J.Y.; Shin, J.Y.; Kim, T.W. Probabilistic characteristics of drought propagation from meteorological to hydrological drought in South Korea. Water Resour. Manag. 2019, 33, 2439–2452. [Google Scholar] [CrossRef]
  15. Su, B.; Huang, J.; Fischer, T.; Wang, Y.; Kundzewicz, Z.W.; Zhai, J.; Sun, H.; Wang, A.; Zeng, X.; Wang, G.; et al. Drought losses in China might double between the 1.5 °C and 2.0 °C warming. Proc. Natl. Acad. Sci. USA 2018, 115, 10600–10605. [Google Scholar] [CrossRef]
  16. Yu, C.; Huang, X.; Chen, H.; Huang, G.; Ni, S.; Wright, J.S.; Hall, J.; Ciais, P.; Zhang, J.; Xiao, Y.; et al. Assessing the impacts of extreme agricultural droughts in China under climate and socioeconomic changes. Earths Future 2018, 6, 689–703. [Google Scholar] [CrossRef]
  17. Haslinger, K.; Koffler, D.; Schöner, W.; Laaha, G. Exploring the link between meteorological drought and streamflow: Effects of climate-catchment interaction. Water Resour. Res. 2014, 50, 2468–2487. [Google Scholar] [CrossRef]
  18. Aghelpour, P.; Guan, Y.; Bahrami-Pichaghchi, H.; Mohammadi, B.; Kisi, O.; Zhang, D. Using the MODIS sensor for snow cover modeling and the assessment of drought effects on snow cover in a mountainous area. Remote Sens. 2020, 12, 3437. [Google Scholar] [CrossRef]
  19. Kobrossi, J.; Karam, F.; Mitri, G. Rain pattern analysis using the Standardized Precipitation Index for long-term drought characterization in Lebanon. Arab. J. Geosci. 2021, 14, 44. [Google Scholar] [CrossRef]
  20. Musonda, B.; Jing, Y.; Iyakaremye, V.; Ojara, M. Analysis of long-term variations of drought characteristics using standardized precipitation index over Zambia. Atmosphere 2020, 11, 1268. [Google Scholar] [CrossRef]
  21. Zhou, H.; Zhou, W.; Liu, Y.; Yuan, Y.; Huang, J.; Liu, Y. Identifying spatial extent of meteorological droughts: An examination over a humid region. J. Hydrol. 2020, 591, 125505. [Google Scholar] [CrossRef]
  22. Yao, N.; Li, Y.; Dong, Q.G.; Li, L.; Peng, L.; Feng, H. Influence of the accuracy of reference crop evapotranspiration on drought monitoring using standardized precipitation evapotranspiration index in mainland China. Land Degrad. Dev. 2019, 31, 266–282. [Google Scholar] [CrossRef]
  23. Yang, M.; Xiao, W.; Zhao, Y.; Li, X.; Lu, F.; Lu, C.; Chen, Y. Assessing agricultural drought in the Anthropocene: A modified palmer drought severity index. Water 2017, 9, 725. [Google Scholar] [CrossRef]
  24. Adnan, S.; Ullah, K.; Shuanglin, L.; Gao, S.; Khan, A.H.; Mahmood, R. Comparison of various drought indices to monitor drought status in Pakistan. Clim. Dyn. 2018, 51, 1885–1899. [Google Scholar] [CrossRef]
  25. Haile, G.G.; Tang, Q.; Hosseini-Moghari, S.M.; Liu, X.; Gebremicael, T.G.; Leng, G.; Kebede, A.; Xu, X.; Yun, X. Projected impacts of climate change on drought patterns over East Africa. Earths Future 2020, 8, e2020EF001502. [Google Scholar] [CrossRef]
  26. Spinoni, J.; Naumann, G.; Carrao, H.; Barbosa, P.; Vogt, J. World drought frequency, duration, and severity for 1951–2010. Int. J. Climatol. 2014, 34, 2792–2804. [Google Scholar] [CrossRef]
  27. Tao, R.; Zhang, K. PDSI-based analysis of characteristics and spatiotemporal changes of meteorological drought in China from 1982 to 2015. Water Resour. Prot. 2020, 36, 50–56. [Google Scholar] [CrossRef]
  28. Duan, R.; Huang, G.; Zhou, X.; Li, Y.; Tian, C. Ensemble drought exposure projection for multifactorial interactive effects of climate change and population dynamics: Application to the Pearl River Basin. Earths Future 2021, 9, e2021EF002215. [Google Scholar] [CrossRef]
  29. Che, Y.; Guan, X.; Wang, S.; Wu, R. Spatial analysis of annual precipitation lines of 800 mm in the Eastern Monsoon of China. Plateau Meteorol. 2020, 39, 997–1006. [Google Scholar] [CrossRef]
  30. Gao, Y.; Xu, J.; Zhang, M.; Jiang, F. Advances of the 400 mm isohyet and wetness and dryness changes in the mainland of China. Adv. Earth Sci. 2020, 35, 1101–1112. [Google Scholar] [CrossRef]
  31. Ni, S.; Gu, Y.; Peng, Y.; Liu, J.; Wang, H. Spatio-temporal pattern and evolution trend of drought disaster in China in recent seventy years. J. Nat. Disasters 2019, 28, 176–181. [Google Scholar] [CrossRef]
  32. Zhao, H.; Zhang, W.; Zou, X.; Zhang, Q.; Shen, Z.; Mei, P. Temporal and spatial characteristics of drought in China under climate change. Chin. J. Agrometeorol. 2021, 42, 69–79. [Google Scholar] [CrossRef]
  33. Ye, T.; Yu, J.; Ye, M.; Xie, J. Analysis of the characteristics of regional flash drought in China. J. Meteorol. Sci. 2021, 41, 295–303. [Google Scholar] [CrossRef]
  34. Dominguez, F.; Villegas, J.C.; Breshears, D.D. Spatial extent of the North American Monsoon: Increased cross-regional linkages via atmospheric pathways. Geophys. Res. Lett. 2009, 36, L07401. [Google Scholar] [CrossRef]
  35. Apurv, T.; Cai, X. Impact of droughts on water supply in U.S. watersheds: The role of renewable surface and groundwater resources. Earths Future 2020, 8, e2020EF001648. [Google Scholar] [CrossRef]
  36. Li, Z.; Zhou, S.; Fan, Z.; Xu, J.; Lan, M.; Jiang, Y. Analysis of temporal and spatial variation of extreme drought in Hunan Province. J. Arid. Meteorol. 2018, 36, 578–582. [Google Scholar] [CrossRef]
  37. Zhang, J.; Liao, Y.; Peng, J.; Zhou, J.; Tan, X. Spatial and temporal variation of meteorological drought days in Hunan Province. Chin. J. Agrometeorol. 2013, 34, 621–628. [Google Scholar] [CrossRef]
  38. Zhang, C.; Luo, B. Spatio-temporal characteristics of persistent regional meteorological drought in Summer and Autumn in Hunan. J. Arid. Meteorol. 2021, 39, 193–202. [Google Scholar] [CrossRef]
  39. Fu, J.; Qin, J.; Li, Z.; Zhang, Z. Spatial-temporal distribution pattern and trend analysis of rainfalls in the ‘Heng Shao drought corridor’. Acta Sci. Circumstantiae 2017, 37, 3097–3106. [Google Scholar] [CrossRef]
  40. Sandhyavitri, A.; Perdana, M.A.; Sutikno, S.; Widodo, F.H. The roles of weather modification technology in mitigation of the peat fires during a period of dry season in Bengkalis, Indonesia. IOP Conf. Ser. Mater. Sci. Eng. 2018, 309, 012016. [Google Scholar] [CrossRef]
  41. Cheng, P.; Chen, Q.; Jiang, Y.; Li, B.; Luo, H. Effect evaluation of artificial rainfall enhancement in the Shiyang River Basin of Hexi Corridor in the latest 10 years. Plateau Meteorol. 2021, 40, 866–874. [Google Scholar] [CrossRef]
  42. Gidey, E.; Dikinya, O.; Sebego, R.; Segosebe, E.; Zenebe, A. Modeling the spatio-temporal meteorological drought characteristics using the standardized precipitation index (SPI) in Raya and its Environs, Northern Ethiopia. Earth Syst. Environ. 2018, 2, 281–292. [Google Scholar] [CrossRef]
  43. Naresh Kumar, M.; Murthy, C.S.; Sesha Sai, M.V.R.; Roy, P.S. On the use of Standardized Precipitation Index (SPI) for drought intensity assessment. Meteorol. Appl. 2009, 16, 381–389. [Google Scholar] [CrossRef]
  44. Asadi Zarch, M.A.; Sivakumar, B.; Sharma, A. Droughts in a warming climate: A global assessment of Standardized precipitation index (SPI) and Reconnaissance drought index (RDI). J. Hydrol. 2015, 526, 183–195. [Google Scholar] [CrossRef]
  45. Wambua, R.M.; Mutua, B.M.; Raude, J.M. Detection of spatial, temporal and trend of meteorological drought using standardized precipitation index (SPI) and effective drought index (EDI) in the upper Tana river basin, Kenya. Open J. Mod. Hydrol. 2018, 8, 83–100. [Google Scholar] [CrossRef]
  46. Pramudya, Y.; Onishi, T. Assessment of the standardized precipitation index (SPI) in Tegal City, Central Java, Indonesia. In IOP Conference Series: Earth and Environmental Science; IOP Publishing: Surakarta, Indonesia, 2018; Volume 129, p. 012019. [Google Scholar]
  47. Azimi, S.; Azhdary Moghaddam, M. Modeling short term rainfall forecast using neural networks, and Gaussian process classification based on the SPI drought index. Water Resour. Manag. 2020, 34, 1369–1405. [Google Scholar] [CrossRef]
  48. McKee, T.B.; Doesken, N.D.; Kleist, J. The relationship of drought frequency and duration of time scales. In Eighth Conference on Applied Climatology; American Meteorological Society: Anaheim, CA, USA, 1993; pp. 179–186. [Google Scholar]
  49. Guo, W.; Li, Y.; Du, L. Characteristic of spring and summer drought variations and its relation with maize yield in Shanxi Province in 1972–2012 based on SPI. Agric. Res. Arid. Areas 2018, 36, 230–236. [Google Scholar] [CrossRef]
  50. Fu, J.; Kuang, W.; Deng, Y.; Tian, Y.; Zhao, S. Trend of precipitation variations and their spatial patterns in Hunan Province over 56 years (1960–2015). J. Southwest Univ. 2021, 43, 110–119. [Google Scholar] [CrossRef]
  51. Gu, H.; Liu, Z. Time regularity analysis and trend prediction of agricultural drought disaster in Hunan Province. J. Hunan Univ. Sci. Technol. 2016, 19, 110–116. [Google Scholar] [CrossRef]
  52. Fu, J.; Gong, Y.; Zheng, W.; Zou, J.; Zhang, M.; Zhang, Z.; Qin, J.; Liu, J.; Quan, B. Spatial-temporal variations of terrestrial evapotranspiration across China from 2000 to 2019. Sci. Total Environ. 2022, 825, 153951. [Google Scholar] [CrossRef]
Figure 1. (a) Geographical distribution of Hunan Province (HP) in China; (b) location of the Hengyang-Shaoyang Drought Corridor (HSDC) in HP, and spatial pattern of average annual precipitation in the province from 1960 to 2019; (c) digital elevation model, county-level divisions, main rivers, and meteorological stations of the HSDC; and (d) land use/land cover and locations of artificial precipitation operating spots in HSDC.
Atmosphere 13 01307 g001
Figure 2. Selected photographs of artificial precipitation enhancement. (a) Operating spot; (b) rocket equipment; and (c) rain gauges for observations.
Atmosphere 13 01307 g002
Figure 3. Temporal variation of annual SPI on a 12-month time scale in HSDC, 2000–2019.
Atmosphere 13 01307 g003
Figure 4. Drought coverage and intensity at an annual scale in HSDC, 2000–2019.
Atmosphere 13 01307 g004
Figure 5. Temporal variations of seasonal SPI on a 3-month time scale in HSDC, 2000–2019. (a) Spring; (b) summer; (c) autumn; and (d) winter.
Atmosphere 13 01307 g005
Figure 6. Seasonal drought coverage and intensity in HSDC, 2000–2019. (a) Spring; (b) summer; (c) autumn; and (d) winter.
Atmosphere 13 01307 g006
Figure 7. Temporal variation of monthly SPI on a 1-month time scale in HSDC, 2000–2019.
Atmosphere 13 01307 g007
Figure 8. Spatial patterns of SPI12 in HSDC. (a) Year with normal climate; and (b) climatic drought year.
Atmosphere 13 01307 g008
Figure 9. Spatial patterns of drought frequency at the annual scale in HSDC. (a) Frequency of all drought categories; (b) frequency of mild drought; (c) frequency of moderate drought; (d) frequency of severe drought; and (e) frequency of extreme drought.
Atmosphere 13 01307 g009
Figure 10. Spatial patterns of SPI3 in HSDC. (a) Spring; (b) summer; (c) autumn; and (d) winter.
Atmosphere 13 01307 g010
Figure 11. Spatial patterns of seasonal drought frequency in HSDC. (a) Spring drought frequency; (b) summer drought frequency; (c) autumn drought frequency; and (d) winter drought frequency.
Atmosphere 13 01307 g011
Figure 12. Statistics of artificial precipitation enhancement operations in HSDC, 2005–2019.
Atmosphere 13 01307 g012
Figure 13. Spatial patterns of SPI1 (a) before and (b) after artificial rainfall operation in HSDC in August 2005.
Atmosphere 13 01307 g013
Table 1. Frequency of drought of varying severity in HSDC at the monthly scale.
Drought CategoriesDrought Frequency (%)
JanuaryFebruaryMarchAprilMayJuneJulyAugustSeptemberOctoberNovemberDecember
Mild drought15.714.615.513.714.215.314.113.112.715.213.010.2
Moderate drought8.56.89.08.88.910.28.76.77.79.67.67.5
Severe drought3.63.73.64.74.44.74.15.25.23.32.23.3
Extreme drought2.84.22.12.72.71.72.53.32.92.94.84.7
Publisher’s Note: MDPI stays neutral with regard to jurisdictional claims in published maps and institutional affiliations.

