Article

Climatology of Different Classifications of Tropical Cyclones Landfalling in Guangdong Province of China during 1951–2020

1
College of Ocean and Meteorology, Guangdong Ocean University, Zhanjiang 524088, China
2
South China Sea Institute of Marine Meteorology (SIMM), Guangdong Ocean University, Zhanjiang 524088, China
3
CMA-GDOU Joint Laboratory for Marine Meteorology, Guangdong Ocean University, Zhanjiang 524088, China
4
Key Laboratory of Climate, Resources and Environment in Continental Shelf Sea and Deep Sea of Department of Education of Guangdong Province, Guangdong Ocean University, Zhanjiang 524088, China
5
School of Atmospheric Sciences, Nanjing University, Nanjing 210023, China
6
College of Resources and Environmental Sciences, China Agricultural University, Beijing 100193, China
*
Author to whom correspondence should be addressed.
Atmosphere 2022, 13(8), 1306; https://doi.org/10.3390/atmos13081306
Submission received: 11 July 2022 / Revised: 11 August 2022 / Accepted: 15 August 2022 / Published: 17 August 2022
(This article belongs to the Special Issue Advances in Tropical Cyclone Climate Research)

Abstract

:
The climatology of different classifications (based on the intensity at the landfall time) of tropical cyclones (TCs) making landfall in Guangdong Province of China during 1951–2020 (70 years) is investigated using the best track data from the China Meteorological Administration and ERA5 reanalysis data. There were 234 TCs making landfall in Guangdong Province, with more severe tropical storms (STSs, 30.8%) and typhoons (TYs, 27.3%), and less tropical depressions (TDs, 19.7%) and tropical storms (TSs, 22.2%) during the past 70 years. The frequency of the landfall TCs had a significant interannual oscillation of 2–5 years. Landfall TCs generated over the western North Pacific (WNP) were usually more and stronger than those generated over the South China Sea (SCS). The TCs generated over the WNP had longer lifetime duration and shorter on-land duration than those generated over the SCS. TCs making landfall in western Guangdong were the most, followed by central Guangdong and eastern Guangdong. The composite analysis using TC-relative coordinates indicated that the precipitation of different classifications of TCs making landfall in Guangdong Province was asymmetric, which was stronger in the south of the TC center. The position of the maximum precipitation showed a cyclonic rotation around the TC center with increasing TC intensity. Generally, the vertical velocity, moisture flux, warm core, and vertical wind shear enhanced with the increasing landfall TC intensity. The vertical velocity and moisture flux of different classifications of TCs also showed an asymmetric structure related to the distribution of TC precipitation. TSs, STSs, and TYs had a double warm-core configuration. The precipitation of the TDs and TSs usually occurred over the down-shear of average vertical wind shear, those of the STSs and TYs over the left-of-shear.

1. Introduction

A tropical cyclone (TC) with severe wind and strong precipitation usually causes serious loss of life and property in many tropical and subtropical countries [1,2,3]. The socioeconomic losses induced by TCs have increased over the last few decades because of climate change, growing population, and urbanization [4,5]. Especially, the landfall TCs are even more disastrous owing to their power dissipations impacting coastal regions [6]. The relationships between the environmental parameters [including the 500-hPa geopotential height, vertical wind shear, sea surface temperature (SST), etc.] and TC activities have been established by observational, theoretical, and modeling studies [7,8]. TC internal dynamics are key factors controlling TC intensity [9,10]. The warm core is one of the most important features of the TC inner core structure. Generally, the TC warm core is stronger when the TC intensity is stronger. TC intensity is sensitive to the height and strength of the warm core [11]. The observational [12] and theoretical studies [13] have shown that the warm core in the upper troposphere has an important effect on TC intensity.
It is well known that the western North Pacific (WNP) is the most active TC basin, occupying about one-third of the global TC genesis [14]. Located next to the WNP and South China Sea (SCS), China has been affected adversely by TCs. Several studies focus on the effect of climate change on TC activities in the WNP [15,16,17]. The influence of TC activities on the WNP has increased in recent decades, specifically in China [18]. Wang and Ren [19] revealed that the features of climate change concerned the frequency and intensity of TCs influencing China. On average, there are about seven TCs making landfall in China every year [2]. Wang et al. [7] found a decreasing trend of TCs making landfall in China for the period 1951 to 2004, while some studies showed that the frequency of strong TCs making landfall in China had increased significantly [5,20,21].
Guangdong Province is located in the south of the Chinese mainland and adjacent to the SCS. It is one of the most economically developed provinces in China. There are 127 million people living here, and it has a subtropical monsoon climate. TCs are the most important natural disasters in Guangdong Province; therefore, a comprehensive risk assessment of TC activities is essential to reduce the potential losses caused by TC hazards [22]. Research shows that Guangdong Province witnesses the most landfall TCs in China (more than one-third of TCs making landfall in China [23]). With rapid population growth and urbanization, socioeconomic losses from TC activities have increased significantly [24]. On average, about 5.3 typhoons directly affect Guangdong every year, and the frequency of typhoons making landfall in Guangdong Province also shows an obvious interannual variation [25].
Wen et al. [26] used high-resolution TRMM (Tropical Rainfall Measuring Mission) satellite rainfall data to analyze the distribution characteristics of TC rainfall in Guangdong Province from 1998 to 2015. Their results pointed out that TC rainfall is primarily concentrated in the southwest quadrant of the landfall TCs, and the rainfall maximum is also concentrated on the southwest side of the TC center. These characteristics are mainly obvious in those TCs making landfall in western and central Guangdong, while the rainfall maximum of TCs making landfall in eastern Guangdong is mainly concentrated on the east side of the TC. The main reason for this asymmetric distribution is the effect of vertical wind shear, while the effect of TC motion on the rainfall asymmetric distribution is relatively small, which is consistent with previous studies [27,28]. There is also another study focused on the features of TCs that made landfall in the Guangdong–Hong Kong–Macao Greater Bay Area from 1981 to 2018. The results show that both the frequency and intensity of landfall TCs have an apparent interdecadal change [29].
Although the overall characteristics of TCs making landfall in Guangdong Province have been investigated by some studies [26,30], the features of different classifications of landfall TCs have not been investigated systematically. Therefore, the purpose of this study is to examine the climatology of different classifications of TCs making landfall in Guangdong Province during the period 1951–2020. The paper is organized as follows: Section 2 introduces the data and methods. The statistical characteristics are presented in Section 3. Section 4 analyzes the composite structure of different classifications of TCs. The conclusions and discussion are given in Section 5.

2. Data and Methods

2.1. Data

The TC best track data, including the maximum sustained 10 m wind speed and location information with a 6 h interval during 1951–2020 were obtained from the China Meteorological Administration (CMA) at the address http://tcdata.typhoon.org.cn, accessed on 11 July 2022 [31,32].
The hourly ERA5 reanalysis data were provided by the European Centre for Medium-Range Weather Forecasts (ECMWF), including the geopotential height, horizontal wind, vertical velocity, air temperature, relative humidity, SLP (sea level pressure), and SST, which were produced using the 4D-Var data assimilation in CY41R2 of ECMWF’s Integrated Forecast System (IFS) [33]. The ERA5 reanalysis data from 1951 to 2020 were downloaded with 0.25° × 0.25° horizontal resolution and utilized to examine the structures of TCs making landfall in Guangdong Province.

2.2. Methods

Based on the criterion from the CMA, TCs are classified as a tropical depression (TD, 10.8−17.1 m·s−1), a tropical storm (TS, 17.2–24.4 m·s−1), a severe tropical storm (STS, 24.5–32.6 m·s−1), a typhoon (TY, 32.7–41.4 m·s−1), a strong typhoon (41.5–50.9 m·s−1), and a super typhoon (≧51.0 m·s−1). The classifications of TCs in this study are the landfall intensity, not the maximum intensity during the lifetime of the TCs. Because the frequencies of strong typhoons and super typhoons making landfall in Guangdong Province are very small, those TCs are regarded as the TY category in this study.
The composite analysis using TC-relative coordinates was employed to investigate the structures for different classifications of TCs making landfall in Guangdong Province during 1951–2020 to reveal their characteristics and differences. The analysis domain is a finite area within 5° longitude and 5° latitude (41 × 41 grid points in ERA5 data), and the grid point numbered as (21, 21) is always placed at the TC center. The moment of TCs making landfall in Guangdong Province is taken into the composite analysis. Thus, the variables for the grid points at the same latitude–longitude position relative to the TC center and at the landfall moment are averaged to make composite fields at each level.

3. Statistical Characteristics

3.1. The Average State of TCs Making Landfall in Guangdong Province

The overall statistical characteristics of different classifications of TCs making landfall in Guangdong Province during 1951–2020 are shown in Table 1. There were 234 TCs making landfall in Guangdong Province during 1951–2020 (70 years), including 46 TDs (19.7%), 52 TSs (22.2%), 72 STSs (30.8%), and 64 TYs (27.3%, including 8 strong TYs and 2 Super TYs). The proportion of STSs and TYs was more than that of TDs and TSs, suggesting that the intensity of TCs making landfall in Guangdong Province was usually strong. The average landfall intensity and maximum lifetime intensity for total TCs were 22 m·s−1 and 35 m·s−1, respectively. The average lifetime duration and on-land duration for total TCs were about 7.1 days and 1.2 days, respectively. The average landfall intensity, maximum lifetime intensity, and lifetime duration for different classifications generally increased with the increasing landfall TC intensity.

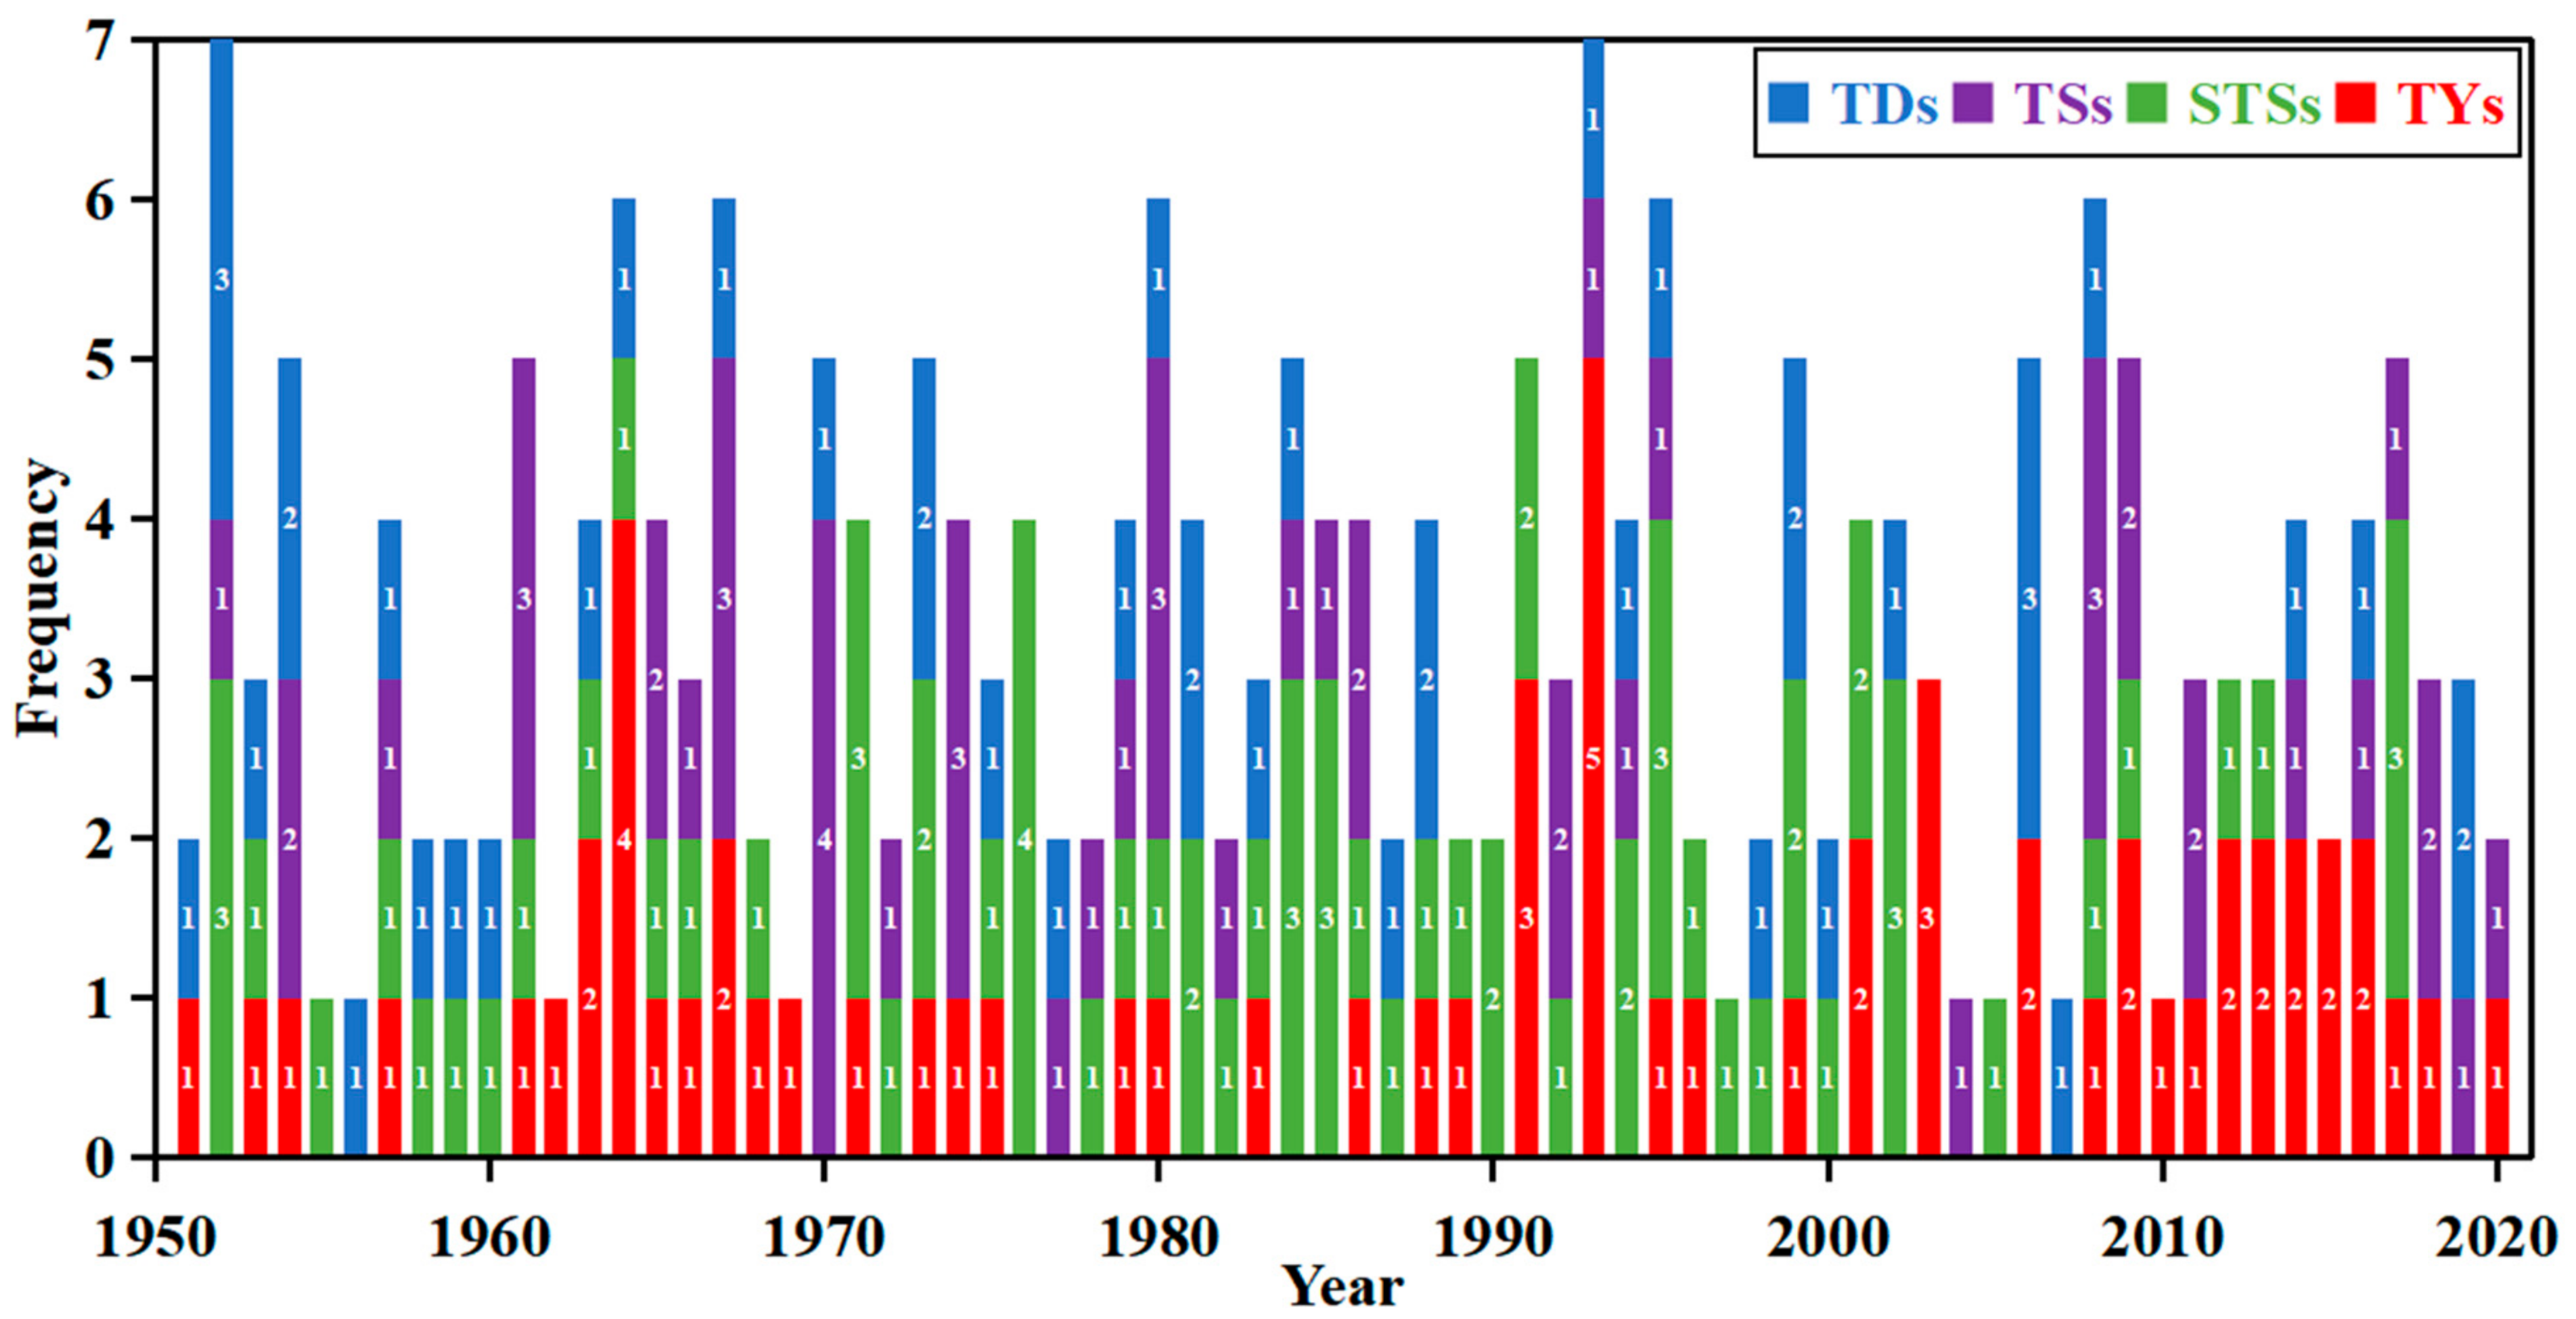
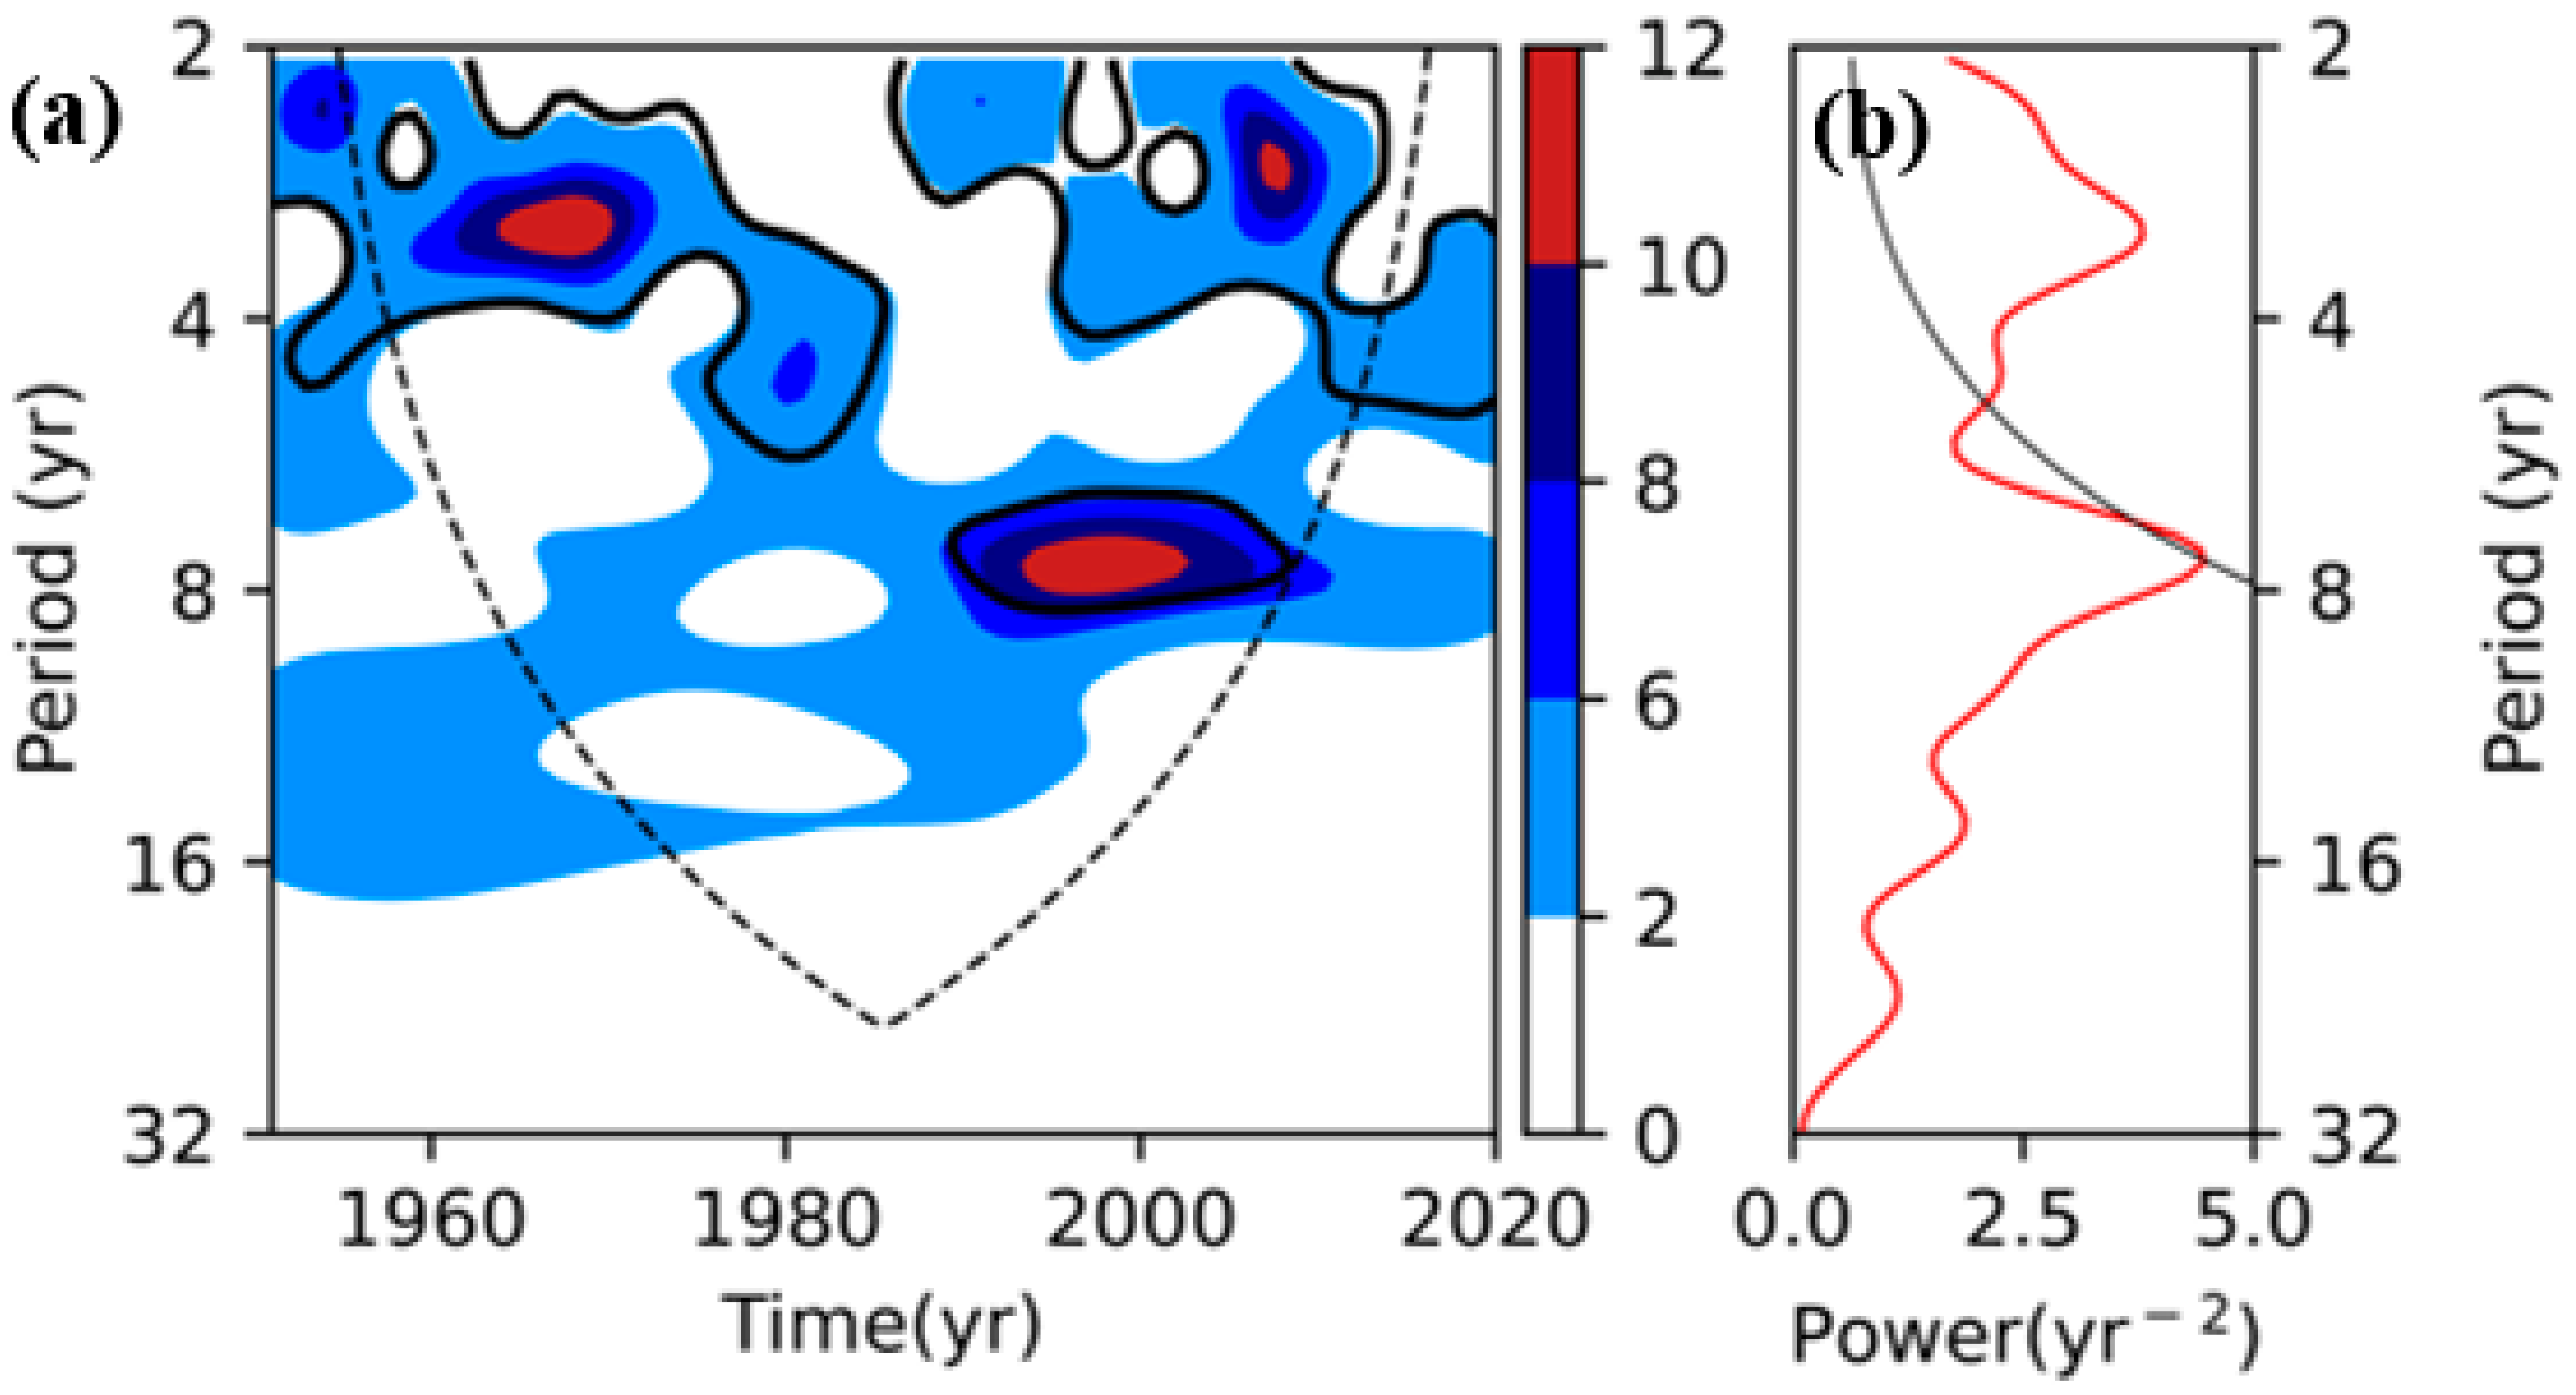
3.2. Time Series of the Annual Frequency

The maximum and minimum of the annual frequency of total TCs were seven and one, respectively (Figure 1). The average was 3.3 with a standard deviation of 1.6. The maximum annual frequencies of TDs, TSs, STSs, and TYs were 3, 4, 4, and 5, respectively, and the minimum was all 0. The results indicated that the frequency of TCs making landfall in Guangdong Province during 1951–2020 had obvious annual variation. The Morlet wavelet energy spectrum can be used to find out the significant oscillations of the frequencies of TCs [34,35,36,37], and the results indicated that the landfall TCs had two significant interannual oscillations (Figure 2a), among which the 2–5 year oscillation occurred in 1953–1972 and 1990–2011 and the 6–8 year oscillation was only significant during 1992–2012. If we focus on the average of the wavelet spectrum over the whole study period (Figure 2b), it was found that only the interannual oscillation at 2–5 years was significant, while the significance of the 6–8 years was not obvious. El Niño–Southern Oscillation (ENSO) is one of the most important factors that modulates the interannual variability of TC activity [38,39,40,41]. The annual oscillation of TCs making landfall in Guangdong Province had a prominent ENSO scale cycle (2–5 years). Probably, ENSO played an important role in controlling the annual frequency of TCs making landfall in Guangdong Province.

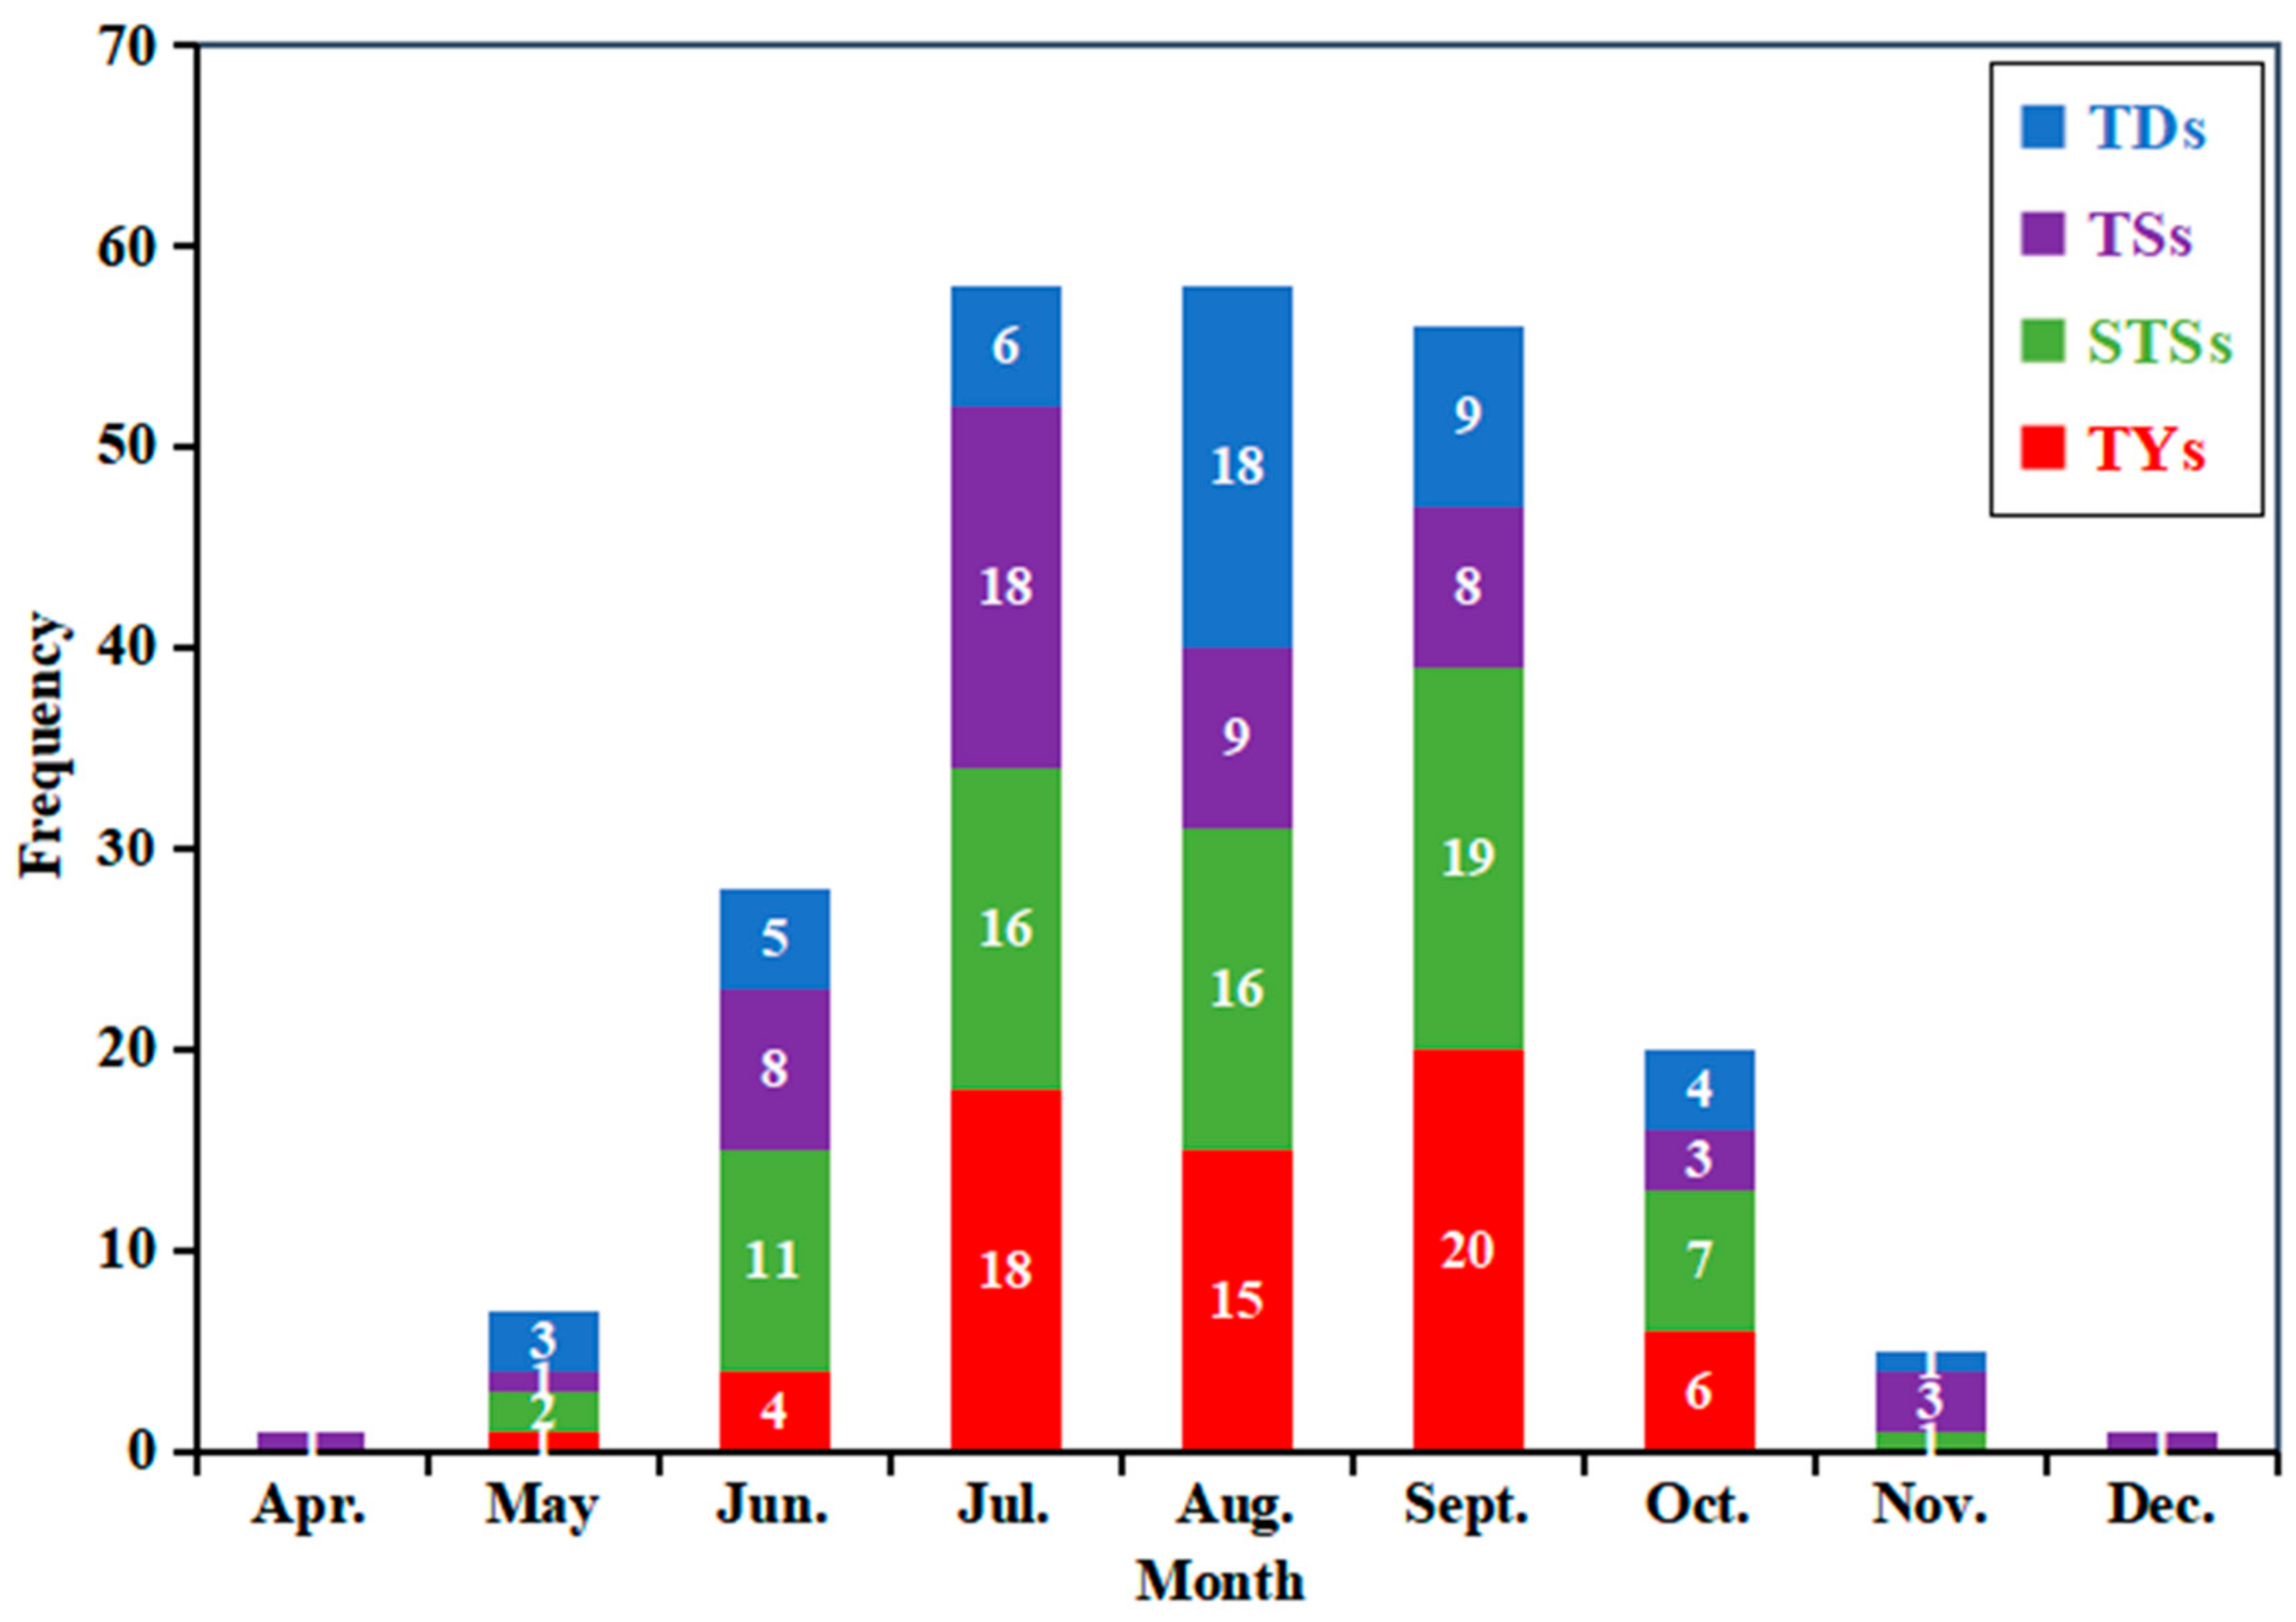
3.3. Seasonal Distribution

Figure 3 displays the monthly frequency of TCs making landfall in Guangdong Province, and the seasonal variation is obvious. There were 144 TCs (61.5%) occurring in summer (June–August) and 86 TCs (36.7%) in autumn (September–November). There were only eight TCs in spring (April and May, 3.4%) and one TC in winter (December, 0.4%). The monthly frequency of total TCs jumped from May to July and decreased sharply from September to October. Total TCs occurred most frequently in July, August, and September (58, 58, and 56, respectively), followed by June and October (28 and 20, respectively), but there were less TCs in April, May, November, and December. The intense TCs with severe damage were mainly concentrated from July to September with 51 STSs (70.8%) and 53 TYs (82.8%). Among July, August, and September, the proportion of STSs and TYs making landfall in Guangdong Province were the highest in September, followed by July and August, and five among eight super TYs occurred in September, which indicated that TCs making landfall in Guangdong Province were usually stronger in September.

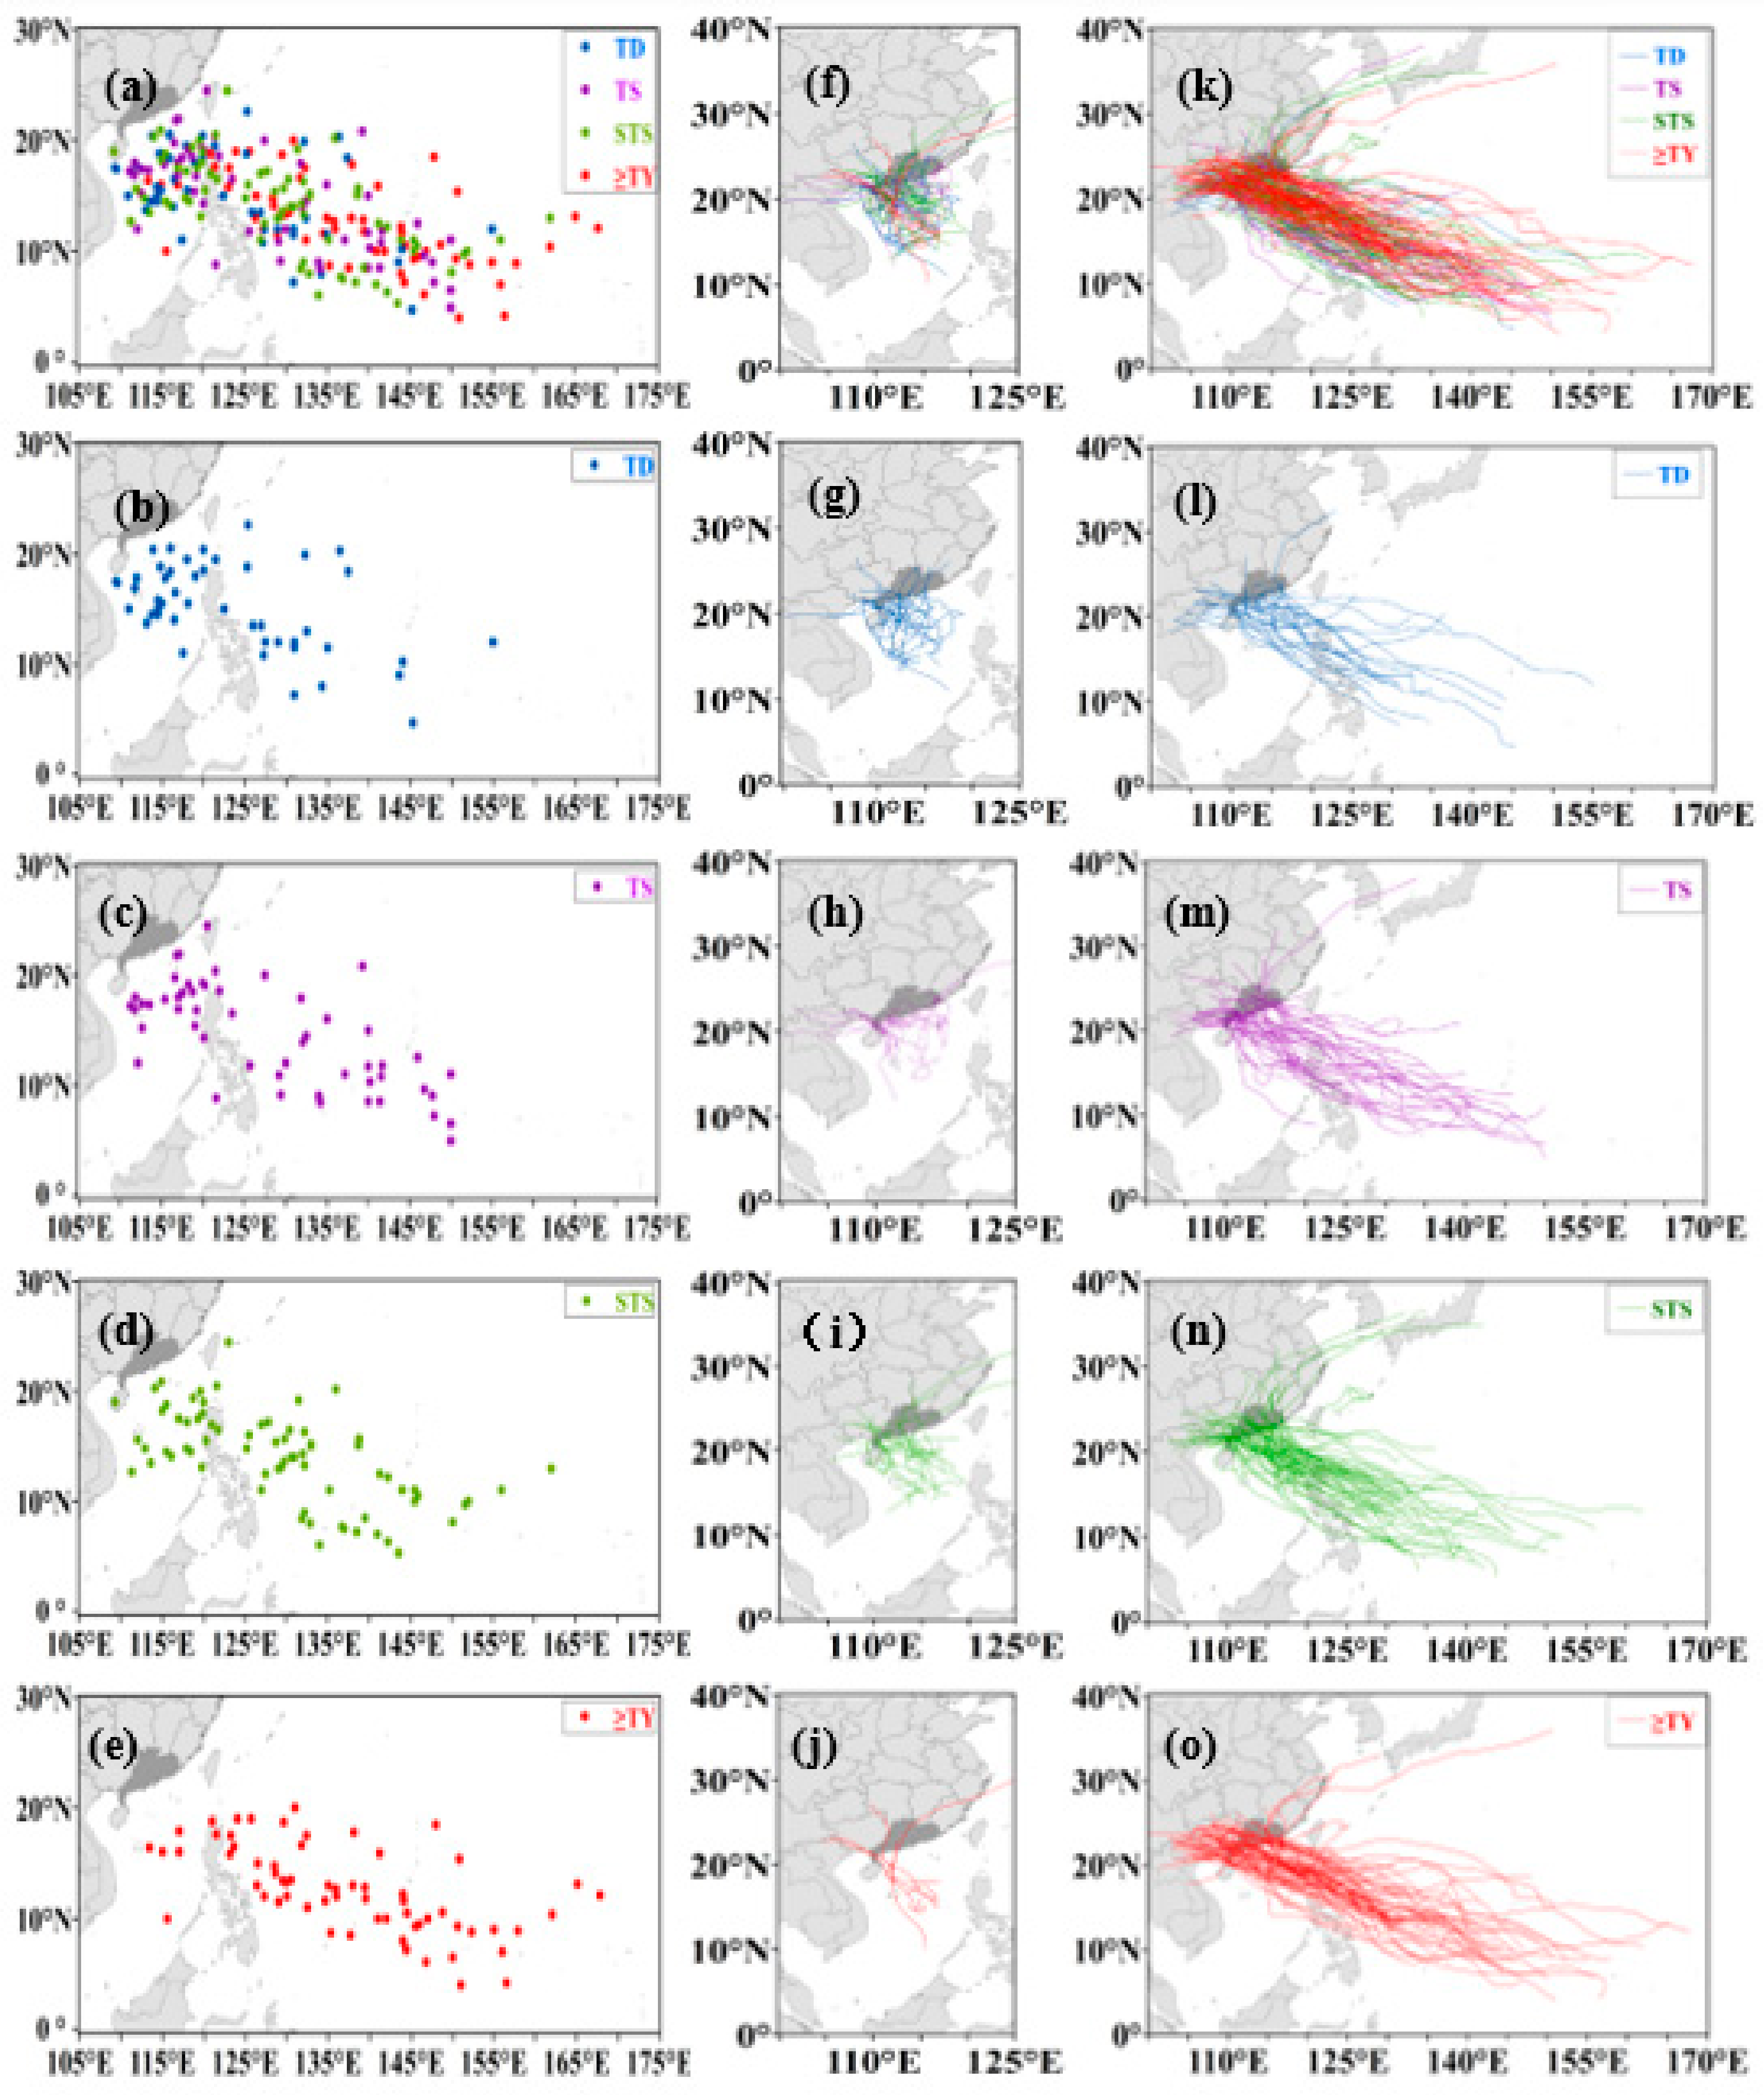
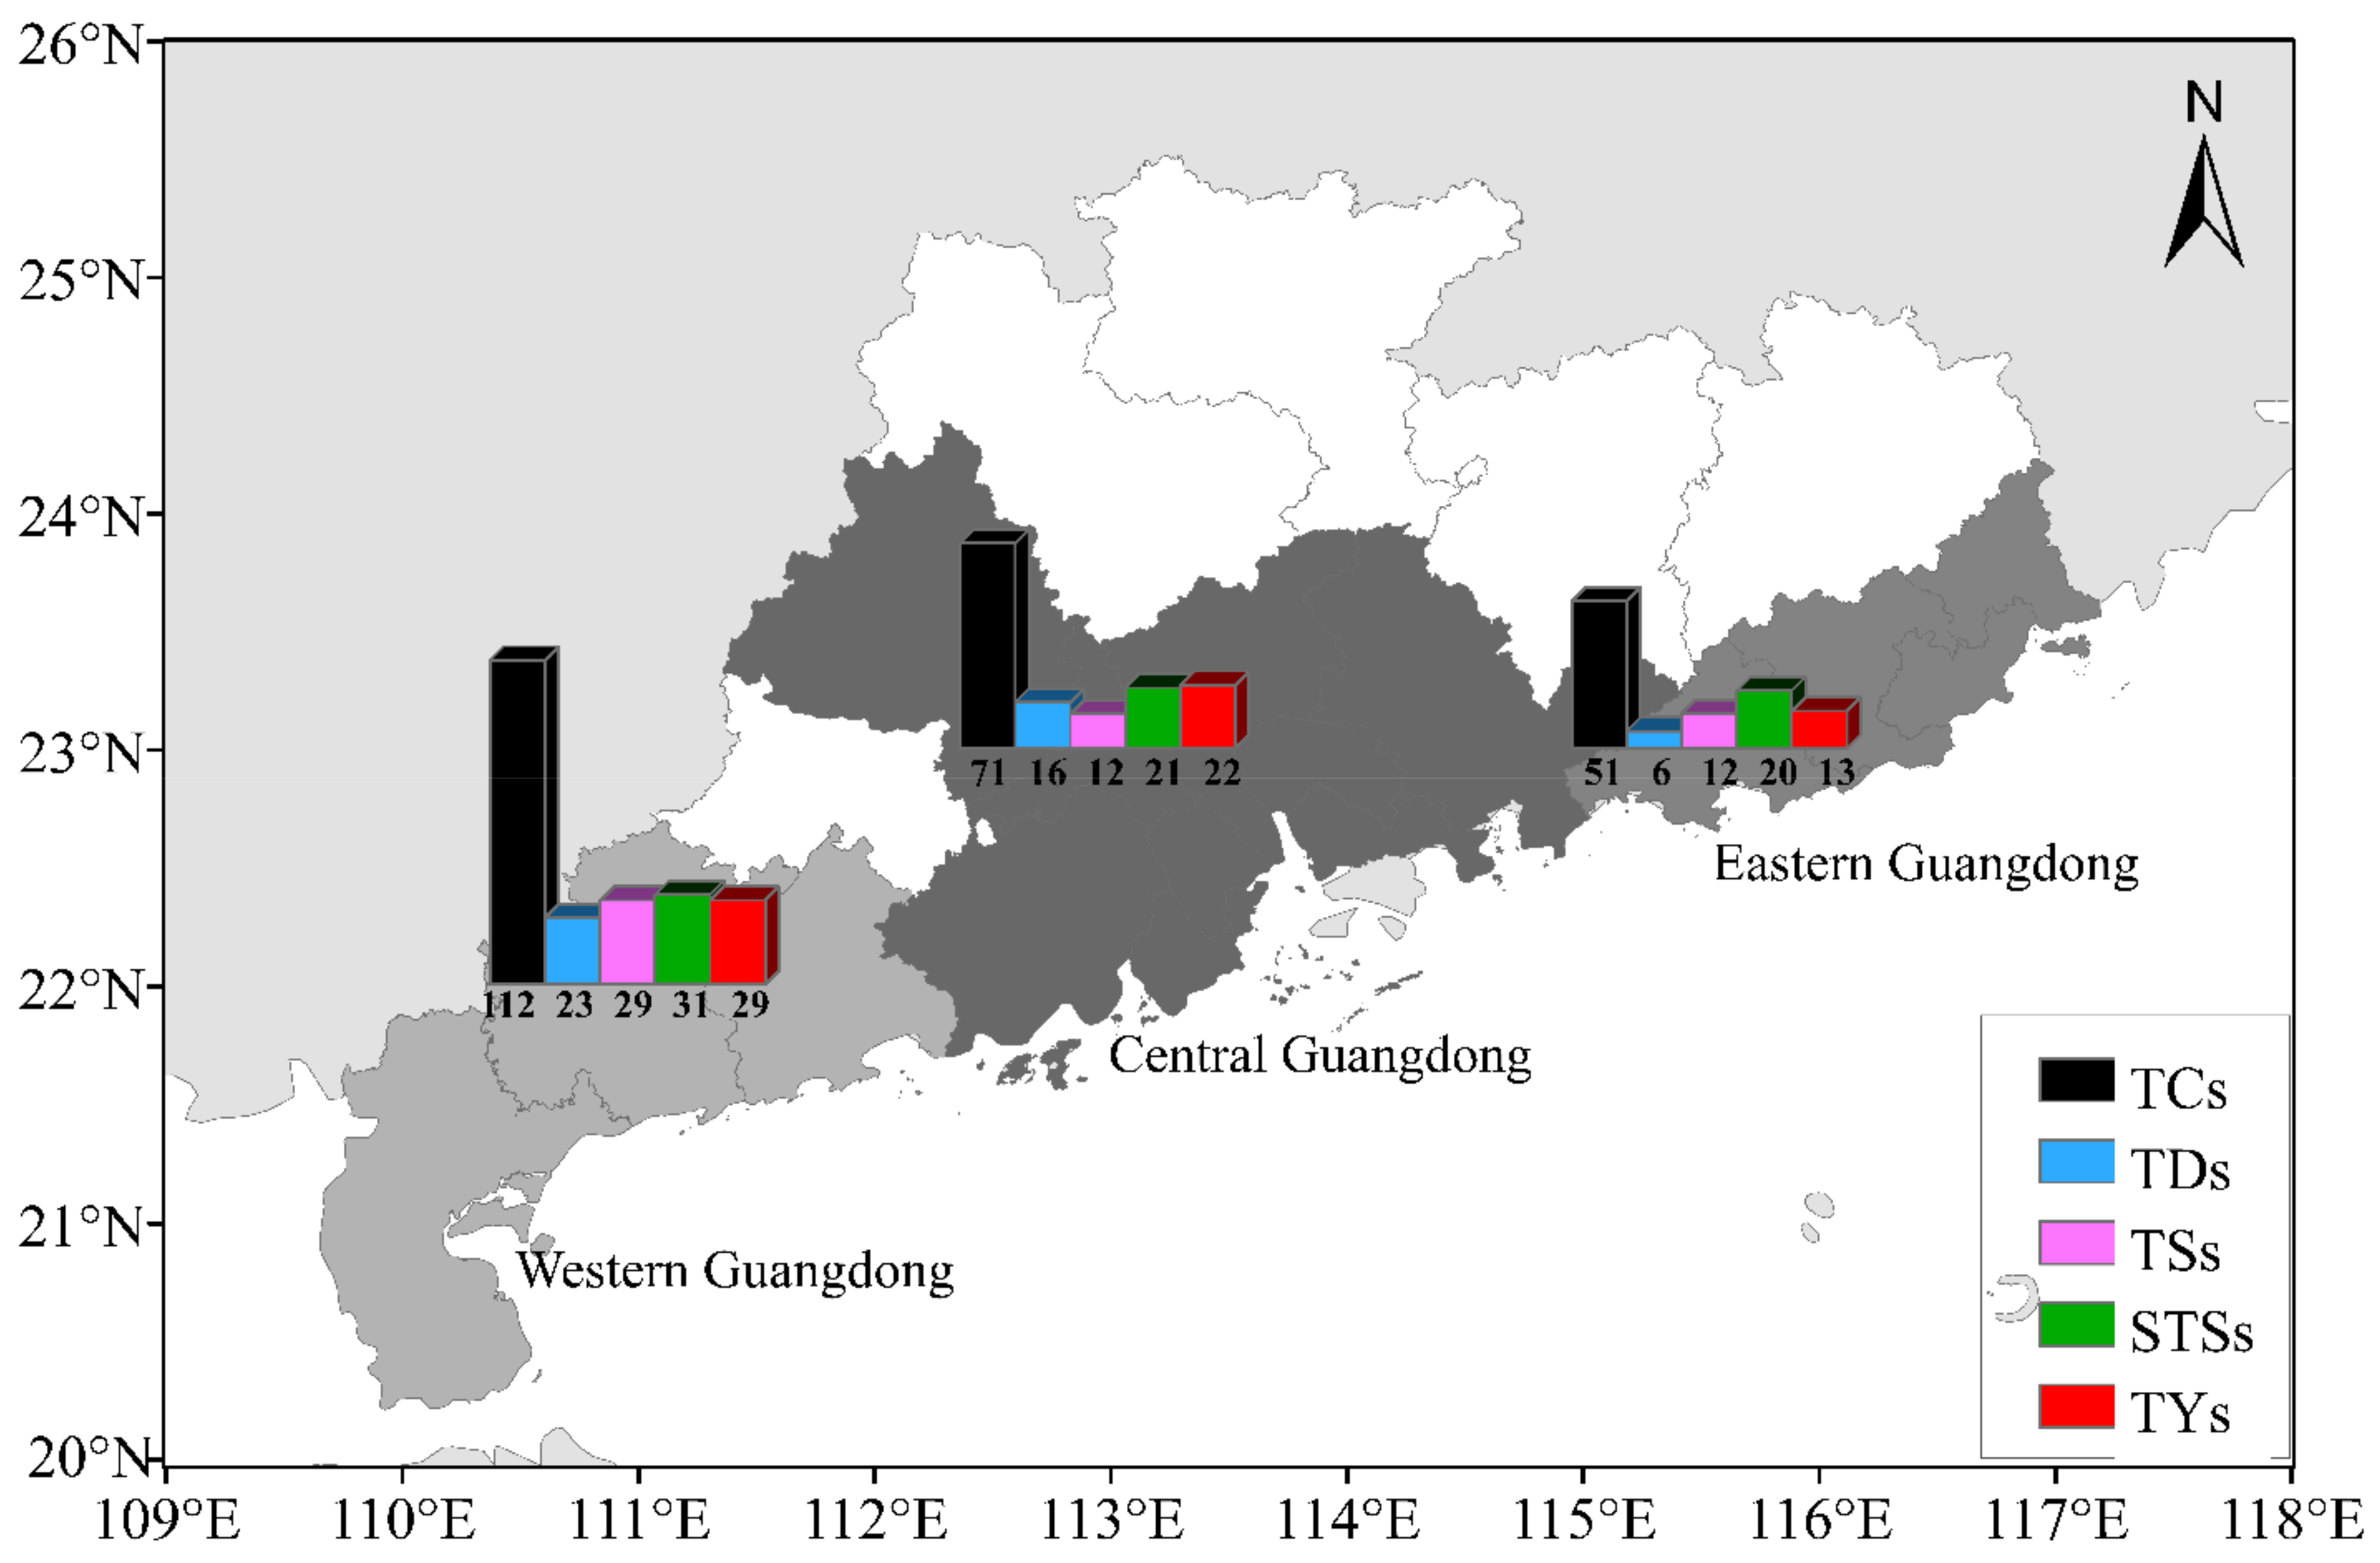
3.4. TC Tracks and Landfall Distributions

The cyclogenesis positions and moving tracks of TCs making landfall in Guangdong Province are displayed in Figure 4. TCs making landfall in Guangdong Province were usually generated over the SCS and the WNP (Figure 4a). The total of 180 TCs (76.9%) originating in the WNP were much more than the 54 (23.1%) originating in the SCS, indicating that TCs making landfall in Guangdong Province were mainly generated over the WNP. There were 20 TDs, 15 TSs, 14 STSs, and 5 TYs generated over the SCS, and 26 TDs, 37 TSs, 58 STSs, and 59 TYs generated over the WNP (Figure 4b–e), suggesting that the frequency of TCs decreased over the SCS and increased over the WNP with the increasing landfall TC intensity. The proportion of TSs and TYs generated over the WNP reached 80.6% and 92.2%, respectively, indicating that the stronger TCs making landfall in Guangdong Province were mostly formed over the WNP. TCs generated over the SCS generally moved northward or northwestward and made landfall in Guangdong Province (Figure 4f). Those generated over the WNP mostly moved northwestward, passed through the Philippines into the SCS and came ashore in Guangdong Province (Figure 4k). Although the moving tracks of different classifications of TCs (Figure 4g–j,l–o) were similar to those of total TCs, TCs trended to make landfall in the west of Guangdong Province with the increasing landfall TC intensity.
Guangdong Province is divided into western Guangdong, central Guangdong, and eastern Guangdong (Figure 5). There were 112 TCs making landfall in western Guangdong (47.9%); STSs were the most (31, 27.7%), followed by TSs and TYs (both are 29, 25.9%), and TDs were the least (23, 20.5%). There were 71 TCs making landfall in central Guangdong (30.3%); TYs occurred most frequently (22, 31.0%), followed by 21 STSs (29.6%), 16 TDs (22.5%); and 12 TSs (16.9%). There were 51 TCs making landfall in eastern Guangdong; the frequency of different classifications of TCs was ordered as STSs (20, 39.2%), TYs (13, 25.5%), TSs (12, 23.5%), and TDs (6, 11.8%). The results indicate that TCs making landfall in western Guangdong were the most, followed by central Guangdong. Although different classifications of TCs making landfall in eastern Guangdong were the least among the three areas, the proportion of strong intensity STSs and TYs making landfall in eastern Guangdong (64.7%) was the greatest.

3.5. Duration of TCs Generated over the WNP and the SCS

The average duration of different classifications of TCs making landfall in Guangdong Province is shown in Table 2. The average lifetime duration of 181 h for TCs generated over the WNP was much longer than the 129 h for TCs generated over the SCS. With the increasing landfall TC intensity, the lifetime duration of different classifications of TCs generated over the WNP and the SCS all increased. The lifetime duration of TSs (174 h) and STSs (180 h) over the WNP were similar, and they were obviously longer than that of TDs (139 h) and shorter than that of TYs (205 h). The lifetime duration of STSs (139 h) and TYs (143 h) over the SCS were similar, which was obviously longer than those of TDs (106 h) and TSs (123 h). Moreover, these were statistically significant with more than 95% confidence level using the Student’s t-test. The average on-land duration of different classifications of TCs generated over the WNP was about 26 h, while the on-land duration of storms originating over the SCS was (40 h) for TSs and (41 h) hours for STSs, much longer than TDs (32 h) and TYs (33 h). Moreover, the average on-land duration for storms generated over the SCS was 36 h, which was 38% longer than the 26 h on-land duration of WNP storms.

4. Composite TC Structure

The composite analysis using TC-relative coordinates was employed to investigate the TC structures for different classifications of TCs making landfall in Guangdong Province. The cases of TDs, TSs, STSs, and TYs occurring during 1951–2020 are all selected in the composite analysis, respectively. The composite field of total TCs is taken as the average field. In addition, the anomaly is calculated as the difference between different classifications of TCs with the average of total TCs.

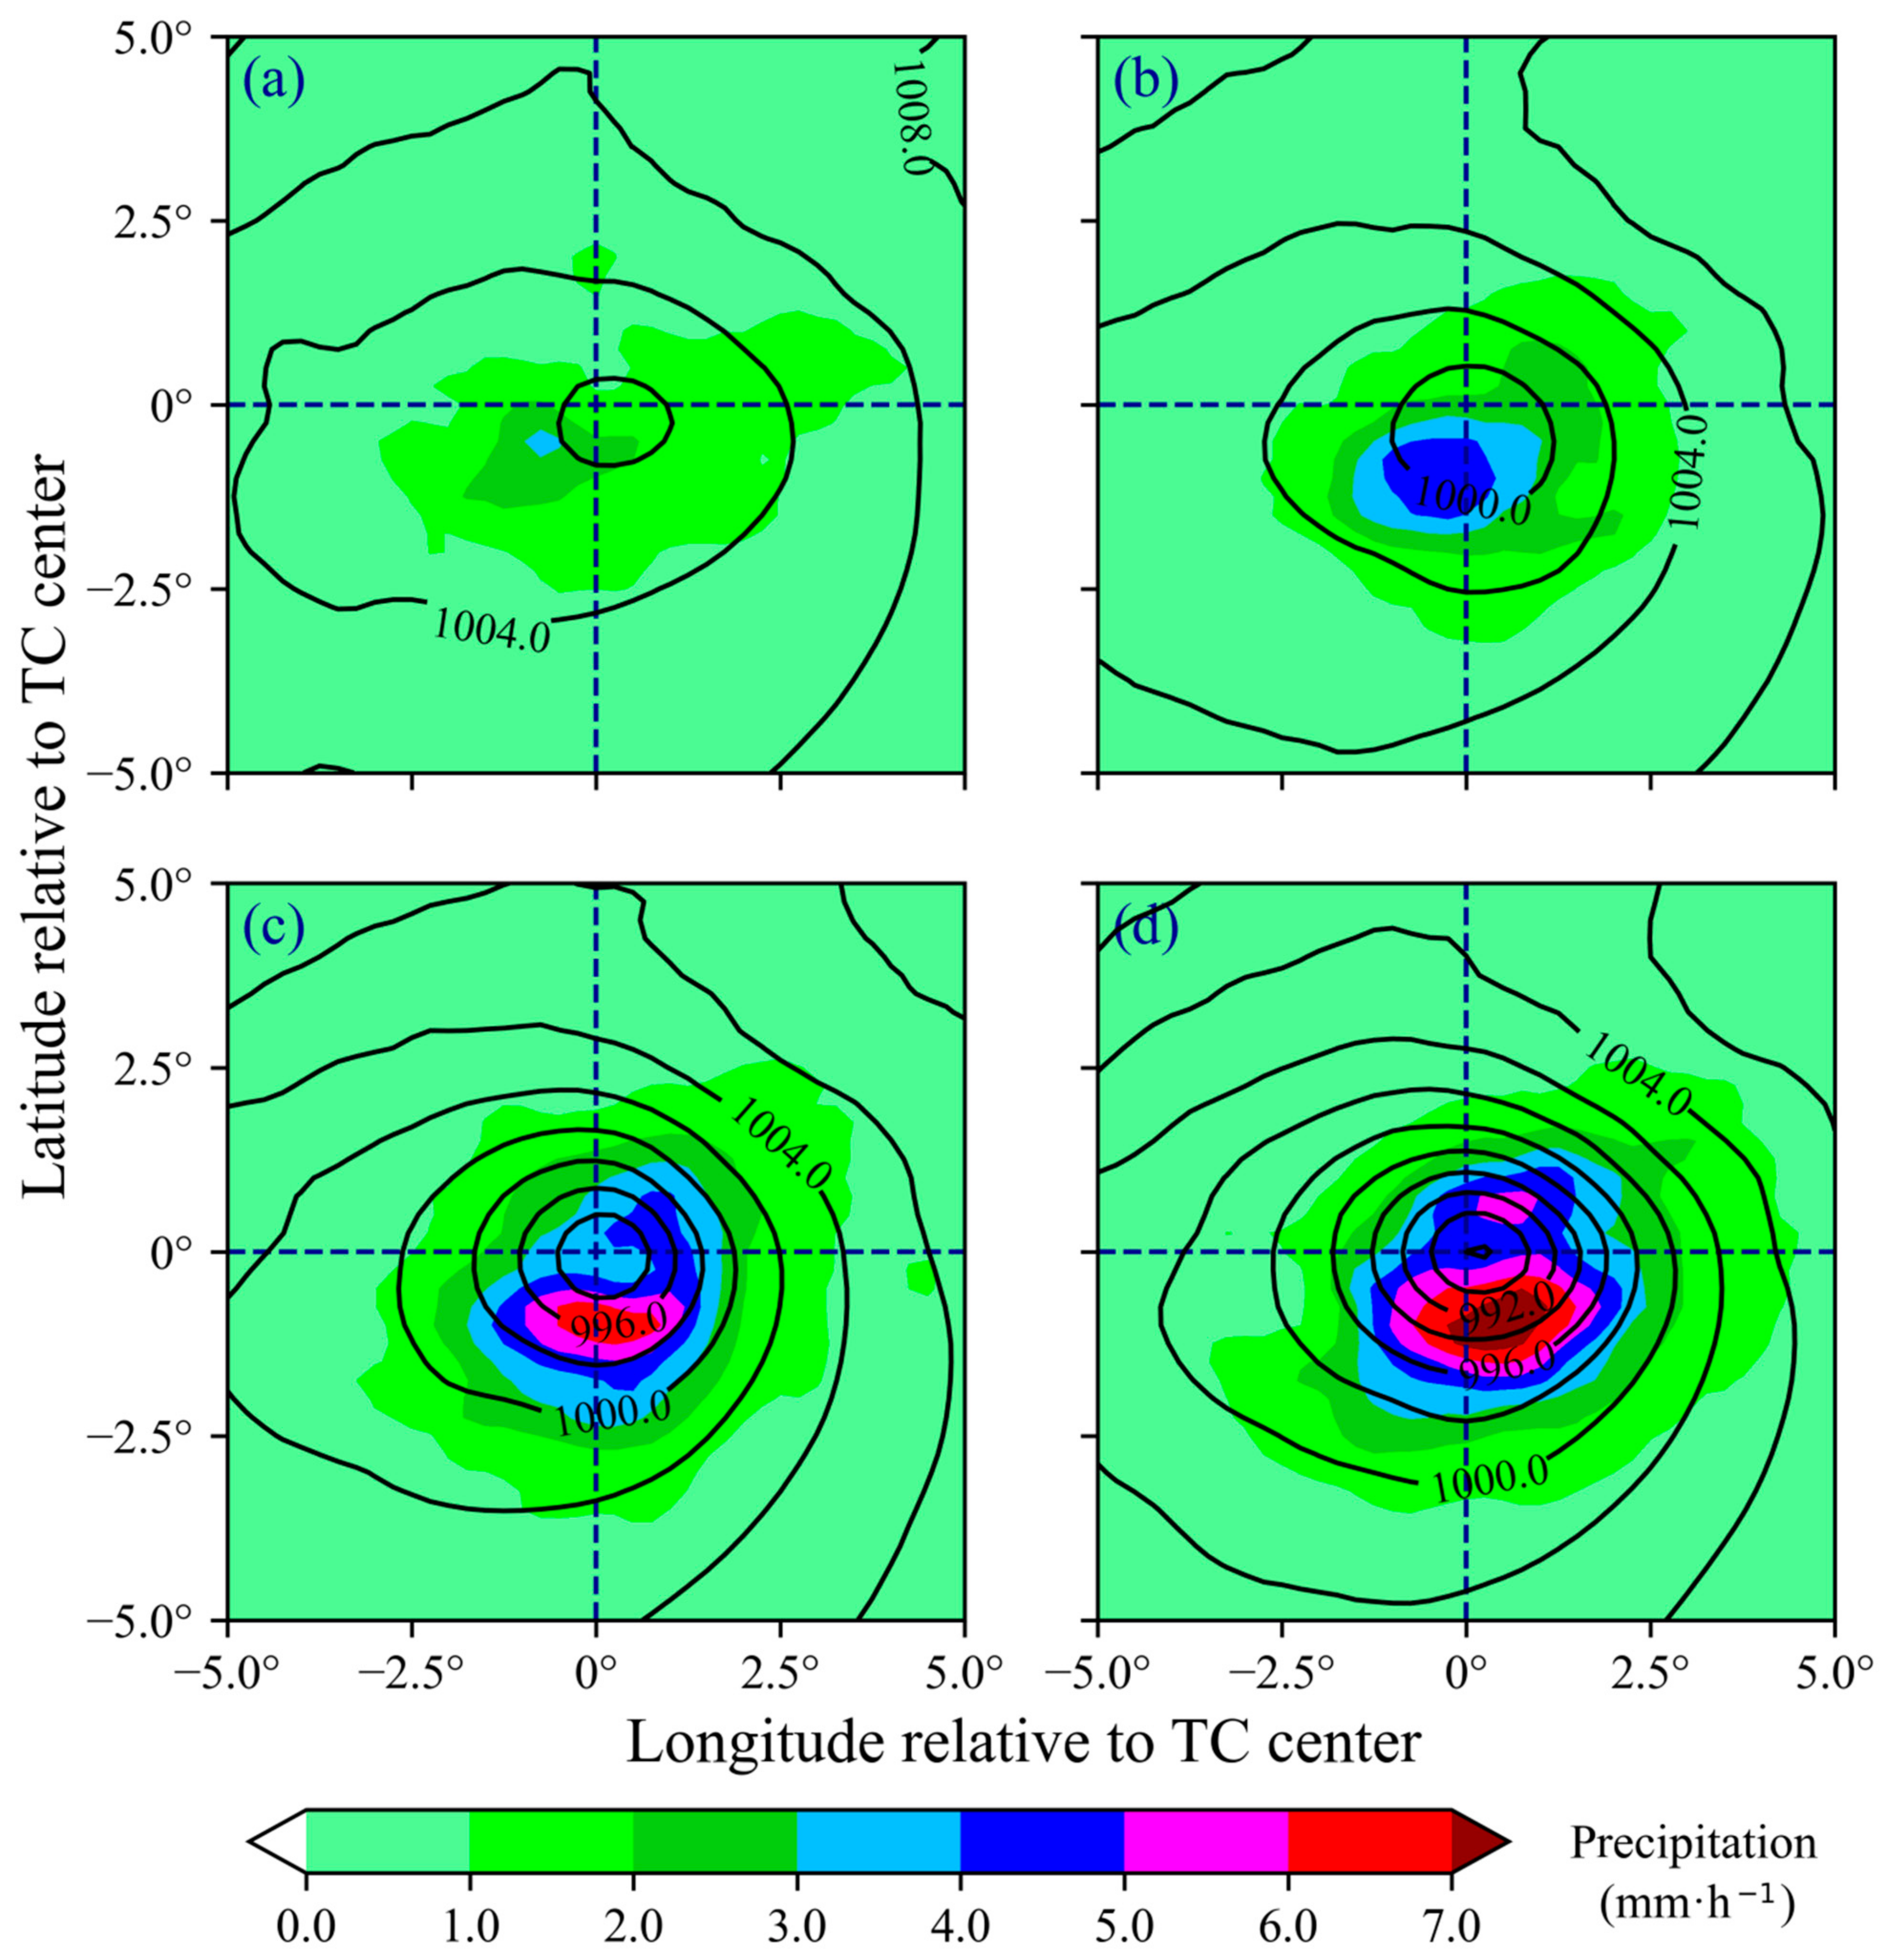
4.1. SLP and Precipitation

TCs often bring extreme precipitation and lead to widespread inland floods and other secondary disasters. The composite SLP and 1-h accumulated precipitation of different classifications of TCs making landfall in Guangdong Province are displayed in Figure 6. With the increasing landfall TC intensity, the minimum central SLP decreased obviously, while the horizontal scale changed slightly. The isobars were tighter in the east than in the west, which showed an asymmetric structure. There were also clear precipitation asymmetries of the different classifications of TCs. In general, more precipitation fell south of the TC center, while the pattern had prominent variations between the different classifications of TCs. The maximum precipitation of TDs (Figure 6a) and TSs (Figure 6b) was located in the southwest quadrant near their centers. The maximum precipitation of STSs was mainly distributed in the south (Figure 6c). For TYs (Figure 6d), the maximum precipitation was located in the southeast quadrant, and another weaker center appeared in the northeast quadrant. Generally, the position of the maximum precipitation showed a cyclonic rotation around the TC center with increasing landfall TC intensity from the southwest to the southeast quadrant. This distribution of TC precipitation was similar to the satellite observations from Wen et al. [26]; moreover, the variation of precipitation for different classifications of TCs was revealed. In addition, the precipitation clearly increased with increasing landfall TC intensity, which was similar to the previous works [26,42,43].

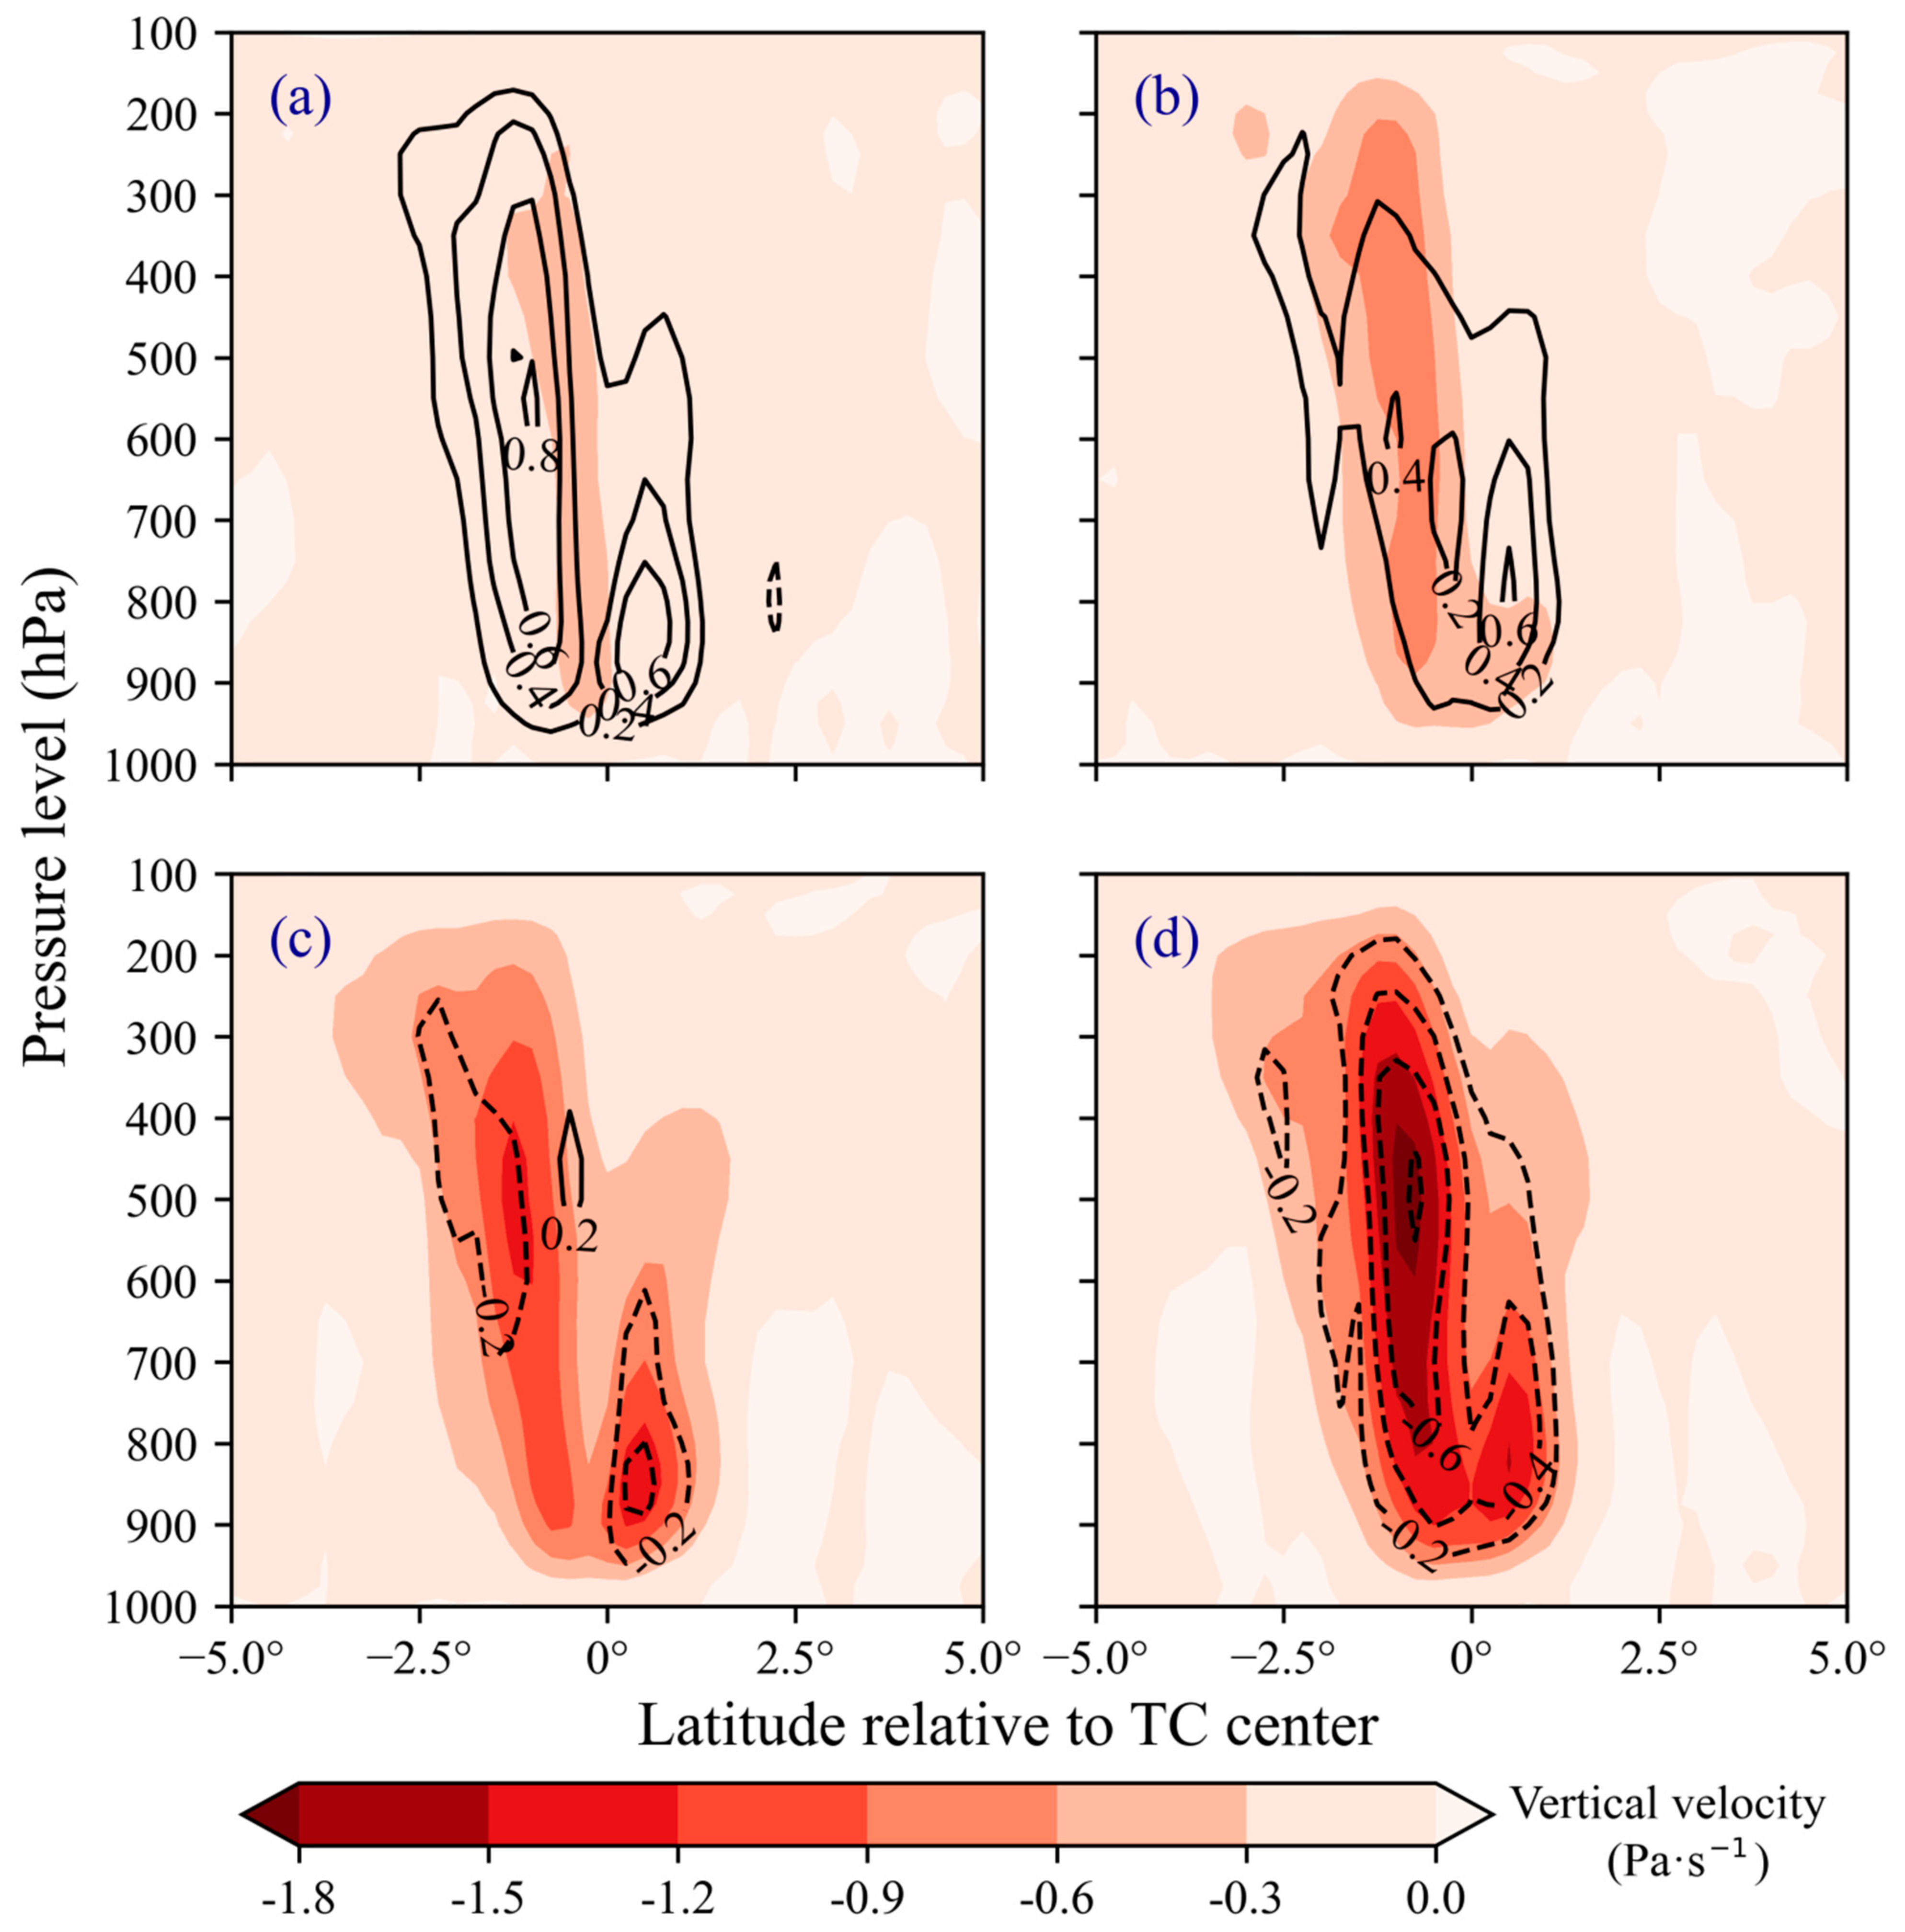
4.2. Vertical Velocity
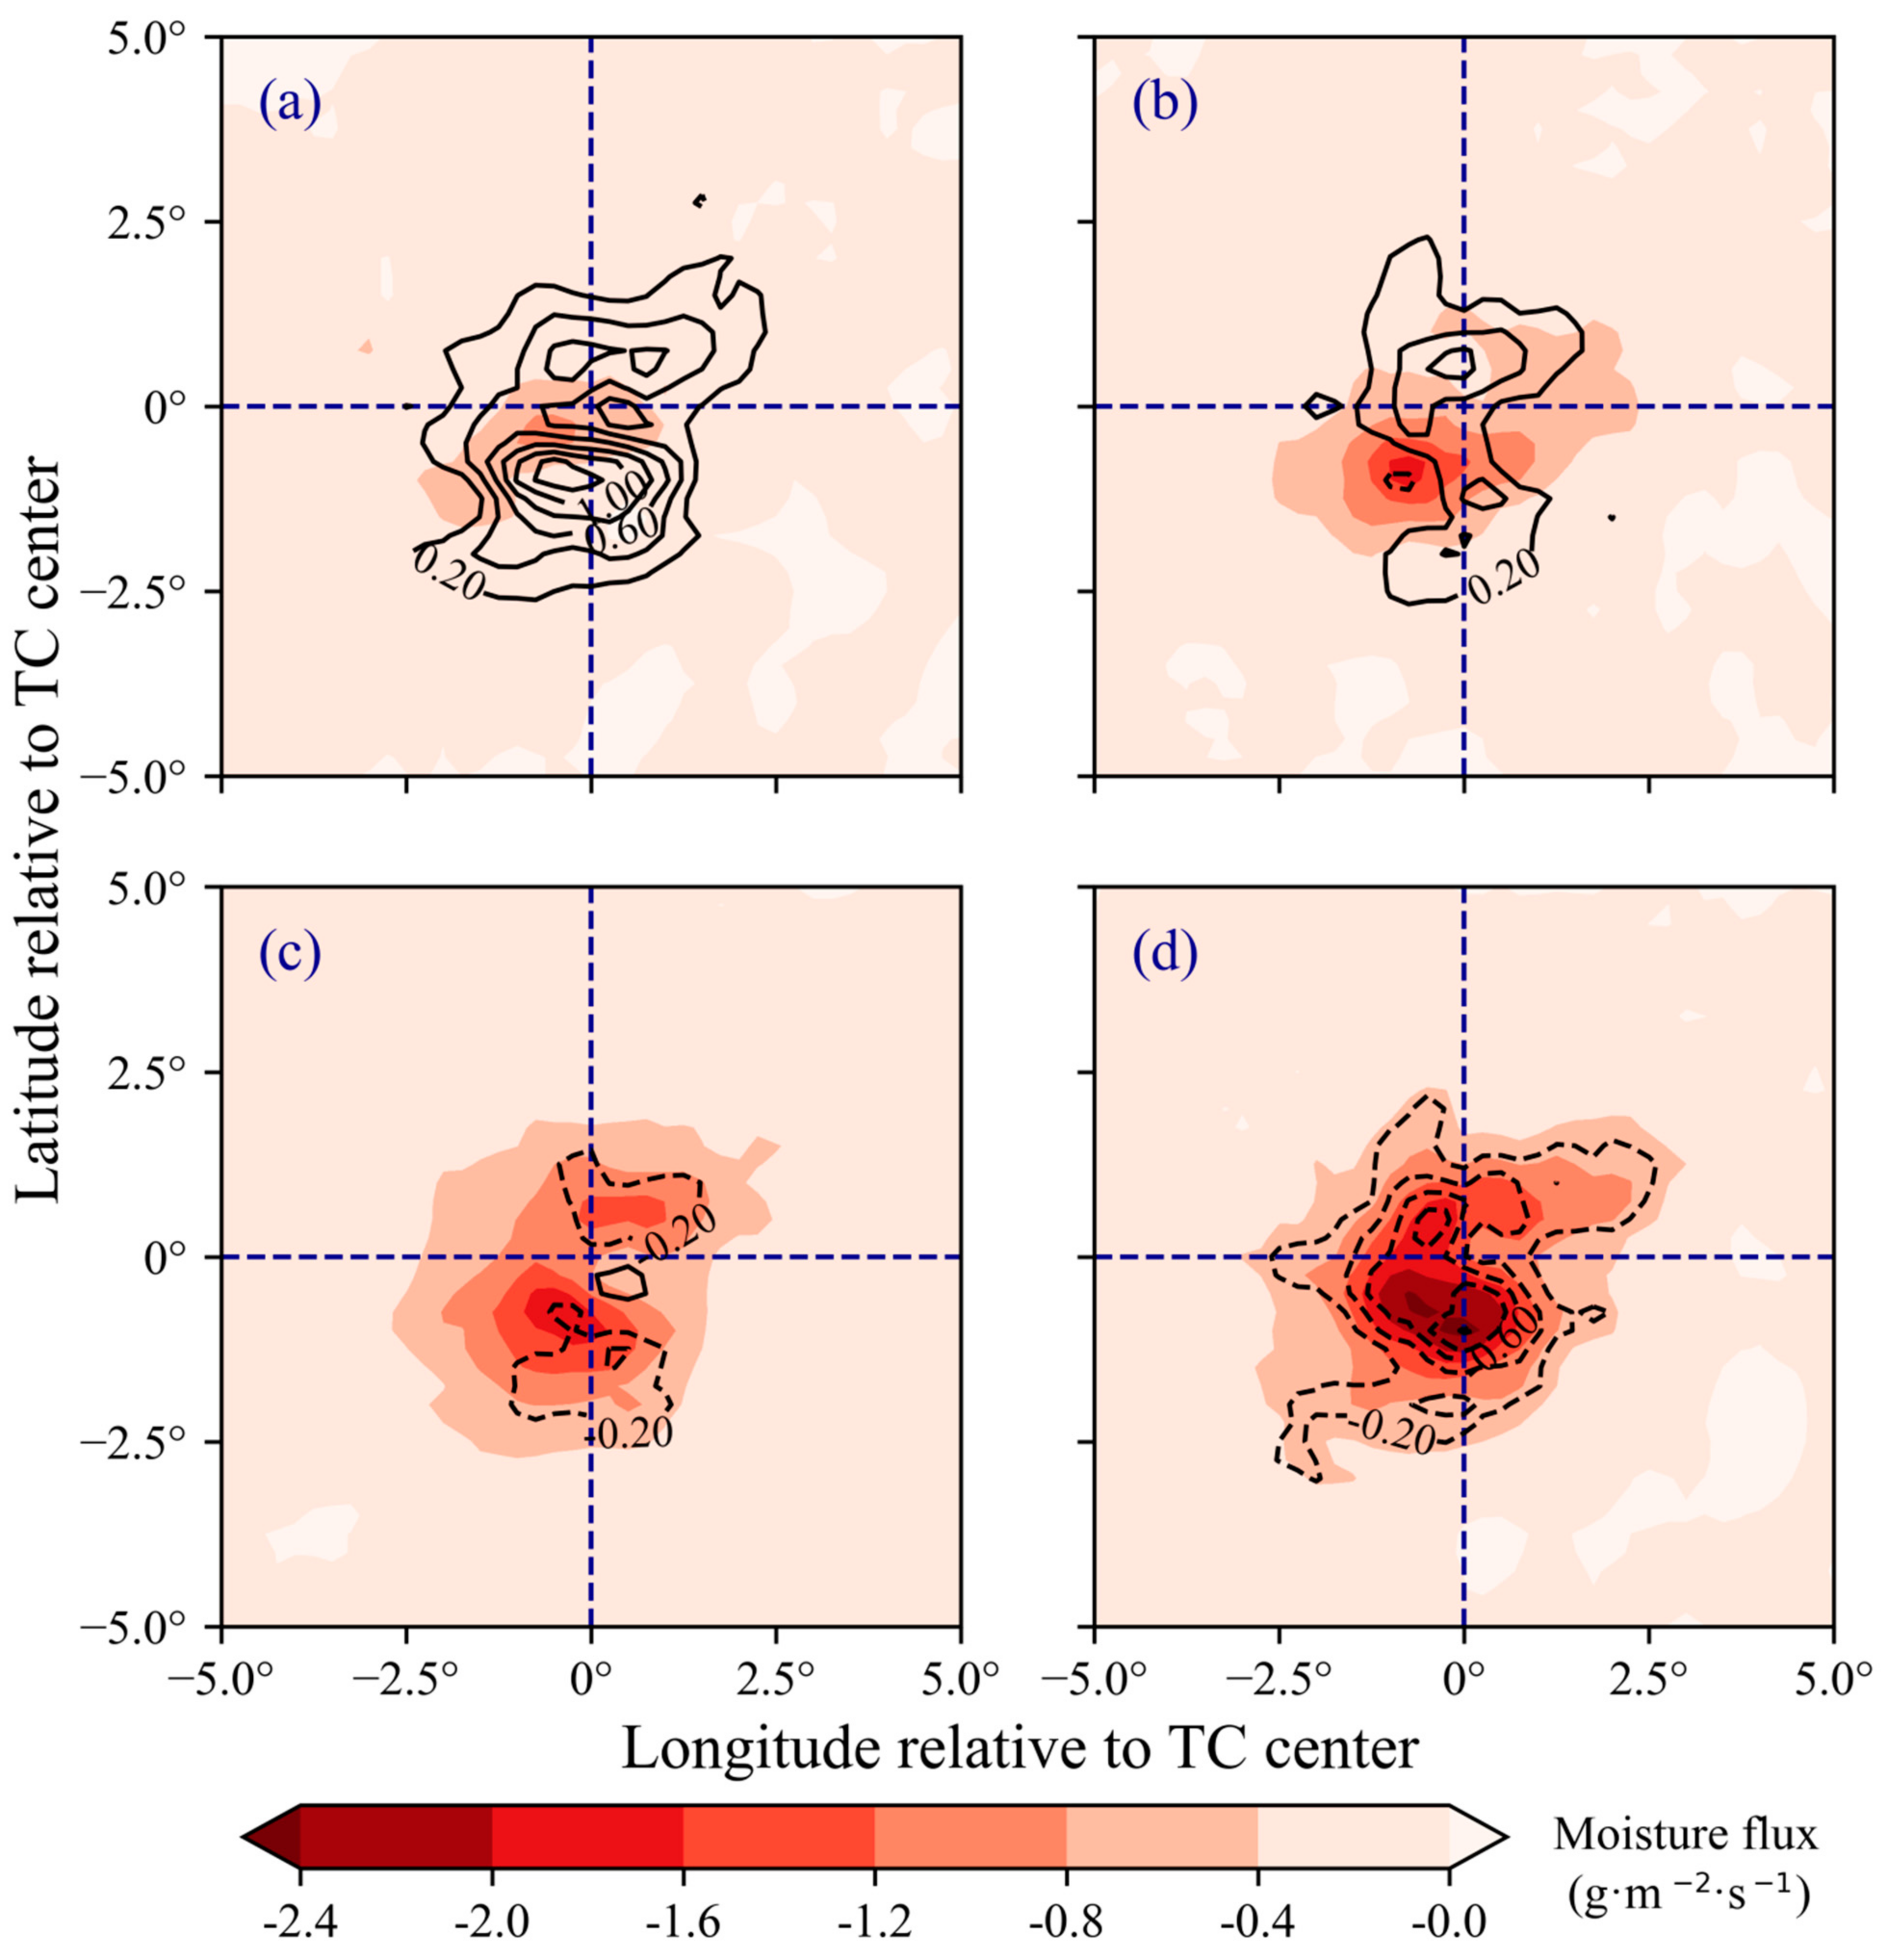
The vertical velocity has an important influence on the development, intensity, and structure of TCs [44,45,46]. Due to the maximum precipitation generally occurring in the south of the TC center, the vertical cross section across the TC center along the south–north direction is selected. The vertical velocity of different classifications of TCs is displayed in Figure 7. The vertical velocity generally extended from 950 hPa to 200 hPa. The vertical velocity of TDs (Figure 7a) and TSs (Figure 7b) were distributed about 1° latitude south of the TC center with −0.3 Pa·s−1 and −0.6 Pa·s−1 maximum of the upward motion, respectively. Those of STSs (Figure 7c) and TYs (Figure 7d) had a stronger center about 1° latitude south of the TC center in the middle troposphere (near 500 hPa) and a weaker center about 0.5° of latitude north of the TC center in the low troposphere (near 850 hPa). The south had deep convection extending to about 200 hPa, and the north had shallow convection extending to about 400 hPa. The vertical velocity of different classifications of TCs showed an asymmetric structure, which was stronger in the south and weaker in the north, similar to the precipitation pattern. Especially for STSs and TYs, the weaker shallow convection in the north resulted in weaker precipitation in their northeast quadrant. The negative anomaly of the vertical velocity of TYs in the south and in the north was much stronger and weaker than those of STSs, respectively. Generally, the vertical velocity of STSs and TYs was much stronger than that of TDs and TSs, and the vertical velocity was enhanced with increasing landfall TC intensity.

4.3. Moisture Flux

Figure 8 shows the composite vertical integral of moisture flux and the anomaly between the different classifications of TCs with total TCs making landfall in Guangdong Province. The vertical integral of the moisture flux presented the obvious asymmetric distribution, which was stronger in the south and weaker in the north of the TC center. The vertical integral of the moisture flux centers of TDs (Figure 8a) and TSs (Figure 8b) were 0.8 g·m−2·s−1 and 1.6 g·m−2·s−1, respectively, and located in the southwest quadrant near their center. Those of STSs (Figure 8c) and TYs (Figure 8d) were not only centered in the south (1.6 g·m−2·s−1 and 2.4 g·m−2·s−1, respectively), but also had weak centers in the north (1.2 g·m−2·s−1 and 1.6 g·m−2·s−1, respectively). The negative anomaly of TYs was larger than that of STSs around the TC center, and the positive anomaly of TSs was larger than that of TDs around the TC center. These results indicated that the vertical integral of the moisture flux enhanced with increasing landfall TC intensity. The pattern of the vertical integral of the moisture flux, consistent with the precipitation, usually occurred in the south of the TC center (Figure 6). The moisture flux associated with the ascending motion (Figure 7) is beneficial to precipitation and the latent heat release through water vapor condensation, leading to the enhancement of the ascending motion and favoring the development of TCs.

4.4. Warm Core

The warm core of TCs is highly related to TC intensity [12,47], which is defined as the temperature anomaly between the TC center and the average environment temperature of the surrounding area at the same vertical level. The average environment temperature at a certain level is the average within a 10° × 10° box around the TC center. The warm cores of different classifications of TCs are displayed in Figure 9. The warm core of TDs exceeding 0.4 °C extended from 700–200 hPa (Figure 9a). TSs, STSs, and TYs had a double warm-core configuration in which a stronger one was in the upper troposphere near 300 hPa and a weaker one was in the mid-low troposphere near 600 hPa (Figure 9b,c). The upper warm core of TSs, STSs, and TYs exceeded 0.8 °C, 1.6 °C, and 2.0 °C, and the mid-low warm core exceeded 0.8 °C, 1.2 °C, and 1.6 °C, respectively. Compared with the warm core of total TCs, the positive anomaly of the warm core of TYs was larger than that of STSs in the whole troposphere; the negative anomaly of TSs was larger than that of TDs. Associated with the vertical velocity (Figure 7), it was found that the height of the warm core was usually below the maximum vertical velocity, indicating that the latent heat release through water vapor condensation resulting from vertical velocity and moisture favored the warm core. The warm core enhanced with increasing landfall TC intensity, especially the warm cores of STSs and TYs that were much stronger than those of TDs and TSs.

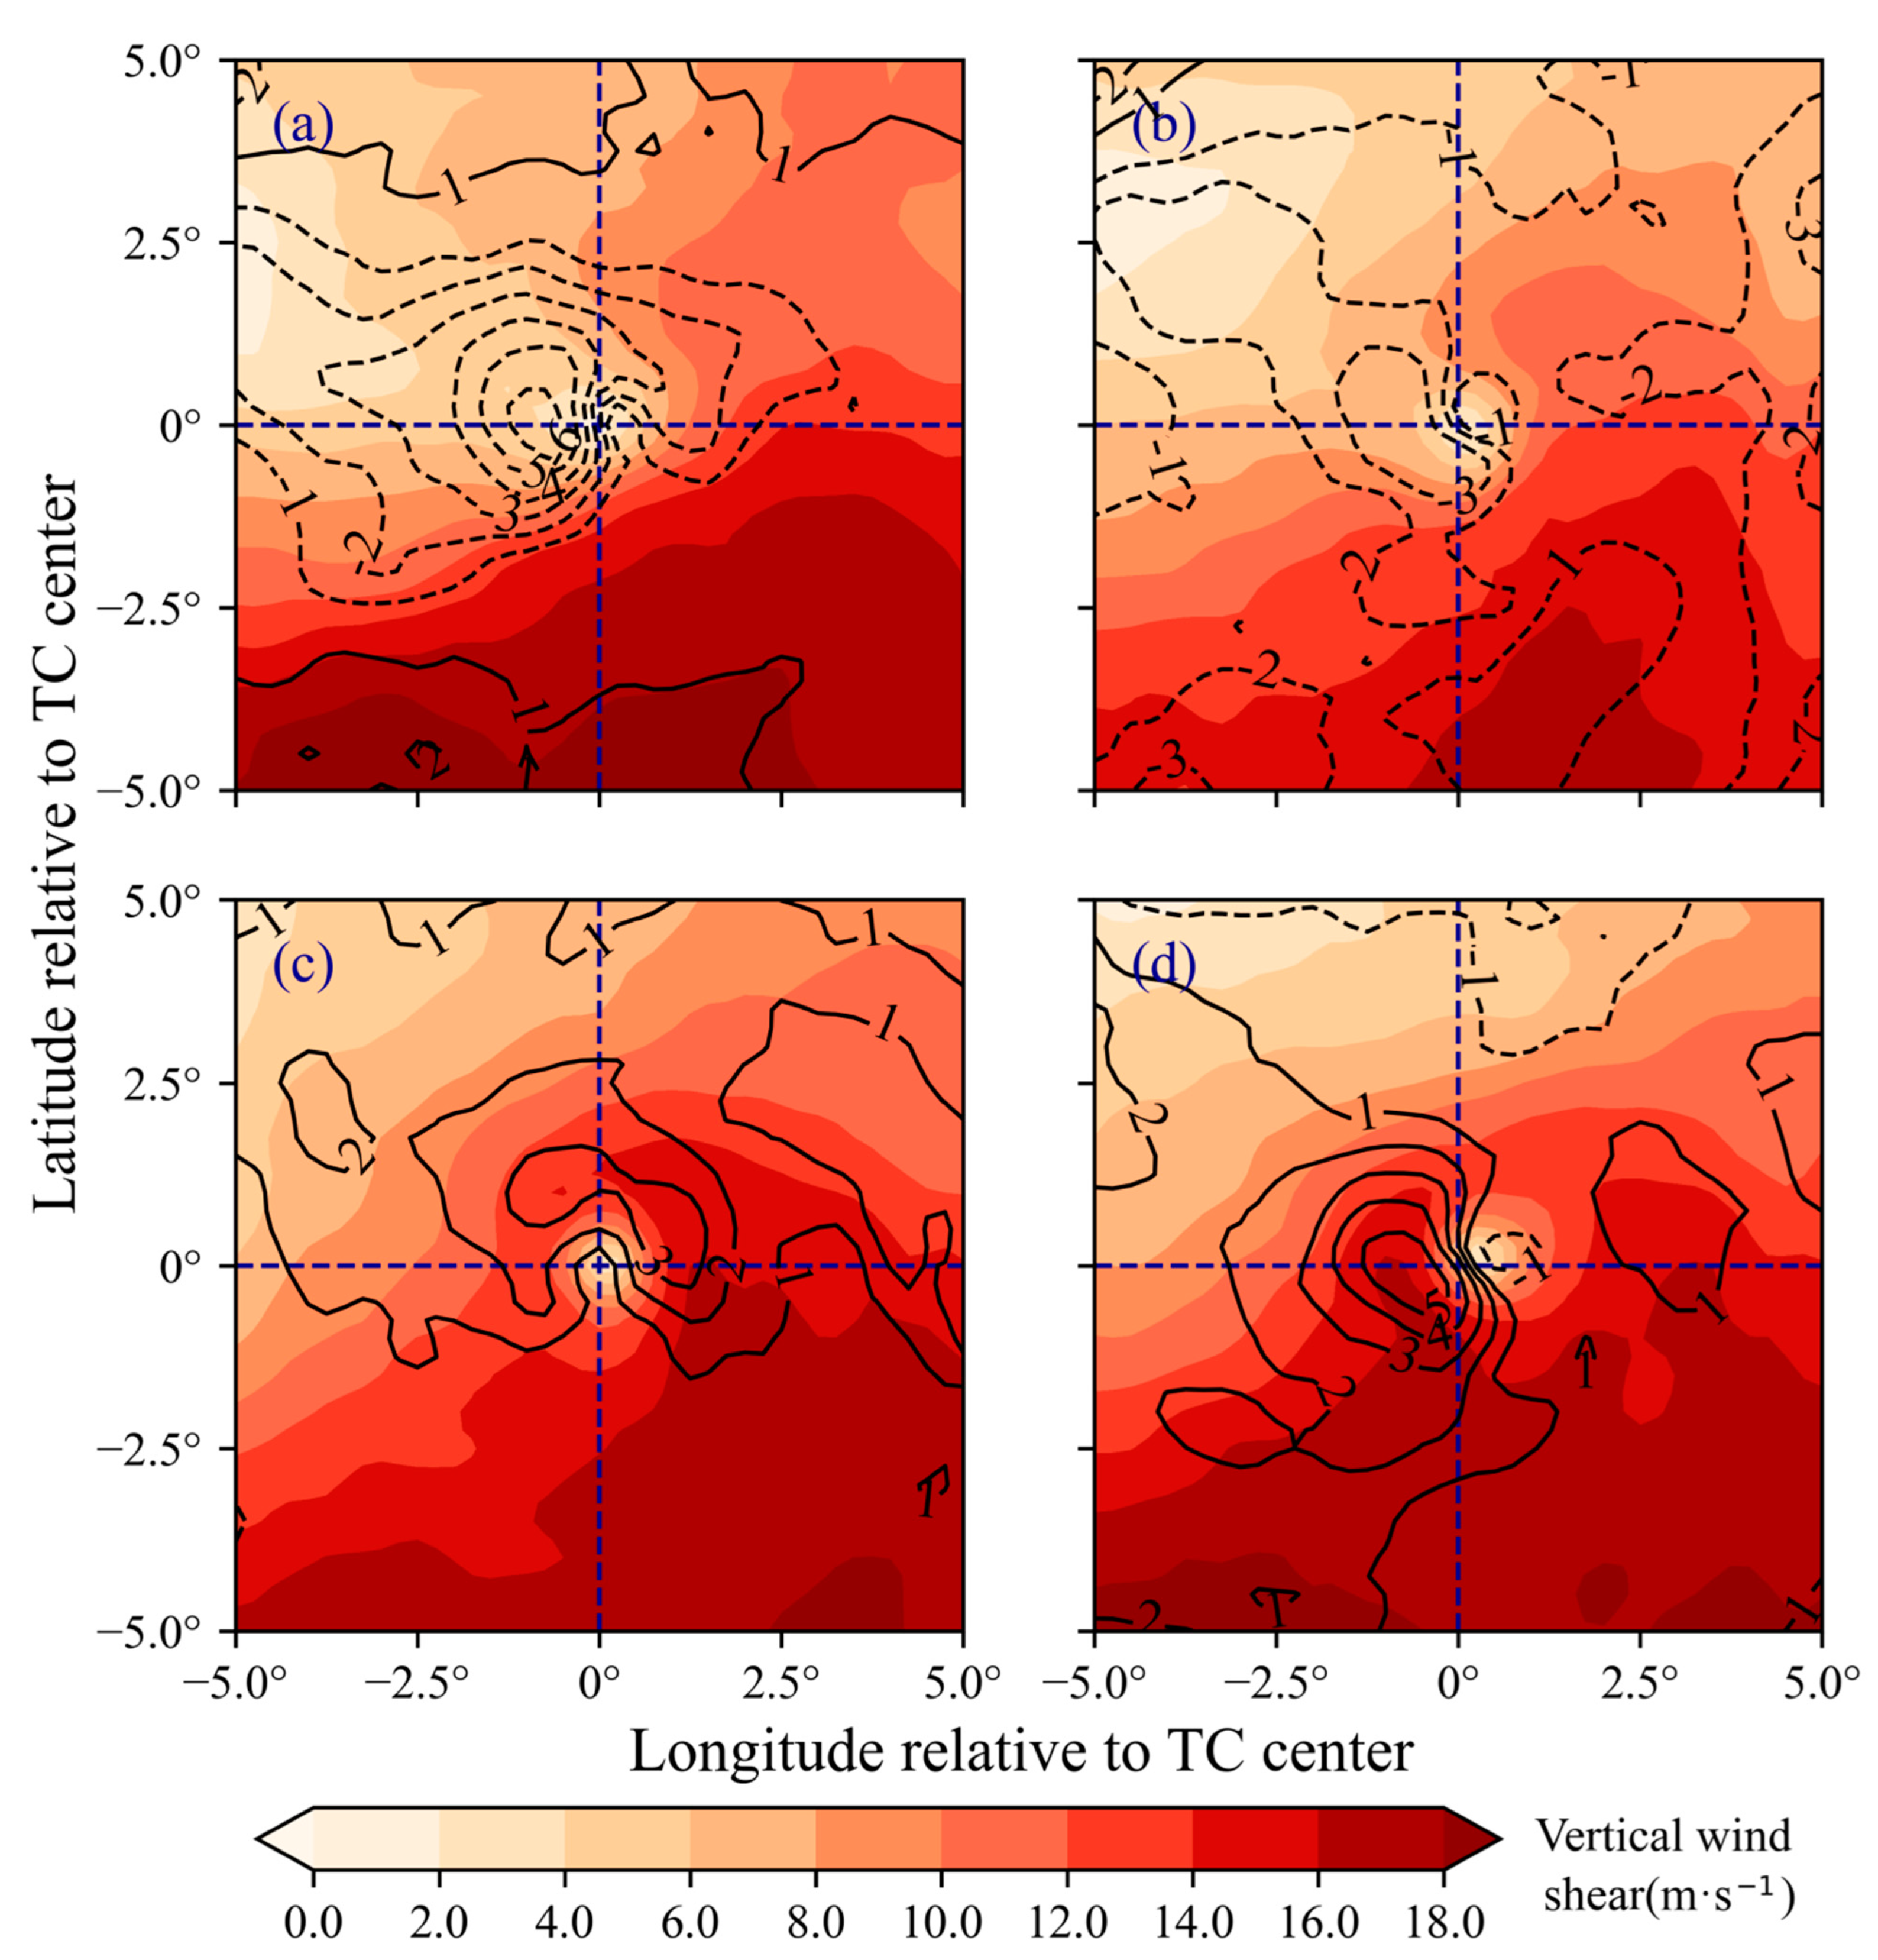
4.5. Vertical Wind Shear

The vertical wind shear is estimated as the magnitude of the difference between the 200 hPa and 850 hPa zonal and meridional winds, which is displayed in Figure 10 for different classifications of TCs. The vertical wind shear was stronger in the southeast and weaker in the northwest for different classifications of TCs, and it was generally the weakest near the TC center. Although previous studies revealed that ventilation effects of strong vertical wind shear make up the upper and lower troposphere of TCs in different phases, resulting in the reduction of condensation latent heat accumulation generated by upper cumulus and inhibiting the development of TCs [48,49,50], the vertical wind shear generally enhanced with increasing landfall TC intensity. The on-land duration of intense TCs was slightly shorter than weak TCs (Table 1), probably because the intense TCs decreased rapidly from stronger vertical wind shear after landfall. The asymmetric distribution of TC precipitation is more related to vertical wind shear [28,51,52]. The average vertical wind shear over the 10° × 10° box generally had a northeasterly flow in different classifications TCs. The precipitation of the TDs and TSs usually occurred over the down-shear of average vertical wind shear. Those of the STSs and TYs generally occurred over the left-of-shear of average vertical wind shear.

5. Conclusions and Discussion

Using the TC best track data from the CMA and the ERA5 reanalysis data from the ECMWF, the statistical characteristics and composite structures for different classifications of TCs making landfall in Guangdong Province of China during 1951–2020 (70 years) were investigated in this work.
There were 234 TCs that made landfall in Guangdong Province during 1951–2020 (70 years), with more severe tropical storms (STSs, 30.8%) and typhoons (TYs, 27.3%), and less tropical depressions (TDs, 19.7%) and tropical storms (TSs, 22.2%). The average landfall intensity, maximum lifetime intensity, and lifetime duration for different classifications of TCs generally increased with the increasing landfall TC intensity, except for the average on-land duration. Morlet wavelet energy spectrum suggested that the annual frequency of total TCs had a significant 2–5 years oscillation during the period of 1953–1972 and 1990–2011, consistent with a prominent ENSO scale cycle. In addition, there was also a significant oscillation of 6–8 years during 1992–2012.
The frequency of TCs making landfall in Guangdong Province had obvious seasonal variation. More storms occurred from July to September, and there were usually more intense TCs in September. There were more TCs generated over the WNP than over the SCS. The frequency of TCs decreased over the SCS and increased over the WNP with the increasing landfall TC intensity, and the intense TCs mostly formed over the WNP. The landfall positions of TCs generated over both the SCS and the WNP were concentrated in western Guangdong with increasing landfall TC intensity. TCs making landfall in western Guangdong were the most, followed by central Guangdong and eastern Guangdong. The lifetime duration of different classifications of TCs generated over the WNP was much longer than that of TCs generated over the SCS, while the on-land duration of TCs generated over the WNP was shorter that for storms generated over the SCS.
The composite analysis using TC-relative coordinates was used to investigate the composite structure of different classifications of TCs making landfall in Guangdong Province. The precipitation of different classifications of TCs ng had a clear asymmetric structure, which generally was stronger in the south of the TC center. The precipitation enhanced and the maximum precipitation area showed counterclockwise patterns from the southwest to southeast quadrant with increasing landfall TC intensity. Generally, the vertical velocity, moisture flux, warm core, and vertical wind shear rose with increasing landfall TC intensity. The vertical velocity and moisture flux of different classifications of TCs also showed an asymmetric structure, which were stronger in the south and weaker in the north and related to the pattern of precipitation. TDs had a single warm core extending from 700–200 hPa, while TSs, STSs, and TYs had a double warm-core configuration in which the stronger one was in the upper troposphere and the weaker one was in the mid-low troposphere. The stronger vertical wind shear of intense TCs decreased the cores and probably resulted in their shorter on-land duration than weak TCs. The precipitation of the TDs and TSs usually occurred over the down-shear of average vertical wind shear. Those of the STSs and TYs occurred over the left-of-shear.
Our results showed that there were 3.3 TCs making landfall in Guangdong Province each year, which was about 30% of the TCs making landfall in China. The frequency of the landfall TCs was different from Zhang et al. [2], who showed an annual average of 2.9 making landfall in Guangdong Province during 1983–2006 because the frequency of TDs was not considered in their work. Shan and Yu [53] found that the frequency of TCs making landfall in South China had decreased significantly in the past two decades, while TCs making landfall in southeast China had obviously increased, which indicates a northward migration of the landfall regions of TCs in China during recent decades, consistent with the poleward migration of global TCs [54], likely related to Hadley cell expansion [55]. This study mainly focused on the average characteristics of different classifications of TCs making landfall in Guangdong. However, whether TCs making landfall in Guangdong Province also have a poleward migration is unknown. In addition, the interannual and interdecadal changes of different classifications of TCs making landfall in Guangdong Province and their impact mechanisms are still not fully understood and must be further explored. Wen et al. [26] and Yu et al. [30] pointed out that TC precipitation was primarily concentrated in the southwest quadrant of the landfall TCs, and the vertical wind shear determined the asymmetric rainfall distribution, generally consistent with the results of our study. In addition, the precipitation of different classifications of TCs making landfall in Guangdong Province were further investigated in this study, and the counterclockwise rotation of precipitation with increasing landfall TC intensity was found. Moreover, the vertical wind shear enhanced with the increasing landfall TC intensity, which needs to be further researched regarding the effects on landfall TC. Since the TC-related damage increases exponentially with TC intensity, coupled with the rapid economic and industrial development in coastal areas, the economic losses caused by TC activities also increase significantly [24]. Therefore, it is necessary to pay more attention to landfall TC studies in the future.

Author Contributions

Conceptualization, S.Z. and S.T.; methodology, S.Z. and C.L.; software, Y.Z. and Z.H.; formal analysis, S.Z., Y.Z. and S.T.; data curation, Y.Z. and Z.H.; writing—original draft preparation, S.Z., Y.Z. and S.T.; writing—review and editing, S.Z., S.T., J.X. and C.L.; visualization, S.Z., H.W. and Y.Z. All authors have read and agreed to the published version of the manuscript.

Funding

This research was jointly funded by Project of Enhancing School with Innovation of Guangdong Ocean University (Grant number 230419106); National Natural Science Foundation of China (Grant number 42075036); State Key Program of National Natural Science Foundation of China (Grant number 42130605); Guangdong Ocean University PhD. Scientific Research Program (Grant number R19045); Fujian Key Laboratory of Severe Weather (Grant number 2021KFKT02).

Institutional Review Board Statement

Not applicable.

Informed Consent Statement

Not applicable.

Data Availability Statement

ECWMF ERA5 data can be downloaded from https://cds.climate.copernicus.eu/cdsapp#!/dataset/reanalysis-era5-single-levels-monthly-means?tab=form, accessed on 11 July 2022. The TC best track data obtained from CMA can be downloaded from http://tcdata.typhoon.org.cn, accessed on 11 July 2022.

Acknowledgments

The authors would like to express their sincere thanks to funding organizations, and special thanks go to CMA and ECMWF for providing TC best track data and ERA5 data, respectively. We would like to thank the reviewers for their valuable suggestions and comments.

Conflicts of Interest

The authors declare no conflict of interest.

References

  1. RefePielke, R.A., Jr.; Landsea, C.W. Normalized hurricane damages in the United States: 1925–1995. Weather Forecast. 1998, 13, 621–631. [Google Scholar]
  2. Zhang, Q.; Wu, L.G.; Liu, Q.F. Tropical cyclone damages in China 1983–2006. Bull. Am. Meteor. Soc. 2009, 90, 489–496. [Google Scholar] [CrossRef]
  3. Peduzzi, P.B.; Chatenoux, B.; Dao, H.; De Bono, A.; Herold, C.; Kossin, J.; Mouton, F.; Nordbeck, O. Global trends in tropical cyclone risk. Nat. Clim. Change 2012, 2, 289–294. [Google Scholar] [CrossRef]
  4. Pielke, R.A., Jr.; Gratz, J.; Landsea, C.W.; Collins, D.; Saunders, M.A.; Musulin, R. Normalized hurricane damage in the United States: 1900–2005. Nat. Hazards Rev. 2008, 9, 29–42. [Google Scholar] [CrossRef]
  5. Xiao, F.; Xiao, Z. Characteristics of tropical cyclones in China and their impacts analysis. Nat. Hazards 2010, 54, 827–837. [Google Scholar]
  6. Liu, K.S.; Chan, J.C.L. Recent increase in extreme intensity of tropical cyclones making landfall in South China. Clim. Dyn. 2020, 55, 1059–1074. [Google Scholar] [CrossRef]
  7. Wang, Y.; Wu, C.-C. Current understanding of tropical cyclone structure and intensity changes-A review. Meteorol. Atmos. Phys. 2004, 87, 257–278. [Google Scholar] [CrossRef]
  8. Wu, L.G.; Zhao, H.K.; Wang, C.; Cao, J.; Liang, J. Understanding of the effect of climate change on tropical cyclone intensity: A re. Adv. Atmos. Sci. 2022, 39, 205–221. [Google Scholar] [CrossRef]
  9. Montgomery, M.T.; Smith, R.K. Paradigms for tropical cyclone intensification. Trop. Cyclone Res. Rep. 2013, 2, 1–31. [Google Scholar] [CrossRef]
  10. Emanuel, K. 100 years of progress in tropical cyclone research. Meteor. Monogr. 2018, 59, 15.1–15.68. [Google Scholar] [CrossRef]
  11. Holland, G.J. The maximum potential intensity of tropical cyclones. J. Atmos. Sci. 1997, 54, 2519–2541. [Google Scholar] [CrossRef]
  12. Durden, S.L. Observed tropical cyclone eye thermal anomaly profiles extending above 300 hpa. Mon. Weather Rev. 2013, 141, 4256–4268. [Google Scholar] [CrossRef]
  13. Malkus, J.S.; Riehl, H. On the dynamics and energy transformations in steady state hurricanes. Tellus 1960, 12, 1–20. [Google Scholar] [CrossRef]
  14. Jiang, H.; Zipser, E.J. Contribution of tropical cyclones to the global precipitation from eight seasons of TRMM data: Regional, seasonal, and interannual variations. J. Clim. 2010, 23, 1526–1543. [Google Scholar] [CrossRef]
  15. Ying, M.; Knutson, T.R.; Lee, T.-C.; Kamahori, H. The Second Assessment Report on the Influence of Climate Change on Tropical Cyclones in the Typhoon Committee Region; TC/TD-No.0004; ESCAP/WMO Typhoon Committee: Manila, Philippines, 2012. [Google Scholar]
  16. Lee, C.Y.; Camargo, S.J.; Sobel, A.H.; Tippett, M.K. Statistical–dynamical downscaling projections of tropical cyclone activity in a warming climate: Two diverging genesis scenarios. Climate 2020, 33, 4815–4834. [Google Scholar] [CrossRef]
  17. Lee, T.C.; Knutson, T.R.; Nakaegawa, T.; Ying, M.; Cha, E.J. Third assessment on impacts of climate change on tropical cyclones in the Typhoon Committee Region-Part I: Observed changes, detection and attribution. Trop. Cyclone Res. Rev. 2020, 9, 1–22. [Google Scholar] [CrossRef]
  18. Zhang, J.Y.; Wu, L.G.; Zhang, Q. Tropical cyclone damages in China under the background of global warming. J. Trop. Meteor. 2011, 27, 442–454. [Google Scholar]
  19. Wang, Y.M.; Ren, F.M.; Li, W.J.; Wang, X.L. Climatic characteristics of typhoon precipitation over China. J. Trop. Meteor. 2008, 24, 233–238. [Google Scholar]
  20. Wu, Y.; Gao, Y.D.; Chen, D.; Wei, M.; Liang, L.; Wen, L. Synoptic characteristics related to warm-sector torrential rainfall events in South China during the annually first rainy season. J. Trop. Meteor. 2020, 26, 253–260. [Google Scholar]
  21. Li, C.; Zhou, W. Change in destructiveness of landfalling tropical cyclones over China in recent decades. J. Clim. 2017, 30, 3367–3379. [Google Scholar] [CrossRef]
  22. Zhou, M.; Kuang, Y.; Ruan, Z.; Xie, M. Geospatial modeling of the tropical cyclone risk in the Guangdong Province, China. Geomat. Nat. Haz. Risk. 2021, 12, 2931–2955. [Google Scholar]
  23. Hu, Y.; Song, L.; Liu, A. The comparison of climatic characters for tropical cyclone landfall over the different regions in China. Atmos. Sci. Res. Appl. 2008, 1, 1–8. (In Chinese) [Google Scholar]
  24. World Meteorological Organization (WMO). Atlas of Mortality and Economic Losses from Weather, Climate and Water Extremes (1970–2019); WHO: Geneva, Switzerland, 2021; pp. 62–65. [Google Scholar]
  25. Hu, Y.M.; Chen, Y.Z.; He, J.; Liu, S.J.; Yan, W.J.; Liang, Z.; Ming, W.; Zhi, L.; Juan, W.; Shao, D.; et al. Annual Frequency of Tropical Cyclones Directly Affecting Guangdong Province: Prediction Based on LSTM-FC. J. Trop. Meteor. 2022, 28, 45–56. [Google Scholar]
  26. Wen, G.H.; Liu, C.X.; Bi, X.Y.; Huang, H.J. A composite study of rainfall asymmetry of tropical cyclones after making landfall in Guangdong Province. J. Trop. Meteor. 2017, 23, 417–425. [Google Scholar]
  27. Chen, S.S.; Knaff, J.A.; Marks, F.D., Jr. Effects of vertical wind shear and storm motion on tropical cyclone rainfall asymmetries deduced from TRMM. Mon. Weather Rev. 2006, 134, 3190–3208. [Google Scholar] [CrossRef]
  28. Wingo, M.T.; Cecil, D.J. Effects of vertical wind shear on tropical cyclone precipitation. Mon. Weather Rev. 2010, 138, 645–662. [Google Scholar]
  29. Wang, Y.J.; Yin, Y.Z.; Song, L.C. Characteristics and Diagnosis of the Landfalling Tropical Cyclones in the Guangdong-Hong Kong-Macao Greater Bay Area of China during 1981–2018. J. Trop. Meteor. 2021, 27, 246–258. [Google Scholar]
  30. Yu, Z.; Wang, Y.; Xu, H. Observed rainfall asymmetry in tropical cyclones making landfall over China. J. Appl. Meteorol. Clim. 2015, 54, 117–136. [Google Scholar] [CrossRef]
  31. Ying, M.; Zhang, W.; Yu, H.; Lu, X.; Feng, J.; Fan, Y.; Zhu, Y.; Chen, D. An overview of the China Meteorological Administration tropical cyclone database. J. Atmos. Ocean. Technol. 2014, 31, 287–301. [Google Scholar] [CrossRef]
  32. Lu, X.Q.; Yu, H.; Ying, M.; Zhao, B.K.; Zhang, S.; Lin, L.M.; Bai, L.N.; Wan, R.J. Western North Pacific tropical cyclone database created by the China Meteorological Administration. Adv. Atmos. Sci. 2021, 38, 690–699. [Google Scholar] [CrossRef]
  33. Hersbach, H.; Bell, B.; Berrisford, P.; Hirahara, S.; Horanyi, A.; Munoz-Sabater, J.; Nicolas, J.; Peubey, C.; Radu, R.; Schepers, D.; et al. The ERA5 global reanalysis. Q. J. R. Meteorol. Soc. 2020, 146, 1999–2049. [Google Scholar] [CrossRef]
  34. Blackman, R.B.; Tukey, J.W. The measurement of power spectra from the point of view of communications engineering. Bell Syst. Tech. J. 1958, 37, 185–282. [Google Scholar] [CrossRef]
  35. Blackman, R.B.; Tukey, J.W. The measurement of power spectra from the point of view of communications engineering—Part II. Bell Syst. Tech. J. 2013, 37, 571–575. [Google Scholar] [CrossRef]
  36. Jenkins, G.M. General considerations in the analysis of spectra. Technometrics 1961, 3, 133–166. [Google Scholar] [CrossRef]
  37. Torrence, C.; Compo, G.P. A practical guide to Wavelet analysis. Bull. Am. Meteor. Soc. 1998, 79, 61–78. [Google Scholar] [CrossRef]
  38. Chan, J.C.L. Tropical cyclone activity over the western North Pacific associated with El Niño and La Niña events. J. Clim. 2000, 13, 2960–2972. [Google Scholar] [CrossRef]
  39. Chia, H.H.; Ropelewski, C.F. The interannual variability in the genesis location of tropical cyclones in the northwest Pacific. J. Clim. 2002, 15, 2934–2944. [Google Scholar] [CrossRef]
  40. Wang, B.; Chan, J.C.L. How strong ENSO events affect tropical storm activity over the western North Pacific. J. Clim. 2002, 15, 1643–1658. [Google Scholar] [CrossRef]
  41. Sobel, A.H.; Camargo, S.J. Influence of western North Pacific tropical cyclones on their large-scale environment. J. Atmos. Sci. 2005, 62, 3396–3407. [Google Scholar] [CrossRef]
  42. Lin, Y.; Zhao, M.; Zhang, M. Tropical cyclone rainfall area controlled by relative sea surface temperature. Nat. Commun. 2015, 6, 6591. [Google Scholar] [CrossRef]
  43. Tu, S.; Xu, J.; Chan, J.C.; Huang, K.; Xu, F.; Chiu, L.S. Recent global decrease in the inner-core rain rate of tropical cyclones. Nat. Commun. 2021, 12, 1948. [Google Scholar] [CrossRef] [PubMed]
  44. Rozoff, C.M.; Schubert, W.H.; McNoldy, B.D.; Kossin, J.P. Rapid filamentation zones in intense tropical cyclones. J. Atmos. Sci. 2006, 63, 325–340. [Google Scholar] [CrossRef]
  45. Wissmeier, U.; Smith, R.K. Tropical-cyclone convection: The effects of ambient vertical vorticity. Quart. J. R. Meteor. Soc. 2011, 137, 845–857. [Google Scholar] [CrossRef]
  46. Kilroy, G.; Smith, R.K. A numerical study of rotating convection during tropical cyclogenesis. Quart. J. R. Meteor. Soc. 2013, 139, 1255–1269. [Google Scholar] [CrossRef]
  47. Wang, X.; Jiang, H. A 13-year global climatology of tropical cyclone warm-core structures from AIRS data. Mon. Weather Rev. 2019, 147, 773–790. [Google Scholar] [CrossRef]
  48. Frank, W.M.; Ritchie, E.A. Effects of vertical wind shear on the intensity and structure of numerically simulated hurricanes. Mon. Weather Rev. 2001, 129, 2249–2269. [Google Scholar] [CrossRef]
  49. Wong, M.L.M.; Chan, J.C.L. Tropical cyclone intensity in vertical wind shear. J. Atmos. Sci. 2004, 61, 1859–1876. [Google Scholar] [CrossRef]
  50. Tang, B.; Emanuel, K. Midlevel ventilation’s constraint on tropical cyclone intensity. J. Atmos. Sci. 2010, 67, 1817–1830. [Google Scholar] [CrossRef]
  51. Corbosiero, K.L.; Molinari, J. The relationship between storm motion, vertical wind shear, and convective asymmetries in tropical cyclones. J. Atmos. Sci. 2003, 60, 366–376. [Google Scholar] [CrossRef]
  52. Xu, W.X.; Jiang, H.Y.; Kang, X.B. Rainfall asymmetries of tropical cyclones prior to, during, and after making landfall in south China and southeast United States. Atmos. Res. 2014, 139, 18–26. [Google Scholar] [CrossRef]
  53. Shan, K.; Yu, X. Variability of tropical cyclone landfalls in China. J. Clim. 2021, 34, 9235–9247. [Google Scholar] [CrossRef]
  54. Kossin, J.P.; Emanuel, K.A.; Vecchi, G.A. The poleward migration of the location of tropical cyclone maximum intensity. Nature 2014, 509, 349–352. [Google Scholar] [CrossRef] [PubMed]
  55. Sharmila, S.; Walsh, K.J.E. Recent poleward shift of tropical cyclone formation linked to Hadley cell expansion. Nat. Clim. Chang. 2018, 8, 730–736. [Google Scholar] [CrossRef]
Figure 1. Annual frequency of different classifications of TCs making landfall in Guangdong Province during 1951–2020. The numbers inside figure indicate the annual frequency of different classifications of TCs.
Atmosphere 13 01306 g001
Figure 2. Morlet wavelet energy spectrum: (a) and global wavelet spectrum; (b) of annual frequency of total TCs making landfall in Guangdong Province during 1951–2020.
Atmosphere 13 01306 g002
Figure 3. Monthly frequency of different classifications of TCs making landfall in Guangdong Province during 1951–2020. The numbers inside figure indicate the monthly frequency of different classifications of TCs.
Atmosphere 13 01306 g003
Figure 4. The cyclogenesis positions (ae) and tracks (generated over the SCS (fi) and NWP (ko)) of different classifications of TCs making landfall in Guangdong Province during 1951–2020. Total TCs (a,f,k); TDs (b,g,l); TSs (c,h,k); STSs (d,i,n); TYs (e,j,o).
Atmosphere 13 01306 g004
Figure 5. The frequency of TCs making landfall in western Guangdong, central Guangdong, and eastern Guangdong during 1951–2020.
Atmosphere 13 01306 g005
Figure 6. The composite sea level pressure (contour, 1 hPa interval) and 1 h accumulated precipitation (shaded, 1 mm intervals). The X and Y axes are distances in longitude and latitude (°) from the TC center: (a) TDs; (b) TSs; (c) STSs; (d) TYs.
Atmosphere 13 01306 g006
Figure 7. The composite south–north vertical cross section of vertical velocity (shaded, units: Pa·s−1) and its anomaly between the different classifications of TCs and total TCs (contour, 0.2 Pa·s−1 intervals). The X axis is the distance in latitude (°) from the TC center (north is positive): (a) TDs; (b) TSs; (c) STSs; (d) TYs.
Atmosphere 13 01306 g007
Figure 8. The composite vertical integral of moisture flux (shaded, units: g·m−2·s−1) and its anomaly between the different classifications of TCs and total TCs (contour, 0.2 g·m−2·s−1 intervals). The X and Y axes are distances in longitude and latitude (°) from the TC center: (a) TDs; (b) TSs; (c) STSs; (d) TYs.
Atmosphere 13 01306 g008
Figure 9. As in Figure 7, but for the composite warm core of different classifications of TCs (shaded, units: °C) and its anomaly (contour, 0.2 °C intervals). The warm core is defined as the temperature anomaly between the TC center and the average environmental temperature of the surrounding area (10° × 10° box) at the same level: (a) TDs; (b) TSs; (c) STSs; (d) TYs.
Atmosphere 13 01306 g009
Figure 10. As in Figure 8, but for 200–850 hPa composite vertical wind shear (units: m·s−1) and its anomaly (contour, 1 m·s−1 interval): (a) TDs; (b) TSs; (c) STSs; (d) TYs.
Atmosphere 13 01306 g010
Table 1. The overall characteristics of different categories of TCs making landfall in Guangdong Province during 1951–2020.
CategoriesTotal TCsAverage Landfall Intensity (m·s−1)Maximum Lifetime Intensity (m·s−1)Lifetime Duration (h)On-Land Duration (h)
Total TCs234223517029
TDs46132212529
TSs52183216030
STSs72253717029
TYs64335020027
Table 2. Average duration of different classifications of TCs generated over the WNP and the SCS during 1951–2020.
Generated Area Total TCsTDsTSsSTSs≥TYs
WNPLifetime duration (h)181139174180205
On-land duration (h)2626272626
SCSLifetime duration (h)129106123139143
On-land duration (h)3632404133
Publisher’s Note: MDPI stays neutral with regard to jurisdictional claims in published maps and institutional affiliations.

