Abstract
For space-based atmospheric wind measurements, full-link simulation is critical for the optimization of the instrument indicators and the evaluation of the measurements’ performance. This paper presents observation simulations and error verification of the mesosphere wind measurement with four emission lines of the O2(0-1) band by using the space-based Doppler Asymmetric Spatial Heterodyne (DASH), named the Mesosphere Wind Image Interferometer (MWII). The passive wind measurement principle and the DASH concept are first described. The full-link simulation consists of radiation simulation, the instrument forward model, and the wind retrieval model. The four emission lines at about 866.5 nm of the O2(0-1) band were selected as the observation targets. The radiation characteristics of the target lines were studied and calculated, as well as the background radiation. Based on the LOS radiation integral model, a numerical simulation of the raw observation data was carried out using the instrument model. The interference fringe priority strategy and joint wind decision method were proposed to achieve multiple-emission-line wind retrieval with higher precision. In the simulation, multiple-line retrieval could improve the precision by more than 30% compared to single-line retrieval under the same conditions. The error simulation indicated that the wind profile precision was 3–9 m/s in the altitude range of 50–110 km, with an average accuracy of about 1 m/s, proving that the scheme of MWII has good altitude coverage of the whole mesosphere and a part of the lower thermosphere.
1. Introduction
The mesosphere is the region between the stratopause and the thermosphere. As the link between the upper and lower atmospheres, the mesosphere plays a connecting role in the coupling mechanism of the various circles in the sun–terrestrial space and has become an important object in space and atmospheric physics research. As a critical parameter of atmospheric dynamics, the wind directly affects the occurrence and evolution of various physical processes in the mesosphere, and also affects the transport of momentum, energy, and components between the lower and upper atmospheres [1]. In addition, as the pass-through and residence area of various orbiting spacecraft and hypersonic vehicles, the wind of the mesosphere directly influences the efficiency of flight control and space launching [2]. Therefore, mesosphere atmospheric wind field observation is of great value to space and atmospheric physics research and related aerospace applications.
At present, atmospheric wind measurement mainly relies on the meteor radar [3], the Doppler LIDAR [4], and the airglow interference technique [5]. Among these, the airglow interference technique has been widely used as the space-based payload by which to obtain the global-scale atmospheric wind field due to its good aerospace adaptability [6]. The interferometer for atmospheric wind measurement mainly includes three types of structures: the Fabry–Pérot Interferometer (FPI) [7], the Michelson Interferometer (MI) [8], and the Doppler Asymmetric Spatial Heterodyne (DASH) [9]. The FPI technique was applied to the High-Resolution Doppler Imager (HRDI) [10] of the Upper Atmosphere Research Satellite (UARS) and the TIMED Doppler Interferometer (TIDI) [11] of the Thermosphere–Ionosphere–Mesosphere Energetics and Dynamics (TIMED) satellite. The HRDI observed the emission and absorption line of O2 molecules to measure the vector wind from the stratosphere (10 to 40 km) to the mesosphere and lower thermosphere (50 to 120 km). The TIDI measured the wind of the mesosphere and lower thermosphere–ionosphere (MLTI) from an altitude of 60 to 300 km using O2 molecule and O atom emission lines. The Wind Imaging Interferometer (WINDII) [12], a wide-angle Michelson interferometer, on the UARS measured the wind of the mesosphere and thermosphere using the red line (630.0 nm) and green line (557.7 nm) of the O atom. Based on the satisfying performance of the WINDII, the Stratospheric Wind Interferometer for Transport studies (SWIFT) [13] with the MI technique was proposed to measure the wind from 24 km to 60 km with the ozone emission line at 1133.4335 cm−1. The SWIFT was not able to completely accomplish this due to the difficulty of single emission line isolating components, and it transformed its instrument structure to that of DASH [14]. The Michelson Interferometer for Global High-Resolution Thermospheric Imaging (MIGHTI) [15] of the Ionospheric Connection Explorer satellite (ICON) [16] is based on the DASH technique and focuses on the wind of the thermosphere at an altitude of 80–300 km.
As a new wind interferometer structure proposed in recent years, DASH implements the equal thickness interference, producing the parallel interference fringe [17]. Compared with the iso-inclined interference of FPI and MI, DASH requires less precision for optics components due to differences in interference types [18]. More importantly, the input spectrum and interferogram of DASH form a Fourier transform relationship, so DASH does not require the extremely narrow filter to isolate the target emission line [19]. Additionally, DASH with appropriate spectral resolution can observe multiple emission lines simultaneously by Fourier spectral transform. MIMI [20] and WAMI [21] can also achieve multiple-lines observation simultaneously by the wavelength modulation of the FP filter. The different angles of incidence have different transmission functions, making different areas of the detector receive different emission lines’ radiation. While compared with DASH, this structure cannot make each line cover the whole altitude range and also loses the amount of valid data. Therefore, DASH is more adaptable for observation targets with multiple emission line structures [22]. The above characteristics significantly increase the efficiency and applicability of DASH, making DASH suitable for the atmospheric wind measurement, especially for the multiple lines structure target.
For the mesosphere wind measurement, various target airglows have differentiated altitude coverages and application performances. Based on the ozone emission line at 1133.4335 cm−1, the wind at the bottom of the mesosphere can be observed with high instrument costs [23]. The green line (557.7 nm) of the O atom can only achieve wind at the mesopause at about 80 km above [24]. O2(a1△g) dayglow near 1.27 µm is suitable for mesosphere wind measurement with an altitude ranging from 30 km to 90 km [25], whereas self-absorption and SWIR band interferometer development are still significant obstacles [26]. The emission line of O2(0-1) vibrational bands is of bright radiance and good transmissions within the mesosphere’s altitude range [27]. Therefore, the emission line of the O2(0-1) band could be a proven path for mesosphere wind measurement.
For the wind measurements in the middle atmosphere, the available observation sources, including those described above, are all characterized with narrow spacing multi-emission-lines structures [14,21], which impose higher instrument specifications, process difficulties, and development costs based on the traditional wind measurement scheme, which uses extremely narrow filter to achieve the single emission line observation. In order to expand the feasibility of passive interference technology in the field of middle-atmosphere wind measurement, reducing the instrument development process and cost and improving the measurement precision, it is important to explore how to achieve a high performance simultaneous multi-emission line measurement scheme.
This study is based on the DASH technique, due to its sampling characteristics satisfying the Fourier transform relation, which is able to obtain the input spectrum by interferogram recovery to achieve effective multiple emission lines wind measurement with low instrumental cost. As the adoption of a multiple-emission-line wind measurement scheme, the existing method cannot satisfy the demands of the new scheme’s observation data retrieval. It is also significant to construct a space-based wind retrieval strategy for multi-lines observation based on the DASH concept.
In this paper, we propose a space-based technical solution for the measurement of the atmospheric wind by employing a DASH interferometer to observe the four emission lines of O2(0-1) vibrational bands at about 866.5 nm, which is named the Mesosphere Wind Image Interferometer (MWII). According to the DASH concept, the MWII could synchronously observe the multiple emission lines in the target band. Based on basic principles of DASH, the multiple-emission-line retrieval strategy is proposed to separately obtain the wind speed information of each line. Lastly, the joint wind decision method is proposed to achieve higher wind retrieval precision through the multiple lines wind retrieval result. Section 2 describes the basic principles and observation mode of space-based DASH for wind measurement. The radiation and transmission characteristics of the target dayglow and background radiation are described in Section 3. Section 4 describes the forward model and noise model of the MWII, and then the expected observation interferogram is also described and analyzed. The multiple-emission line retrieval strategy and the wind measurement error performance are expressed and discussed exhaustively in Section 5. The analysis of the simulation result and the comparison with a similar study is shown in Section 6. Section 7 outlines the conclusions of the full paper.
2. Measurement and Instrument Concept
The passive interferometer observes the Doppler frequency shift of the airglow, which is caused by the atmospheric motion to achieve the wind measurement. For the interferometer, a shift of the airglow emission line would result in a change in the interferogram frequency. Figure 1 gives the schematic diagram of the Doppler shift of the emission line and the interferogram frequency change.
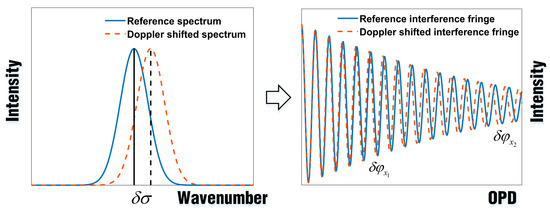
Figure 1.
Schematic diagram of the Doppler shift of the emission line and the interferogram frequency change.
According to the interferogram frequency measurement, the Doppler shift can be calculated and the wind speed can be obtained. However, the wavelength shift of the target emission line caused by the wind speed being very small, at the level of about tens of femtometers. Therefore, the interferogram frequency change is also very small under the small optical path difference (OPD). Additionally, with the increase in the OPD, the frequency changes predominantly appear as phase shifts, which can be much more effectively measured. The relationship among the wind speed, the Doppler frequency shift, and the phase shift is described as follows in Equations (1) and (2):
where is the atmospheric wind speed, is the wavenumber shift caused by the atmospheric motion, is the nominal wavenumber of the emission line, is the phase shift of the interferogram, is the OPD corresponding to the interferogram, and is light speed in a vacuum.
In order to achieve high wind measurement sensitivity, various structures of wind interferometers, including DASH, collect interference signals under a large OPD [28]. DASH is essentially a kind of Spatial Heterodyne Spectroscopy (SHS), which achieves an asymmetric structure by introducing an additional optical path offset in one arm of the interferometer [29].
MWII, based on DASH, utilizes a limb-viewing mode to observe the atmospheric radiation signals from different altitudes for the wind profile measurement. Based on an orbit altitude of 500 km, the field of view is precisely designed to ensure an altitude coverage from 50 km to 110 km. The limb-viewing observation signal is the integral of airglow radiation from different altitude. The integral airglow radiation from different tangent altitude enters the MWII with different angles, causing the interference signals of different altitude to be acquired separately. Based on the retrieval method, the wind information of the tangent area could be peeled off from the integral signal to achieve the wind profile measurement. The limb-view observation geometry is shown in Figure 2.
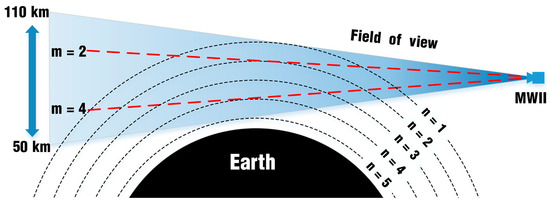
Figure 2.
Limb-view observation geometry of the MWII. The red line is the line-of-sight of corresponding altitude to the tangent point, and the blue area represents the altitude coverage of MWII.
The passive wind measurement interferometer can only obtain the line-of-sight (LOS) wind speed by a single observation from one direction. In order to achieve the vector wind field measurement, it is necessary to observe from at least two different directions, preferably orthogonal. Therefore, the MWII has two nearly orthogonal fields of view (FOV1 and FOV2) to obtain the vector wind field. After FOV1 observes the mesosphere of a specific area, through the movement of the satellite, FOV2 makes a second observation of the same area from a direction orthogonal to the first observation after about 10 min. The orthogonality of the two observations is guaranteed by the observation geometry design without the need for satellite attitude adjustment.
3. Target Airglow and Background Radiation Characteristics
3.1. Target Airglow Radiation Characteristics
The O2(0-1) band of the is widely applied for wind and temperature measurements due to its good radiation coverage and atmospheric transmittance [30]. The O2(0-1) band involves dozens of relatively separated emission lines, which are suitable for wind measurements based on the DASH interferometer due to its advantages in multi-line observation. Figure 3 shows the spectral volume emission rate (VER) and two emission line radiance profiles of O2(0-1) dayglow. The dayglow radiation simulation is applied at 23 September 2021 with the location at latitude 70 degrees south, longitude 65 degrees west. For the spectral characteristics, the emission lines show pairwise features with pair-internal intervals of about 0.15 nm, so it is difficult and costly to isolate a single emission line for wind measurement using the filter component. For radiation intensity, the altitude range of 40 km to 60 km has a relatively strong VER. The intensity above 60 km remains at a relatively low level, but an extreme value appears around 100 km. The intensity decays rapidly below 40 km and above 100 km.
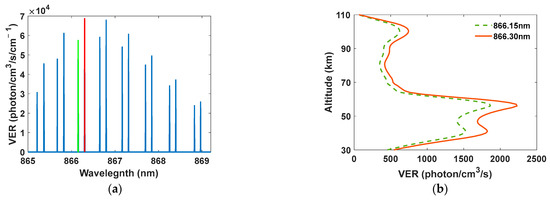
Figure 3.
The spectral and VER profile characteristics of O2(0-1) dayglow. (a) The spectral characteristics of the O2(0-1) dayglow with the wavelength range of 865 nm to 869 nm at 60 km. (b) The VER profile of the emission lines at 866.65 nm and 866.30 nm. The red line and the green line in Figure 3a are the 866.15 nm and the 866.30 nm emission line respectively, corresponding to the Figure 3b.
For the limb-view mode, the observation radiance spectrum of the O2(0-1) is calculated by a path integral along the LOS. For computational convenience, the path integral can be converted to accumulation by applying spherical symmetry with many uniform discrete thin layers [31] Therefore, the LOS integral radiance spectrum can be converted as follows in Equation (3):
The limb-view spectral radiance can be obtained by summing the atmospheric airglow radiation from each layer on the LOS path, as shown in Figure 2, where is the LOS integral spectral radiance and the tangent is located at layer m; is the spectral VER with a nominal wavenumber (without Doppler shift); is the wavenumber shift cause by the horizontal wind at layer n; is the angle between the horizontal wind direction of layer n and the LOS direction of layer m; is the atmospheric optical length of the layer n in the LOS direction of layer m; and is the Planck’s constant. Each part of the atmosphere is considered to uniformly radiate within solid angles.
In this paper, the limb-viewing simulation considers the radiance from 50 km to 110 km. Figure 4 shows the LOS integral radiance profile of two emission lines at 866.15 nm and 866.30 nm. The LOS integral radiance of a specific line is obtained by calculating the integral of the wavelength integral, with a 0.1 nm range of the LOS integral spectral radiance. The LOS integral radiance of each emission line is one of the core factors affecting the strength of the effective interference signal and is also directly related to the precision of wind measurement. With the decrease in altitude, the LOS integral radiance continues to rise as the total atmospheric optical length continues to increase.
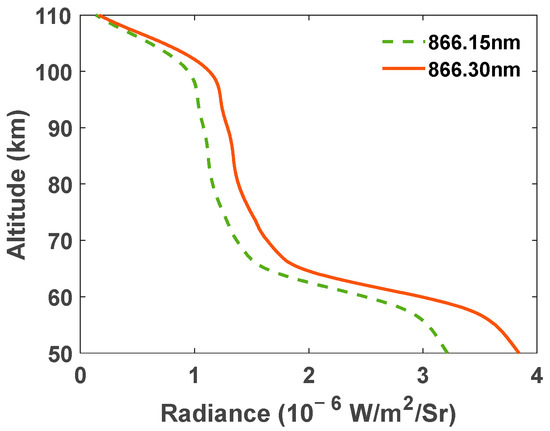
Figure 4.
LOS integral radiance of two emission lines.
3.2. Background Radiation Characteristics
The background radiation in the field of view enters the interferometer together with the airglow radiation, which directly suppresses the contrast and noise level of the interferogram and further affects the precision of the wind measurement. It is a significant factor that must be considered in error analyses.
In the limb-view observation mode, the background radiation in the FOV is mainly the atmospheric radiation signal, which could be divided into three contributing factors: solar atmospheric scattered radiation, thermal radiation of the optomechanical system, and atmospheric path thermal radiation. As the MWII works in the near-infrared band, the thermal radiation of the atmosphere and optomechanical system can be ignored. For the atmospheric scattered radiation, single scattering and multiple scattering are considered separately based on the Moderate Spectral Resolution Atmospheric Transmittance Algorithm and Computer Model (MODTRAN) [32].
This paper mainly considers the background radiation in the field of view, and the simulation starts from 50 km and ends at 100 km, as the higher-altitude background radiation is weak enough to be ignored. In the simulation, the condition of latitude, longitude, and local time is the same as the airglow radiation simulation, and the aerosol type is ‘Rural-VIS = 23 km’ and the ground surface type is forest, allowing the simulation settings to cover a typical situation. The background radiance profile is shown in Figure 5.
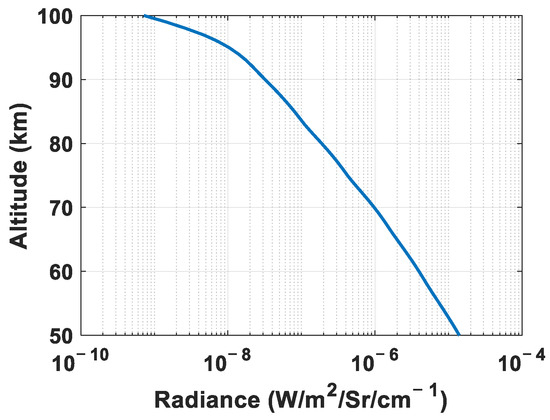
Figure 5.
The simulation result of the background radiance profile.
The background radiance increases exponentially with a decreasing altitude. Therefore, the wind measurement performance at low altitudes would be significantly affected due to the strong background radiation.
4. Instrument and Forward Simulation
4.1. Instrument Structure and Parameters
The MWII is a DASH interferometer with dual-FOV simultaneous observation capability. It mainly consists of a dual field of view telescope, an FOV coupling system, a relay lens, a DASH interferometer, a calibration component, a fringe imager, and a detector component. Figure 6 shows the schematic diagram of the MWII.
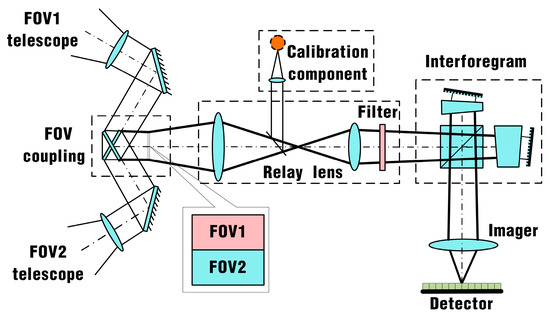
Figure 6.
Schematic diagram of the Mesosphere Wind Image Interferometer (MWII).
Airglow signals from the orthogonal directions enter the MWII through two telescopes, respectively. Both telescopes are designed with the FOV of 1.43° × 3.05° to ensure that the MWII can cover altitudes in the range of 50–110 km. The FOV coupling component, which is set up at the primary image plane, integrates the two directions’ observation signals into a form of splicing up and down. The relay component introduces the calibration signal, which involves the emission line of an argon gas discharge lamp, into the FOV coupled signal. Then, the integrated signals enter the interferometer through the filter after collimation. The filter is applied to suppress background radiation and separate target spectral lines. The interferometer converts the input signal into a straight fringe interference signal and projects it to the detector through the fringe imager to obtain the interferogram. The MWII performs one-dimensional imaging along the altitude direction to ensure that the atmospheric signals from different altitudes correspond to the different lines of the interferogram so that the wind profile can be retrieved. The basic parameters of the MWII are shown in Table 1.

Table 1.
The basic parameters of the MWII.
4.2. Forward Model
The forward model of the MWII is constructed to simulate the pixel-level raw interferogram, which is the foundation of the instrument’s performance evaluation and error analysis. The forward model can be divided into two parts: the interferogram intensity simulation and the noise simulation.
4.2.1. Interferogram Intensity Simulation
The interferogram intensity simulation consists of the atmospheric radiation module, the phase model of DASH, and the responsivity model of the instrument.
The raw interferogram observed by the MWII can be expressed as Equation (4), as follows:
where is the interferogram detector electrons; and are the column and row numbers of the detector, which represent the different OPD and different altitude signals, respectively; is the input LOS integral spectral radiance including target airglow and background radiation of layer m, corresponding to the row y of detector; is the wavenumber of the spectrum; and is the visibility of the DASH interferometer, which represents the interference efficiency.
is the wavenumber responsivity function of the optical system, which can be written as in Equation (5):
where F is the f-number; is transmittance of the beam splitter; is the transmittance of the optical system; is the transmittance function of filters; is the efficiency of the grating; and are the pixel length and the quantum efficiency of the detector, respectively; and is the exposure time, which is highly correlated with the horizontal spatial resolution of the measurement. As the spectral band range of MWII is narrowed to 1 nm, the transmittance and efficiency of the optical components and the detector can be treated as contrasting.
is the phase function corresponding to the sampling position of the detector [33], which can be written as in Equation (6):
where is sampling position of the detector, and the intersection of the optical axis and the detector plane is defined as the reference position, which is ; and are the Littrow wavenumber and the angle of the grating, respectively; is the magnification of the fringe imager, which influences the relationship between the sampling position and OPD; and is the offset of the interferometer, causing the MWII to be more sensitive to the variation in the Doppler shift.
4.2.2. Noise Simulation
For the raw interferogram, random noise is the most significant factor influencing the precision of the wind measurement. In this study, shot noise, readout noise, and quantization noise were taken into consideration for the simulation. The root-mean-square (RMS) of the random noise, , is shown in Equation (7):
where is the RMS of the shot noise, which is equal to the root of ; is RMS of the read-out noise, which is shown in Table 1; and is the RMS of the digitization noise, as shown in Equation (8).
where is full well electrons and is quantization bits. Additionally, the dark current is also considered, which is the product of the dark current coefficient and the exposure time.
Based on the simulation of interferogram intensity and its noise, the raw interferogram was obtained for the follow-up performance evaluation and wind retrieval.
4.3. Raw Interferogram Simulation and Evaluation
The target airglow and background radiance used in the simulation are shown in Section 3. The filter with an FHWM of 1 nm could precisely isolate four emission lines, as Figure 7 shows. The four emission lines were selected due to their satisfying radiance characteristics.
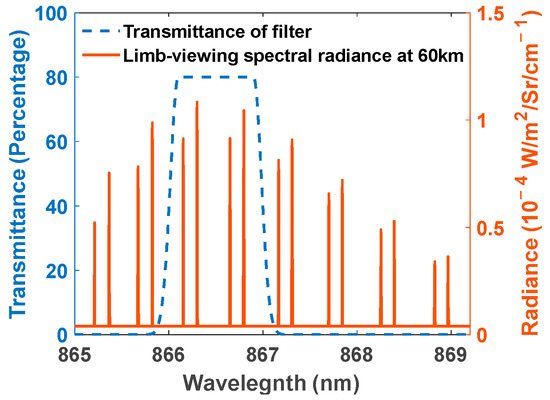
Figure 7.
Spectral characteristics of the filter and target airglow.
Since the observation tracks of the two FOV were consistent, the simulation was carried out for only one FOV. The simulated raw interferogram is shown in Figure 8. The horizontal direction of the detector is the interference dimension, which characterizes the interference intensity under different optical path differences. The vertical direction is the spatial dimension, which represents the interference intensity at different altitudes of tangent points. Affected by background radiation, the interferogram intensity increased significantly with the decreasing altitude. The MWII observed four emission lines simultaneously, so the interference fringes exhibited the phenomenon of multi-frequency coupling. Figure 9 shows the interference fringes at the tangent altitude of 60 km.
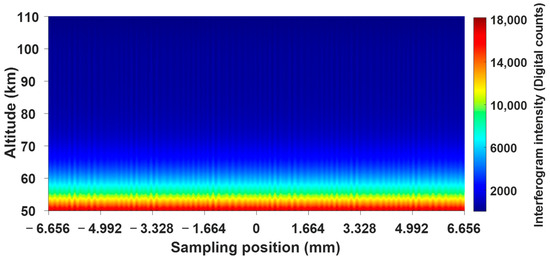
Figure 8.
Single-FOV simulation interferogram.
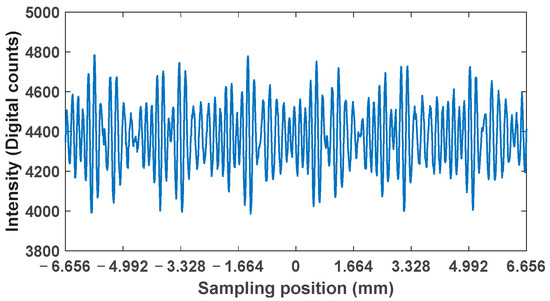
Figure 9.
Interference fringes at the tangent altitude of 60 km.
Figure 10 gives the results of the three quantitative evaluation indexes. The signal-to-noise ratio (SNR) reflects the overall signal and its corresponding noise intensity level. The lower altitude shows higher SNR due to the background radiation. However, the background radiation did not contribute to the wind measurement. In order to evaluate the wind measurement’s effective SNR, the fringe—which is defined as the ratio of the interference fringe amplitude to the signal baseline intensity—was introduced. With the decrease in altitude, the stronger background radiation resulted in a lower contrast. By multiplying the SNR with the contrast, the relative precision coefficient (RPC) can be obtained, which is inversely proportional to LOS integral wind measurement precision value [34]. As shown in Figure 10c, the RPC reached its peak at about 90 km. The RPC decreased rapidly with increasing altitude and decreased slowly with decreasing altitude.

Figure 10.
The results of the quantitative evaluation index profiles with altitude. (a) The SNR profile. (b) The fringe peak contrast profile. (c) The relative precision coefficient profile.
5. Retrieval Strategy and Error Verification
For the wind retrieval of the space-based DASH, there are two key aspects to be considered: retrieval from the LOS integral signal to target the tangent altitude signal and retrieval from the interference fringe to wind speed.
The existing retrieval strategy puts the decomposition of the LOS integral signal ahead of the interference fringe retrieval [35]. As Equation (3) shows, the LOS integral radiance can be expressed as the weighted sum of the VER from the top layer to the tangent layer with the atmospheric optical length as the weight coefficient, and the interferogram can also be expressed in the same form. The existing retrieval strategy first carries out LOS integral signal decomposition in the interference domain, peeling off the influence of the upper atmospheric interference fringes on the lower interference fringes layer by layer, from top to bottom, according to the radiance intensity and atmospheric optical length. Then, the interferogram of each layer can be obtained, which only includes the tangent area’s atmospheric signal. According to the retrieval of the decomposed interferogram, the wind profile can be obtained.
However, the existing retrieval strategy cannot be directly migrated to the multiple-line retrieval strategy. The existing strategy is oriented to single-line observation scenarios. For a multiple-line input, the radiance variation with altitude of each spectral line tends to be different, resulting in different weight coefficients for each line in their integrated signals. Therefore, it is impossible to decompose the integral signal in the interference domain by using a uniform weight coefficient.
5.1. Wind Retrieval Strategy for Multiple Emission Lines
This paper proposes the multiple-emission-line retrieval strategy based on the interference fringe retrieval priority, making each line have an independent weight coefficient, respectively. Thus, each emission line can be independently retrieved to obtain the wind. The specific process is shown in the following Figure 11.
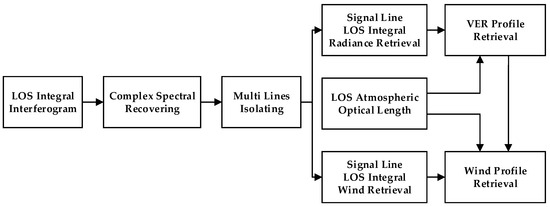
Figure 11.
Multiple-emission-line retrieval strategy flow chart.
The proposed strategy first recovers the integral interferogram and obtains the inversion complex spectrum. Each spectral line is extracted by the corresponding window function, and then its integrated radiance and wind speed are inverted, respectively. Lastly, combined with the atmospheric optical length, the VER profile and the wind speed profile are sequentially retrieved.
The interferogram of multiple emission lines can be written in the form of emission-line superposition, as shown in Equation (9).
where is the intensity term of the line j; is the interference efficiency term; is the interference frequency term; is the additive phase; and is the phase shift resulting from the Doppler shift of each line.
Based on the discrete Fourier transform, the complex spectrum can be recovered from the interferogram [9]. The modulus of the complex spectrum is shown in Figure 12.
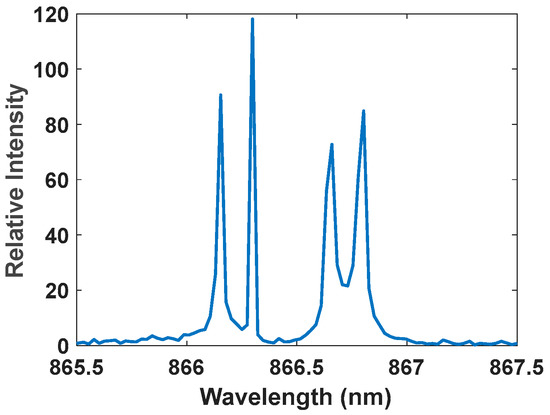
Figure 12.
The recovered spectrum.
The window function is applied to isolate each line, and then the relative LOS integral intensity can be obtained from the recovered spectrum. According to relative LOS integral intensity corresponding to each altitude, the LOS integral radiance can be determined with the support of pre-acquired radiometric calibration parameters.
In order to retrieve the LOS integral wind, the inverse discrete Fourier transform is applied to the isolated complex spectrum of each line, thereby achieving the complex interferogram, as shown in Equation (10).
The interferogram phase, , can be obtained by calculating the arctangent of the ratio of the imaginary part and the real part at each sampling position of the complex interferogram. By the subtraction of which is called the reference phase, , caused by the Doppler shift of the wind, can be achieved. According to Equations (1) and (2), the LOS integral wind can be calculated.
Based on the uniform spherical symmetry model, the VER profile can be retrieved from the top layer to the bottom layer, as follows in Equation (11), where is the radiance of line j at layer m.
According to the phase characteristics of DASH, the LOS integral wind could be considered as the weighted sum of the wind from the top layer to the tangent layer with the VER and atmospheric optical length as the weight coefficient. Therefore, the wind profile can be expressed as in Equation (12):
where is the LOS wind speed at layer m, and is the LOS integral wind speed at layer m.
In order to evaluate the error of the MWII with the proposed retrieval strategy, the simulation was carried out based on the raw interferogram and the noise level shown in Section 4. Under the constraints of the same noise model, the simulation was performed 10,000 times using the Monte Carlo method to evaluate the accuracy and precision of the full link.
Figure 13 gives the results of the accuracy verification. Figure 13a is the input LOS wind profile from the horizontal wind model (HWM). Figure 13b is the wind retrieval accuracy of the four emission lines. The accuracy data were derived from the comparison of the average of multiple measurements with the input wind speed. The altitude average accuracy values of the four emission lines were 1.20 m/s, 1.01 m/s, 1.18 m/s, and 1.02 m/s, respectively. The accuracy of the wind speed measurement at altitudes around 80 km was the worst, at −4 m/s.
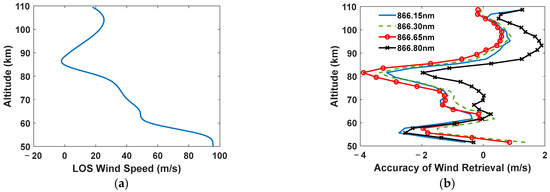
Figure 13.
The input wind speed of the simulation and the wind retrieval accuracy of the four lines. (a) The input LOS wind speed involved in the simulation. (b) The wind retrieval accuracy profile of the four emission lines.
Figure 14 gives the precision of the four emission lines. The line at 866.30 nm had better precision than the other three due to its better relative radiance and isolation, as shown in Figure 12. Limited by the radiance of the observation target and background radiation interference, no emission line achieved an acceptable precision individually, which generally needs to be at least 10 m/s.
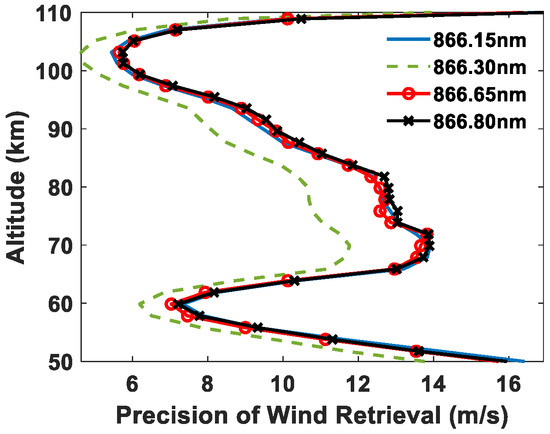
Figure 14.
The wind retrieval precision of the four lines.
5.2. Multiple-Emission-Line Joint Wind Decision Method
For the multiple-emission-line observation, each emission line measures the wind speed of the same area of the atmosphere. Therefore, the true values of the measurement results are the same. However, the radiance profile of each emission line is different, so the emission lines are under different noise levels, resulting in every emission line having different wind measurement precisions. Based on the white noise characteristics, the wind measurement results of each emission line should statistically conform to a normal distribution with the same mean but different variances. Based on the precision estimation of each emission line, a joint decision-making model based on the minimum error expectation principle is constructed as shown in the following Equation (13), which can effectively improve the final wind speed measurement precision.
where is the joint wind measurement result of layer m; N is the total number of the involved lines; is the wind measurement result of the jth emission line at layer m; and is the wind measurement precision of the kth emission line. For a specific single measurement, the precision of the emission line can be estimated based on its recovering spectral intensity and the noise model described in Section 4.2.2 and Section 5.1. The joint decision-making model is based on the minimum variance combinatorial theory, making the joint’s result better than any individual line’s result, and the precision of the joint wind measurement is shown in the following Equation (14).
where is the precision of joint wind measurement result of layer m.
Figure 15 gives the joint wind measurement precision and a comparison with the individual highest precision of the four emission lines. The joint method was found to significantly improve the wind measurement precision performance. The wind measurement precision of altitude average is improved from 8.67 m/s to 5.97 m/s, which is more than 30%. The highest precision value was less than 4 m/s at about 105 km. For the altitude from 50 to 110 km, the precision value was in the range of 3–9 m/s, proving the efficiency of the joint wind measurement method.
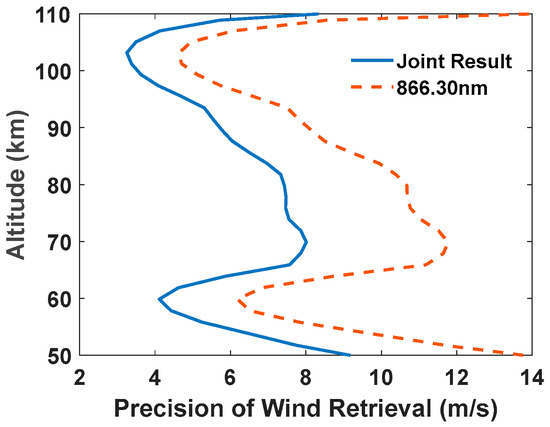
Figure 15.
Comparison of the wind retrieval precision of the joint method and the best single line (866.30 nm).
In order to further verify the precision performance of the joint method, a single-emission-line wind measurement simulation was conducted based on the forward model and retrieval strategy of this paper. In the additional simulation, the FWHM of the filter reduced from 1 nm to 0.15 nm, optically isolating the brightest emission line in the band shown in Figure 16a. The performance comparison of the proposed joint method and the single-line isolating scheme is shown in Figure 16b. Overall, the precision of the two methods was found to be comparable.
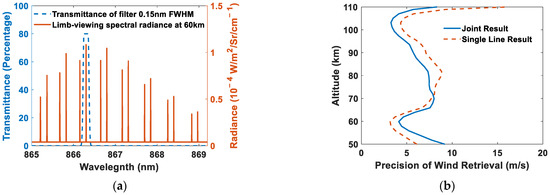
Figure 16.
Single-emission-line filtering characteristics and retrieval precision comparison with the proposed joint method. (a) Spectral characteristics of the narrow filter and target airglow. (b) Comparison of the wind retrieval precision of the joint method and the single-line isolating scheme.
6. Discussion
Based on the full-link numerical simulation, the accuracy and precision performance of MWII are shown in Figure 13, Figure 14, Figure 15 and Figure 16. Figure 13 shows the accuracy profile. This deviation is mainly attributed to the observation geometric model’s error caused by pixel binning in the altitude direction. The input radiance with wind information is generated with an altitude resolution of 0.125 km, which corresponds to the pixels’ altitude resolution, whereas, in the retrieval, the 16 pixels in the altitude direction are binned as one data point in order to achieve better precision performance. Therefore, the system deviation of the atmospheric optical length, VER and wind was brought into the retrieval due to the average effect. The more rapidly changing the wind, the worse the wind accuracy of retrieval performance, resulting in the worst accuracy performance appearing in the altitude range of 80–90 km. By reducing the number of pixel binning, the average effect can be significantly lower, improving the accuracy performance. Meanwhile, with the less binned pixels, the SNR of the retrieval data also be reduced, resulting in worse performance in precision. Therefore, the accuracy and the precision need to be trade-offs and compromises with each other.
The precision performance of MWII is shown in Figure 14 and Figure 15. The precision is mainly influenced by the radiance of the observation target and background radiation. At relatively high altitudes, the dark radiance of the observation target limits the wind measurement precision, whereas at relatively lower altitudes, the background radiation is the core reason for the decrease in precision according to lower the contrast of interferogram. In addition, the peeling off retrieval used in this study also further reduces the precision at lower altitudes. The altitude range of 65–85 km appears to be a lower precision when compared with those at 60 km and 100 km, which is because of the lower radiance, shown in the Figure 3b.
Figure 16 gives the precision comparison with traditional single-line observation with the proposed multiple-emission-line observation. The proposed method performed better at relatively higher altitudes due to its better radiation utilization capability for dark inputs. The traditional single-line scheme achieved higher precision at lower altitudes due to the stronger background radiation suppression capability. Considering the difficulty and costs of an extremely narrow filter, the proposed multiple-emission-line scheme has obvious advantages for applicability.
In this study, the MWII performed good altitude coverage and measurement precision in the mesosphere wind measurement. There are some other mesosphere wind measurement schemes which can carry out further comparative studies with MWII.
The TIDI is a well-known wind measurement payload. TIDI also utilizes the O2(0-1) band with the line at 867.13 nm for the mesosphere wind measurement, and the average precision is reported as 7.8 m/s [27]. The MWII has better precision performance than TIDI as the multiple-line joint measurement capability and has lower hardware requirements in the filter. The WAMI is also a wind measurement targeting the mesosphere. WAMI uses two sets of lines within the O2(a1△g) band to measure the wind at altitudes of 60–100 km and 45–75 km, respectively, and the precision is reported as 3–5 m/s [21]. WAMI preforms better precision than MWII as the much brighter observation target. In general, the emission line in O2(a1△g) band is an order of magnitude brighter than that in O2(0-1) band. In terms of instrument cost, MWII achieves similar altitude coverage to WAMI with only one set of lines. In addition, WAMI involves two etalons with the bandwidth of 0.1 nm and 0.13 nm to isolate the line sets. Our research group has also explored the mesosphere wind measurement based on the single emission line of the O2(a1△g) band. The emission line the O19P18 (1286.7 nm) of O2(a1Δg) band is involved for the altitude range of 30–80 km wind measurement with the precision of 2–10 m/s [26]. When compared with MWII, the scheme with O2(a1Δg) band has better precision in altitude range of 50 to 70 km but worse from 80 to 110 km. Additionally, the fewer development difficulties and lower costs of the NIR band interferometer make MWII more acceptable than the SWIR band instrument.
According to the comparison with other mesosphere wind measurement schemes, MWII preforms better altitude coverage with acceptable measurement precision. In addition, due to the innovative multiple-emission-line measurement strategy, the difficulty and cost of instrument development have been effectively controlled, which makes MWII competitive in the field of mesospheric wind measurement.
7. Conclusions
A new mesosphere wind measurement scheme is proposed in the article, called MWII. The MWII carries out mesosphere wind measurements using the DASH technique. Based on the advantage of DASH being able to achieve multi-line simultaneous observation, four emission lines of the O2(0-1) band were selected as the target airglow in the MWII. In order to achieve the multiple-emission-line wind retrieval, we propose a retrieval strategy with the idea of interference fringe retrieval priority, allowing for each line to have the independent weight coefficient, respectively, based on the recovered spectrum, and achieving respective wind retrieval for each emission line. Based on the multiple-line wind retrieval results with different precision levels, a joint wind decision model with minimum error expectation was constructed to achieve higher precision wind measurement. The numerical simulation, including airglow and background calculation, the instrument forward model, and the proposed wind retrieval method, was performed to verify the performance of the MWII.
The simulation results indicated that the multi-line retrieval strategy can obtain the wind speed correctly with an accuracy of about 1 m/s. Moreover, the joint wind decision model can significantly improve the precision performance when compared with any other single-line result, achieving a wind measurement precision of 3–9 m/s at the altitude range of 50–110 km. The precision results indicate that the MWII can both cover the whole altitude of the mesosphere and also provide wind measurement capability in the lower thermosphere. According to the performance comparison with the scheme with an extremely narrow filter, the MWII is proven to have comparable observational performance but with lower instrumental costs.
The multiple-emission-line measurement strategy used in MWII can not only apply to the O2(0-1) band, but also can be widely extended to various types of observation targets with narrow-spacing multiple-emission line structure. On the one hand, this strategy can reduce the difficulty of instrument development and improve the measurement precision. On the other hand, the range of selectable emission lines can also be widened, as the many narrow-spacing observation targets can become available based on the proposed measurement strategy.
Author Contributions
Methodology and investigation, D.F. and Y.F.; instrument design, H.Z. and C.C.; radiation calculation, K.W. and L.B.; simulation design and coding, D.F. and J.L.; writing and reviewing, D.F., H.Z., Y.F., and X.L.; funding acquisition, Y.F. and X.L. All authors have read and agreed to the published version of the manuscript.
Funding
This research was funded by the National Natural Science Foundation of China (Grant No. 41005019), West Light Foundation of the Chinese Academy of Sciences (Grant No. XAB 2016A07), Natural Science Basic Research Program of Shaanxi Province (Grant No. 2019JQ-931), and the West Light Cross-Disciplinary Innovation team of Chinese Academy of Sciences (Grant No. E1294301).
Institutional Review Board Statement
Not applicable.
Informed Consent Statement
Not applicable.
Data Availability Statement
The data presented in this study are available on request from the corresponding author. The data are not publicly available due to the restrictions from data sources.
Acknowledgments
The authors acknowledge the constructive technical guidance and writing support from Dingyi Wang.
Conflicts of Interest
The authors declare no conflict of interest.
References
- Garcia, R.R.; Dunkerton, T.J.; Lieberman, R.S.; Vincent, R.A. Climatology of the semiannual oscillation of the tropical middle atmosphere. J. Geophys. Res. Atmos. 1997, 102, 26019–26032. [Google Scholar] [CrossRef]
- Tambovtsev, V.; Shevyakov, I.; Barinov, A. Characteristic of wingtip vortices formed around the hypersonic vehicle in the mesosphere. Phys. Wave Processes Radio Syst. 2016, 19, 45–52. [Google Scholar]
- Chen, Z.; Liu, Y.; Du, Z.; Fan, Z.; Sun, H.; Zhou, C. Validation of MIGHTI/ICON Atmospheric Wind Observations over China Region Based on Meteor Radar and Horizontal Wind Model (HWM14). Atmosphere 2022, 13, 1078. [Google Scholar] [CrossRef]
- Dou, X.; Han, Y.; Sun, D.; Xia, H.; Shu, Z.; Zhao, R.; Shangguan, M.; Guo, J. Mobile Rayleigh Doppler lidar for wind and temperature measurements in the stratosphere and lower mesosphere. Opt. Express 2014, 22, A1203–A1221. [Google Scholar] [CrossRef]
- Zhang, S.P.; Roble, R.G.; Shepherd, G.G. Tidal influence on the oxygen and hydroxyl nightglows: Wind Imaging Interferometer observations and thermosphere/ionosphere/mesosphere electrodynamics general circulation model. J. Geophys. Res. Space Phys. 2001, 106, 21381–21393. [Google Scholar] [CrossRef]
- Abreu, V.J.; Hays, P.B.; Skinner, W.R. The high resolution Doppler imager. Opt. Photonics News 1991, 2, 28–30. [Google Scholar] [CrossRef]
- Meriwether, J. Studies of thermospheric dynamics with a Fabry–Perot interferometer network: A review. J. Atmos. Sol.-Terr. Phys. 2006, 68, 1576–1589. [Google Scholar] [CrossRef]
- Hilliard, R.; Shepherd, G. Wide-angle Michelson interferometer for measuring Doppler line widths. J. Opt. Soc. Am. 1966, 56, 362–369. [Google Scholar] [CrossRef]
- Englert, C.R.; Babcock, D.D.; Harlander, J.M. Doppler asymmetric spatial heterodyne spectroscopy (DASH): Concept and experimental demonstration. Appl. Opt. 2007, 46, 7297–7307. [Google Scholar] [CrossRef]
- Hays, P.B.; Abreu, V.J.; Dobbs, M.E.; Gell, D.A.; Grassl, H.J.; Skinner, W.R. The high-resolution doppler imager on the Upper Atmosphere Research Satellite. J. Geophys. Res. Atmos. 1993, 98, 10713–10723. [Google Scholar] [CrossRef]
- Niciejewski, R.; Wu, Q.; Skinner, W.; Gell, D.; Cooper, M.; Marshall, A.; Killeen, T.; Solomon, S.; Ortland, D. TIMED Doppler Interferometer on the Thermosphere Ionosphere Mesosphere Energetics and Dynamics satellite: Data product overview. J. Geophys. Res. Space Phys. 2006, 111. [Google Scholar] [CrossRef]
- Gault, W.A.; Shepherd, G.G.; Thuillier, G.; Solheim, B.H.; Hersom, C.H.; Brun, J.F.; Brune, S.; Gore, J. WIND Imaging Interferometer (WINDII) on the upper-atmosphere research satellite. In Proceedings of the Instrumentation for Planetary and Terrestrial Atmospheric Remote Sensing, San Diego, CA, USA, 23–24 July 1992. [Google Scholar]
- Shepherd, G.; McDade, I.; Gault, W.; Rochon, Y.; Scott, A.; Rowlands, N.; Buttner, G. The stratospheric wind interferometer for transport studies (SWIFT). Adv. Space Res. 2001, 27, 1071–1079. [Google Scholar] [CrossRef]
- Solheim, B.; Brown, S.; Sioris, C.; Shepherd, G. SWIFT-DASH: Spatial heterodyne spectroscopy approach to stratospheric wind and ozone measurement. Atmos.-Ocean 2015, 53, 50–57. [Google Scholar] [CrossRef]
- Englert, C.R.; Harlander, J.M.; Brown, C.M.; Makela, J.J.; Immel, T.J. MIGHTI: The Spatial Heterodyne Instrument for Thermospheric Wind Measurements onBoard the ICON Mission. In Proceedings of the Fourier Transform Spectroscopy; Optica Publishing Group: Lake Arrowhead, CA, USA, 2015. [Google Scholar]
- Immel, T.J.; England, S.L.; Mende, S.B.; Heelis, R.A.; Englert, C.R.; Edelstein, J.; Frey, H.U.; Korpela, E.J.; Taylor, E.R.; Craig, W.W. The Ionospheric Connection Explorer Mission: Mission Goals and Design. Space Sci. Rev. 2018, 214, 13. [Google Scholar] [CrossRef]
- Englert, C.R.; Harler, J.M.; Babcock, D.D.; Stevens, M.H.; Siskind, D.E. Doppler Asymmetric Spatial Heterodyne Spectroscopy (DASH): An innovative concept for measuring winds in planetary atmospheres. In Proceedings of the Conference on Atmospheric Optical Modeling, Measurement, and Simulation II, San Diego, CA, USA, 15–16 August 2006. [Google Scholar]
- Englert, C.R.; Harlander, J.M.; Brown, C.M.; Marr, K.D.; Immel, T.J. Michelson Interferometer for Global High-Resolution Thermospheric Imaging (MIGHTI): Instrument Design and Calibration. Space Sci. Rev. 2017, 212, 553–584. [Google Scholar] [CrossRef] [PubMed]
- Englert, C.R.; Stevens, M.H.; Siskind, D.E.; Babcock, D.D.; Harlander, J.M. Basic Principle of Doppler Asymmetric Spatial Heterodyne Spectroscopy (DASH): An Innovative Concept for Measuring Winds in Planetary Atmospheres. In Proceedings of the Fourier Transform Spectroscopy; Optica Publishing Group: Santa Fe, NM, USA, 2007; p. FThA3. [Google Scholar]
- Gault, W.A.; Ward, W.E.; Shepherd, G.G.; Rowlands, N. Optical Doppler imaging of atmospheric winds. In Proceedings of the IEEE International Geoscience & Remote Sensing Symposium, Hamburg, Germany, 28 June–2 July 1999. [Google Scholar]
- Ward, W.E.; Gault, W.A.; Shepherd, G.G.; Rowlands, N. Waves Michelson interferometer: A visible/near-IR interferometer for observing middle atmosphere dynamics and constituents. In Proceedings of the Sensors, Systems, and Next-Generation Satellites V, Toulouse, France, 17–20 September 2001; pp. 100–111. [Google Scholar]
- Wei, D.; Liu, J.; Zhu, Y.; Gong, Q.; Riese, M. Thermally stable monolithic Doppler asymmetric spatial heterodyne interferometer: Optical design and laboratory performance. Opt. Express 2020, 28, 19887–19900. [Google Scholar] [CrossRef]
- Rochon, Y.J.; Rahnama, P.; McDade, I.C. Satellite measurement of stratospheric winds and ozone using Doppler Michelson interferometry. Part II: Retrieval method and expected performance. J. Atmos. Ocean. Technol. 2006, 23, 770–784. [Google Scholar] [CrossRef]
- Shepherd, G.G.; Thuillier, G.; Cho, Y.M.; Duboin, M.L.; Evans, W.F.; Gault, W.; Hersom, C.; Kendall, D.; Lathuillere, C.; Lowe, R. The wind imaging interferometer (WINDII) on the upper atmosphere research satellite: A 20 year perspective. Rev. Geophys. 2012, 50. [Google Scholar] [CrossRef]
- He, W.; Wu, K.; Feng, Y.; Fu, D.; Li, F. The Near-Space Wind and Temperature Sensing Interferometer: Forward Model and Measurement Simulation. Remote Sens. 2019, 11, 914. [Google Scholar] [CrossRef]
- Wu, K.; Fu, D.; Feng, Y.; Li, J.; Hao, X.; Li, F. Simulation and application of the emission line O 19 P 18 of O 2 (a 1 Δ g) dayglow near 1.27 μm for wind observations from limb-viewing satellites. Opt. Express 2018, 26, 16984–16999. [Google Scholar] [CrossRef]
- Killeen, T.L.; Skinner, W.R.; Johnson, R.M.; Edmonson, C.J.; Wu, Q.; Niciejewski, R.J.; Grassl, H.J.; Gell, D.A.; Hansen, P.E.; Harvey, J.D. TIMED doppler interferometer (TIDI). In Proceedings of the Optical Spectroscopic Techniques and Instrumentation for Atmospheric and Space Research III, Denver, CO, USA, 19–21 July 1999; pp. 289–301. [Google Scholar]
- Marr, K.D.; Englert, C.R.; Harlander, J.M.; Miller, K.W. Thermal sensitivity of DASH interferometers: The role of thermal effects during the calibration of an Echelle DASH interferometer. Appl. Opt. 2013, 52, 8082–8088. [Google Scholar] [CrossRef] [PubMed]
- Englert, C.R.; Harlander, J.M.; Emmert, J.T.; Babcock, D.D.; Roesler, F.L. Initial ground-based thermospheric wind measurements using Doppler asymmetric spatial heterodyne spectroscopy (DASH). Opt. Express 2010, 18, 27416–27430. [Google Scholar] [CrossRef] [PubMed]
- Yankovsky, V.A.; Martyshenko, K.V.; Manuilova, R.O.; Feofilov, A.G. Oxygen dayglow emissions as proxies for atomic oxygen and ozone in the mesosphere and lower thermosphere. J. Mol. Spectrosc. 2016, 327, 209–231. [Google Scholar] [CrossRef]
- Wu, Y.J.J.; Harding, B.J.; Triplett, C.C.; Makela, J.J.; Marr, K.D.; Englert, C.R.; Harlander, J.M.; Immel, T.J. Errors from asymmetric emission rate in spaceborne, limb sounding Doppler interferometry: A correction algorithm with application to ICON/MIGHTI. Earth Space Sci. 2020, 7, e2020EA001164. [Google Scholar] [CrossRef]
- Berk, A.; Conforti, P.; Kennett, R.; Perkins, T.; Hawes, F.; Van Den Bosch, J. MODTRAN® 6: A major upgrade of the MODTRAN® radiative transfer code. In Proceedings of the 2014 6th Workshop on Hyperspectral Image and Signal Processing: Evolution in Remote Sensing (WHISPERS), Lausanne, Switzerland, 24–27 June 2014; pp. 1–4. [Google Scholar]
- Zhang, Y.; Feng, Y.; Fu, D.; Wang, P.; Bai, Q. The dependence of interferogram phase on incident wavenumber and phase stability of Doppler Asymmetric Spatial Heterodyne Spectroscopy. Chin. Phys. B 2020, 29, 104204. [Google Scholar] [CrossRef]
- Sun, C.; Feng, Y.; Fu, D.; Wang, P.; Sun, J.; Bai, Q. The phase uncertainty from the fringe contrast of interferogram in Doppler asymmetric spatial heterodyne spectroscopy. J. Opt. 2021, 23, 115703. [Google Scholar] [CrossRef]
- Harding, B.J.; Makela, J.J.; Englert, C.R.; Marr, K.D.; Harlander, J.M.; England, S.L.; Immel, T.J. The MIGHTI Wind Retrieval Algorithm: Description and Verification. Space Sci. Rev. 2017, 212, 585–600. [Google Scholar] [CrossRef]
Publisher’s Note: MDPI stays neutral with regard to jurisdictional claims in published maps and institutional affiliations. |
© 2022 by the authors. Licensee MDPI, Basel, Switzerland. This article is an open access article distributed under the terms and conditions of the Creative Commons Attribution (CC BY) license (https://creativecommons.org/licenses/by/4.0/).