Article

Effects of Dietary Lanthanum Chloride on Growth Performance, Hematology and Serum Biochemistry of Juvenile Clarias gariepinus Catfish Fed Diets Amended with Mixtures of Aflatoxin B1 and Fumonisin B1

by
Bolade Thomas Adeyemo
1,*,
Ndidi Gloria Enefe
2,
Tanimomo Babatunde Kayode
1,
Augustina Ezekwesili
1,
Olatunde Hamza Olabode
3,
Audu Zakariya
1,
Gbenga Michael Oladele
4,
Samson Eneojo Abalaka
5,
Wesley Daniel Nafarnda
6 and
Clement Barikuma Innocent Alawa
1
1
Department of Animal Health and Production, Faculty of Veterinary Medicine, University of Abuja, Gwagwalada 902001, Nigeria
2
Department of Physiology and Biochemistry, Faculty of Veterinary Medicine, University of Abuja, Gwagwalada 902001, Nigeria
3
Department of Veterinary Microbiology, Faculty of Veterinary Medicine, University of Abuja, Gwagwalada 902001, Nigeria
4
Department of Veterinary Pharmacology, Faculty of Veterinary Medicine, University of Abuja, Gwagwalada 902001, Nigeria
5
Department of Veterinary Pathology, Faculty of Veterinary Medicine, University of Abuja, Gwagwalada 902001, Nigeria
6
Department of Veterinary Public Health and Preventive Medicine, Faculty of Veterinary Medicine, University of Abuja, Gwagwalada 902001, Nigeria
*
Author to whom correspondence should be addressed.
Toxins 2022, 14(8), 553; https://doi.org/10.3390/toxins14080553
Submission received: 29 April 2022 / Revised: 13 June 2022 / Accepted: 28 June 2022 / Published: 14 August 2022

Abstract

:
This study aimed to determine the effects of dietary lanthanum chloride on the growth and health performance of juvenile Clarias gariepinus when fed diets experimentally contaminated with mixtures of aflatoxin B1 and fumonisin B1. A control diet, (mycotoxin free, diet A), mycotoxin contaminated (diet B), and two mycotoxin-contaminated diets amended with lanthanum chloride (200 mg/kg, diet C; and 400 mg/kg, diet D), were fed to 450 fish divided equally into five groups (each with three replicates) for 56 days. The fish were randomly sampled at the time points: day 7, 28 and day 56 for the zootechnical, hematological and serum biochemical evaluations. The fish fed the diets amended with lanthanum chloride exhibited significantly (p < 0.05) better performance indices compared with the fish fed only the mycotoxin-contaminated diet. Lanthanum chloride elicited significant (p < 0.05) increases in erythrocytes and leucocytes count and significant (p < 0.05) reduction in serum transaminase, alkaline phosphatase, lactate dehydrogenase activities, urea and uric acid concentrations in the fish fed the diets contaminated with mixtures of aflatoxin B1 and fumonisin B1. The study indicates that juvenile Clarias gariepinus may be beneficially cultured with mycotoxin-contaminated grains amended with 200 to 400 mg/kg lanthanum chloride.
Key Contribution: The dietary inclusion of lanthanum chloride at 200–400 mg/kg diet improves the production performance of juvenile Clarias gariepinus catfish when fed diets contaminated with mixtures of aflatoxin B1 and fumonisin B1. Dietary lanthanide chloride at 200–400 mg/kg in the diet ameliorates the hematological and serum biochemical derangements produced by dietary exposures to mixtures of aflatoxin B1 and fumonisin B1.

1. Introduction

Aquaculture production represents a significant source of animal protein to millions of people worldwide. According to the Food and Agriculture Organization of the United Nations [1], the total world aquaculture production has risen to 51.4 million tons by volume and $60.0 billion by value. The increase in the production of cultured fish has also led to a significant decrease in the landings of several capture fisheries, a direct consequence of the use of fish as the source of animal proteins in aquafeeds [2,3,4]. To mitigate this negative trend, plant-based proteins are increasingly being used as sustainable alternatives to fish-meal-based proteins in aquafeeds [5].
In Africa, the quality of the plant products used in fish feed formulations is said to be a limiting factor in the progressive increase in aquaculture productivity; in addition, these feed ingredients are, very often, ideal substrates for the growth of fungi, such as Aspergillus spp. and Fusarium spp. [6,7]. These fungi, under favorable conditions (that is, those generally present in the tropical regions of the world), may result in the synthesis of mycotoxins, such as aflatoxin B1 and fumonisin B1 [4].
The aflatoxins are a group of mycotoxins produced by the blue-green molds, Aspergillus flavus and Aspergillus parasiticus [8,9]. These molds are common contaminants in the feed ingredients of agricultural origin (such as cotton seed, ground nut, maize, wheat, soya bean and the respective by-products from the agricultural processing of these commodities). The aflatoxins have also been reported in fish meal. Four major aflatoxins (AFB1, AFB2, AFG1 and AFG2) have been reported to be direct contaminants of feed ingredients and formulated agricultural and aquacultural feeds [10,11]. Of the aflatoxins, AFB1 is reported to be the most prevalent, most potent and the most carcinogenic [12,13,14], and has been classified as a group 1 carcinogen by the International Agency for Research on Cancer [15].
Aflatoxicosis, a disease state caused by the effects of aflatoxins, has been noted to be common in aquaculture [16]. According to [17], Oncorhynchus mykiss fed cotton seed meals contaminated with aflatoxins developed liver tumors and exhibited a mortality pattern of up to 85%. Other information available on the effects of AFB1 in the cultivable species of fin and non-fin fishes, i.e., Oncorhynchus mykiss [18]; Ictalurus punctatus [19,20]; Oreochromis niloticus [21]; Labeo rohita [22] and Penaeus monodons [23], suggests that fish exhibit a wide plasticity in the susceptibility to AFB1, and that cold water species are more sensitive when compared to warm water fishes [18,20]. These species-specific differences in sensitivity to AFB1 have been attributed to the differences in the metabolism of aflatoxin B1 in the liver and the affinity of AFB1-derived metabolites to hepatic macromolecules [14,24].
Fusariumverticillioides, the mold primarily associated with the production of the fumonisins, is prevalent in hot–humid regions of the world, and its occurrence has been related to the presence of invading insects [24,25]. Though maize is most frequently contaminated by fumonisins, these mycotoxins have been found at high concentrations in wheat, asparagus, tea and cowpea [26]. According to [27], it is very difficult to obtain uncontaminated maize, even if the contamination level is not significant. In most investigations, FB1 is the most prevalent toxin, with a co-occurrence of FB2 and FB3 [25]. Several countries in Africa, North and South America, Asia and Europe have reported FB1 in cereals at levels from 0.02 to 25.9 ng/kg, and FB2 at levels from 0.05 to 11.3 ng/kg [26,28]. FB1 is stable in acetonitrile-water (1:1), at food-processing temperatures and light, but unstable in methanol [26].
Feed additives are used world-wide for many different reasons. Some help to cover the need for essential nutrients, and others help to increase animal performance, feed intake and thereby optimize feed utilization. The rare earth elements (REE), composed of about 15 elements with atomic numbers ranging from 57 (lanthanum) to 71 (lutetium), are a promising set of feed additives in animal production [29,30]. The REE are reported as being used as performance enhancers in animal production, without affecting the quality of the final produce [31,32].
The growth-promoting effects of REE are reported to be based on the type and concentration of the REE applied [33,34]. It is reported that the application of REE additives, with concentrations ranging from 100 to 200 mg/kg, in the diets of 40–50 days old piglets, significantly improved the daily body weight gain [35]. It is reported that diets supplemented with mixtures of lanthanum chloride at 100, 200 and 300 mg/kg per diet improved the activities of proteinase, lipase and amylase in the liver and pancreas of the adults and fry of carp (Cyprinus carpio) [36]. Furthermore, dietary lanthanum at 75 mg/kg has been reported to result in a 2–5% increase in body weight and a 7% increase in the feed conversion ratio of piglets [31].
Clarias gariepinus, also called the African sharp tooth fish, is widely farmed in the West African sub-region; this fish is cultured based on the aquafeeds produced from maize and soybean cake [37,38], resulting in the risk of inadvertent dietary AFB1 and/or FB1 exposures. In a previous study, we observed a marked decrease in weight gain following dietary exposures to mixtures of AFB1 and FB1, and reported the tolerable limits for dietary exposures to mixtures of AFB1 and FB1 in juvenile Clarias gariepinus to be 17.6 μg AFB1/kg and 24.5 mg FB1/kg [39].
The addition of rare earth metals to animal diets as growth promoters is considered to be a promising alternative to the use of antibiotics and other chemicals [29,40,41]. There are reports on the potential for the use of lanthanum chloride (LC), either as immunostimulants and/or growth-promoters in agriculture, as well as in aquaculture [31,42]. The present study was set up to determine the effects of lanthanum chloride on the growth performance, hematology and serum chemistry of the juvenile Clarias gariepinus, when fed diets contaminated with mixtures of aflatoxin B1 and fumonisin B1.

2. Results

The nutrient composition, proximate composition and the mycotoxin analysis of the experimental diets are shown in Table 1. It shows that the concentrations of AFB1 and FB1 in the produced diets are significantly higher than the concentrations of the purified mycotoxins added to the experimental diets at the time of the diet formulation and feed production. Hence, the concentrations of the mycotoxins in the diets would, hereafter, be appropriately quantified as follows: Diet A, the control diet, 2.0 µg AFB1; 3.0 mg FB1/kg diet; Diets B, C and D, 19.7 µg AFB1; 28.5 mg FB1/kg diet. Table 1 also shows that there were no variations (p > 0.05) in the percentage of crude protein, metabolizable energy, digestible energy and the total lipids contents of the formulated feeds.

2.1. Effect on Growth Performance

Table 2 shows the results obtained for the zootechnical assessments of the fish fed the various experimental diets. The one way analysis of variance (ANOVA) shows that there were no significant variations (p > 0.05) in the body weights of the fish in the treatment groups compared with the body weight of the fish in the control group at the start of the feeding study. However, there were significant variations (p < 0.05) in the final weight of the fish in the control group when compared with the final weight of the fish in the treatment groups. The fish fed the control diet (2.0 µg AFB1; 3.0 mg FB1/kg diet) had the highest final body weight, while the fish fed diet B (19.7 µg AFB1; 28.5 mg FB1/kg diet) had the lowest weight gain. The Tukey’s post hoc assessment revealed the weight gained by the fish fed diet D (lanthanum chloride 400.0 mg/kg and 19.7 μg AFB1/kg + 28.5 mg FB1/kg) was significantly (p < 0.05) higher than the weight gained by the fish fed diet C (lanthanum chloride 200.0 mg/kg and 19.7 μg AFB1/kg + 28.5 mg FB1/kg).
The quantity of feed consumed by the experimental fish are shown in Table 2. The one way analysis of variance (ANOVA) shows that the quantity of feed consumed by the fish fed diet A (the control diet) was significantly (p < 0.05) more than the quantities of feed consumed by the fish fed the treatment diets (diets B, C and D). The Tukey’s post hoc analysis reveals that the quantities of feed consumed by the fish in the various treatment groups varied significantly (p < 0.05) from one another, and that the fish fed diet C (lanthanum chloride 200.0 mg/kg and 19.7 µg AFB1 + 28.5 mg FB1/kg), consumed the lowest quantity of fed.
In addition, the results obtained for the feed conversion ratio (FCR) are shown in Table 2. The one way analysis of variance (ANOVA) shows that the FCR of the fish fed the control diet (2.0 µg AFB1; 3.0 mg FB1/kg diet) differed significantly (p < 0.05) compared with the FCR of the fish fed the treatment diets (diets B, C and D). The fish fed diet B (19.7 µg AFB1 + 28.5 mg FB1/kg) had the highest FCR (3.268) while the fish fed diet C had the lowest FCR (1.981). The variations in the FCR of the fish fed diets C (lanthanum chloride 200.0 mg/kg and 19.7 µg AFB1 + 28.5 mg FB1/kg) and diet D (lanthanum chloride 400.0 mg/kg and 19.7 µg AFB1 + 28.5 mg FB1/kg) were also not significant (p > 0.05).
The results obtained for the feed conversion efficiency of the fish fed the experimental diets are shown in Table 2. The one way analysis of variance (ANOVA) shows the feed conversion efficiency (FCE) of fish fed the control diet differed significantly (p < 0.05) compared with the FCE of fish fed the treatment diets (diets B, C and D). Furthermore, Tukey’s post hoc evaluation shows there were no significant variations (p > 0.05) in the FCE of the fish fed diet C compared with the FCE of the fish fed diet D. The fish fed the diets containing lanthanum chloride had the highest FCE (50.47), while the fish fed diet B had the lowest FCE (30.60).
The data for the specific growth rate (SGR) shows that the fish fed diet A had the highest SGR (1.195) and the fish fed diet B had the lowest SGR (0.535). The one way analysis of variance (ANOVA) of this data shows that the fish fed diet A (the control diet) had significantly (p < 0.05) higher SGR values compared with the fish fed the treatment diets (diets B, C and D). Tukey’s post hoc evaluation reveals there were no significant variation in the SGR of fish fed diet C and diet D.

2.2. Effects on Hematology

At 7 days post commencement of the trials (Table 3), the one way analysis of variance (ANOVA) showed that there were significant (p < 0.05) decreases in the erythrocytes, leucocytes and the hematocrit values in the fish fed the treatment diets (diets B, C and D) compared with the fish fed the control diet (diet A). Table 3 further shows that the fish fed diet B had the lowest erythrocytes count (1.43 × 10⁹ cells/mm3), leucocytes count (1.95 × 10⁶ cells/mm3) and hematocrit values (16.24%), while the fish fed the control diet had the highest values for these parameters; there were no clear patterns in these parameters in the fish fed the lanthanum chloride.
In this same period, the one way analysis of variance (ANOVA) also shows that there were significant (p < 0.05) variations in the hemoglobin concentration in the fish fed the treatment diets (diets B, C and D) compared with the hemoglobin concentrations of the fish fed the control diet. The Tukey post hoc analysis shows there were no significant (p > 0.05) variations in the hemoglobin concentrations of the fish fed diet A (the control diet) and the fish fed diet D.
There was a significant (p < 0.05) reduction in the erythrocytes count, the leucocytes count, and the hematocrit volume of the fish fed the treatment diets (diets B, C and D) compared with the corresponding values in fish fed the control diet (diet A) on day 28 (Table 4) and day 56 (Table 5) of the trial. The Tukey’s post assessments reveal there were no significant (p > 0.05) variations in the values obtained for fish fed diet C and diet D on day 28 and day 56.

2.3. Effects on the Erythrocytic Indices

Figure 1 shows the mean corpuscular volume (mcv) of the fish fed the control diet and the contaminated diets amended with lanthanum chloride for 56 days. At day 7 of the feeding study, the mcv of the fish fed the diet contaminated with the mixtures of the AFB1 and FB1 (diet B) was significantly (p < 0.05) reduced compared with the mcv of the fish fed the control diet. The Tukey’s post hoc analysis reveals that, at this same interval, the mcv of the fish fed the mixtures of AFB1- and FB1-contaminated diets, amended with 400 mg/kg lanthanum chloride, increased significantly (p < 0.05) compared with the mcv of the fish fed the control diet (Figure 1). At day 28, the mcv values of the fish fed the treatment diets were significantly higher than those of the fish fed the control diet. The post hoc evaluations showed that there were no significant (p > 0.05) variations in the mcv of the fish fed the mycotoxin-contaminated diets (diet B) compared with the mcv of the fish fed the contaminated diet amended with 200 mg/kg lanthanum chloride (diet C). The post hoc assessment further shows that the mcv values obtained for the fish fed diet C were not significantly different (p > 0.05) compared with the mcv values of the fish fed diet D. At day 56 of the feeding trial, the one way analysis of variance (ANOVA) showed that the mean mcv of the fish fed the treatment diets were significantly higher (p < 0.05) than the mean mcv values of the fish fed the control diet. The post hoc assessment shows that there were no significant variations in the mcv values obtained for the fish fed the treatment diets (p > 0.05).
The results obtained for the mean corpuscular hemoglobin (mch) of the fish fed the experimental diets are shown in Figure 2. They show that, at day 7 of the feeding study, there were significant (p < 0.05) increases in the mch values of the fish fed the treatment diets compared to the mch values of the fish fed the control diet. Figure 2 also shows the significant (p < 0.05) reduction in the mch values in the fish fed the contaminated diets, amended with lanthanum chloride, at day 28 and day 56 of the feeding trial. The post hoc assessment shows that there were no significant (p > 0.05) variations in the mch values of the fish fed the contaminated diets, amended with 200 mg/kg lanthanum chloride and 400 mg/kg lanthanum chloride, and the control diet at these sampling intervals.
The mean corpuscular hemoglobin concentration (mchc) of the fish fed the experimental diets are shown in Figure 3. It shows that, at day 7 of the feeding, the mchc values of the fish fed the diets contaminated with mixtures of AFB1 and FB1 were significantly (p < 0.05) increased compared with the mchc values of the fish fed the contaminated diets amended with lanthanum chloride. There were no significant variations in the mchc values of the fish fed the contaminated diet B and the fish fed the contaminated diet C, amended with 200 mg/kg lanthanum chloride, at days 28 and day 56; furthermore, the mchc values of the fish fed the contaminated diet D, amended with 400 mg/kg lanthanum chloride, was not significantly (p > 0.05) different from the mchc values of the fish fed the control diet, at days 28 and 56 of the study (Figure 3).
The results obtained for the serum biochemistry evaluations are shown in Table 6 and Table 7. At 7 days post commencement of the trial, there were no significant variations (p > 0.05) in the serum total protein concentrations of the fish fed diet A (the control diet) compared with those of the fish fed the treatment diets (diets B, C and D). The serum albumin concentration of the fish fed diet D (the contaminated diet amended with 400 mg/kg lanthanum chloride) was significantly (p < 0.05) higher compared with those of the fish fed diet A (the control diet). The Tukey’s post hoc assessment shows the variations in the serum albumin concentrations of fish fed diet C and diet D were not significant (p > 0.05). Table 6 also shows there were significant increases (p < 0.05) in the serum transaminase activities of fish fed the treatment diets compared with those of fish fed the control diets. The Tukey’s post hoc assessment shows that there were no significant variations (p > 0.05) in the alanine amino transferase and aspartate amino transferase values of the fish fed 200 mg/kg and 400 mg/kg lanthanum chloride.
At this same time interval, the serum creatinine, urea and uric acid concentrations of the fish fed the experimental diets (diets B, C and D) were significantly (p < 0.05) higher compared with those of the fish fed the control diet; Tukey’s post hoc evaluations at this interval also show the serum concentrations of the creatine, urea and uric acid obtained for the fish fed the diets amended with 200 mg/kg (diet C) and 400 mg/kg lanthanum chloride (diet D) were significantly (p < 0.05) lower than those obtained for the fish fed only the contaminated diet (diet B); furthermore, the differences obtained in these values for the fish fed 200 mg/kg lanthanum chloride and 400 mg/kg lanthanum chloride were not significant (p > 0.05).
The results obtained for the serum biochemical evaluations at day 56 of the feeding trial are shown in Table 7. It shows that the serum total protein concentrations of the fish fed the treatment diets were significantly (p < 0.05) higher compared with those of the fish fed the control diet. The Tukey’s post hoc assessment reveals that there were no significant (p > 0.05) variations in the serum total protein concentration of the fish fed diet C and diet D. Table 7 also shows that the serum albumin concentration of the fish fed the control diet differed significantly (p < 0.05) compared with those of the fish fed diets B, C and D.
The serum globulin concentrations of the fish fed diets B, C and D were significantly (p < 0.05) higher compared with those of the fish fed diet A (the control diet) at 56 days post commencement of the trial (Table 7). The Tukey’s post hoc evaluation reveals the difference in the serum globulin concentrations of the fish fed diet B and diet D, at 56 days of the feeding trial, were not significant (p > 0.05).
The serum transaminases (alanine aminotransferase and aspartate aminotransferase activities), and the alkaline phosphatase activities increased significantly (p < 0.05) in the fish fed diets B, C and D compared with their corresponding values in the fish fed the control diet (Table 7). The Tukey’s post hoc evaluation shows the serum alanine aminotransferase (ALT) activities of the fish fed diet B, and diet D differed significantly (p < 0.05) at 56 days of feeding, with the fish fed diet B having the lowest ALT activity (25.00 u/L) and the fish fed diet D having the highest ALT activity (33.51 u/L).
The serum concentrations of creatinine, urea and uric acid and the serum activity of lactate dehydrogenase (LDH) increased significantly (p < 0.05) in the fish fed the treatment diets (diets B, C and D) compared to their corresponding values in the fish fed the control diet (diet A) at 7 days of feeding (Table 6) and at 56 days of feeding (Table 7).

3. Discussion

The water quality parameters of the culture tanks in the present study were determined to be within the range recommended for the culture of clariid catfishes [39]; thus, may not have contributed to the pathophysiological observations recorded in this study. The proximate and mycotoxin (AFB1 + FB1) content of the feed was not altered by the addition of the lanthanum chloride; furthermore, the AFB1 and FB1 content of the final feed was higher than the respective concentrations of the purified mycotoxins introduced into the diets at formulation. This is an expected result, as it has been previously noted that agricultural products are often contaminated with various mycotoxins, and that these mycotoxins occur at varying concentrations; hence, the difference in the AFB1 and FB1 contents of the produced diets reflects the concentrations of these mycotoxins in the agricultural materials used in the production of the feed [9,43].
The fish fed diet A (the control diet) consumed the most quantity of feed, while the fish fed diet B (19.7 µg AFB1 + 28.5 mg FB1/kg) consumed the lowest quantities of fed. This is an expected result, as mycotoxins, especially aflatoxins, are reported to cause a reduction in feeding, or an outright feed refusal, with a consequent decrease in the performance in the animals [41,44]. This agrees with the findings of [32], who observed that dietary rare earth elements improve the body weight gain and feed conversion ratio, without increasing feed intake. The results of the present study also show that the fish fed diets containing 400 mg/kg lanthanum chloride consumed more feed compared with the fish fed 200 mg/kg lanthanum chloride; thus, indicating that the feed consumption increased with the dietary concentration of lanthanum chloride.
The fish fed the diets containing AFB1 and FB1 exhibited the lowest weight gain. This is similar to the findings of our earlier study [39], where poor growth performance was recorded in the juvenile Clarias gariepinus catfish when fed diets amended with doses of mixtures AFB1 and FB1. The aflatoxins are reported to cause gastrointestinal dysfunctions marked by significant changes in the gut morphology, reduced digestive ability and a disruption of the digestive enzymes and intestinal innate immunity [23]. The fumonisins are reported to negatively influence growth performance by their abilities to interfere with cellular growth and cell–cell interactions [20,45]. The poor growth recorded for fish when fed diets containing mixtures of AFB1 and FB1 may be as a consequence of the combined activities of the two mycotoxins.
The fish fed diet D (400 mg/kg lanthanum chloride) exhibited a superior weight gain compared with the fish fed diet C (200 mg/kg lanthanum chloride), suggesting that the weight gain in the juvenile Clarias gariepinus, fed diets contaminated with mixtures of aflatoxin B1 and fumonisin B1, was influenced by the concentration of the dietary inclusion of lanthanum chloride. The exact mechanisms of the growth promotion by lanthanum chloride are yet to be described. It is, however, reported that lanthanum chloride may promote weight gain in animals by improving the utilization of dietary nutrients, such as total energy, crude protein and fat [46]. It is also reported that dietary lanthanum chloride increases the secretion of gastric juices in the exposed animals [47]; thus, the increased weight gain observed in the present study may be a function of the increased activities of gastric enzymes in the exposed fish [47] and, since the fish fed the diets containing lanthanum chloride at 400 mg/kg diet consumed more feed compared with those fed the diets containing lanthanum chloride at 200 mg/kg diet, it is therefore reasonable for them to gain better weight.
The fish fed diet B (19.7 µg AFB1 + 28.5 mg FB1/kg diet) exhibited the highest (3.268), and the lowest feed conversion ratio (30.60 ± 1.60) compared with the fish fed the other diets. This is a result of the deleterious effects of the mixed mycotoxins in the diets [13,40,48,49]. The feed conversion ratio and the feed conversion efficiency were significantly improved by the addition of the lanthanum chloride into the diets. The results of the present study further show that fish fed diet C (lanthanum chloride 200 mg/kg diet), exhibited the lowest (1.981 ± 0.07) feed conversion ratio. Hence, the lanthanum chloride at 200 mg/kg inclusion rates produced the best nutrient utilization in the juvenile Clarias gariepinus fed diets contaminated with mixtures of aflatoxin B1 and fumonisin B1.
The evaluations of the hematological parameters of the fish are required in the physiological assessment of the effects of exposure to sub-chronic concentrations of contaminants [50] and/or the physiological response to the dietary intake of essential nutrients [51]. This is because the determination of the erythrocytes count, the hematocrit values, and the hemoglobin concentration in the fish aids in the assessment and prognostication of anemias [52].
The results of the present study show significant decreases in the erythrocytes counts, the hematocrit values and the hemoglobin concentrations of the fish fed the diets contaminated with mixtures of AFB1 and FB1 compared with the corresponding values for the fish fed the control diets at days 7, 28 and 56 of the trial. This is similar to the findings of [8], who reported a disruption in the protein digestion and absorption in Nile tilapia following dietary exposures to AFB1.
There were no significant variations in the erythrocytes counts, the hematocrit values and the hemoglobin concentrations of the fish fed the low (200 mg/kg) or high (400 mg/kg) concentrations of lanthanum chloride; however, the fish fed the mycotoxin-contaminated diets amended with lanthanum chloride exhibited significantly higher erythrocytes counts, hematocrit values and hemoglobin concentrations compared with their corresponding values in the fish fed diets contaminated with the mixtures of AFB1 + FB1 only. This indicated that dietary lanthanum chloride may ameliorate the depression of erythropoiesis induced by dietary exposures to mixtures of AFB1 and FB1. This finding may be a result of the increases in feed consumption and improved utilization of dietary nutrients [53,54], or due to the anti-oxidative effects of lanthanum chloride, wherein lanthanum chloride is able to protect the oxidation of dietary fatty acids, such as omega-3 fatty acids, thereby making it more available and/or enhancing their absorption [55].
There were significant and sustained leukocytopenia in the fish fed the diets contaminated with AFB1 and FB1 throughout the duration of the study. This agrees with the reports [21,45,48,49], where it was reported that the dietary mycotoxins elicit a suppression of the immune response of exposed animals. Furthermore, the fish fed the diets contaminated with AFB1 and FB1 and containing lanthanum chloride exhibited significantly higher leucocytes counts compared with the fish fed diets contaminated AFB1 and FB1 alone, indicating lanthanum chloride may have some ameliorative effect on the leucocytes counts of juvenile Clarias gariepinus fed diets contaminated with mixtures of AFB1 and FB1. The mechanism for these immunoprotective effects may not be unconnected with the antioxidant activities of lanthanum chloride [53,55] and/or the increased nutrient absorption and utilization effects of lanthanum chloride [56,57].
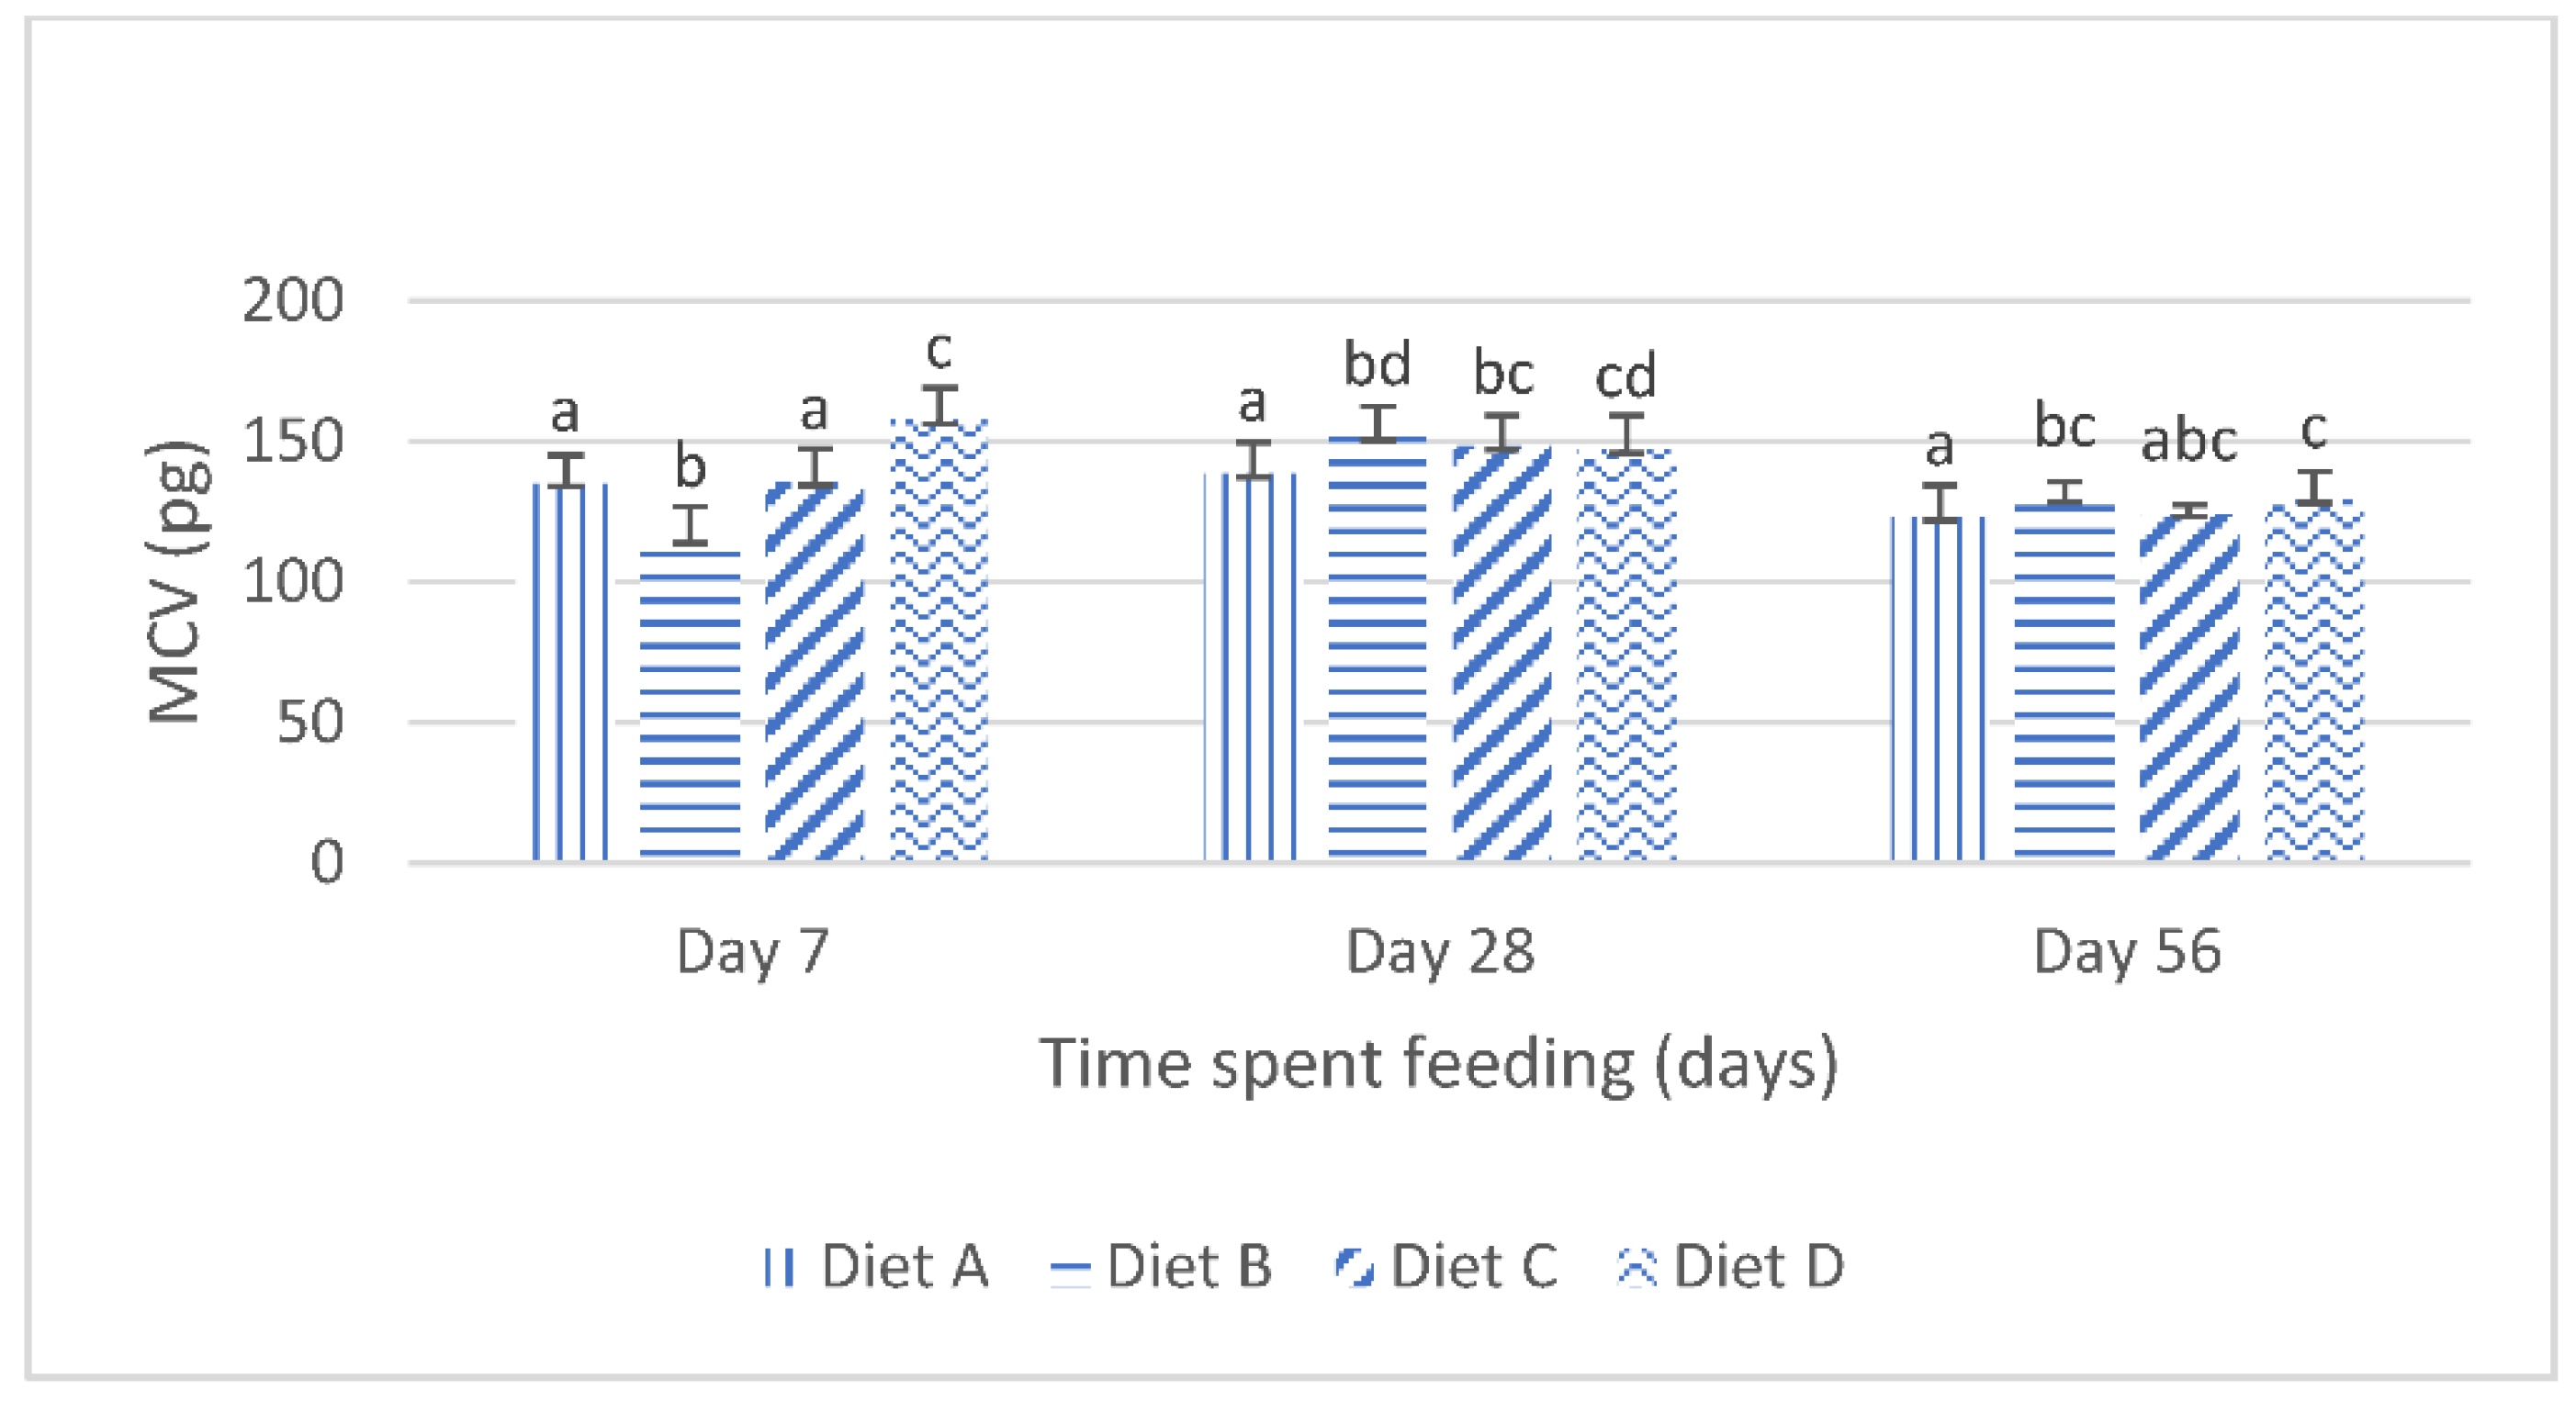
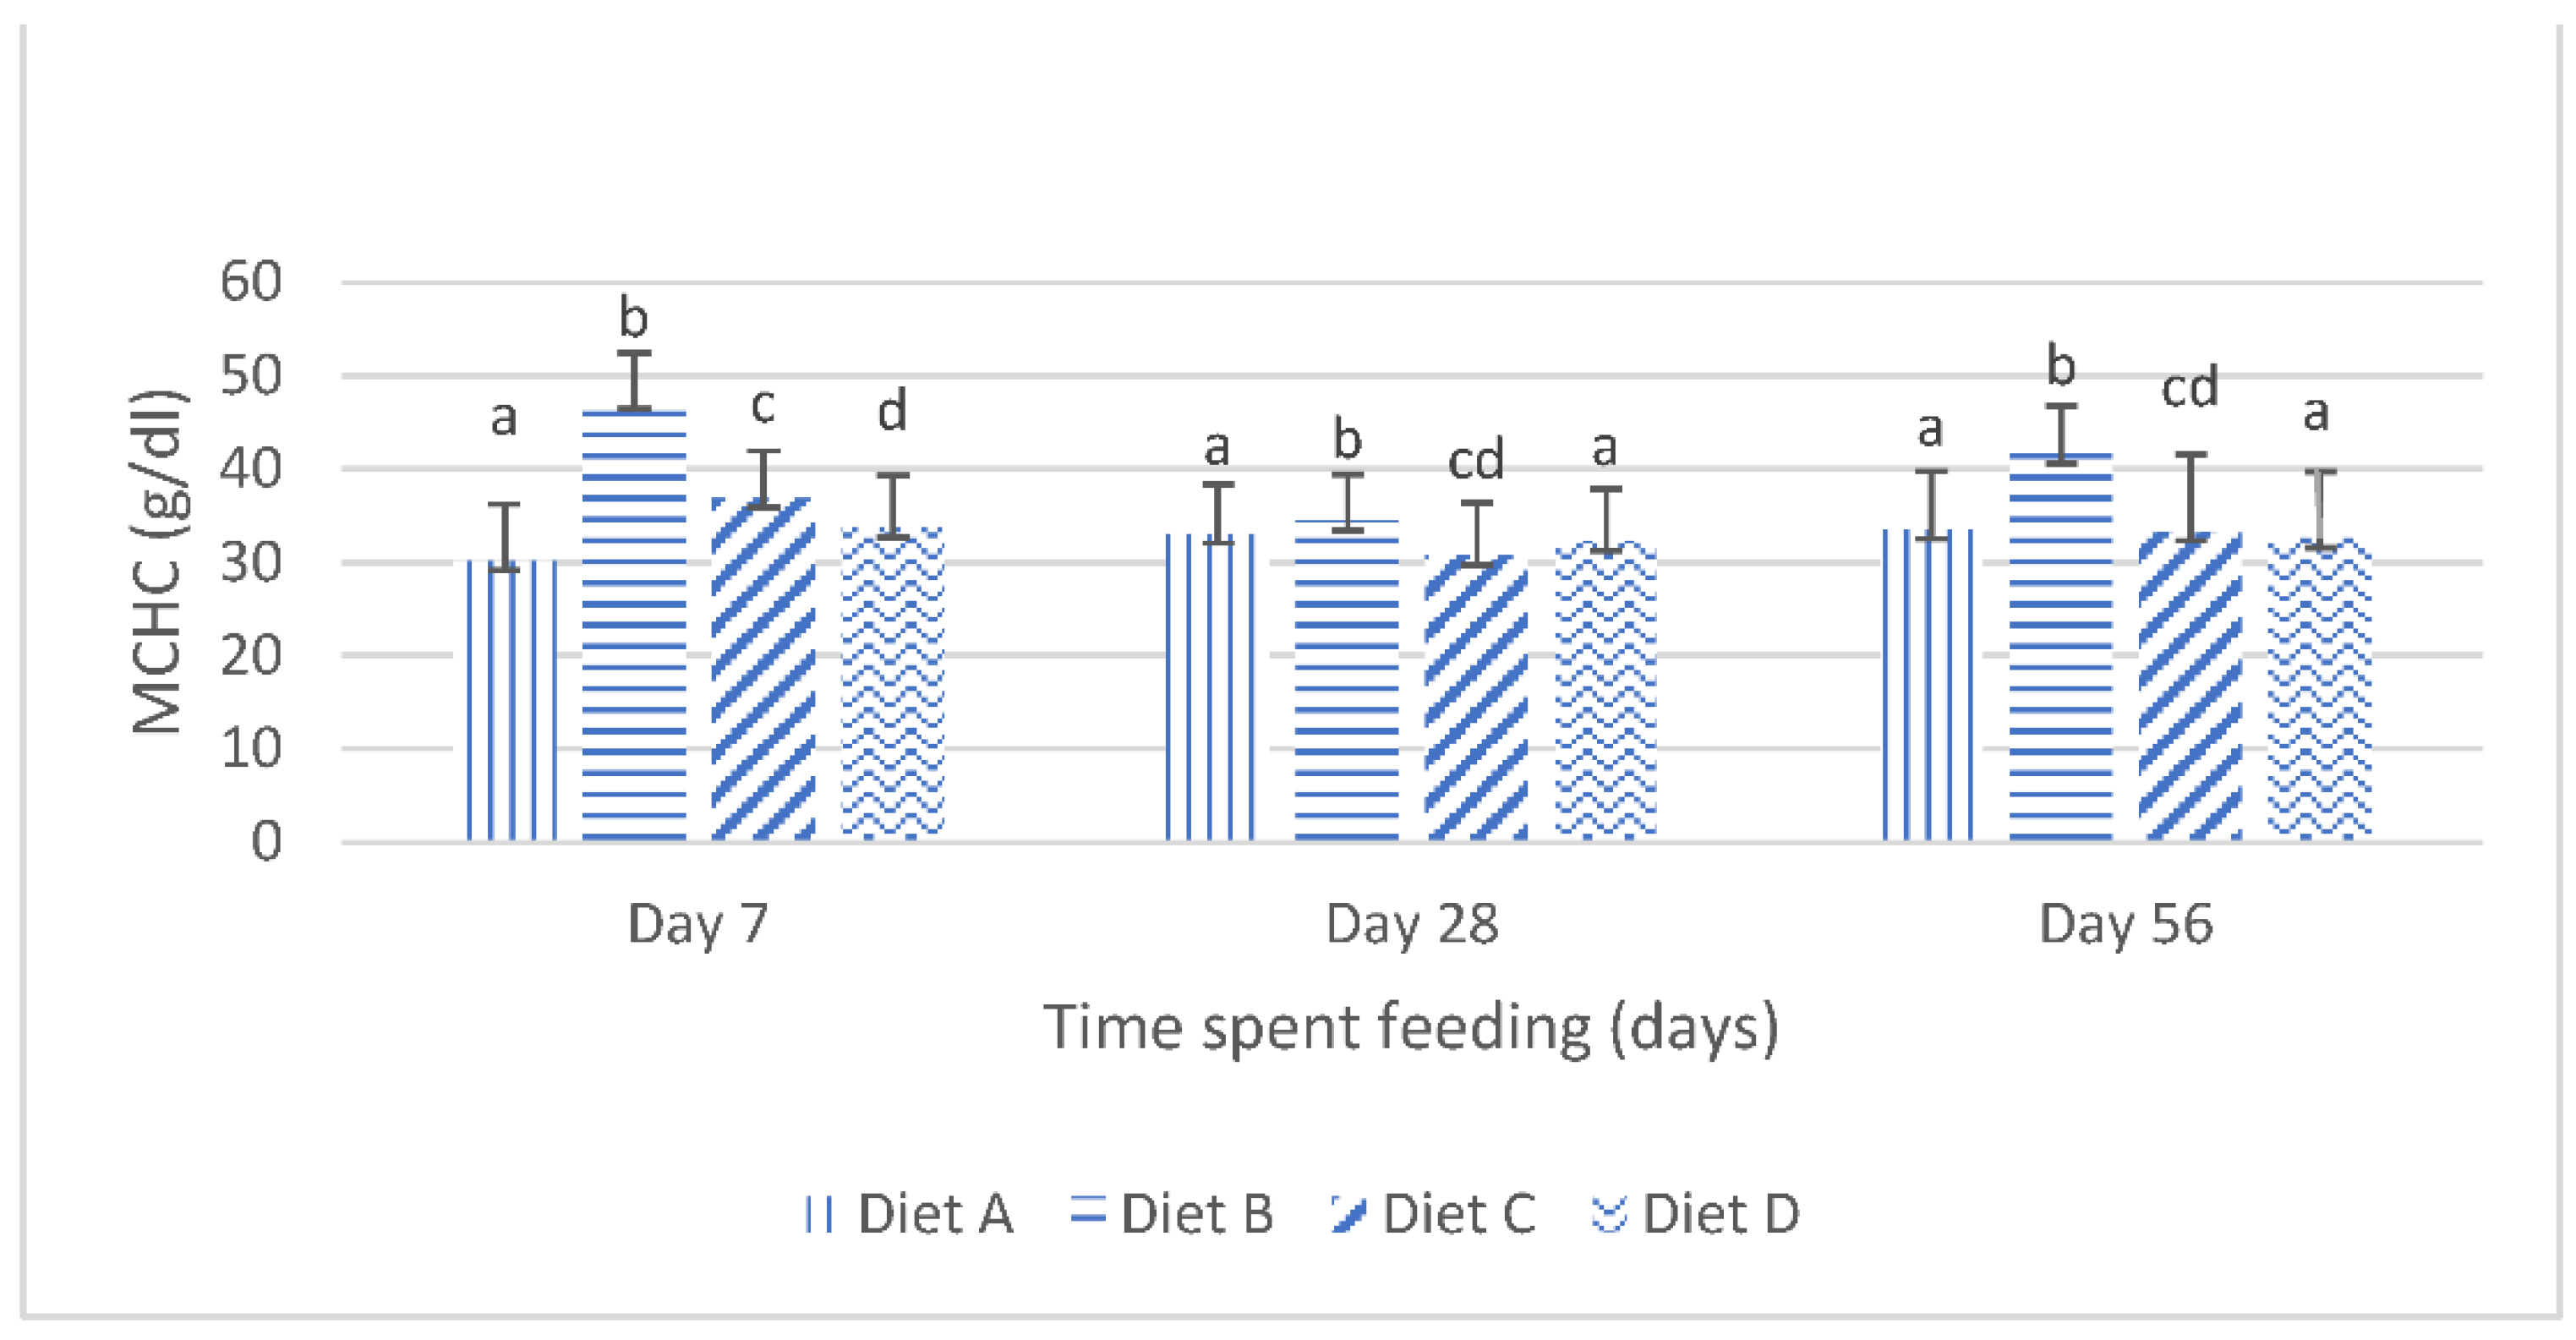
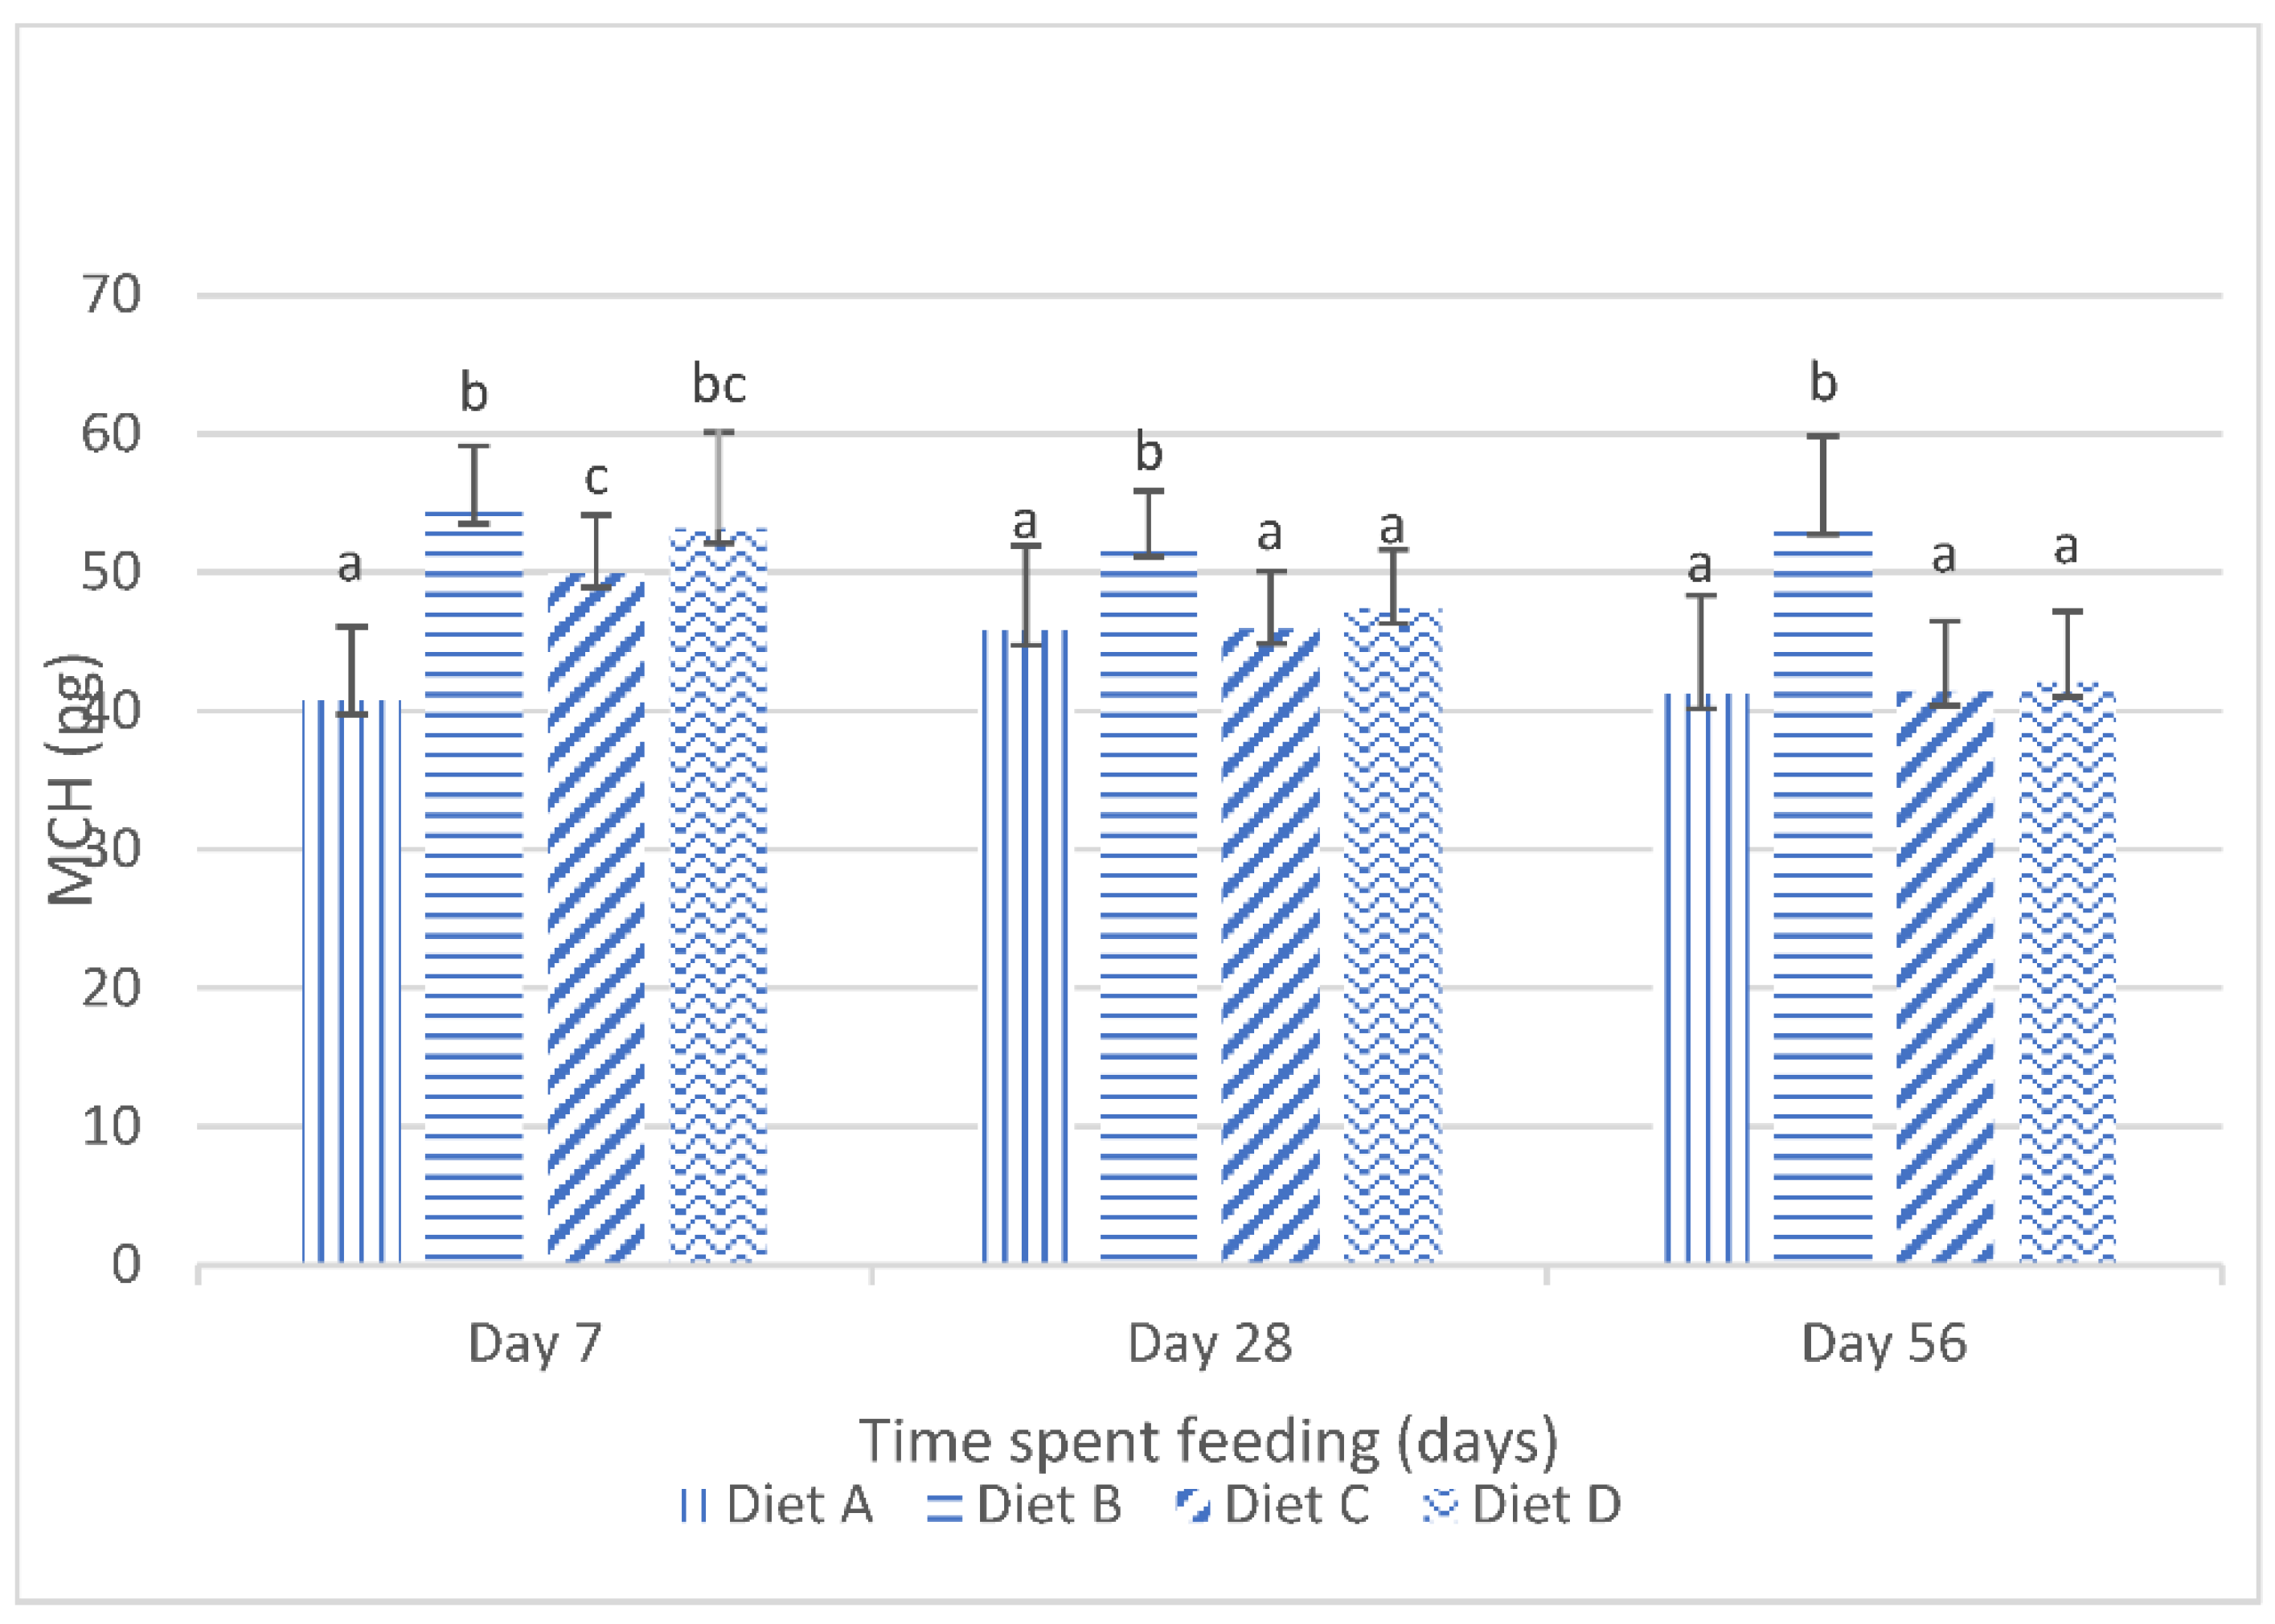
Although the results of the present study show that the dietary lanthanum chloride elicited significant changes in the erythrocytic indices (the mean corpuscular volume, the mean corpuscular hemoglobin values and the mean corpuscular hemoglobin concentration) of juvenile Clarias gariepinus fed with the contaminated diets, the observed changes were well within the scope of the hematological reference intervals for juvenile Clarias gariepinus [39]. It is probable that these changes may have been more pronounced if the duration of the study had extended beyond the 56 days duration, as it is generally reported that the effects of dietary exposures to mycotoxins are dependent on the duration of the exposure and the concentration of the mycotoxins [5,13,20].
The serum total proteins, consisting of the albumin and globulin concentrations, provide critical information reflecting the functional statuses of various organs and/or systems; since they are involved in the specific immune responses of the fish and participate in the maintenance of the acid-base balance [58,59], the serum proteins are also involved in the protection of the cellular integrity of cells, such as the erythrocytes, hepatocytes and the nephrocytes [50]. The serum total proteins also provide an easy and readily available source of energy in emergencies, such as that obtained in situations of feed deprivation [60,61,62].
The serum total proteins increase in cases of generalized chronic inflammation and in inflammatory disorders affecting the liver and the kidneys [60]. The present study was marked by hyperproteinemia (observed 56 days post dietary exposure) in the fish fed the diets contaminated with mixtures of AFB1 and FB1; this is an expected result as both of the mycotoxins have been reported to elicit hepatic and nephrotic syndromes in exposed fish [45,63]. There were no significant differences in the serum total protein of the fish fed the diets amended with lanthanum chloride or bentonite clay. This may be the consequence of ingested free mycotoxins, especially of the fumonisins [64].
The serum albumins are produced in the liver. Therefore, the synthetic capacity of the liver (which is an estimate of the protein losing nephropathy) may be estimated by the determination of the serum albumin concentration [65]. According to [66], malnutrition, increased protein catabolism, enteropathy and/or chronic nephropathy are marked by a reduced serum albumin concentration (termed hypoalbuminemia). The fish fed the diets contaminated with the mixtures of AFB1 and FB1 exhibited significantly elevated serum albumin concentrations. These may be a result of the combined effects of AFB1 and FB1 [63]. As observed for the serum total proteins, the inclusion of the lanthanum chloride in the diets elicited a marginal but significant reduction in the serum albumin concentration compared with those of the fish fed the diets contaminated with only the mixtures of AFB1 and FB1. This may indicate that lanthanum chloride may have some hepatoprotective and nephroprotective properties in juvenile Clarias gariepinus fed diets contaminated with mixtures of AFB1 and FB1.
The hepatic enzymes (transaminase and alkaline phosphatase) are liberated into the serum in situations of hepatocellular or cholestatic liver injuries [67]. In hepatopathies, such as those seen in hepatocellular degenerations, aspartate aminotransferase (AST) and alanine aminotransferase (ALT) are liberated into the serum, while alkaline phosphatase (ALP) is liberated into the serum in hepatic cholestasis [66]. The results of the present study shows significant elevations in the serum activities of these enzymes in the fish fed the diets containing the mixtures of AFB1 and FB1. The highest values for the AST, ALT and ALP were obtained in the fish fed diet B (contaminated with AFB1 and FB1). The AST, ALT and the ALP activities were significantly lower in the fish fed the diets containing lanthanum chloride and bentonite clay, compared with the corresponding values in the fish fed AFB1- and FB1-contaminated diets only. The fumonisins are reported to cause cellular rupture and necrosis by the inhibition of mitochondrial respiration and the complete deregulation of calcium homeostasis [68]; meanwhile, by its ability to preferentially bind to calcium, the lanthanum chloride may prevent tissue necrosis via this mechanism and, hence, reduce the elaboration of these enzymes into the serum, indicating some erythrocyte, hepatic and kidney protective effects of the dietary lanthanum chloride [24,69].
The serum creatinine concentration is increased significantly in the skeletal muscle necrosis and/or atrophy, as well as in chronic nephropathies [58,70]. In the present study, there were significant elevations of the serum creatinine concentration in the fish fed the diets containing the mixtures of AFB1 and FB1. The highest values for the serum creatinine concentration were obtained in the fish fed diet B (contaminated with AFB1 and FB1), indicating significant skeletal muscle necrosis and/or atrophy, as well as probable chronic nephropathy [66]. The serum creatinine concentrations of the fish fed AFB1 and FB1-contaminated diets, containing lanthanum chloride or bentonite clay, were significantly lower compared with those of the fish only fed the AFB1- and FB1-contaminated diets. This may be indicative of some liver and kidney protective effects of the lanthanum chloride in the Clarias gariepinus fed the diets contaminated with the mixtures of AFB1 and FB1 [24,71].
The serum urea nitrogen and the uric acid concentrations are critical analytes required in the assessments of the functional status of the kidney [67]. It is reported that decreases in the blood urea nitrogen concentrations are usually observed in hepatic insufficiencies and in cases of malnutrition, while an increased blood urea nitrogen concentration is commonly reported in renal disease, shock and in cardiac insufficiencies [71,72]. The results obtained from the present study show the serum urea and uric acid concentrations of the fish fed the diets contaminated with the mixtures of AFB1 and FB1 were significantly higher than those of the fish fed the control diet, indicating a significant impact on the kidneys [8,41,69]. The fish fed the diets contaminated with the mixtures of AFB1 and FB1 containing lanthanum chloride exhibited significantly lowered serum urea and uric acid concentrations compared to the fish fed the diets contaminated with only mixtures of AFB1 and FB1, indicating that the dietary lanthanum chloride in juvenile Clarias gariepinus may have some ameliorating effects on the AFB1- and FB1-induced kidney toxicities [70,73].
Lactate dehydrogenase (LDH) is an enzyme found in several tissues/organs (such as the muscles, liver, heart, kidneys and the blood vessels. It catalyzes the reversible transformation of pyruvate into lactate [74]. The increased serum activity of LDH is indicative of degenerative changes in any of the aforementioned tissues/organs [66,67]. The results of our study show that the serum LDH activity of the fish fed the diets contaminated with only mixtures of AFB1 and FB1 were significantly higher compared with those of the fish fed the control diet, indicating a significant impact on the kidneys and/or the other aforementioned organs [67,70]. The fish fed the diets contaminated with the mixtures of AFB1 and FB1 containing lanthanum chloride exhibited significantly lowered serum urea and uric acid concentrations compared to the fish fed the diets contaminated with only mixtures of AFB1 and FB1, indicating that the dietary lanthanum chloride in juvenile Clarias gariepinus may have some ameliorating effects on the toxicities of the mixtures of AFB1 and FB1 [40,75].

4. Conclusions

Under the present culture conditions, the dietary lanthanum chloride at 200 or 400 mg/kg feed could promote the growth performance, nutrient utilization and ameliorate the hematological and serum biochemical derangements produced by the dietary exposures to the mixtures of AFB1 and FB1 in the juvenile Clarias gariepinus catfish. A further study is needed to determine and confirm the exact dietary concentration of lanthanum chloride needed for the optimization of the growth and health performance of this fish species, under the challenge of inadvertent dietary exposures to mixtures of aflatoxin B1 and fumonisin B1.

5. Materials and Methods

5.1. Experimental Fish and Experimental Design

Three hundred and sixty (360) juvenile C. gariepinus catfish were acquired from a commercial catfish hatchery. The fish were allowed to acclimatize to laboratory conditions for 21 days before the commencement of the experiment.
Fifteen (12) 1000 L capacity tanks retrofitted with water inflow and outflow devices were divided into five groups (each consisting of a triplicate set of tanks, with each tank containing 30 juvenile C. gariepinus catfish), as described in [75].
The experiment adopted a complete randomized design with a triplicate of each treatment. Four groups, consisting of one control and three treatment groups, were used for this study. Group A (control group, were fed the control diet, i.e., no lanthanum chloride, no mycotoxin); Group B (treatment 1, were fed the basal diet amended with mixtures of AFB1 and FB1 at an inclusion rate of 19.7 μg AFB1/kg diet and 28.5 mg FB1/kg diet); Group C (treatment 2, were fed the basal diet amended with lanthanum chloride 200.0 mg/kg diet and mixtures of AFB1 and FB1 at an inclusion rate of 19.7 μg AFB1/kg diet and 28.5 mg FB1/kg diet); Group D (treatment 3, were fed the basal diet amended with lanthanum chloride 400.0 mg/kg diet and mixtures of AFB1 and FB1 at an inclusion rate of 19.7 μg AFB1/kg diet and 28.5 mg FB1/kg diet). The groups of fish were fed any of the diets A, B, C or D in triplicates for 56 days.

5.2. Experimental Feeds

The experimental feeds were produced at the University of Abuja feed mill, following the procedures reported by [39], with slight adjustments. The basal diet was formulated using the following ingredients (fish meal 19%, soybean cake 37%, maize 32.25%, palm oil 1.0%, fish oil 6.0%, starch binder 2.0%, vitamin/mineral premix 0.5%, bone meal 1.0%, salt 0.25%), to meet the nutritional requirements of the juvenile clariid fish [37].
The mixtures of the AFB1 and FB1 diets were produced by adding 1 mg crystalline AFB1 (Sigma Chemicals, St Louis, MO, USA) to 1 mL chloroform (to produce 1 mg: 1000 μL aliquot of AFB1). The quantity of the solution required to produce the chosen concentration of the AFB1 in the mixed mycotoxin diets was then pipetted using an automated adjustable pipette into 100 mL volumetric flasks. This volume was then made up to the 100 mL mark with methanol. The FB1 contents of the respective diets were added by careful measurements of the desired quantities of FB1 from a pre-produced aliquot of 1 g FB1 dissolved in 1000 μL of acetonitrile-water (v/v) (resulting in 1 μL:1 mg solution of fumonisin B1).
The ingredients for the basal diets were weighed, completely mixed, and added to the liquid mixture of AFB1 and FB1 (i.e., 17.0 µg AFB1; 23.0 FB1/kg diet), 200.0 mg lanthanum chloride, 400.0 mg lanthanum chloride or 400 mg/kg. Diet A (control 0.0 μg AFB1/kg + 0.0 mg FB1/kg diet); diet B (17.0 µg AFB1; 23.0 FB1/kg diet); diet C (lanthanum chloride 200.0 mg/kg and 17.0 µg AFB1; 23.0 FB1/kg diet) and diet D (lanthanum chloride 400.0 mg/kg and 17.0 µg AFB1; 23.0 FB1/kg diet).
The mixtures were subsequently blended and placed in a hot air oven for the methanol to evaporate. These were then pelletized with an extruder pelletizer, after the addition of weighted portions of the starch binders. The mycotoxins content of the compounded diets were then analyzed using the multi-mycotoxin LC-MS/MS method [76,77] and, thereafter, individually packed in airtight polyethylene bags and stored in a deep freezer (at 2–4 °C) until use. According to the results obtained following the mycotoxin assessments of the produced diets, the AFB1 and FB1 concentrations of the produced experimental diets were consequently adjusted, as shown in Table 1.
At time points day 7, 28 and day 56, five (5) fish were randomly selected (by the aid of a handheld sampling net) from each tank for hematological determinations. The sampled fish were weighed, length measured and then bled via caudal veni-puncture, using a 23 G needle fitted on a 5 mL syringe pre-rinsed with ethylene diamine tetra acetic (EDTA) solution (for hematological assessments), and without EDTA (for serum biochemical determinations).

5.3. Hematological Analysis

The hematological parameters, such as the hemoglobin concentration (Hb), total erythrocytes count (RBC) and total leucocytes count (WBC), packed cell volume (PCV), mean corpuscular hemoglobin (MCH), mean corpuscular hemoglobin concentration (MCHC) and mean corpuscular volume (MCV), were analyzed.
The Hb concentration was determined by the cyanmethemoglobin method [50]. A Neubauer hemocytometer was used for the determination of the total red and white blood corpuscle count, by using Natt and Herricks dilution fluid. The cell count was estimated as per [78], using the following formulae:
RBC count = number of cells counted × dilution factor × depth of chamber/area counted
where the dilution factor is one in 200; the depth is 1/10 mm; and the area counted is 80/400 = 1/5 sq.
WBC count = number of cells counted × blood dilution× chamber depth/number of chambers counted:
WBC/mm3 = total white blood cells × 200 × 10/4
The hematocrit (PCV) was determined by the following methods of [50] briefly, where micro-hematocrit capillaries were centrifuged at 12,000 g for 5 min in a micro-hematocrit centrifuge (Ocean Med, London, UK). The erythrocytic indices were determined mathematically, following the methods of [58].

5.4. Serum Biochemical Parameters

The serum was obtained from the blood (collected without anticoagulant), and kept in the narrow-bored glass test tubes after centrifugation at 5000× g for 5 min in a laboratory centrifuge (Uniscope model SM 112, Surgifield Medicals, Devon, UK. After centrifugation, the liquid fraction (the serum) was eluted from the top of the tube, using a clean and sterile 1 mL syringe. The collected serum was then transferred into a fresh Eppendorf tube and stored at −20 °C until used for biochemical analyses.
From the serum, the following biochemical parameters were determined: total protein and albumin (in g dL−1) using the methods of [17]; alanine amino transaminase and aspartate aminotransferase (UL−1), alkaline phosphatase (UL−1), lactase dehydrogenase (UL−1), creatinine kinase (µmol/L) following the methods of [67]. The serum urea (mg dL−1) and uric acid concentrations (µmol/L)) were determined, using the methods of [79]. The serum biochemistry evaluations were carried out, using a laboratory spectrophotometer (SpectrumLab 750, Huddinge, Sweden) and Dialab serum diagnostic kits (Dialab, Neudorf, Austria). The globulin values were calculated mathematically by subtracting the albumin values from the values obtained for serum total protein. All of the serum biochemical parameters were obtained by following strictly the guidelines of the manufacturers of the diagnostic kits.

5.5. Zootechnical Evaluations

The fish in each group were fed the respective feed at 5% of the biomass (the feed was divided into two portions, given at 0800 h and at 1800 h) daily. All of the unconsumed feed was siphoned, dried and weighed in order to determine the exact amount of feed consumed per group. At the set time points, the fish were individually weighed (to the nearest 0.00, using a sensitive laboratory scale) and their length measured (to the nearest 0.00 cm using a ruler). At the close of the feeding trial, the following growth indices were determined mathematically according to [80]:
(a)
Growth rate (g/d) = Wf − Wi/Tf − Ti
Where Wf = final weight
Wi = initial weight
Tf − Ti = Time (in days) spent feeding between Wf and Wi;
(b)
Specific growth rate (%/day) = 100 × [(ln Wf − ln Wi)/(Tf − Ti)];
(c)
Feed conversion ratio (FCR) = weight of feed consumed (g)/Wf − Wi (Wf = final weight; Wi = initial weight);
(d)
Feed conversion efficiency (%) = [Wf − Wi weight of feed consumed (g)] × 100

5.6. Statistical Evaluation

Data were expressed as the mean ± Standard Deviation of the mean of each group (n = 30) and analyzed by a one way analysis of variance (ANOVA). The variant means were then separated by the Duncan’s multiple range post hoc test using the Statistical Package of Social Sciences (SPSS) for Windows version 20.0 (IBM Corporation, Armonk, USA). Differences in the means were considered significant at p < 0.05.

Author Contributions

Conceptualization, B.T.A. and N.G.E.; methodology, B.T.A., N.G.E.; A.Z. and S.E.A.; validation, N.G.E.; G.M.O. and S.E.A.; formal analysis, T.B.K., A.E. and C.B.I.A.; investigation, A.E.; resources, T.B.K.; data curation, O.H.O. and G.M.O.; writing—original draft preparation, B.T.A. and N.G.E.; writing—review and editing, W.D.N., B.T.A. and O.H.O.; visualization, A.Z.; supervision, W.D.N. and C.B.I.A.; funding acquisition, B.T.A. All authors have read and agreed to the published version of the manuscript.

Funding

This research was funded by The University of Abuja Institutional Based Research Grant, grant number TETFUND/DESS/UNI/ABUJA/RP/VOL. 2 and the APC was funded by TETFUND/DESS/UNI/ABUJA/RP/VOL. 2.

Institutional Review Board Statement

Not applicable.

Informed Consent Statement

Not applicable.

Data Availability Statement

The data presented in this study are available on request from the corresponding author.

Acknowledgments

This work was conducted at the Veterinary Teaching and Research Farm, Faculty of Veterinary Medicine, University of Abuja. We therefore use this opportunity to appreciate the supporting staff of the farm for their efforts in the daily feeding of the experimental fish, and the Dean Faculty of Veterinary Medicine (Sani Saka), for granting permission to the facility. We also want to thank Alani and Lilian Uchenna for proofreading the manuscript.

Conflicts of Interest

The authors declare no conflict of interest.

References

  1. Food and Agricultural Organization (FAO) of the United Nations. The state of the World Fisheries and Aquaculture. In Contributing to Food Security and Nutrition for All; FAO: Rome, Italy, 2016; 200p. [Google Scholar]
  2. Olsen, R.L.; Hasan, M.R. A limited supply of fishmeal: Impact on future increases in global aquaculture. Trends Food Sci. Technol. 2012, 27, 120–128. [Google Scholar] [CrossRef]
  3. Encarnacao, P. Recent updates on the effects of mycotoxins in aquafeeds. Int. Aquafeed 2011, 14, 10–13. [Google Scholar]
  4. Santos, G.A.; Rodrigues, I.; Naechrer, K.; Encarnacao, P. Mycotoxins in Aquaculture: Occurrence in Feed Components and Impact on Animal Performance. Aquac. Eur. 2010, 35, 6–10. [Google Scholar]
  5. Spring, P.; Fegan, D.F. Mycotoxin—A rising threat to aquaculture? In Nutritional Biotechnology in the Feed and Food Industries, Proceeding of the Alltech’s 21st Annual Symposium, Lexington, KY, USA, 22–25 May 2005; Lyons, T.P., Jacque, K.A., Eds.; Alltech UK: Stamford, UK, 2005; pp. 323–332. [Google Scholar]
  6. Rodrigues, I.; Naehrer, K. A three-year survey on the worldwide occurrence of mycotoxins in feedstuffs and feed. Toxins 2012, 4, 663–675. [Google Scholar] [CrossRef]
  7. Bankole, S.A.; Mabekoje, O.O. Occurrence of aflatoxins and fumonisins in preharvest maize from south-western Nigeria. Food Addit. Contam. 2004, 21, 251–255. [Google Scholar] [CrossRef]
  8. Abdelhamid, F.M.; Elshopakey, G.E.; Aziza, A.E. Ameliorative effects of dietary Chlorella vulgaris and β-glucan against diazinon-induced toxicity in Nile tilapia (Oreochromis niloticus). Fish Shellfish. Immunol. 2020, 96, 213–222. [Google Scholar] [CrossRef]
  9. Oyedele, O.A.; Ezekiel, C.N.; Sulyok, M.; Adetunji, M.C.; Warth, B.; Atanda, O.O.; Krska, R. Mycotoxin risk assessment for consumers of groundnut in domestic markets in Nigeria. Int. J. Food Microbiol. 2017, 251, 24–32. [Google Scholar] [CrossRef]
  10. Food and Drug Administration (FDA); US Food and Drug Administration; Centre for Food Safety and Applied Nutrition; Centre for Veterinary Medicine. Guidance for Industry 2001. Fumonisin levels in Human Foods and Animal Feeds, November 9. 2001. Available online: https://www.fda.gov/regulatory-information/search-fda-guidance-documents/guidance-industry-fumonisin-levels-human-foods-and-animal-feeds (accessed on 13 January 2019).
  11. Food and Agriculture Organization of the United Nations (FAO). Worldwide Regulation of Mycotoxins in Food and Feed in 2004; FAO Food and Nutrition paper No 81, FAO: Rome, Italy, 2004; pp. 1728–3264. [Google Scholar]
  12. Puschner, B. Mycotoxins. Vet. Clin. North Am. Small Anim. Pract. 2002, 32, 409–419. [Google Scholar] [CrossRef]
  13. Sepahdar, A.; Ebrahimzadeh, H.A.; Sharifpour, I.; Khorsaivi, A.; Motallebi, A.A.; Mohseni, M.; Kakoolaki, S.; Pourali, H.R.; Hallajian, A. Effects of Different Dietary Levels of AFB1 on Survival Rate and Growth Factors of Beluga (Huso huso). Iran. J. Fish. Sci. 2009, 9, 141–150. [Google Scholar]
  14. Dey, D.K.; Chang, S.N.; Kang, S.C. The inflammation response, and risk associated with Aflatoxin B1 contamination was minimized by insect peptide CopA3 treatment and act towards the beneficial health outcomes. Environ. Pollut. 2020, 268, 115713. [Google Scholar] [CrossRef]
  15. International Agency for Research on Cancer (IARC). Chemical Agents and Related Occupations: A Review of Human Carcinogens; International Agency for Research on Cancer (IARC): Lyon, France, 2012. [Google Scholar]
  16. Spring, P. Mycotoxins—A rising threat to aquaculture. Feedmix 2005, 13, 1–5. [Google Scholar]
  17. Royes, J.B.; Yanong, R.P.E. Molds in Fish and Aflatoxicosis. 2002. Available online: http://edis.ifas.ufe.edu/fa095 (accessed on 22 March 2022).
  18. Han, X.Y.; Huang, Q.C.; Li, W.F.; Xu, Z.R. Changes in growth performance digestive enzyme activities and nutrient digestibility of Cherry valley ducks in response to aflatoxin B1levels. Livest. Sci. 2008, 119, 216–220. [Google Scholar] [CrossRef]
  19. Jantrarotai, W.; Lovell, R.T. Subchronic toxicity of dietary aflatoxin B1 to channel catfish. J. Aquat. Anim. Health 1990, 2, 248–254. [Google Scholar] [CrossRef]
  20. Manning, B.B.; Li, M.H.; Robinson, E.A. Aflatoxins from moldy corn cause no reduction in channel catfish (Ictalurus puntatus) performance. J. World Aquac. 2005, 23, 167–179. [Google Scholar]
  21. Tuan, N.A.; Manning, B.B.; Lovell, R.T.; Rottinghaus, G.E. Responses of Nile Tilapia (Oreochromis niloticus) fed diets containing different concentrations of moniliformin of fumonisin B1. Aquaculture 2003, 217, 515–528. [Google Scholar] [CrossRef]
  22. Sahoo, P.K.; Mukherjee, S.C. Immunosuppressive effects of afflation B1 in Indian major carp (Labeo rohita). Comp. Immunol. Microb. Infec. Dis. 2001, 24, 143–149. [Google Scholar] [CrossRef]
  23. Boonyaratpalin, M.; Supamattaya, K.; Verakunipiraya, V.; Supraset, D. Effects of aflatoxin B1 on growth performance blood component, immune function and histopathological changes in black tiger shrimp (Peanus monodons. Fabricius). Aquacuture Res. 2001, 32, 388–398. [Google Scholar] [CrossRef]
  24. Mughal, M.J.; Peng, X.; Kamboh, A.A.; Zhou, Y.; Fang, J. Aflatoxin B1 induced systemic toxicity in poultry and rescue effects of selenium and zinc. Biol. Trace Elem. Res. 2017, 178, 292–300. [Google Scholar] [CrossRef]
  25. Zychowski, K.E.; Hoffmann, A.R.; Ly, H.J.; Pohlenz, C.; Buentello, A.; Romoser, A.; Gatlin, D.M.; Phillips, T.D. The effect of aflatoxin-B1 on red drum (Sciaenops ocellatus) and assessment of dietary supplementation of NovaSil for the prevention of aflatoxicosis. Toxins 2013, 5, 1555–1573. [Google Scholar] [CrossRef]
  26. Maja, S. Fumonsins and their effect on animal with a brief review. Vet. Achiv 2001, 71, 299–320. [Google Scholar]
  27. Walter, F.O.; Maracas, W.F. O Discovery and occurrence of the fumonsins historical perspectives. Environ. Health 2001, 109, 239–243. [Google Scholar]
  28. Voss, K.A.; Smith, G.W.; Hashcek, W.M. Fumonisins: Toxicokinetics, mechanism of action and toxicity. Anim. Feed. Sci. Technol. 2007, 137, 299–325. [Google Scholar] [CrossRef]
  29. Slamova, R.; Trckova, M.; Vondruskova, H.; Zraly, Z.; Pavlik, I. Applied Clay Science Clay minerals in animal nutrition. Appl. Clay Sci. 2011, 51, 395–398. [Google Scholar] [CrossRef]
  30. Stanely, V.G.; Gray, C.; Daley, M.; Krueger, W.F.; Sefton, A.E. An Alternative to Antibiotic-Based Drugs in Feed for Enhancing Performance of Broilers Grown on Eimeria spp.-Infected Litter. Poult. Sci. 2001, 83, 39–44. [Google Scholar] [CrossRef]
  31. Casewell, M.; Friis, C.; Marco, E.; McMullin, P.; Phillips, I. The European ban on growth-promoting antibiotics and emerging consequences for human and animal health. J. Antimicrob. Chemother. 2003, 52, 159–161. [Google Scholar] [CrossRef]
  32. Rambeck, W.A.; He, M.L.; Wehr, U. Influence of the alternative growth promoter “rare earth elements” on meat quality in pigs. In Proceedings of the British Society of Animal Science Pig and Poultry Meat Quality: Genetic and Non-Genetic Factors, Krakow, Poland, 14–15 October 2004. [Google Scholar]
  33. He, M.L.; Wehr, U.; Rambeck, W.A. Effect of low doses of dietary rare earth elements on growth performance of broilers. J. Anim. Physiol. An. N. 2009, 94, 86–92. [Google Scholar] [CrossRef]
  34. Prause, B.; Gebert, S.; Wenk, C.; Rambeck, W.A.; Wanner, M. Impact of rare earth elements on metabolism and energy-balance of piglets. In Proceedings of the 9th Congress of the European Society of Veterinary and Comparative Nutrition, Grugliasco, Italy, 22–24 September 2005. [Google Scholar]
  35. He, M.L.; Ranz, D.; Rambeck, W.A. Study on performance enhancing effect of rare earth elements in growing and fattening pigs. J. Anim. Physiol. Anim. Nutr. 2001, 85, 263–270. [Google Scholar] [CrossRef]
  36. Fan, C.; Zhang, F.; Wu, Y.; Zhang, G.; Ren, J. A study of feeding organic REE additives on growing pork pigs. QingHai J. Husb. Vet. 1997, 27, 23–24. [Google Scholar]
  37. Shaw, H.; Jiang, Z.; Zong, Z.; Liu, H.; Liu, W. Effect of dietary Rare Earth Elements on some enzyme activities in liver, pancreas and blood of carp. Chin. Feed. 1999, 1, 21–22. [Google Scholar]
  38. Ayinla, O.A. Analysis of Feeds and Fertilizers for Sustainable Development in Nigeria; Technical Paper No. 83; Nigeria Institute of Oceanography and Marine Research Lagos Nigeria: Lagos, Nigeria, 2007; 13p.
  39. Tiamiyu, L.O.; Solomon, G.S.; Oketa, E.J. Effects of different boiling periods of soybean (Glycine max (L) Merill) on growth, performance of tilapia (Oreochromis niloticus) fingerlings. J. Aquat. Sci. 2006, 21, 15–18. [Google Scholar]
  40. Adeyemo, B.T.; Tiamiyu, L.O.; Ayuba, V.O.; Musa, S.; Odo, J. Effects of dietary mixed aflatoxin B1 and fumonisin B1 on growth performance and haematology of juvenile Clarias gariepinus catfish. Aquaculture 2018, 491, 190–196. [Google Scholar] [CrossRef]
  41. Ayyat, M.S.; Ayyat, A.M.N.; Al-Sagheer, A.A.; El-Hais, A.E.M. Effect of some safe feed additives on growth performance, blood biochemistry, and bioaccumulation of aflatoxin residues of Nile tilapia fed aflatoxin-B1 contaminated diet. Aquaculture 2018, 495, 27–34. [Google Scholar] [CrossRef]
  42. Hussain, D.; Mateen, A.; Gatlin, D.M. Alleviation of aflatoxin B1 (AFB1) toxicity by calcium bentonite clay: Effects on growth performance, condition indices and bioaccumulation of AFB1 residues in Nile tilapia (Oreochromis niloticus). Aquaculture 2017, 475, 8–15. [Google Scholar] [CrossRef]
  43. Tang, Y.; Zhang, B.; Wang, L.; Li, J. Effect of dietary rare earth elements-amino acid compounds on growth performance of carp and rainbow trout. Chin. J. Fish. 1997, 10, 88–90. [Google Scholar]
  44. Rofiat, A.S.; Fanelli, F.; Atanda, O.; Sulyok, M.; Cozzi, G.; Bavaro, S.; Krska, R.; Logrieco, A.F.; Ezekiel, C.N. Fungal and bacterial metabolites associated with natural contamination of locally processed rice (Oryza sativa L.) in Nigeria. Food Addit. Contam. Part A 2015, 32, 950–959. [Google Scholar] [CrossRef]
  45. Rushing, B.R.; Selim, M.I. Aflatoxin B1: A review on metabolism, toxicity, occurrence in food, occupational exposure, and detoxification methods. Food Chem. Toxicol. 2019, 124, 81–100. [Google Scholar] [CrossRef]
  46. Yildirim, M.; Manning, B.B.; Lovell, R.T.; Grizzler, J.M. Toxicity of Moniliformin and Fumonisin B1 Fed Singly and in Combination in Diets for Young Catfish Ictalurus punctatus. J. World Aquac. Soc. 2000, 31, 599–608. [Google Scholar] [CrossRef]
  47. Xie, J.; Wang, Z. The effect of organic rare-earth compounds on production performance of chicken. In Proceedings of the 2nd International Symposium on Trace Elements and Food Chain, Wuhan, China, 12–15 November 1998; p. 74. [Google Scholar]
  48. Xu, X.; Xia, H.; Rui, G.; Hu, C.; Yuan, F. Effect of lanthanum on secretion of gastric acid in stomach of isolated mice. J. Rare Earths 2004, 22, 427–464. [Google Scholar]
  49. Gonçalves, R.A.; Cam, T.D.; Tri, N.N.; Santos, G.A.; Encarnação, P.; Hung, L.T. Aflatoxin B1 (AFB1) reduces growth performance, physiological response, and disease resistance in Tra catfish (Pangasius hypophthalmus). Aquac. Int. 2018, 26, 921–936. [Google Scholar] [CrossRef]
  50. Anater, A.; Mayes, L.; Meca, G.; Ferrer, E.; Luciano, F.B.; Pimpão, C.T.; Font, G. Mycotoxins and their consequences in aquaculture: A review. Aquaculture 2016, 451, 1–10. [Google Scholar] [CrossRef]
  51. Campbell, T.W. Haematology of fish. In Veterinary Haematology and Clinical Chemistry; Thrall, M.A., Weiser, G., Allison, R., Eds.; John Wiley and Sons: Ames, IA, USA, 2012; pp. 293–312. [Google Scholar]
  52. Fazio, F. Fish haematology analysis as an important tool of aquaculture: A review. Aquaculture 2019, 500, 237–242. [Google Scholar] [CrossRef]
  53. Witeska, M. Erythrocytes in teleost fishes: A review. Zool. Ecol. 2013, 23, 275–281. [Google Scholar] [CrossRef]
  54. Zeng, Z.; Jiang, W.; Wu, P.; Liu, Y.; Zeng, Y.; Jiang, J.; Kuang, S.; Tang, L.; Zhou, X.; Feng, L. Dietary aflatoxin B1 decreases growth performance and damages the structural integrity of immune organs in juvenile grass carp (Ctenopharyngodon idella). Aquaculture 2019, 500, 1–17. [Google Scholar] [CrossRef]
  55. Ou, X.; Guo, Z.; Wang, J. The effects of rare earth element additive in feed on piglets. Livest. Poult. Ind. 2000, 4, 21–22. [Google Scholar]
  56. Harper, A.F.; Estienne, M.J.; Meldrum, J.B.; Harrell, R.J.; Diaz, D.E. Assessment of a hydrated sodium calcium aluminosilicate agent and antioxidant blend for mitigation of aflatoxin- induced physiological alterations in pigs. J. Swine Health Prod. 2010, 18, 282–289. [Google Scholar]
  57. Wang, Y.; Guo, F.; Yuan, K.; Hu, Y. Effect of lanthanum chloride on apoptosis of thymocytes in endotoxemia mice. Acta Acad. Med. Jiangxi 2003, 43, 31. [Google Scholar]
  58. Wang, H.; Sun, H.; Chen, Y.; Wang, X. The bioaccumulation of rare earth elements in the internal organs of fish and their effect on the activities of enzymes in liver. China Environ. Sci. 1991, 19, 141–144. [Google Scholar]
  59. Hrubec, T.C.; Cardinale, J.L.; Smith, S.A. Haematology and Plasma Chemistry Reference Intervals for Cultured Tilapia (Oreochromis Hybrid). Vet. Clin. Pathol. 2000, 29, 7–12. [Google Scholar] [CrossRef]
  60. Lusková, V. Annual cycles and normal values of hematological parameters in fishes. Acta Sci. Nat. Brno 1997, 31, 1–70. [Google Scholar]
  61. Mantantzis, K.; Schlaghecken, F.; Sünram-Lea, S.I.; Maylor, E.A. Sugar rush or sugar crash? A meta-analysis of carbohydrate effects on mood. Neurosci. Biobehav. Rev. 2019, 101, 45–67. [Google Scholar] [CrossRef] [PubMed]
  62. Hemre, G.I.; Mommsen, T.P.; Krogdahl, A. Carbohydrates in fish nutrition: Effects on growth, glucose metabolism and hepatic enzymes. Aquac. Nutr. 2002, 8, 175–194. [Google Scholar] [CrossRef]
  63. Metcalfe, N.B.; Monaghan, P. Compensation for a bad start: Grow now, pay later? Trends Ecol. Evol. 2001, 16, 254–260. [Google Scholar] [CrossRef]
  64. Santacroce, M.P.; Conversano, M.; Casalino, E.; Lai, O.; Zizzadoro, C.; Centoducati, G.; Crescenzo, G. Aflatoxins in aquatic species: Metabolism, toxicity and perspectives. Rev. Fish Biol. Fish. 2008, 18, 99–130. [Google Scholar] [CrossRef]
  65. Carraro, A.; De Giacomo, A.; Giannossi, M.L.; Medici, L.; Muscarella, M.; Palazzo, L.; Quaranta, V.; Summa, V. Clay minerals as adsorbents of aflatoxin M1 from contaminated milk and effects on milk quality. Appl. Clay Sci. 2014, 88, 92–99. [Google Scholar] [CrossRef]
  66. McCue, M.D. Starvation physiology: Reviewing the different strategies animals use to survive a common challenge. Comp. Biochem. Physiol. 2010, 156, 1–18. [Google Scholar] [CrossRef]
  67. Wagner, T.; Congleton, J.L. Blood chemistry correlates of nutritional condition, tissue damage, and stress in migrating juvenile chinook salmon (Oncorhynchus tshawytscha). Can. J. Fish. Aquat. Sci. 2004, 61, 1066–1074. [Google Scholar] [CrossRef]
  68. Lemarie, P.; Drai, P.; Mathieu, A.; Lemaire, S.; Carriere, S.; Giudicelli, S.; Lafaurie, M. Changes with different diets in plasma enzymes (GOT, GPT, LDH, ALP) and plasma lipids (cholesterol, triglycerides) of seabass (Dicentrarchus labrax). Aquaculture 1991, 93, 63–75. [Google Scholar] [CrossRef]
  69. Domijan, A.M.; Abramov, A.Y. Fumonisin B1 Inhibits Mitochondrial Respiration and Deregulates Calcium Homeostasis—Implication to Mechanism of Cell Toxicity. Int. J. Biochem. Cell Biol. 2011, 43, 897–904. [Google Scholar] [CrossRef]
  70. Indresh, H.; Devegowda, G.; Ruban, S.; Shivakumar, M. Effects of high-grade bentonite on performance, organ weights and serum biochemistry during aflatoxicosis in broilers. Vet. World 2013, 6, 313. [Google Scholar] [CrossRef]
  71. Bucci, T.Y.; Howard, P.C.; Tollerson, W.H.; LaBorde, J.B.; Hansen, D.K. Renal effects of fumonisin mycotoxins in animals. Toxicol. Pathol. 1998, 26, 160–164. [Google Scholar] [CrossRef]
  72. Waisbren, S.E.; Gropman, A.L. Improving long-term outcomes in urea cycle disorders. J. Inherit. Metab. Dis. 2016, 39, 573. [Google Scholar] [CrossRef]
  73. Bezerra, R.F.; Soares, M.C.F.; Santos, A.J.G.; Maciel-Carvalho, E.V.; Coelho, L.C.B.B. Secondary indicators of seasonal stress in the Amazonian pirarucu fish (Arapaima gigas). In Advances in Environmental Research; Daniels, J.A., Ed.; Nova Science Publishers: New York, NY, USA, 2013; pp. 233–244. [Google Scholar]
  74. Naiel, M.A.E.; Ismael, N.E.M.; Shehata, S.A. Ameliorative effect of diets supplemented with rosemary (Rosmarinus officinalis) on aflatoxin B1 toxicity in terms of the performance, liver histopathology, immunity and antioxidant activity of Nile Tilapia (Oreochromis niloticus). Aquaculture 2019, 511, 734–764. [Google Scholar] [CrossRef]
  75. Knowles, S.; Hrubec, T.C.; Smith, S.A.; Bakal, R.S. Haematology and plasma chemistry reference intervals for cultured short Nose Sturgeon (Acipenser brevirostrum). Vet. Clin. Pathol. 2006, 35, 434–440. [Google Scholar] [CrossRef]
  76. Adeyemo, B.T.; Oloyede, L.T.; Ogeh, A.V.; Orkuma, C.J. Growth performance and serum lipids profile of Clarias gariepinus catfish following experimental dietary exposure to fumonisin B1. Open J. Vet. Med. 2016, 6, 127–138. [Google Scholar] [CrossRef]
  77. Monbaliu, S.; Van Poucke, C.; Detaverneir, C.; Dumoulin, F.; Van de Velde, M.; Schoeters, E.; Van Dyek, S.; Averkieva, O.; Van Peteghem, C.; De Saeger, S. Occurrence of Mycotoxins in Feed as Analyzed by a Multi-Mycotoxin LC-MS/MS Method. J. Agric. Food Chem. 2010, 58, 66–71. [Google Scholar] [CrossRef]
  78. Campbell, T.W. Haematology of fish. In Veterinary Haematology and Clinical Chemistry; Troy, D.B., Ed.; Lippincott. Williams and Wilkins: Baltimore, MD, USA, 2004; pp. 277–289. [Google Scholar]
  79. Myburgh, J.G.; Botha, C.J.; Booyse, D.G.; Reyers, F. Provisional clinical chemistry parameters in the African Sharptooth catfish (Clarias gariepinus). J. S. Afr. Vet. Assoc. 2008, 79, 156–160. [Google Scholar] [CrossRef]
  80. Arnason, T.; Björnsson, B.; Steinarsson, A.; Oddgeirsson, M. Effects of Temperature and Body Weight on Growth Rate and Feed Conversion Ratio in Turbot (Scohthalmus maximus). Aquaculture 2009, 295, 218–225. [Google Scholar] [CrossRef]
Figure 1. Mean corpuscular volume juvenile Clarias gariepinus fed diets amended with lanthanum chloride and mixtures of aflatoxin B1 and fumonisin B1 for 56 days. Bars with different superscripts are significantly different (p < 0.05) at specified periods of feeding.
Toxins 14 00553 g001
Figure 2. Mean corpuscular hemoglobin of juvenile Clarias gariepinus fed diets amended with lanthanum chloride and mixtures of aflatoxin B1 and fumonisin B1 for 56 days. Bars with different superscripts are significantly different (p < 0.05) at specified periods of feeding.
Toxins 14 00553 g002
Figure 3. Mean corpuscular hemoglobin concentration of juvenile Clarias gariepinus fed diets amended with lanthanum chloride and mixtures of aflatoxin B1 and fumonisin B1 for 56 days. Bars with different superscripts are significantly different (p < 0.05) at specified periods of feeding.
Toxins 14 00553 g003
Table 1. Ingredients and Proximate Composition of Diets Amended with Lanthanum chloride, Bentonite clay and Mixtures of Aflatoxin B1 and Fumonisin B1.
ParameterDiet ADiet BDiet CDiet D
¥Fish meal (%)19.019.019.019.0
Soybean cake (%)38.0038.0038.0038.00
Maize (%)32.2232.2432.2332.23
Palm oil (%)1.001.001.001.00
Fish oil (%)6.006.006.006.00
Vit/min premix (%)0.500.500.500.50
Bone meal (%)1.001.001.001.00
NaCl (%)0.230.230.230.23
LC (mg/kg)0.00.0200.00400.00
AFB1 (μg/kg): FB1 (mg/kg)2.0; 3.019.7; 28.519.7; 28.519.7; 28.5
Ʊ Starch binder (%)2.002.002.002.00
Crude protein (%)40.0440.0040.0240.01
Gross energy (kj/g)20.0020.0119.9720.02
Digestible energy (kj/g)12.0012.0412.0112.07
Total lipids (%)9.09.09.09.0
Moisture (%)2.272.332.332.33
Ash (%)9.659.709.719.65
¥ Fish meal of 72% crude protein; Ʊ Cassava starch binder; LC = Lanthanum chloride; BC = Bentonite clay. Diet A (control 2.0 μg AFB1/kg + 3.0 mg FB1/kg); Diet B (19.7 μg AFB1/kg + 28.5 mg FB1/kg); Diet C (lanthanum chloride 200.0 mg/kg and 19.7 μg AFB1/kg + 28.5 mg FB1/kg); Diet D (lanthanum chloride 400.0 mg/kg and (19.7 μg AFB1/kg + 28.5 mg FB1/kg).
Table 2. Growth response of juvenile Clarias gariepinus catfish fed diets amended with lanthanum chloride and mixtures of aflatoxin B1 and fumonisin B1 for 56 days.
Diet A (Control)Diet BDiet CDiet D
Mean initial body weight (g)85.04 ± 1.17 a85.00 ± 0.21 a85.02 ± 1.21 a85.09 ± 1.01 a
Mean final body weight (g)168.0 ± 4.99 a116.2 ± 2.07 b131.4 ± 6.35 c138.5 ± 3.19 d
Mean weight gained (g)81.00 ± 1.11 a31.5 ± 1.12 b47.90 ± 1.09 c51.2 ± 1.25 d
Feed fed (g)197.38 ± 1.42 a102.94 ± 1.11 b94.91 ± 1.13 c105.04 ± 1.08 d
FCR2.437 ± 0.11 a3.268 ± 0.05 b1.981 ± 0.07 c2.052 ± 0.07 c
FCE41.04 ± 2.97 a30.60 ± 1.66 b50.47 ± 1.14 c49.21 ± 1.12 d
SGR (%/day)1.19 ± 0.03 a0.54 ± 0.01 b0.77 ± 0.01 cd0.83 ± 0.66 cd
Survival (%)100.00100.00100.00100.00
Diet A (control 2.0 μg AFB1/kg + 3.0 mg FB1/kg); Diet B (19.7 μg AFB1/kg + 28.5 mg FB1/kg); Diet C (lanthanum chloride 200.0 mg/kg and 19.7 μg AFB1/kg + 28.5 mg FB1/kg); Diet D (lanthanum chloride 400.0 mg/kg and 19.7 μg AFB1/kg + 28.5 mg FB1/kg). Rows with different superscripts are significantly different (p < 0.05).
Table 3. Hematological profile of juvenile Clarias gariepinus catfish fed diets amended with lanthanum chloride and mixtures of aflatoxin B1 and fumonisin B1 for 7 days.
ParameterDiet A (Control)Diet BDiet CDiet D
Erythrocytes (109 cells/mm3)2.21 ± 0.01 a1.43 ± 0.04 b1.68 ± 0.01 c1.60 ± 0.02 d
Leucocytes (106 cells/mm3)2.30 ± 01.01 a1.95 ± 0.01 b2.04 ± 0.03 c2.10 ± 0.01 d
Hematocrit (%)29.85 ± 0.12 a16.42 ± 0.36 b22.76 ± 1.88 c25.19 ± 1.17 d
Hemoglobin concentration (g/dl)9.00 ± 0.59 a7.79 ± 0.64 b8.39 ± 0.51 c8.50 ± 0.39 a
Diet A (control 2.0 μg AFB1/kg + 3.0 mg FB1/kg); Diet B (19.7 μg AFB1/kg + 28.5 mg FB1/kg); Diet C (lanthanum chloride 200.0 mg/kg and 19.7 μg AFB1/kg + 28.5 mg FB1/kg); Diet D (lanthanum chloride 400.0 mg/kg and 19.7 μg AFB1/kg + 28.5 mg FB1/kg). Rows with different superscripts are significantly different (p < 0.05).
Table 4. Hematological profile of juvenile Clarias gariepinus catfish fed diets amended with lanthanum chloride and mixtures of Aflatoxin B1 and fumonisin B1 for 28 days.
ParameterDiet A(Control)Diet BDiet CDiet D
Erythrocytes (109 cells/mm3)2.18 ± 0.07 a1.21 ± 0.06 b1.72 ± 0.01 c1.69 ± 0.01 c
Leucocytes (106 cells/mm3)2.26 ± 0.01 a1.14 ± 0.01 b2.11 ± 0.02 c2.13 ± 0.01 d
Hematocrit (%)30.17 ± 1.39 a18.31 ± 4.12 b25.49 ± 1.09 c24.83 ± 1.00 d
Hemoglobin concentration (g/dl)9.97 ± 0.59 a6.31 ± 1.47 b7.83 ± 0.98 cd8.00 ± 0.81 cd
Diet A (control 2.0 μg AFB1/kg + 3.0 mg FB1/kg); Diet B (19.7 μg AFB1/kg + 28.5 mg FB1/kg); Diet C (lanthanum chloride 200.0 mg/kg and 19.7 μg AFB1/kg + 28.5 mg FB1/kg); Diet D (lanthanum chloride 400.0 mg/kg and 19.7 μg AFB1/kg + 28.5 mg FB1/kg). Rows with different superscripts are significantly different (p < 0.05).
Table 5. Hematological profile of juvenile Clarias gariepinus catfish fed diets amended with lanthanum chloride and mixtures of Aflatoxin B1 and fumonisin B1 for 56 days.
ParameterDiet A (Control)Diet BDiet CDiet D
Erythrocytes (109 cells/mm3)2.44 ± 0.01 a1.25 ± 0.06 b2.06 ± 0.01 c1.99 ± 0.01 d
Leucocytes (106 cells/mm3)2.26 ± 0.01 a1.09 ± 0.01 b2.03 ± 0.02 c2.01 ± 0.01 d
Hematocrit (%)30.00 ± 2.03 a16.18 ± 6.04 b25.61 ± 2.39 c25.70 ± 4.05 c
Hemoglobin concentration (g/dl)10.05 ± 0.16 a6.72 ± 1.39 b8.53 ± 0.74 c8.37 ± 0.55 c
Diet A (control 2.0 μg AFB1/kg + 3.0 mg FB1/kg); Diet B (19.7 μg AFB1/kg + 28.5 mg FB1/kg); Diet C (lanthanum chloride 200.0 mg/kg and 19.7 μg AFB1/kg + 28.5 mg FB1/kg); Diet D (lanthanum chloride 400.0 mg/kg and 19.7 μg AFB1/kg + 28.5 mg FB1/kg). Rows with different superscripts are significantly different (p < 0.05).
Table 6. Serum biochemical profile of juvenile Clarias gariepinus catfish fed diets amended with lanthanum chloride and mixtures of aflatoxin B1 and fumonisin B1 for 7 days.
ParameterDiet A (Control)Diet BDiet CDiet D
Total Protein (g/dL)6.01 ± 1.08 a6.00 ± 1.27 a5.94 ± 1.12 a6.01 ± 1.13 a
Albumin (g/dL)3.81 ± 0.23 a3.93 ± 0.17 a4.10 ± 0.11 ab4.17 ± 0.88 b
Globulin (g/dL)2.20 ± 0.01 a2.07 ± 0.03 b1.84 ± 0.04 cd1.84 ± 0.02 cd
ALT (u/L)12.34 ± 10.18 a76.08± 11.29 bc81.00± 26.08 cd78.11 ± 13.21 bd
AST (u/L)79.18 ± 5.39 a144.03± 12.01 b84.27± 4.19 c80.59 ± 6.13 ac
ALP (u/L)154.22 ± 7.07 a248.76 ± 9.26 b175.08 ± 6.15 cd172.31 ± 8.33 cd
Creatinine (µmol/L)2.19 ± 0.16 a8.00 ± 0.6 b5.61 ± 0.13 cd6.02 ± 0.67 cd
Urea (mg/dL)18.95 ± 3.11 a33.17 ± 1.94 b23.09 ± 2.13 c27.12 ± 3.15 d
Uric Acid (µmol/L)2.00 ± 0.08 a6.03 ± 1.33 b3.04 ± 0.99 cd3.11 ± 1.04 cd
LDH (u/L)607.19 ± 10.11 a854.47± 21.16 b677.16 ± 29.17 c644.82 ± 11.1 d
Diet A (control 2.0 μg AFB1/kg + 3.0 mg FB1/kg); Diet B (19.7 μg AFB1/kg + 28.5 mg FB1/kg); Diet C (lanthanum chloride 200.0 mg/kg and 19.7 μg AFB1/kg + 28.5 mg FB1/kg); Diet D (lanthanum chloride 400.0 mg/kg and 19.7 μg AFB1/kg + 28.5 mg FB1/kg). Rows with different superscripts are significantly different (p < 0.05).
Table 7. Serum biochemical profile of juvenile Clarias gariepinus catfish fed diets amended with lanthanum chloride and mixtures of aflatoxin B1 and fumonisin B1 for 56 days.
ParameterDiet A (Control)Diet BDiet CDiet D
Total Protein (g/dL)5.63 ± 0.55 a6.08 ± 0.23 abcd5.99 ± 0.28 bcd5.85 ± 0.34 abc
Albumin (g/dL)3.76 ± 0.03 a4.06 ± 0.12 be3.93 ± 0.06 c3.82 ± 0.02 d
Globulin (g/dL)1.87 ± 0.01 a2.02 ± 0.03 be2.06 ± 0.01 c2.03 ± 0.02 d
ALT (u/L)13.61 ± 0.31 a54.93 ± 2.17 b25.00 ± 1.10 c27.09 ± 1.15 d
AST (u/L)83.24 ± 1.88 a159.07 ± 9.01 b92.8 ± 2.19 cd94.01 ± 3.24 cd
ALP (u/L)162.01 ± 10.02 a 243.91 ± 6.24 b183.2 ± 7.1 cd185.3 ± 6.5 cd
Creatinine (µmol/L)2.24 ± 0.19 a 6.39 ± 0.01 b3.25 ± 0.17 cd3.15 ± 0.43 cd
Urea (mg/dL)20.38 ± 2.17 a31.68 ± 1.81 b26.39 ± 3.14 c24.28 ± 1.19 d
Uric Acid (µmol/L)1.83 ± 0.11 a5.07 ± 0.19 b2.91 ± 0.01 c3.06 ± 0.13 d
LDH (u/L)593.82 ± 12.19 a965.5 ± 34.28 b617.8 ± 19.0 ce637.9 ± 18.1 d
Diet A (control 2.0 μg AFB1/kg + 3.0 mg FB1/kg); Diet B (19.7 μg AFB1/kg + 28.5 mg FB1/kg); Diet C (lanthanum chloride 200.0 mg/kg and 19.7 μg AFB1/kg + 28.5 mg FB1/kg); Diet D (lanthanum chloride 400.0 mg/kg and 19.7 μg AFB1/kg + 28.5 mg FB1/kg). Rows with different superscripts are significantly different (p < 0.05).
Publisher’s Note: MDPI stays neutral with regard to jurisdictional claims in published maps and institutional affiliations.

