Article

The Impact of Atmospheric Plasma/UV Laser Treatment on the Chemical and Physical Properties of Cotton and Polyester Fabrics

IMRI, School of Engineering, University of Bolton, Bolton BL3 5AB, UK
*
Author to whom correspondence should be addressed.
Fibers 2022, 10(8), 66; https://doi.org/10.3390/fib10080066
Submission received: 25 May 2022 / Revised: 12 July 2022 / Accepted: 25 July 2022 / Published: 28 July 2022
(This article belongs to the Special Issue Natural Fiber Competitiveness and Sustainability)

Abstract

:
Atmospheric plasma treatment can modify fabric surfaces without affecting their bulk properties. One recently developed, novel variant combines both plasma and UV laser energy sources as a means of energising fibre surfaces. Using this system, the two most commonly used fibres, cotton and polyester, have been studied to assess how respective fabric surfaces were influenced by plasma power dosage, atmosphere composition and the effects of the presence or absence of UV laser (308 nm XeCl) energy. Plasma/UV exposures caused physical and chemical changes on both fabric surfaces, which were characterised using a number of techniques including scanning electron microscopy (SEM), radical scavenging (using 2,2-diphenyl-1-picrylhydrazyl (DPPH)), thermal analysis (TGA/DTG, DSC and DMA), electron paramagnetic resonance (EPR) and X-ray photoelectron spectroscopy (XPS). Other properties studied included wettability and dye uptake. Intermediate radical formation, influenced by plasma power and presence or absence of UV, was key in determining surface changes, especially in the presence of low concentrations of oxygen or carbon dioxide (20%) mixed with either nitrogen or argon. Increased dyeability with methylene blue indicated the formation of carboxyl groups in both exposed cotton and polyester fabrics. In the case of polyester, thermal analysis suggested increased cross-linking had occurred under all conditions.

1. Introduction

During the last 15 years or so, atmospheric plasma treatment has been investigated by the textile industry to modify fabric surfaces without affecting bulk fabric properties [1,2,3]. Improvements in dye uptake [2,3,4], antibacterial properties, water or oil repellence [5,6,7] and flame retardancy [2,3,8,9] have been noted. Such surface modification, while enhancing access to the internal fibre structure and so improving properties such as the rate of dyeing, may also enable application of surface finishes which would otherwise require more traditional, often resource-intensive processes [3]. Potential commercial advantages of atmospheric plasma include the absence of a vacuum requirement and its being able to be applied more easily to open-width fabrics.
Application of atmospheric plasma to cotton-containing fabrics has been well documented with regard to the removal of surface waxes as an alternative to the traditional alkaline scouring procedures which require intensive usage of water and energy [2,3,9,10,11]. The effects of variables such as discharge power, flow rate of oxygen (carried in helium), jet traversing speed and jet-to-substrate distance on wettability of cotton fabric have also been studied for plasma flame [12] as well as plasma power, exposure time and gas type for dielectric barrier discharge (DBD) atmospheric treatments [13,14]. This latter work included X-ray photoelectron spectroscopic (XPS) analysis following exposure under argon, which showed a reduction in surface carbon concentration Another work reported that after He/O21% atmospheric plasma treatment [15], the percentage of oxygen atoms present increased together with a decrease in the relative amount of carbon atoms. In addition, a decrease in the C=O concentration and an increase in O-C=O bond formation was reported. With respect to polyester fabrics, while as with cotton and surface reactivity [16] and water wettability [17,18], it increased with increasing plasma power, fibre surface topographies were modified in terms of pit formation and increased roughness [19], especially when oxygen is present. XPS results showed the formation of oxygenated species [20], including hydroxyl and carboxyl groups on the surface [17,18], although N-containing species were introduced on the fibre surfaces after N2 plasma treatment [19].
Recently, we showed that exposure of nylon 6.6 fabrics to a high-energy atmospheric plasma coupled to a 308 nm UV excimer laser [21,22,23] in a variety of atmospheres (argon, nitrogen and mixtures with oxygen or carbon dioxide) created changes to fibre surface chemistry in the form of additional functional groups (principally NH2 and COOH) [23]. This work also showed that while these chemical surface changes were not easily analysed with commonly used analytical techniques such as FTIR-ATR, other techniques such as diagnostic dyeing, XPS, radical scavenging and electron paramagnetic resonance (EPR) were helpful in characterising changes and identifying functional groups formed on the surfaces.
The aim of this work is to study the effects of combined plasma/UV exposure on the physical and chemical changes occurring on the surfaces of bleached cotton and scoured polyester fabrics. These fabric types were chosen because they comprise the most commonly used fibres for consumer textiles where the need to improve their environmental processing footprint is significant. The fabric samples were exposed to different types of plasma gases including argon (Ar), nitrogen (N2) and mixtures of nitrogen and oxygen (O2) and carbon dioxide (CO2). Samples were characterised for physical (morphological) and chemical (formation of free radicals and functional groups) changes using different analytical techniques.

2. Materials and Methods

2.1. Fabrics and Preparations

Commercially bleached woven cotton fabric (Cot) with an area density of 251.5 g/m2 was used without further preparation. A woven polyester fabric (PET) with an area density of 250.0 g/m2 was scoured with distilled water at 90 °C containing a non-ionic wetting agent Triton-x 100 at 0.5 g/L for 1 h to remove any adventitious oily contaminants and dried in an oven at 80 °C for two hours. Both fabrics were purchased from Whaleys Ltd., Bradford, UK. Both cotton and polyester fabrics were cut into pieces measuring 25 cm × 100 cm ready for plasma treatment.

2.2. Atmospheric Plasma/UV Laser Treatment

The combined atmospheric plasma/UV laser system is a commercially available full-scale equipment manufactured by MTIX Ltd., Huddersfield UK, sometimes defined as a Multiplexed Laser Surface Enhancement (MLSE) system which comprises an atmospheric plasma/UV excimer laser source [21]. This system is based on a combined atmospheric plasma/UV laser facility developed specifically for processing textiles and has been described fully elsewhere [22,23]. While the MLSE atmospheric plasma/UV laser system enables a number of process variables to be studied, this study has focused on the effects of changing the plasma power, and the type of plasma gas as explained in Table 1, while keeping all other machine variables constant including fabric velocity at 20 m/min, laser energy = 228 W, electrode gap = 1.5 mm and gas flow = 28 L/m. There is the option to turn off the UV laser if not required.
The samples, in triplicate, were treated for one or several cycles under atmospheric plasma as described elsewhere in detail [23] and outlined below. The plasma power dosage was calculated following these two equations for this plasma treatment [21,23].
Power dosage (W/m2·min) = No. of plasma cycles × (Power/surface coverage)
Surface coverage (m2/min) = Conveyor speed × Plasma width
Table 1 summarises the exposure conditions used during this study. The samples were treated on both sides with four plasma/UV head electrodes (2 heads/side) and nominally at 1 kW laser power per side per cycle. Laser dosages of 200, 500 and 1000 W/m2·min per side were achieved following multiple scans or cycles and so represent the cumulative effect for the 2, 5 and 10 plasma power series, which may not be equivalent to a single 2, 5 or 10 kW scan, respectively. For the special case of a 3.5 kW scan for polyester, exposure was a single scan at this power per side and so this reflects a real increase in plasma power for a single scan with respect to all other conditions.

2.3. Morphological Characterisation

A Hitachi S-3400N Scanning Electron Microscope was used to study the changes in the surface morphology of the coated fabric samples before and after plasma/UV laser treatment. All the samples were mounted on aluminium stubs using SEM conductive adhesive tape. Then, the samples were sputter-coated with a conductive gold layer using a Quorum Technologies SC7620 sputter coater before SEM analysis with a beam voltage over the range 2–5 kV.

2.4. Free Radical Identification

2.4.1. UV–Visible Spectrophotometric Analysis Using 2,2-Diphenyl-1-Picrylhydrazyl (DPPH) as a Radical Scavenger

The use of 2,2-diphenyl-1-picrylhydrazyl (DPPH), a dark-coloured crystalline powder composed of stable free radical molecules, has been previously described [23,24] and is based on its absorption in the visible region with a maximum of approximately 517 nm due to the free radical on the nitrogen atom present. In the presence of radicals or protons, the absorbance value will decrease and may shift to 510 nm [25].
The 100 µM DPPH solutions (0.004 g DPPH/100 mL methanol, (of spectrophotometric grade 99.9%, Sigma Aldrich, Poole, UK)) were prepared under a nitrogen atmosphere inside a glove box to prevent any chemical reaction with oxygen in the air. In addition, all the test tubes and flasks were covered with aluminium foil to prevent any interaction with light [26]. These precautions were taken because DPPH is essentially a stable radical, which yields a strongly light-absorbing solution and which not only is chemically active with other radicals, but also may be photochemically active. Immediately after plasma treatment, a specimen in size 2 cm × 2 cm was cut from each fabric and immersed in 10 mL of 100 µM DPPH solutions. Three replicates were prepared and analysed from each sample.
Samples from the supernatant DPPH solution from each plasma-treated fabric specimen were collected after intervals of 15, 30, 60 min, 24 h and 48 h and each was sealed and stored in the glove box under nitrogen until all were collected. Two control samples, DPPH solution and DPPH solution/unexposed fabric, in addition to pure methanol solvent were used as reference samples. Each supernatant solution specimen was then analysed using a Camspec M500 series scanning UV–visible spectrometer. For UV–visible analysis of DPPH solutions, acrylic cuvettes were used with 1.0 cm path-length.
The percentage for radical scavenging activity (%RSA) for DPPH radicals was calculated according to the Equation (3) at a given time after plasma exposure:
% RSA = [(C1 − C2)/C1] × 100
where C1 is the concentration of DPPH solution (µM) and C2 is the concentration of DPPH solution/exposed fabric (µM). Based on the average of three replicates per sample, the experimental error was ±0.5–1.0 with respect to each value.

2.4.2. Electron Paramagnetic Resonance (EPR) Analysis

EPR analysis was undertaken using a Bruker ELEXSYS E580 spectrometer of both cotton and polyester fabrics. The full instrumental details have been previously reported [23]. Two replicates per sample were analysed. Because polyester was considered to be more inert than cotton, the MLSE power was increased to 3.5 kW only for the EPR study in the expectation that radical formation would be maximised (see Table 1).
All MLSE-treated fabric samples were introduced into quartz capillary tubes (outer diameter 4 mm, inner diameter 3 mm) and frozen in liquid nitrogen ready to be transferred from the commercial establishment to the University of Manchester for analysis, where they were then stored at liquid helium temperatures of approximately −269 °C (4 K).
Each quartz capillary tube contained either one or two cut string-like pieces of treated materials (approximately 1.5–2.0 cm in length). The quartz capillary tubes were then transferred into the EPR spectrometer, which was pre-cooled to 20 K.

2.5. Chemical Surface Changes

2.5.1. X-ray Photoelectron Spectroscopy (XPS)

The XPS spectra were determined using a Kratos Axis Supra instrument at the EPSRC National Facility for XPS (‘HarwellXPS’). Samples were mounted on to copper tape and exposed to a 1486.7 eV Al (mono) ray with 150 W strength. Each sample was analysed three times from different positions. Data were provided as VAMAS files and analysed using CASAXPS demo software. The C–C component of the C1s signal at 285.0 eV was also used as the reference value for the binding energy scale.

2.5.2. Methylene Blue Dye Solution as Diagnostic Dye for Surface Chemical Changes

Methylene blue dye has been previously used to demonstrate changes in surface carboxylic acid group formation during MLSE treatment of nylon 6.6 fabrics and is used here using the previously described procedure [23]. Fabric specimens 2 cm × 2 cm in size were immersed in 100 mL 1% aqueous methylene blue solution at 25 °C for cotton and for polyester fabric at 60 °C (i.e., just below the glass transition temperature, Tg). These respective relatively low temperatures were selected so that only surface –COOH groups would interact with dye molecules, which would not penetrate below the fibre surface. Following a series of time intervals between 15 min and 60 min, the samples were removed from the dye solution and repeatedly washed with distilled water to remove any excess dye. Afterward the samples were dried in air and analysed by ImageJ software to study the changes in the colour intensity in terms of the derived red, green blue (RGB) colour co-ordinate values [27,28].

2.6. Thermal Behaviour

Thermal degradative behaviours of cotton and polyester fabrics before and after plasma treatment were studied using an SDT 2960 Simultaneous DTA-TGA instrument (TA Instruments, UK). Sample sizes were 5.0–6.0 mg for cotton and 8.0 and 12.0 mg for polyester, the heating rate was 10 °C/min under air with flow rate 110 mL/min and each sample was heated from 30 °C to 700 °C. The results obtained from the mass loss curves were analysed to determine the onset temperature of sample decomposition at a defined percentage mass loss, maximum rate of mass loss temperature and the percent of mass residue at various temperatures.
DSC analysis was performed under nitrogen (TA Q2000, TA instruments, Leatherhead, UK) on polyester fabric only with and without MLSE treatment, sample size was 5.0–7.0 mg. A heat–cool–heat run was performed with heating and cooling rates of 10 °C/min under a controlled nitrogen atmosphere (50 mL/min). The percentage crystallinity of the polyester was calculated according to Equation (4):
Crystallinity % = ΔHf/ΔHfo × 100%
where ΔHf is the melting enthalpy derived from the area under a given DSC melting endotherm and ΔHfo is the theoretical heat of fusion of the completely crystalline polyester at the equilibrium melting temperature Tmo equals 140.1 J/g [29,30,31].
DSC data also enabled a measure of the remaining cross-linking capability in the various samples to be made, although this technique is more often than not used to determine the degree of cure in thermosetting resins [32,33]. This “DSC degree of cross-linking” was thus determined from the melting enthalpy ΔHf of the MLSE- exposed sample with respect to the melting enthalpy ΔHfc of the untreated polyester according to Equation (5).
Cross-linking, % = (ΔHfc − ΔHf)/ΔHfc × 100%
A DMA Q8000 (TA instruments, Leatherhead, UK) instrument was used to analyse the thermal transitions of the plasma-treated and untreated polyester and also to determine whether cross-linking had occurred. A specimen of dimensions 0.46 mm × 9.87 mm × 14 mm was attached to a tension-film clamp. The Tan δ peak was considered to coincide with the second-order thermal transition (Tg) of each sample. The measurements were performed in a single-strain mode from room temperature to 150 °C with a heating rate of 3 °C/min, 1 Hz frequency and an oscillation amplitude of 15 µm.

2.7. Wettability (Water Drop Test)

Wettability was determined before and after plasma exposure to examine changes in hydrophilicity by measuring the diameter of a drop of 1% methylene blue aqueous dye solution on to the surface of fabric, 2 cm × 3 cm, using a Kimble disposable glass Pasteur pipette at a fixed height of 5 cm after 2 min.

3. Results

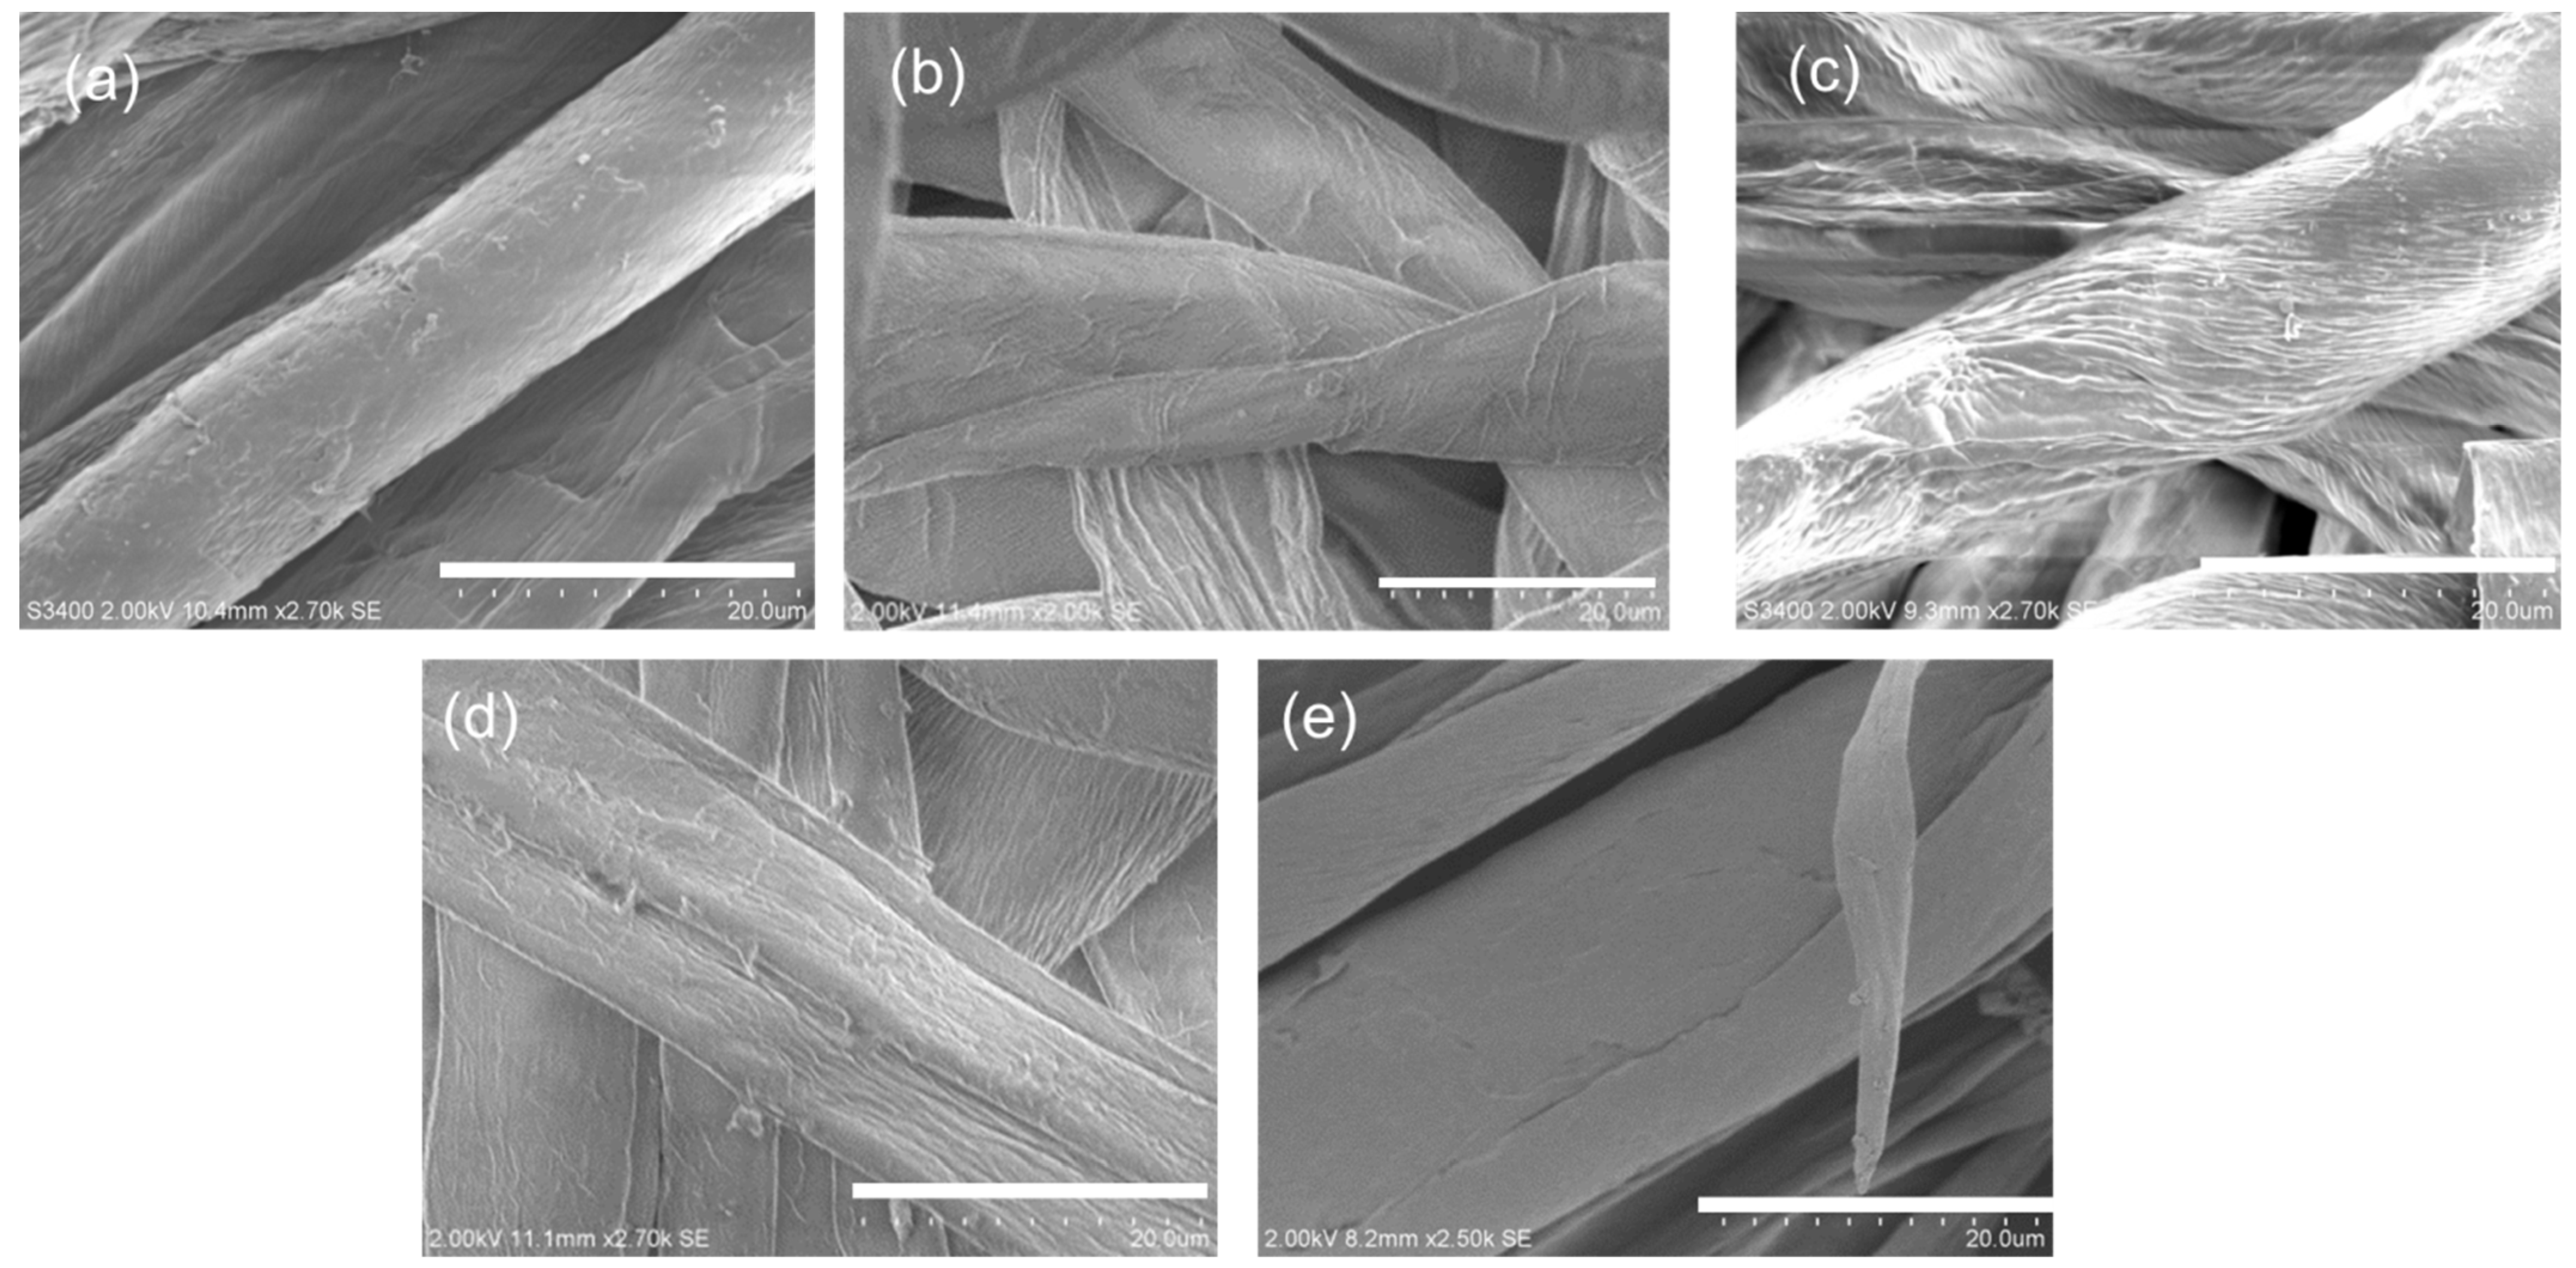
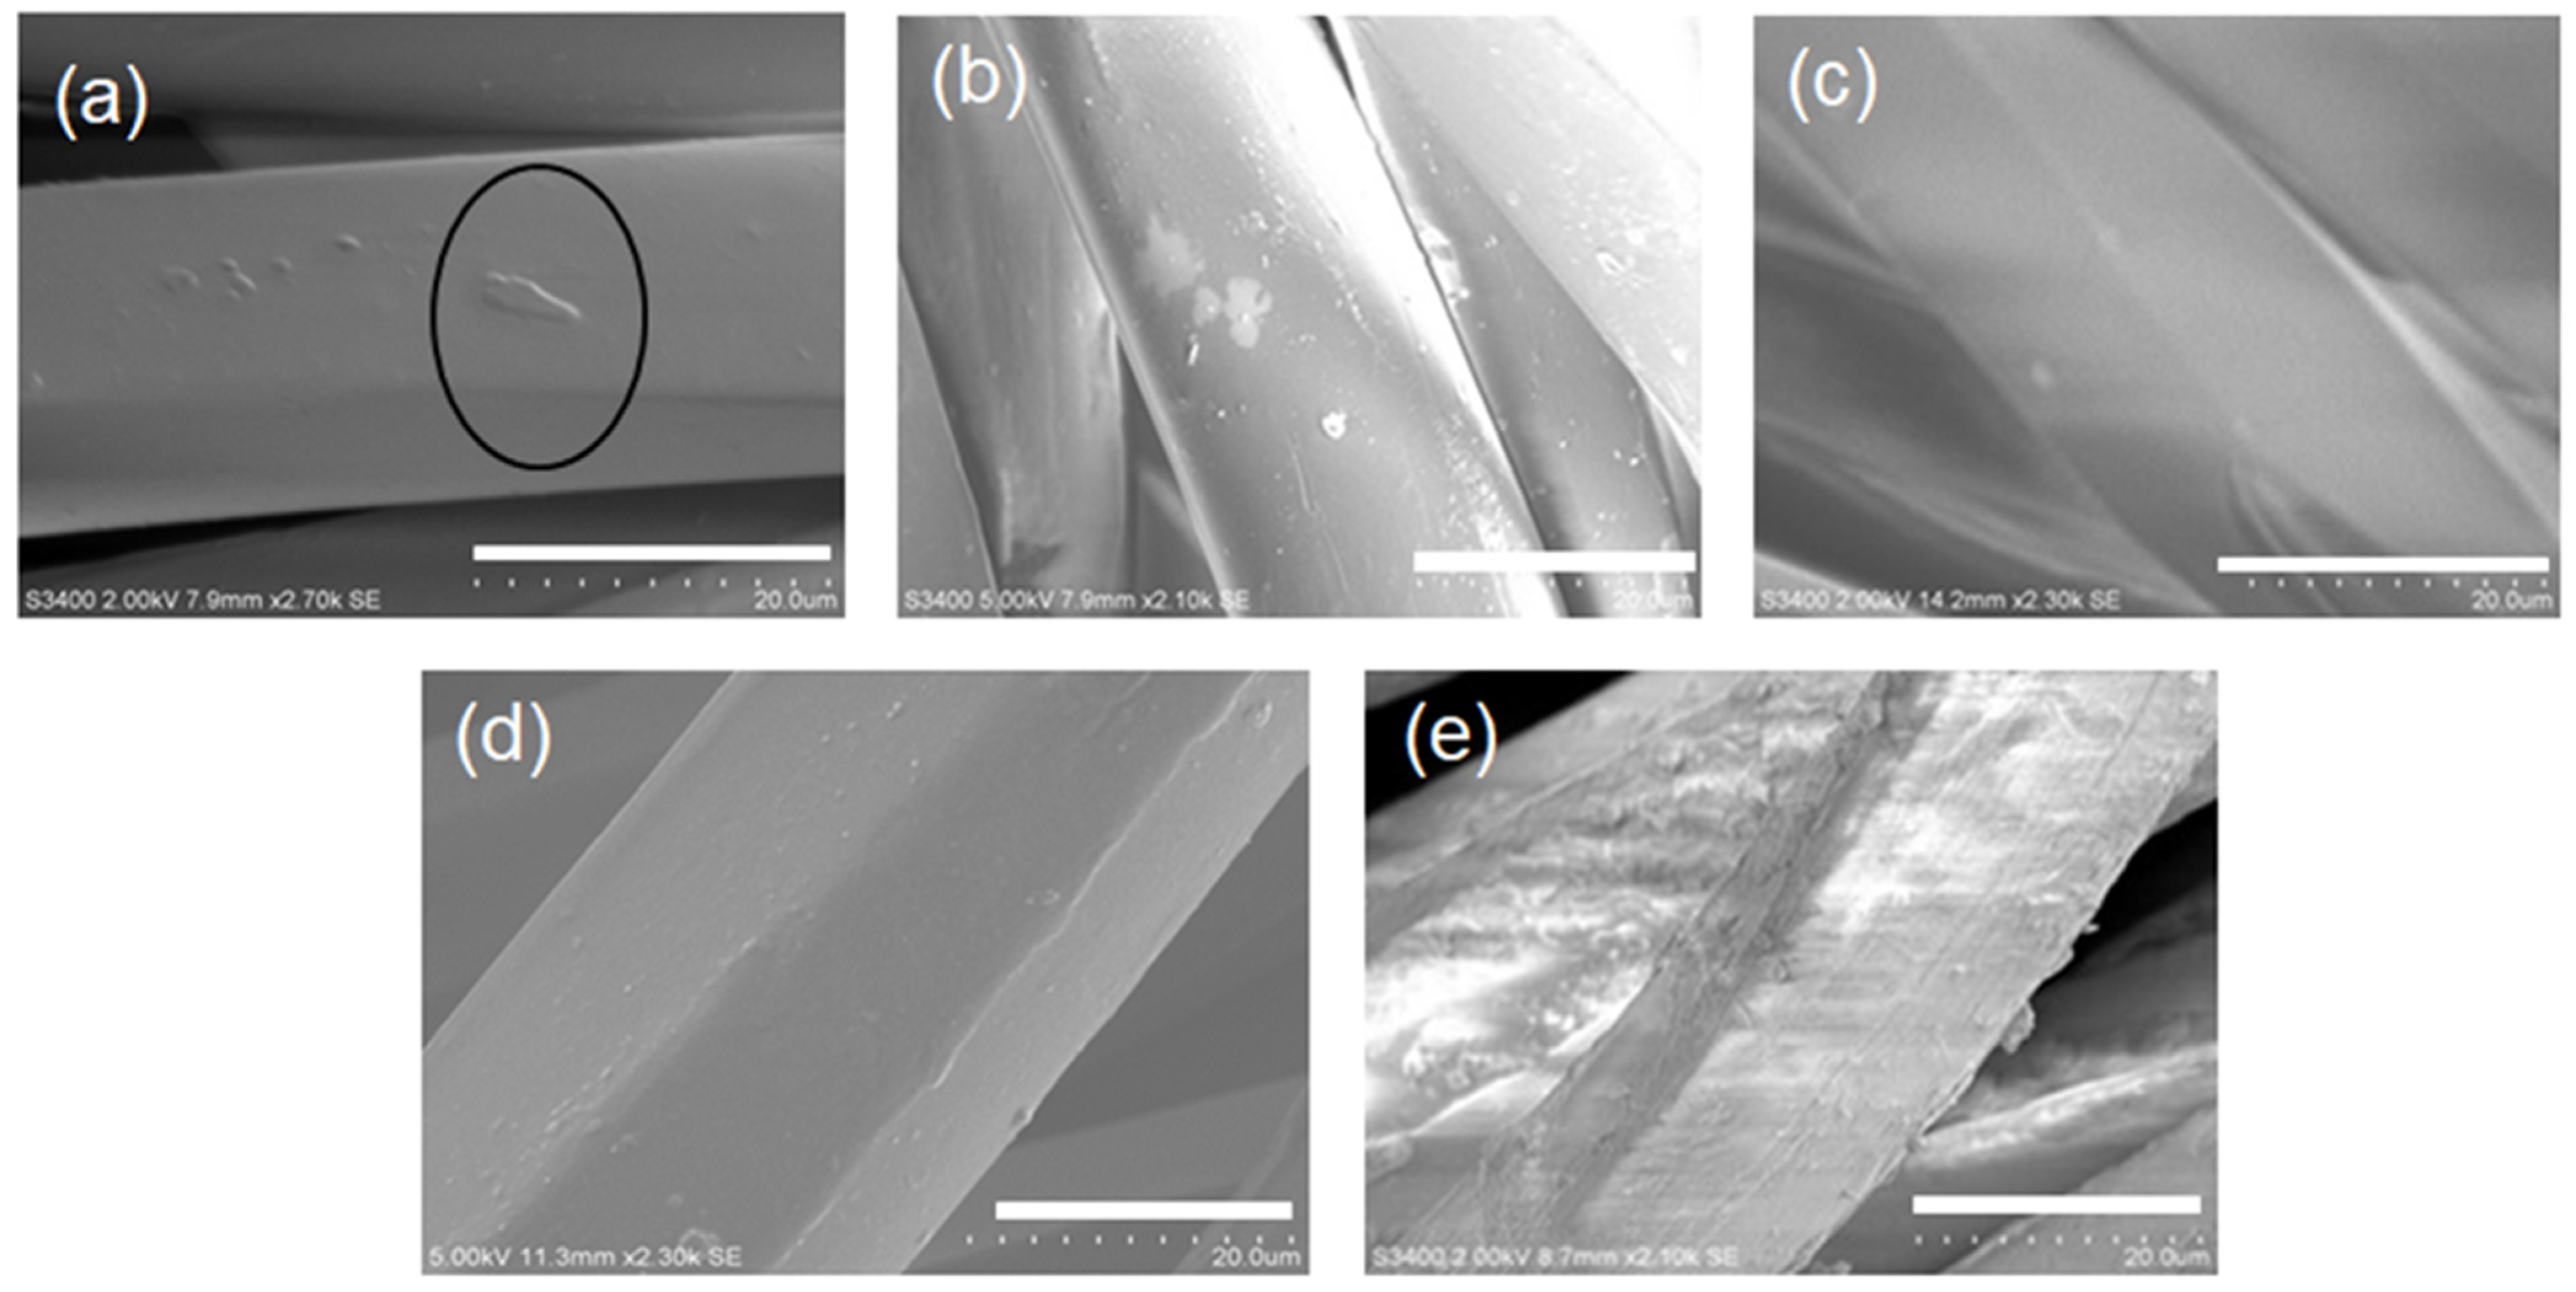
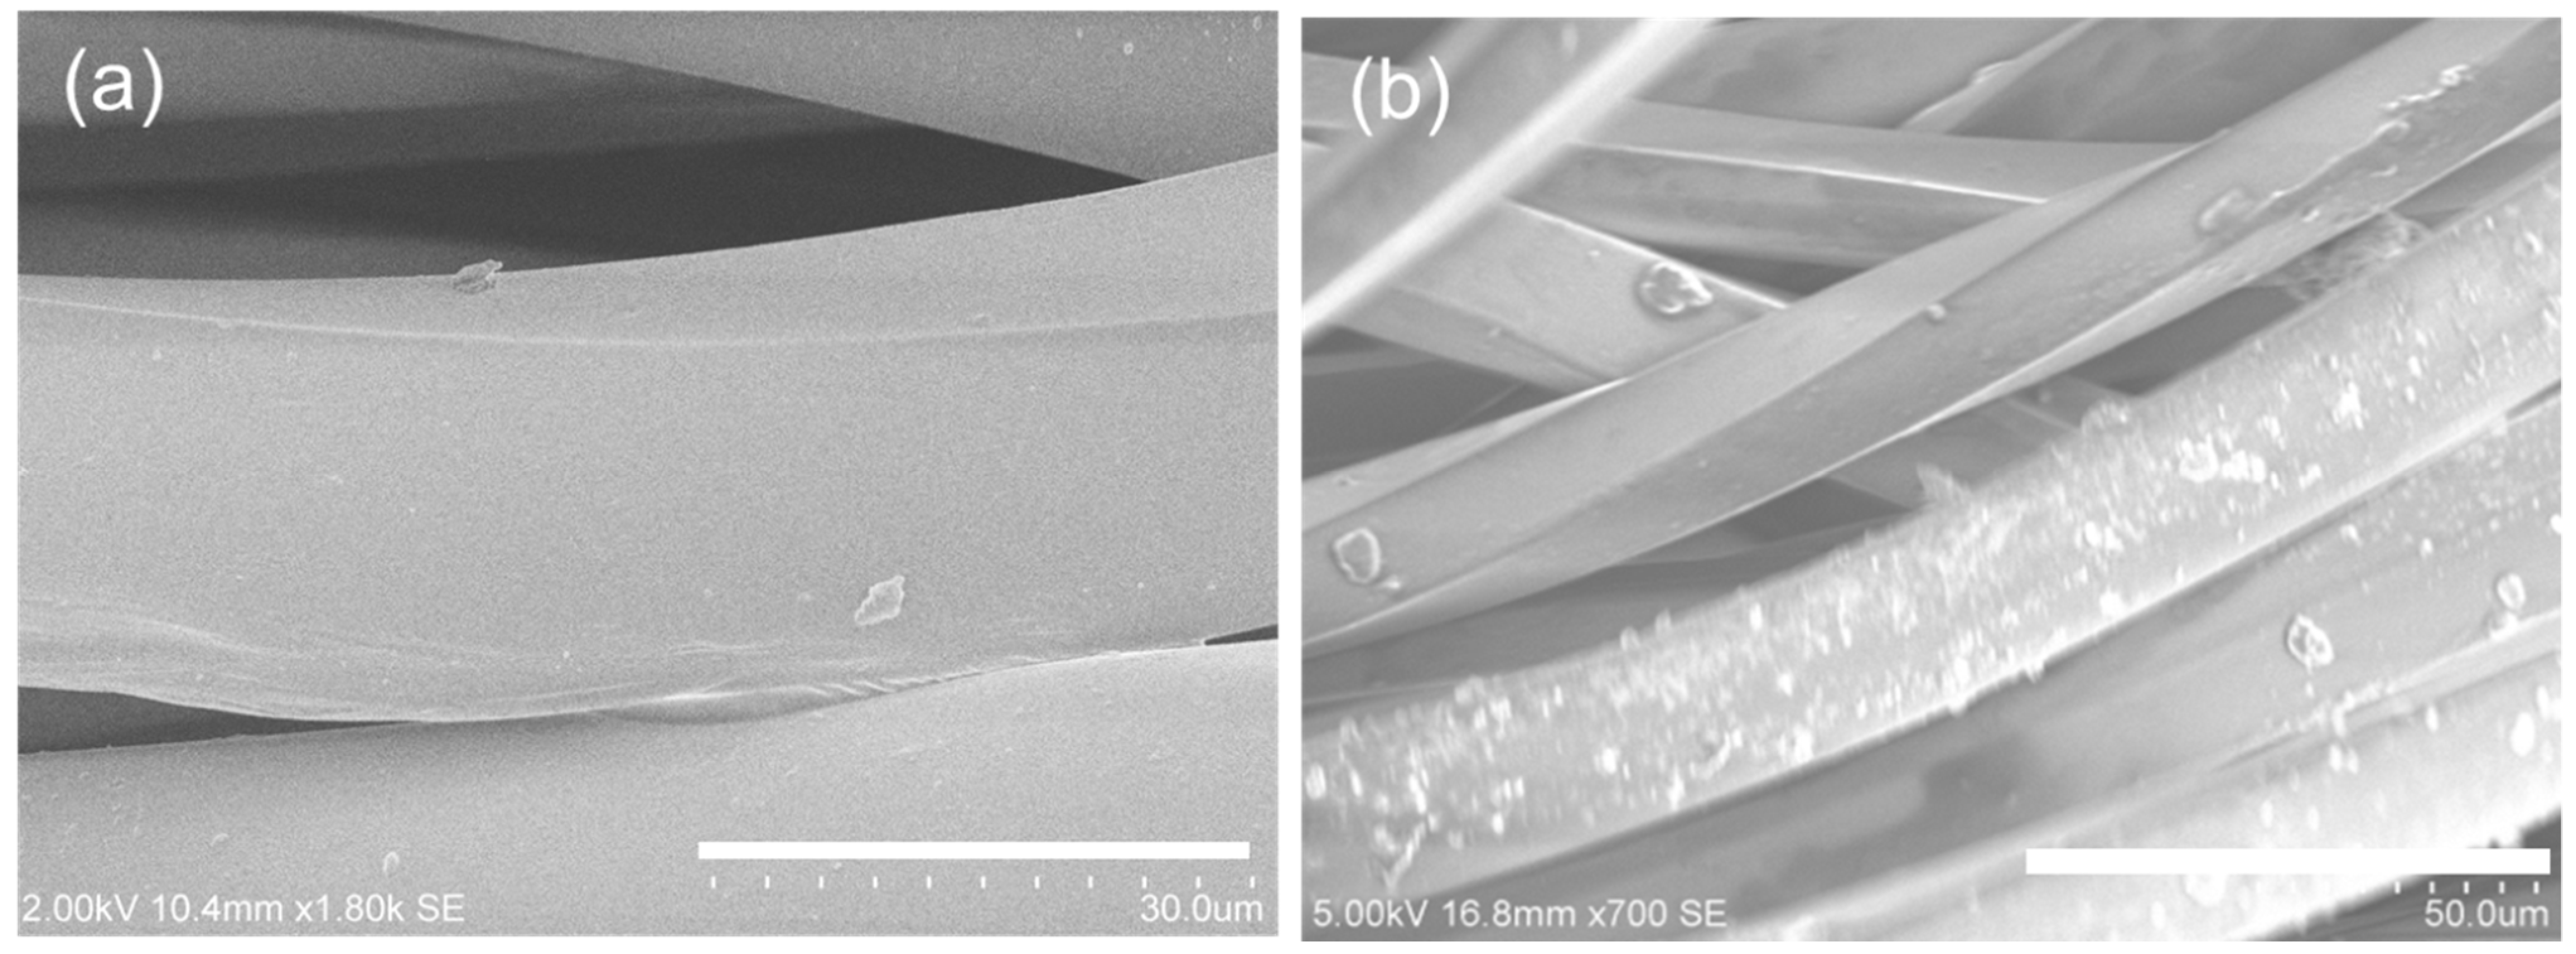
3.1. Impact of Plasma/UV Treatment on Surface Morphology

Cotton fabric: It was clearly observed from the SEM images that the pure cotton fibre surfaces exhibited a generally textured surface, with some evidence of layered morphology, as revealed in Figure 1a. Typical cotton fibres comprise an outer, thin primary wall, which covers the main cellulose-containing component, namely the secondary wall. This latter normally consists of layers of oriented microfibrillar structural units reflecting the daily growth stages of a maturing fibre [34].
SEM images of cotton fabric MLSE treated with the same plasma gas, N2100%, with different plasma power dosages of 200 and 1000 W/m2·min and in the presence of the UV laser are shown in the SEM images in Figure 1b,c, respectively. For both conditions SEM images show increased microfibrillar, surface textures due to the underlying secondary wall microfibrils being revealed as the former primary wall has been etched away. This is especially evident in the 1000 W/m2·min exposed sample in Figure 1c, whereas the sample treated with 200 W/m2·minplasma shows a less defined fibrillar texture (Figure 1b).
When treated with different plasma gases containing oxygen, the changes in fibre surface topographies for the cotton fabric exposed under N280%/O220% in Figure 1d show a similar development of secondary wall microfibrillar texture, although less defined as in Figure 1b under nitrogen. This suggests that there has been some surface erosion of the microfibrils themselves under this more oxidising environment. Similarly (see Figure 1e), the N280%/CO220%-exposed sample shows an even smoother and less fibrillar surface texture than the N2100% 200 W/m2·min image in Figure 1b, and it is evident that some damage has been caused to the primary wall or top layer of the secondary wall compared to that shown in Figure 1a.
These results are typical of those reported in the literature, although the exact details differ between plasma systems used with surface erosion generally increasing in the presence of oxidising atmospheres [9,10,35].
Polyester fabric: After MLSE exposure with laser, Figure 2a shows a typical polyester fibre surface before being subjected to MLSE plasma/UV laser treatment. The PET fibre, which appears to have a polygonal cross-section, probably reflecting the star-shaped spinneret orifice used to extrude the filaments, is generally smooth with some small surface deposits, most likely, of the trimeric oligomer, present [36].
On exposure under 100% nitrogen (N2100%), SEM images in Figure 2b–e show that increasing the treatment power from 100 to 1000 W/m2·min causes damage to the fibre surface, with surface wrinkles becoming apparent. These are possibly due to localised melting or erosion of the fibre surface during successive plasma treatments, especially evident after a 1000 W/m2·min exposure, which is the sum total of ten 1 kW power per side scans (Figure 2e). While, after 100 W/m2·min treatment, Figure 2b shows the development of some surface markings, possibly related to the presence of surface oligomer [36], increasing the plasma power as in Figure 2c,d appears to remove any such surface deposits due to surface cleaning. In addition, Figure 2d indicates that the fibre regular hexagon, cross-sectional character has become sharpened compared to fibres in Figure 2a, possibly due to the surface cleaning or polishing effect from plasma ablation effects. Closer inspection shows some evidence of localised high spots, possibly surface blisters, as also noted by Parvinzadeh et al. [16].
The oxidising atmospheric plasma treatments, compared with after nitrogen plasma treatment (Figure 2), yield SEM images shown in Figure 3 that indicate no significant differences between the PET fibres and the unexposed image in Figure 2a. However, the fibre surfaces generally appear to be smoother in Figure 3a after N280%/CO220% atmospheric plasma exposure, than in Figure 3b following N280%/O220% plasma atmosphere exposure. Furthermore, fibre surfaces appear to have some additional surface features, notably as some form of debris, most likely low-molecular-weight fragments of oxidised PET molecules.
The effects of low-pressure or vacuum plasma treatment on polyester fabric surface morphology are well reported in the literature [37,38,39]. However, with the more recent development of atmospheric plasma treatment, fewer studies have been published [16,17,18,19,20,40]. Of these, Raslan et al. [40] showed that after air atmospheric plasma treatment of polyester fabric under a low 1.3 W plasma power for 2 min, SEM images indicated that exposed polyester fibres had some cracks on the surface, while the untreated polyester fibres appeared to be smooth. For such a low power to show crack formation is surprising, although it could be that higher plasma powers used in other studies including this one is sufficient to etch away any initial surface topographical features.

3.2. Impact of Plasma/UV Treatment on Free Radical Formation

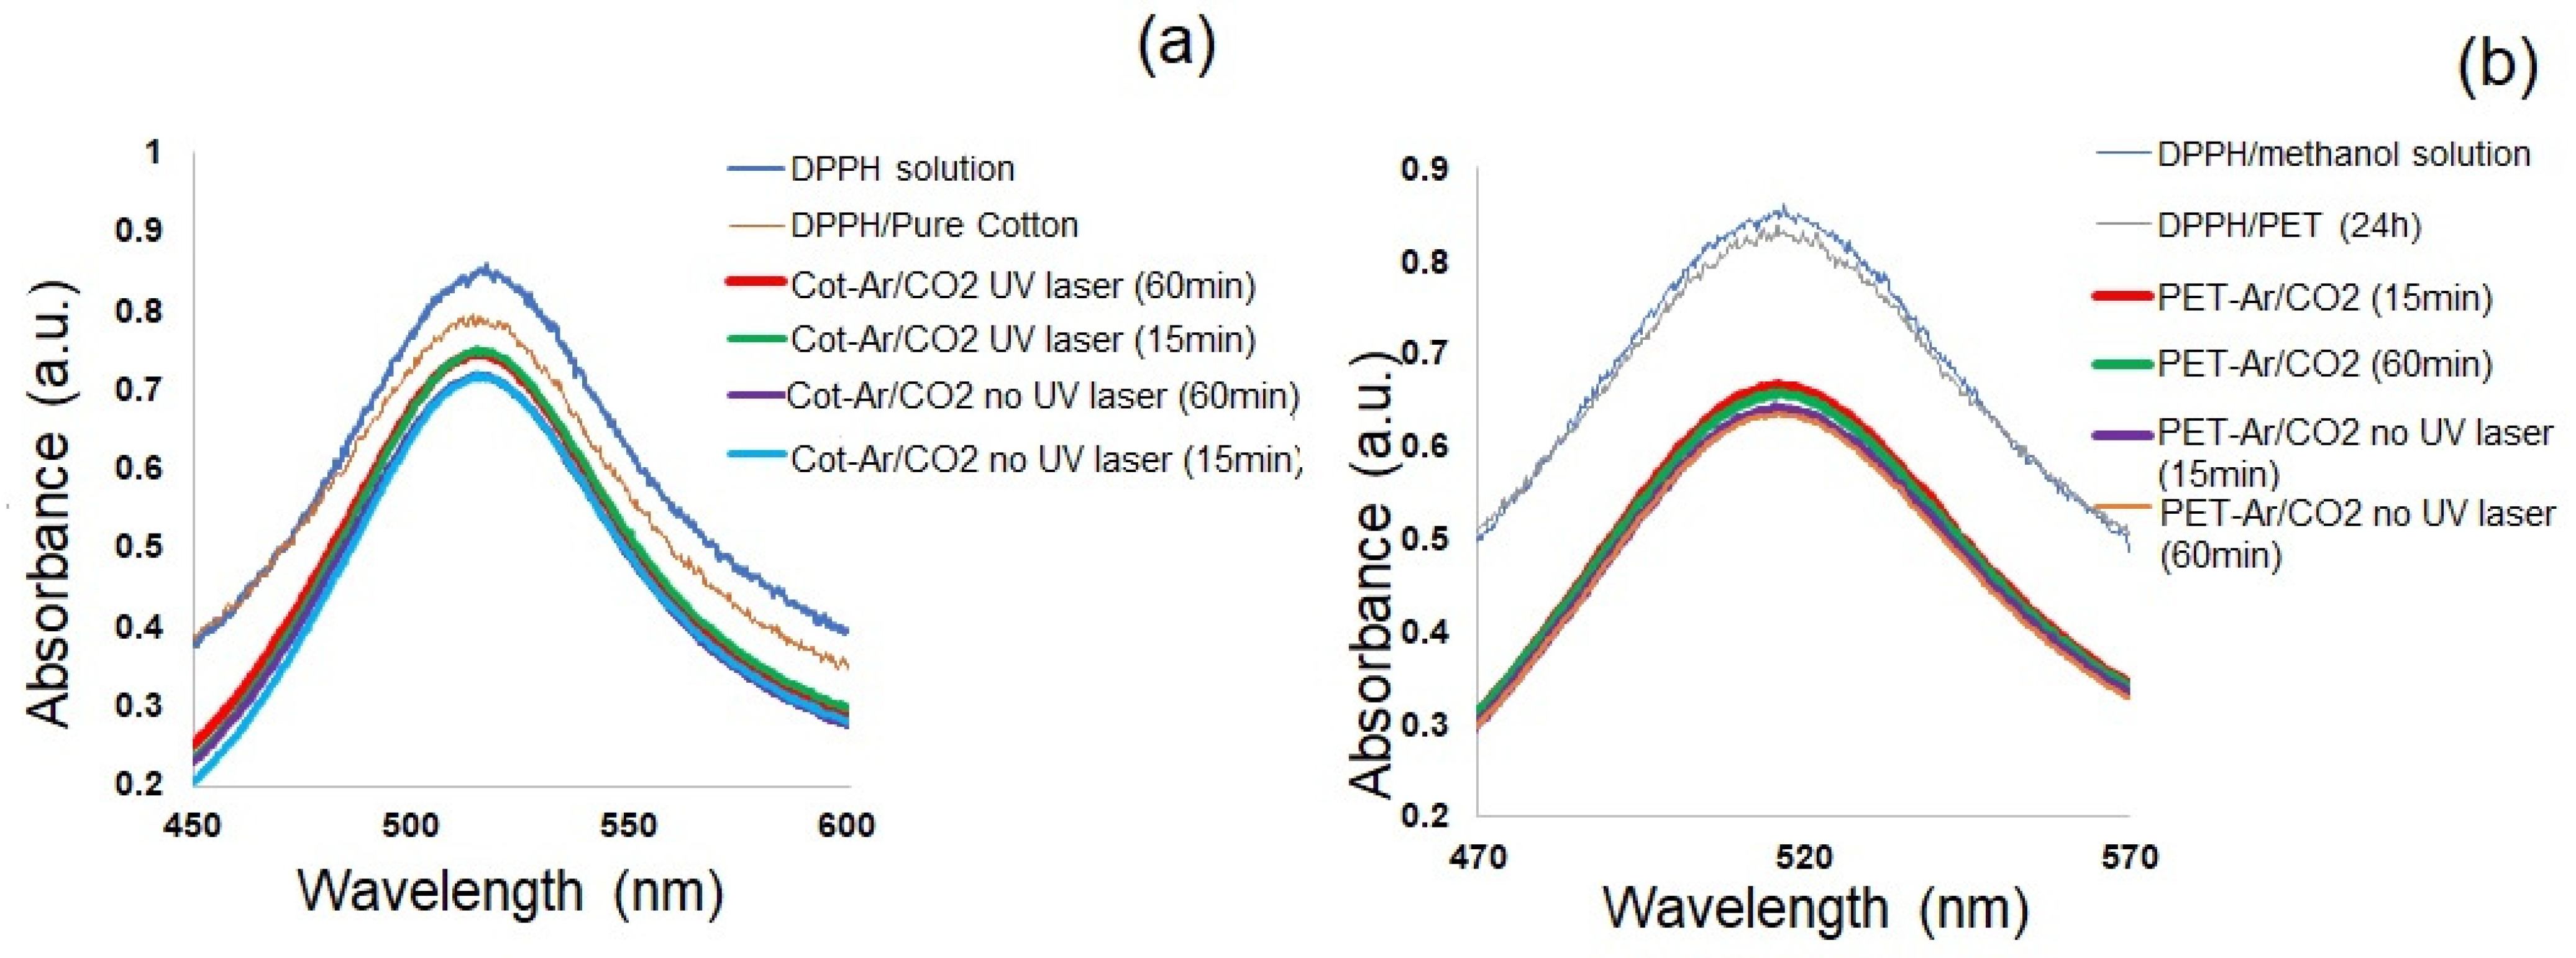
3.2.1. Use of 2,2-Diphenyl-1-Picrylhydrazyl (DPPH) As a Radical Scavenger
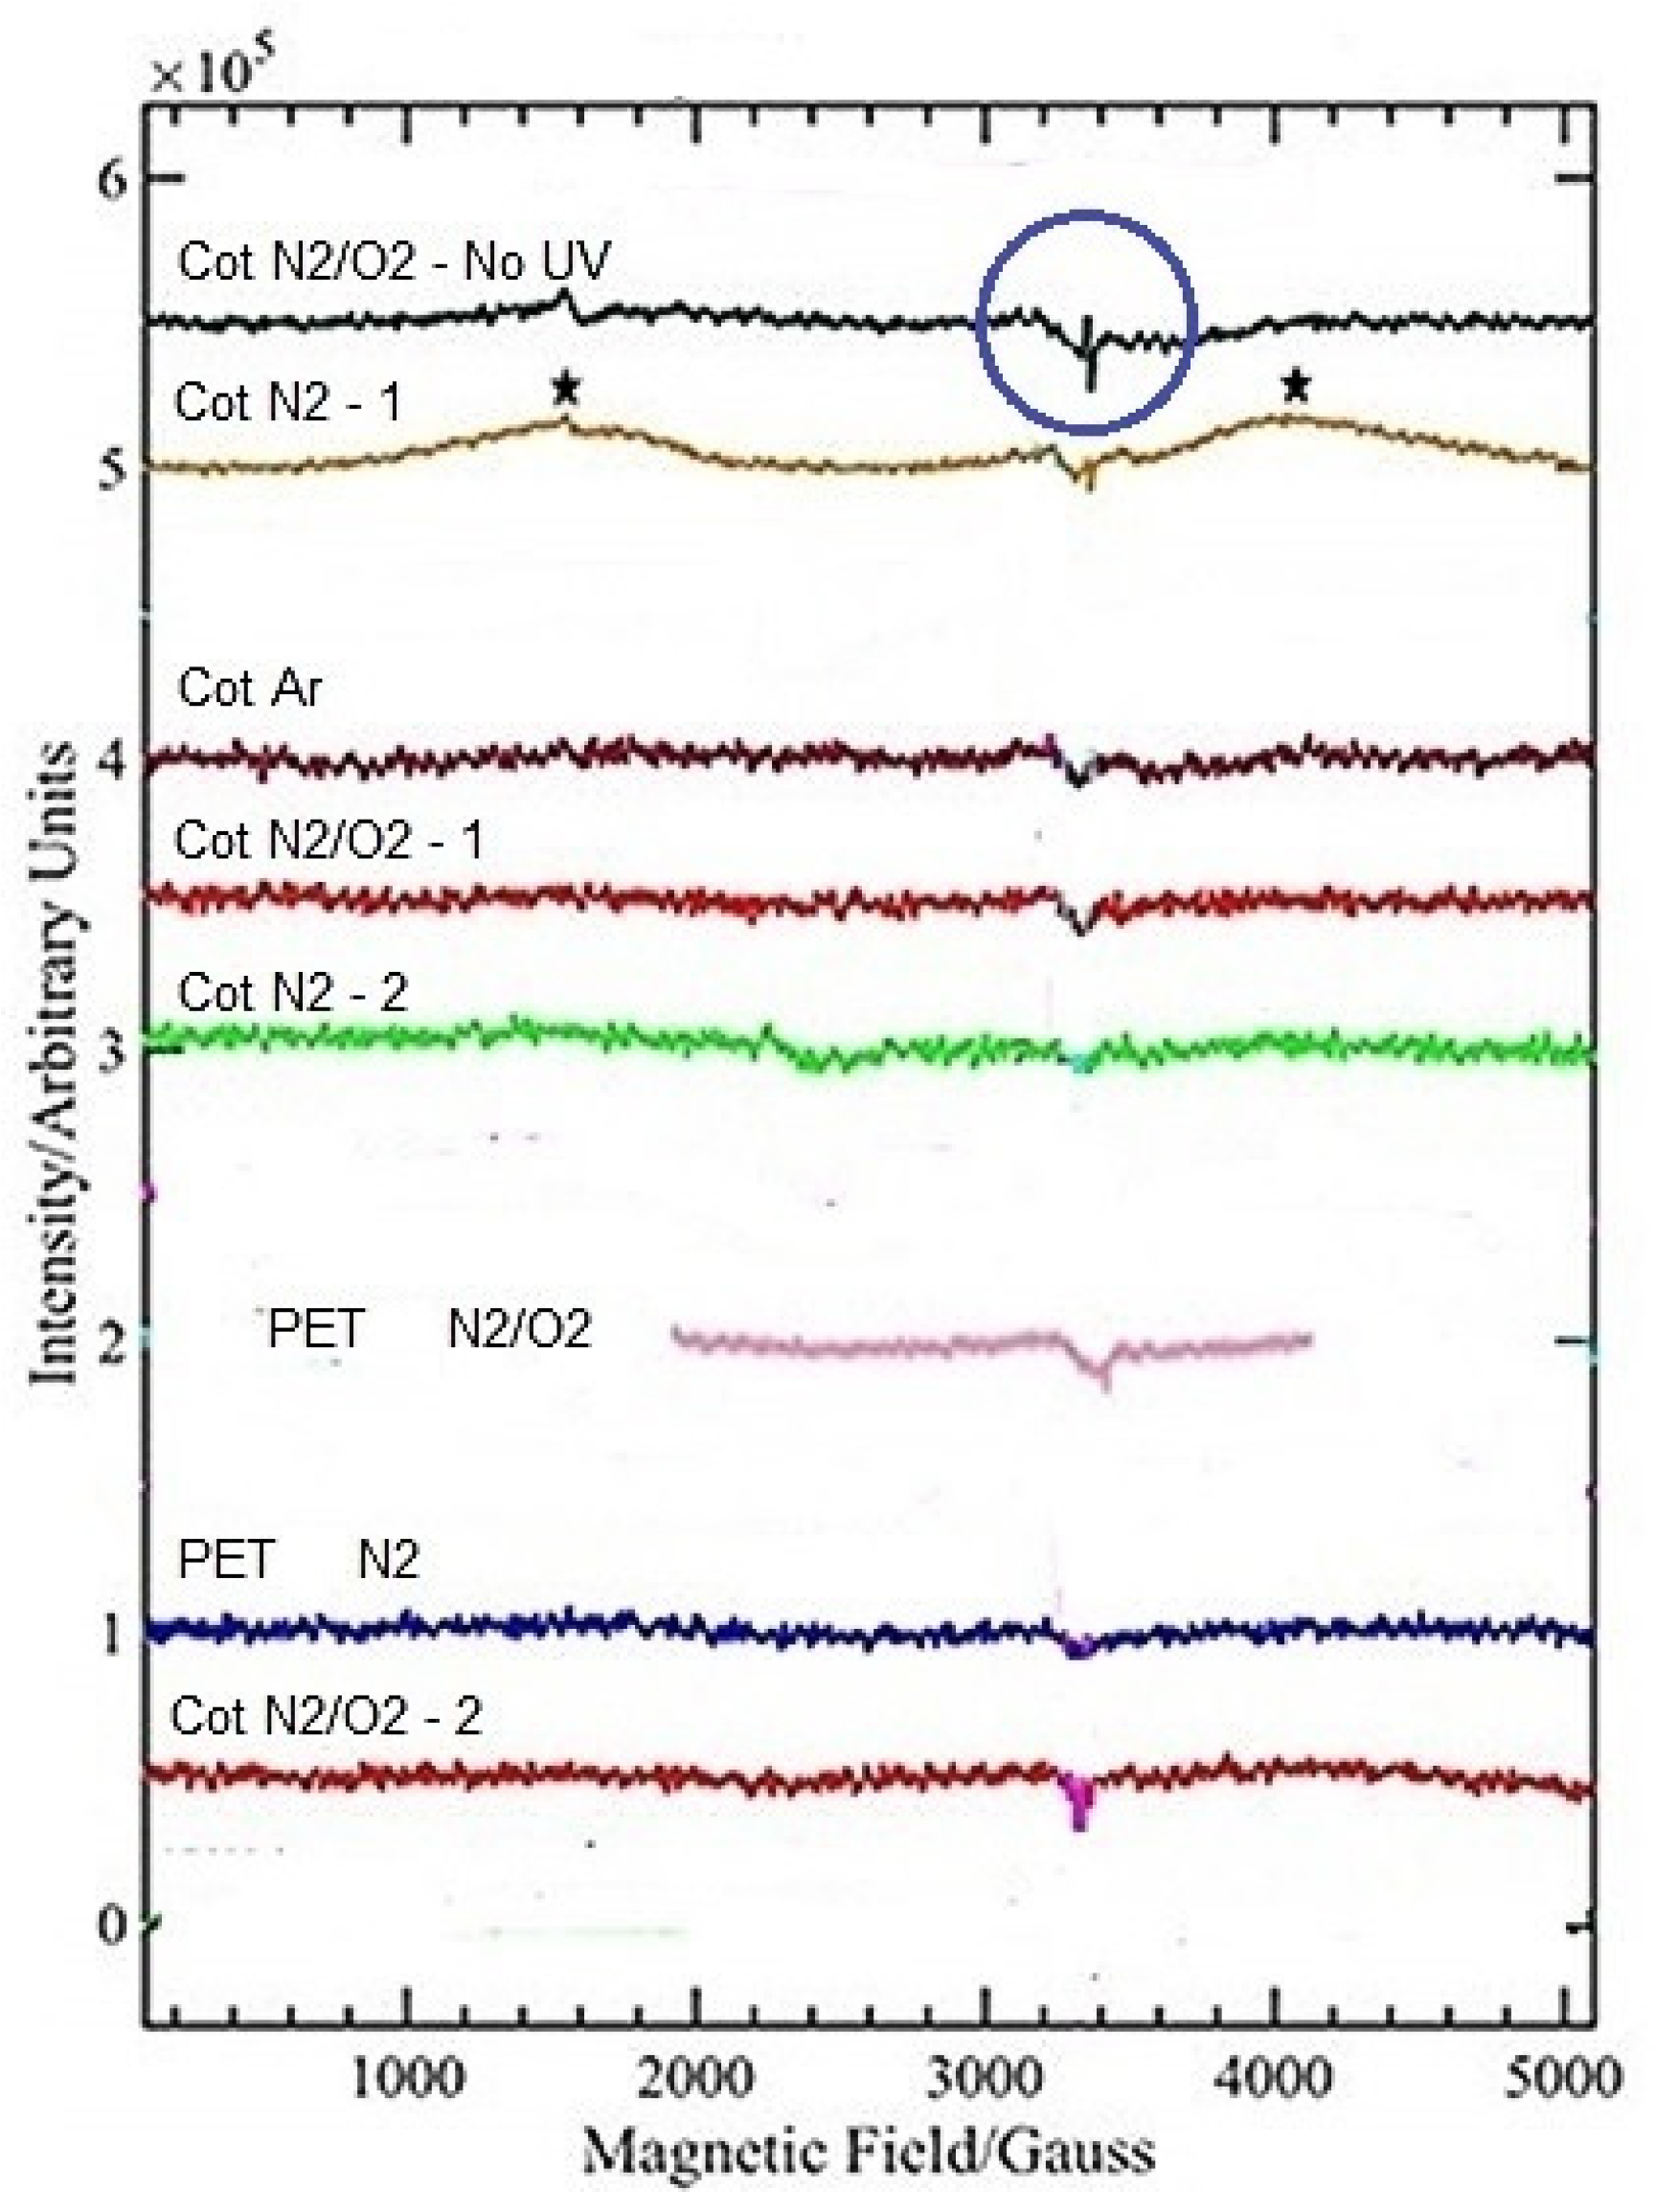
Based on the experimental exposure matrix in Table 1, selected samples of cotton and polyester (see Table 2 and Table 3) were each analysed using the DPPH method. Because the presence of N-containing species have been reported following plasma exposure of cotton under a nitrogen atmosphere [41], both cotton and polyester samples were exposed under Ar/CO2 and N2/CO2 atmospheres for comparison. Furthermore, because it was considered that polyester was more difficult to oxidise, this fabric was subjected to an additional N2/O2 condition.
Cotton fabric treated with 200 W/m2·min MLSE plasma: The effect of introducing cotton fabric samples in the DPPH/methanol solution is a 9% reduction in absorbance (see Table 2), which is constant after 60 min immersion. Cotton samples exposed to the 200 W/m2·min plasma dosage MLSE treatments under Ar/CO2 or N2/CO2 atmospheres with and without UV laser have promoted further reductions in DPPH spectral intensity (see Figure 4a and Figure S1a, respectively). This would suggest, therefore, that plasma exposure has promoted the formation of surface radicals or hydrogen ions [23,42]. Furthermore, there appears to be little difference in DPPH absorption when fabric immersion times are increased from 15 to 60 min for all samples.
The derived RSA values for these samples were calculated according to Equation (3) and are listed in Table 2 after different DPPH immersion times of 15 and 60 min. These RSA values have increased especially after plasma treatment under N2/CO2 and appear to be little affected by DPPH immersion time. However, the differences between Ar/CO2 and N2/CO2 atmospheres are probably within error negligible, although the Cot-Ar/CO2 with laser-exposed sample has shown the smallest increase in RSA, which might suggest that the argon present has promoted fewer active species than when nitrogen only is present. The independence of immersion time indicates that the fibre surfaces only contain the principal generated active species and that any sub-surface species will have diffused to the surface rapidly with time. Another possibility is that the concentration of hydrogen ions (which also can also react with DPPH [42]) on the surface has increased slightly compared to pure cotton with the effect of immersion time being negligible up to 60 min. These hydrogen ions would arise from the gradual formation of –COOH groups. The role of the 308 nm laser is less clear in that its absence has increased the RSA values for the Ar/CO2 atmosphere but decreased values for the N2/CO2 atmosphere exposures.
PET fabric treated with 200 W/m2·min MLSE plasma: Figure 4b and Figure S1b show the results for all Ar/CO2 and N2/CO2 MLSE-exposed samples, respectively. These suggest that the DPPH/methanol absorption curve has only marginally reduced in intensity following the introduction of unexposed PET fabric even after 24 h immersion and that there is a general significant decrease for the exposed samples (see also Table 3). Within error, while all these latter curves might be considered to be identical, there is a suggestion that increasing the immersion times from 15 to 60 min promotes a slight further decrease in DPPH absorption as does the exposure in absence of the laser. This latter effect of absence of laser was noted for the exposed cotton sample results shown in Figure 4a.
The derived RSA data listed in Table 3 show that values have increased after plasma exposure with respect to the control. From Table 3 and as noted for the Ar/CO2 data in Figure 4b, it can be seen that the RSA (i.e., reductions in DPPH concentration) percentages are not significantly different over the specified immersion time interval, except for the DPPH/PET-Ar80%/O220% sample, which has a significantly reduced RSA value. Furthermore, the value has doubled between 15 and 60 min. This suggests that its presence has significantly decreased radical formation with respect to the other gases and that the formed radicals react more slowly with the DPPH.
The effect of presence or absence of laser for the above samples, however, again gave apparently confusing results. However, when compared with the cotton data in Table 2 was consistency in that for both cotton and polyester Ar/CO2 conditions the presence of laser reduced RSA and the N2/CO2 atmosphere increased RSA values relative to the respective absence of laser values. The differences were greater for the polyester samples.

3.2.2. EPR Analysis

Figure 5 shows the EPR signals for both fabrics in replicate exposed to 3500 W/m2·min (as a single 3.5 kW scan) MLSE plasma under N2 and N2/O2 conditions and Figure S2 shows the related DPPH results. Because EPR analysis was undertaken elsewhere, only selected exposed samples could be undertaken. Since it was assumed at the time that an increased plasma power would increase any radical concentrations formed and hence any associated EPR response, the increased plasma power of 3.5 kW or 3500 W/m2·min dosage was selected.
Cotton fabrics exposed under 3.5 kW plasma power showed a weak to strong paramagnetic “radical-like” signal at 3500 G (as indicated by the blue circle) with no detectable hyperfine structure due to the surrounding, magnetically active nuclei. However, its intensity varies greatly, depending on the plasma exposure conditions. The cotton fabric exposed to MLSE N280%/O220% (no UV laser) treatment has the strongest radical signal compared to other exposed samples, which have weaker signals. In addition, the broad peak at 4500 G (represented by the black stars on the orange spectra) for the Cot/N2 plasma-exposed sample is probably due to the presence of paramagnetic O2. In conclusion, therefore, it would appear that radical production in cotton during 3.5 kW power MLSE exposure is not very great either in the presence or absence of UV laser. These conclusions are supported by the DPPH analytical results in Figure S2a, which shows negligible effects of exposing under nitrogen, argon or N280%/O220% atmospheres. It should be noted that all exposed samples in fact show higher DPPH absorptions than the controls, an effect which is not easily explained. This could be a consequence of experimental error, which would require repeat experiments to be undertaken to verify. Notwithstanding this comment, because the DPPH concentrations have not decreased following MLSE exposures does suggest an absence of new radical formation. Since the DPPH results in Table 2 for cotton exposed to the 2 × 1 kW plasma power condition indicated radical formation, it is proposed, therefore, that increasing the plasma power to 3.5 kW has an unexpected negative effect in this respect. It is possible that under high plasma powers, radical species are volatised and so absent from the fabric surface when examined.
The EPR spectra shown in Figure 5 for polyester fabrics exposed to 3.5 kW power plasma (see Section 2.4.2) indicates that almost no EPR signal was observed for the fabric exposed under 100% nitrogen, although a slight increase in intensity under N280%/O220% experimental conditions occurred. These results are supported by the DPPH results shown in Figure S2b that took place on the same day and which indicated little or no development of radical activity. In conclusion, therefore, it would appear that radical production in polyester during MLSE exposure at 3.5 kW plasma power, is not very great or even negligible under the selected plasma gas conditions, which does not agree with the DPPH results at 2 × 1 kW power in Table 3. While it is possible that some of the fast decaying radicals might have reacted during their storage in liquid nitrogen prior to their subsequent EPR analysis, the higher plasma power (3.5 kW) may have caused volatilisation of the generated radicals as suggested also as an explanation for the similar results for cotton. Clearly, these results for both exposed cotton and polyester should be treated cautiously and so be considered only qualitatively as opposed to the more quantitative analyses with DPPH above.

3.3. Impact of Plasma/UV Treatment on Functional Groups Formation on the Surface

3.3.1. X-ray Photoelectron Spectroscopy (XPS) Analysis

Cotton fabric: Table 4 lists the carbon(1s), oxygen(1s) and nitrogen(1s) percentage contents derived from each XPS spectrum of the unexposed and exposed samples. Figure S3a shows the full XPS spectra for pure cotton, which consists mainly of two peaks relating C1s and O1s orbital electrons. In addition, the less intense N1s signal may be due to surface contamination during XPS analysis or to impurities. Theoretically, 100% pure cellulose should exhibit two peaks in the full XPS spectra relating to carbon and oxygen, with an approximate O/C ratio of 0.54. However, the value of O/C molar ratio for pure cellulose in this case is lower than that assumed from the theoretical formula and is approximately 0.45 (see Table 4). Furthermore, the percentage level of carbon in the control fabric of 68% is significantly greater than the theoretical value of approximately 47% and actual experimentally determined value of 44.4% [43]. However, the high value lies within range 37–71% cited by other authors for bleached cotton [11,44,45], which depends on fabric structure and the nature of the fibre surfaces. Lower values for oxygen are also recorded for percentage oxygen values in this and the above-cited previous literature compared to a theoretical level of approximately 49%. These variations explain also why our O/C ratio differs from the theoretical value. These variations can be considered to arise from non-oxidised alkane-type carbon atoms present on the surface and most likely originates from residual wax impurities in the cuticle layer [46]. The presence of any residual hemicelluloses still in the bleached cotton control should not affect the O/C ratio, whereas trace pectins could have a marginal effect on values in Table 4 [47].
Figure S3b shows the C1s region for pure cotton, which is divided into three components. The main two components with binding energies of approximately 286 and 288 eV represent alcohol (C-OH) and ether group (C-O-C) (within the anhydroglucopyranose monomeric unit) and O-C-O (glycosidic bond), respectively [48,49]. In addition, there is a third component, which is related to C-C or C-H bonds with a binding energy of approximately 284 eV. The latter peak corresponds to non-oxidised aliphatic carbon atoms originating from possible impurities, as discussed before.
200 W/m2·min plasma-exposed samples selected for XPS analysis were limited to the Ar/CO2 and N2/CO2 gas conditions to enable direct comparison with the DPPH radical analyses. In Table 4, the results of CasaXPS software analysis show that after MLSE plasma treatment any slight increases or decreases in the relative carbon and oxygen atomic concentrations are minimal and probably within experimental error. Nevertheless, after N2/CO2 MLSE plasma treatment, the XPS data show a noticeable decrease in the carbon atomic concentration from 68.0% (pure Cot) to 65.0%, although the percentage oxygen remains largely unchanged. However, the absence of UV laser irradiation during the treatment appears to have increased the oxygen concentration from 31.0 to 33.0%, suggesting an increased oxidative effect under these conditions. The O/C ratio appears to be independent of the conditions except for a marginal increase following N2/CO2 plasma (no UV laser) treatment. No changes were detected in the nitrogen percentage concentrations and because the N1s peak intensities are low and influenced by the background “noise” (see Figure S3), accurate values were difficult to calculate. The presence of protein residues in cotton introduced during the growth cycle of the fibre [47] would explain the presence of nitrogen (typically ~0.2%), although such residues are present in reduced amounts after bleaching. A level of approximately 1% might suggest that the commercially bleached fabric had been contaminated with additional nitrogen-containing species such as crease-resisting resins.
Based on the literature, atmospheric plasma treatment may introduce nitrogen species to the cotton fabric. Nitrogen species have been detected by FTIR-ATR analysis in the literature [16,50,51] or by EDX studies of plasma-exposed fibres. For example, Ibrahim et al. recorded that atmospheric plasma treatment introduced nitrogen species in low concentration (~0.4%) on the cotton fabric detected by EDX studies [41]. However, the results were not compared with a control cotton sample. Unfortunately, no XPS studies were undertaken.
Polyester fabric: Figure S4a shows the full XPS spectra for the PET control, which consists mainly of two main peaks relating to C1s and O1s orbital electrons, yielding an O/C molar ratio of approximately 0.24 (see Table 5). Figure S4b shows the C1s region for PET resolved into three components. The main component with a binding energy of approximately 285.0 eV represent the -C=C- bonds in the terephthalate ring. In addition, two other components with binding energies of approximately 286 and 288 eV represent C-O-C or C=O in the ester groups, respectively.
The control O/C value is less than the theoretical value recorded in the literature and expected from the repeat unit empirical formula –O.CH2CH2.O.CO.C6H4.CO-, which has O/C = 0.40. The percentage levels of carbon and oxygen again differ from the theoretical values of 63% and 33%, respectively, but compare well values derived for control PET fabrics in other studies [52,53]. The derived atomic percentages in Table 5 show that silicon (Si2p) is present, which if concentrated on the fibre surface, possibility arising from the presence of a contaminating fibre finish, could contribute to the low O/C ratio. A similar observation was recorded in the literature; however, after non-thermal plasma treatment the silicon intensity decreased [52], as would be expected if located primarily on fibre surfaces.
Generally, after 200 W/m2·min plasma exposure under both atmospheres of N2/CO2 and Ar/CO2, results in Table 5 show that there was a significant increase in the oxygen concentration due to surface oxidation and hence a decrease in the surface carbon atom concentration. Furthermore, the O/C ratio has increased under all conditions. A greater increase has occurred after plasma treatments without UV laser and particularly under an Ar/CO2 atmosphere. Similar results were reported after argon/air plasma treatment of polyester fabric under atmospheric pressure, with the increase in the oxygen species being explained as due to the lower break down potential for argon [53].
Table 6 shows the software-calculated components of the resolved C1s spectra for unexposed and plasma-exposed samples. The relative concentrations of C-C or C-H bonds appear to have decreased. On the other hand, ester C-O and carboxylic C=O percentages have increased significantly after plasma treatment. These results are evidence of surface modification in that some C-C and C-H groups have been oxidised to form C-O- and O-C=O-containing groups, as reported in the literature [52,53,54] as well as evidence of surface contamination removal.

3.3.2. Determination of Carboxyl Groups by Methylene Blue Dye Uptake

Cotton: Again, selected samples were chosen to represent the potentially least (pure N2) and most (N2/O2) oxidative conditions under a 200 W/m2·min plasma dosage. Colour brightness values as a function of dyeing time are plotted in Figure 6a for the pure cotton control, and samples MLSE exposed with UV laser to 100% N2, N280%/O220% and N280%/CO220% plasma gases.
These results show that a significant decrease in colour brightness (i.e., increase in colour depth) occurred after immersing the control cotton for only 15 min followed by a much lower decrease over the total 60 min immersion time. Generally, for the selected MLSE plasma/UV laser-treated samples compared to pure cotton, much lower fabric brightness and hence increased depth of shade was observed after 15 min immersion. These results suggest that plasma treatment had removed the top layers from fibres, which often retains wax residues, and had caused some primary wall damage as noted in the SEM images in Figure 1b. After longer immersion times, only further slight brightness decreases were observed for 100% N2 and N280%/O220% samples while values fluctuated for the N280%/CO220% sample, most likely reflecting experimental error. Introducing oxygen to the nitrogen plasma gas gave the best results in terms of increasing dyeing properties as a consequence of the generation of COOH groups on the cotton fibre surfaces.
Nourbakhsh et al. [55] studied the carboxyl group contents on cotton fabric after air corona treatment by methylene blue dye uptake and observed a similar brightness decrease after the plasma treatment, thus indicating an increase carboxyl group content on the fabric. In addition, increasing the plasma power from 500 W to 1000 W or increasing the number of plasma scans showed a further slight decrease in the brightness, although COOH groups were not detectable by FTIR-ATR.
Polyester: The calculated colour brightness values of dyed fabric samples are plotted as a function of dyeing time in Figure 6b for the PET control and samples exposed to the similarly oxidising atmospheres N280%/CO220% and Ar80%/CO220% at 200 W/m2·min plasma dosage. Again, dyed fabric brightness, although fluctuating with dyeing time, generally has decreased significantly after MLSE treatment as methylene blue uptake has increased, due to surface activation and carboxyl group generation.
There is no clear effect of removing the UV laser, although the experimental error associated with the MLSE technique, as evidenced also by the fluctuating trends, may have obscured any effect.

3.3.3. Wettability

The high hydrophilic character of cotton ensured that the water drop spread immediately for all samples including the control as Table 7 demonstrates. No major changes in the water drop diameter were observed after 2 min apart from the N2/CO2 (no UV laser) sample condition, where the water drop has spread to a greater degree taking the apparent experimental error into account. The XPS results also did not show any significant differences between all samples and so this latter result suggests that experimental error may in fact be the cause.
With regard to the normally hydrophobic polyester shown by the minimal drop diameter for the control in Table 7, the application of plasma/UV in an argon atmosphere has promoted a slight increase in drop diameter and hence hydrophilicity. However, the inclusion of 20% CO2, either with 80% nitrogen or argon has significantly increased surface wettability and the absence of UV laser has promoted further increases drop diameters, especially the N2/CO2 condition. Subjective assessment of drop contact angles showed that while that of the control was greater than 90°, reflecting its hydrophobicity, angles were less than 90° after exposure. These results reflect the increases in methylene blue absorption as a consequence of –COOH group formation, although greatest dye uptake was greater for the Ar/CO2 than for the N2/CO2 condition. This is the converse of the respective results in Table 7 and there was no clear effect of the with or without laser during plasma exposure condition. These results compare well with the XPS data, which showed that plasma exposure reduced the surface hydrocarbon content at the expense of increased oxygen-containing species and for which the absence of UV laser appeared to increase the C=O content by approximately 10% for each gas mixture.

3.4. Impact of Plasma/UV Treatment on the Thermal Behaviour of Component Fibres

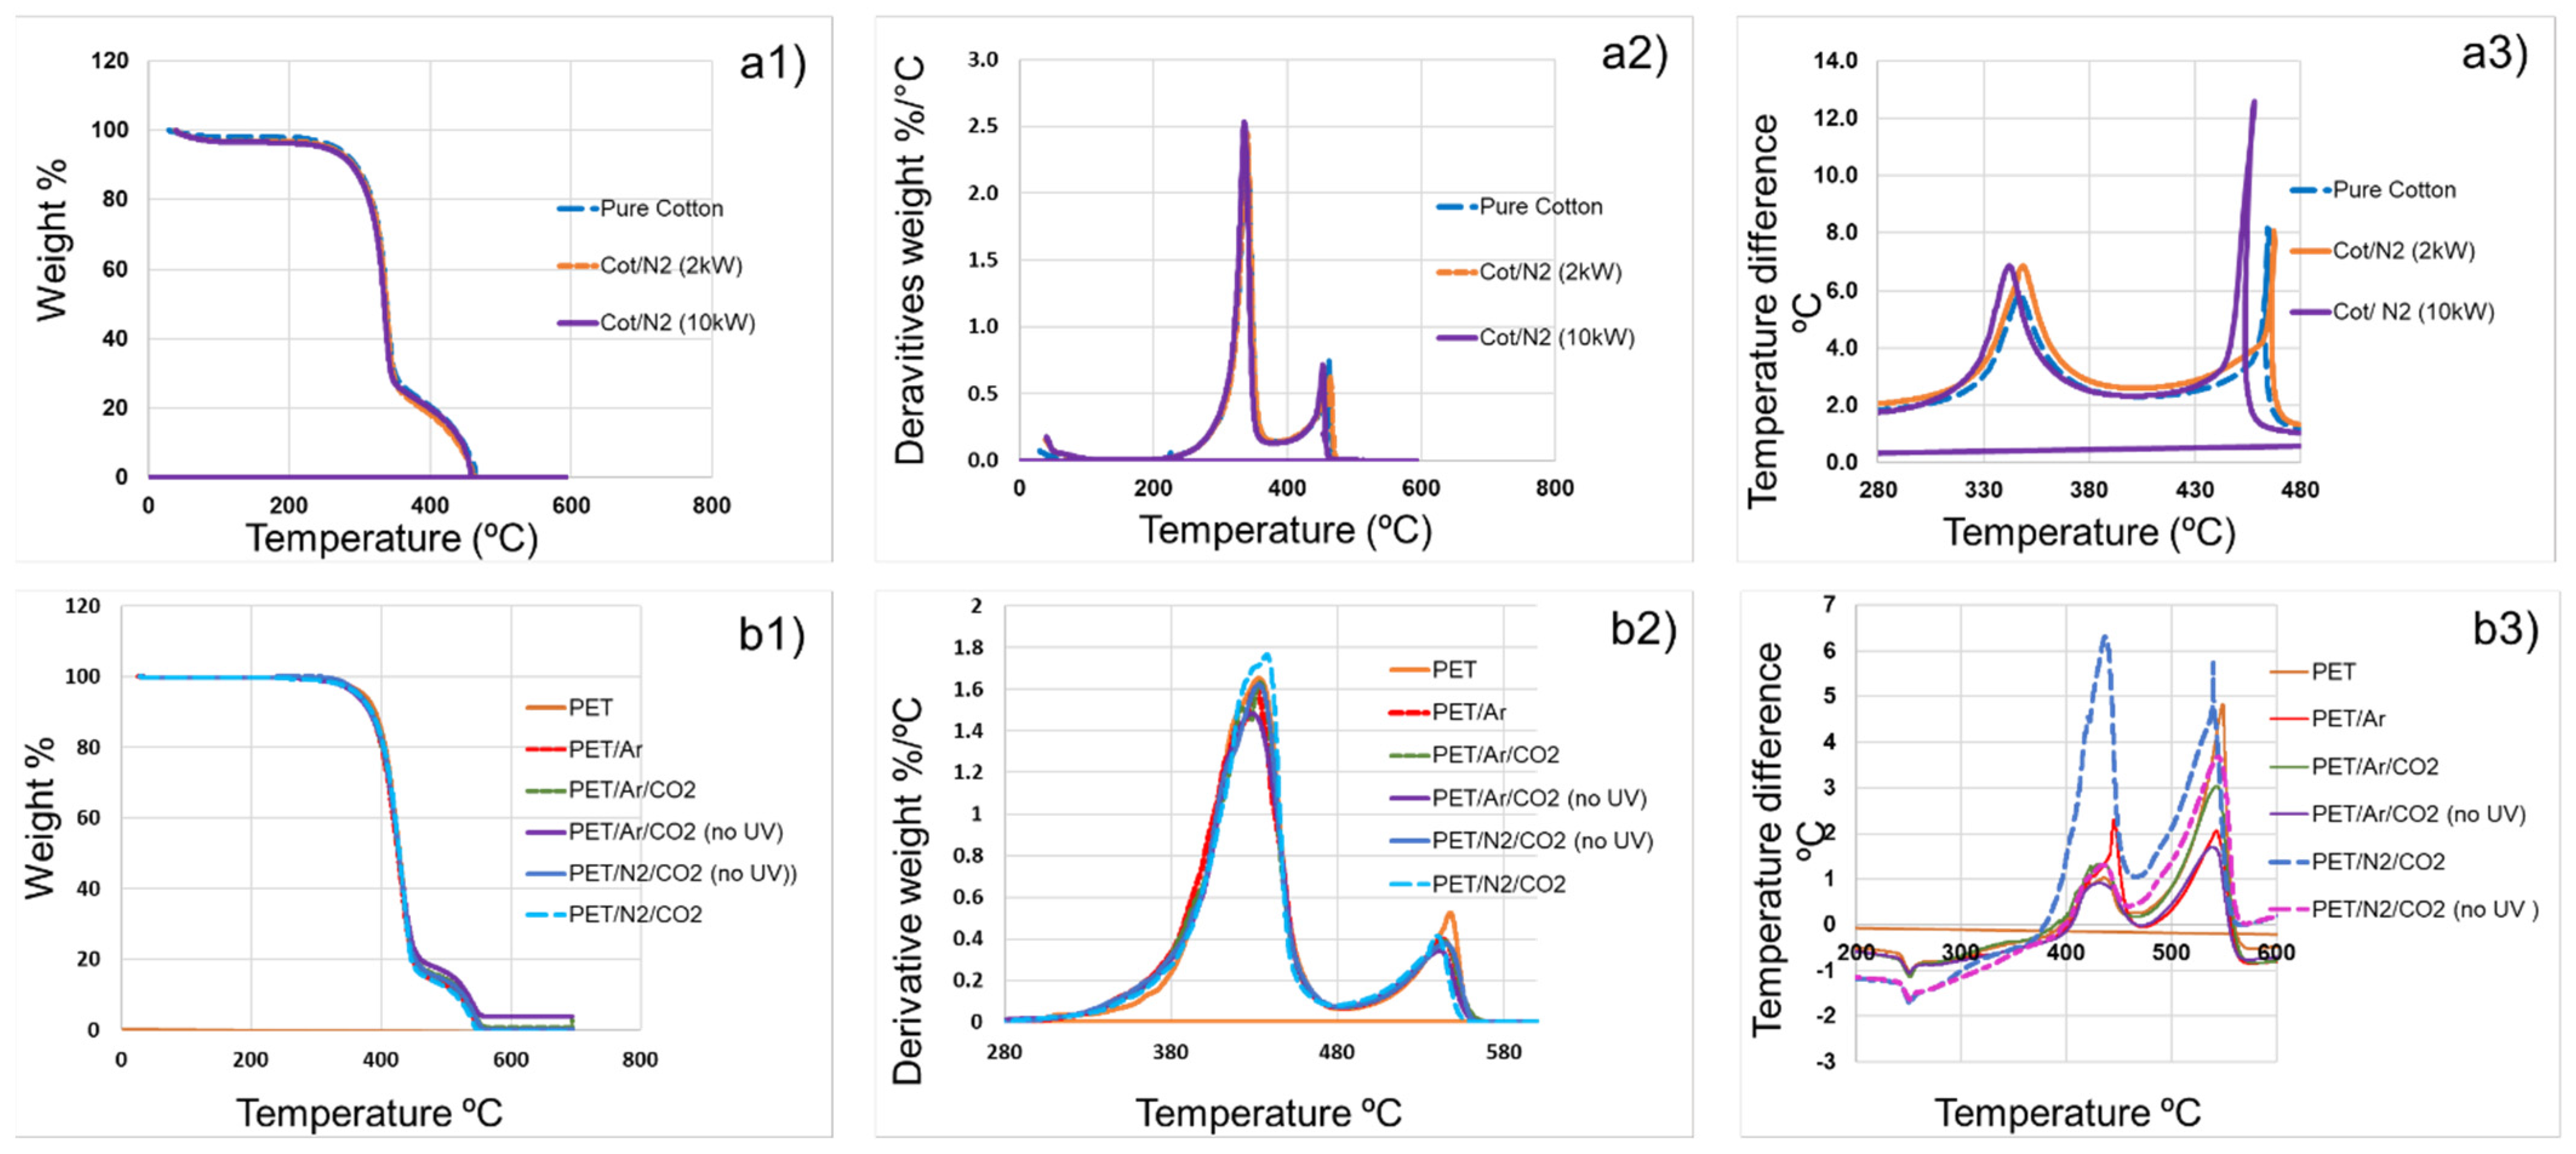
3.4.1. Thermal Analysis (TGA/DTG)

Exemplar TGA, DTG and DTA curves for cotton samples after either 200 (2 × 1 kW) or 1000 W/m2·min (10 × 1 kW) dosage MLSE exposure with UV laser under nitrogen, N2/CO2 and N2/O2 gas atmospheres are shown in Figure 7(a1–a3), respectively. Derived data for all 2 kW-exposed samples are listed in Supplementary Table S1, in which, because of the moisture regain of cotton, the temperatures for 10% mass loss, T10%, are included. Cursory examination of the respective exposed sample data suggests that little changes in TGA behaviour are evident apart from a small shift to lower temperature in the char oxidative DTA peaks shown in Figure 7(a3) for the N2/CO2 condition at the higher 1000 W/m2·min power dosage and in the related DTG peak for the Ar/CO2 atmosphere in the presence and absence of UV at 200 W/m2·min (Table S1). It is likely that either the higher dosage or presence of CO2 has sensitised the oxidation of chars formed within the 300–350 °C pyrolysis region at higher temperatures. Why the N2/CO2 condition has not produced a similar reduction in the second DTG peak temperature is not known but as Table S1 shows, the N2/O2 atmosphere has also promoted a reduction of approximately 5 °C of this same transition.
For polyester samples the respective TGA, DTG and DTA responses show little difference after 200 W/m2·min plasma (with or without UV) exposure under the various gases apart from reductions in T5% values with respect to the control. It would seem that plasma exposures have generally sensitised the initial stages of thermal degradation in the 354–369 °C region with the largest effects observed for gas mixtures containing CO2 and without laser presence (see Table S2).
This apparent lack of significant effects on TGA and DTA responses for both fibres is perhaps not surprising since these techniques are assessing bulk property behaviours, which may be diluted by the presence of very small surface chemical changes.

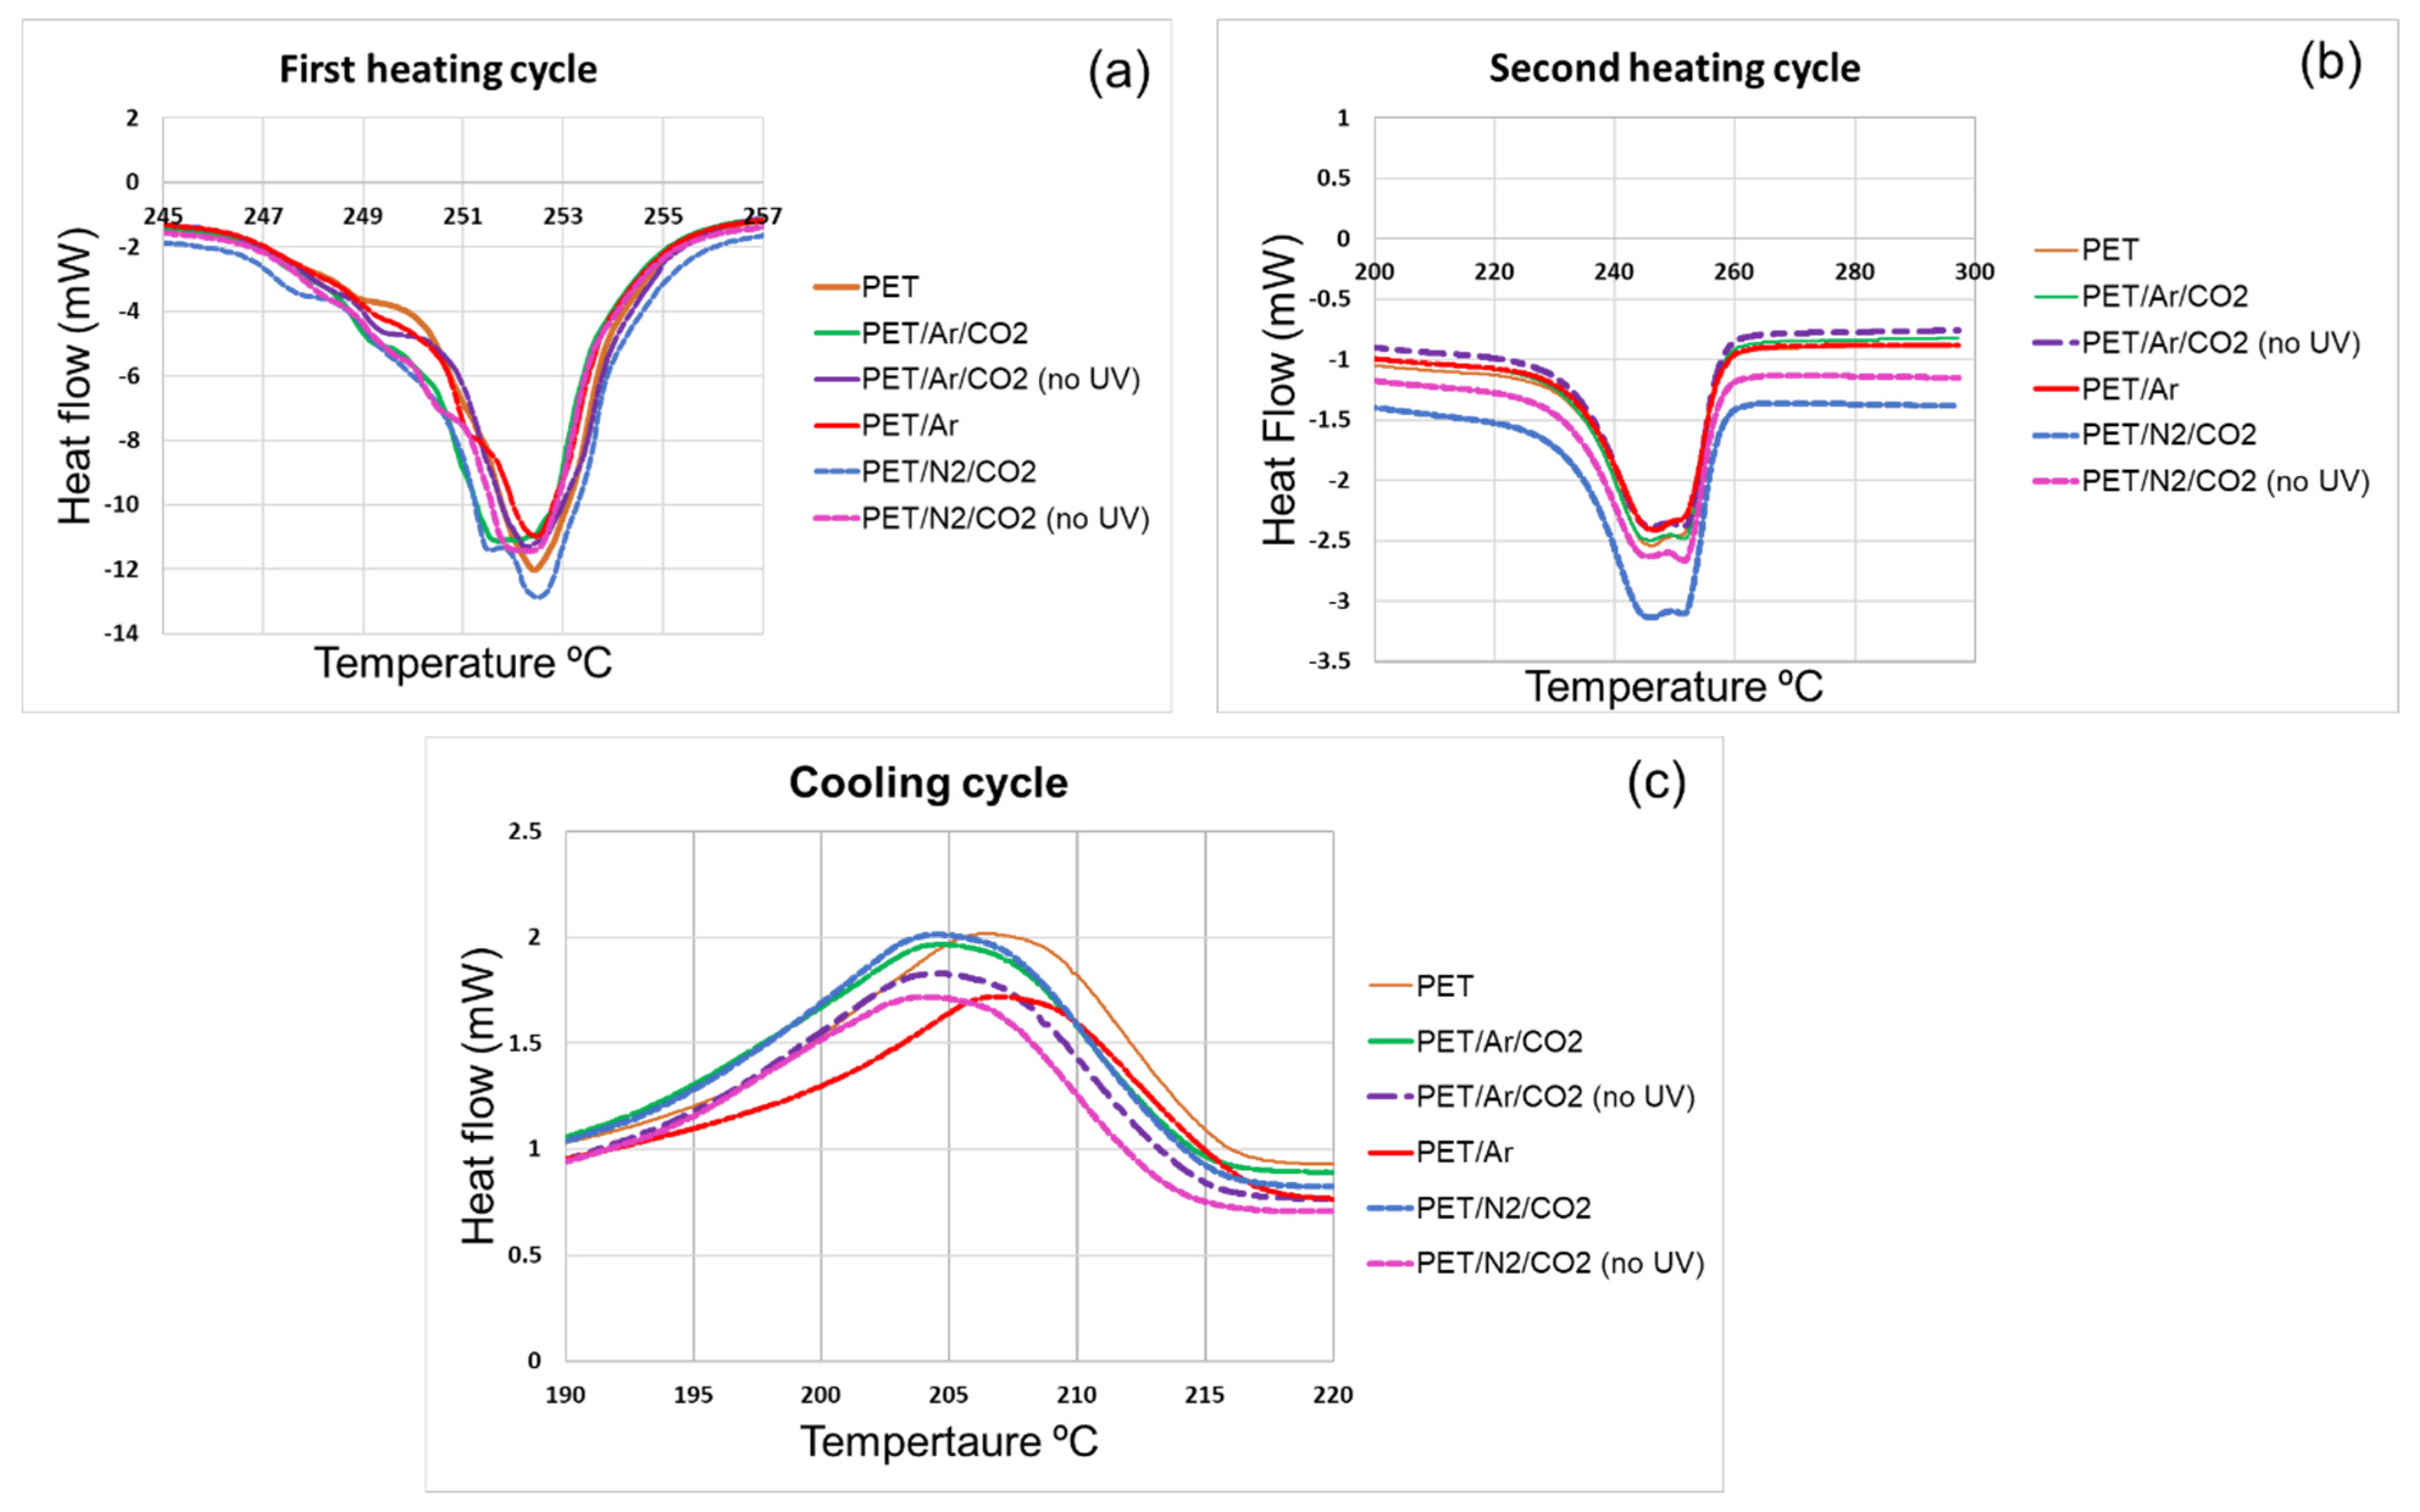
3.4.2. Thermophysical and Mechanical Studies (DSC and DMA Analysis) of Polyester Samples

Melting and cooling behaviour: The DSC traces before and after various 200 W/m2·min exposure conditions are shown in Figure 8 and derived data are listed in Table 8. Figure 8a generally shows a single main endotherm with the presence of a lower-temperature shoulder at approximately 252 °C for all samples. For the control PET, this shoulder is only just evident but it increases in intensity following all plasma exposure conditions. Slight broadening of the first melting peak Tm1 is observed after Ar/CO2, N2/CO2 and N2/CO2 (no UV) treatments compared to the control and other plasma-treated PET samples. Moreover, after N2/CO2 plasma treatment there is an increase in the heat of fusion, ΔHf, to 62.0 J/g and a further increase without UV laser irradiation to 67.0 J/g (Table 8). These changes suggest that while the effects of the different exposure conditions have marginal effects on the TGA, DTG and DTA responses noted earlier, some degree of polyester chain scission has occurred which has enabled some reordering of chains to take place. These were sufficient to modify the polycrystalline distribution during melting (hence the shoulder appearances) and, especially after the N2/CO2 plasma treatment, an overall increase in degree of crystallinity to occur from 40% for the control to 44 (with UV) and 48% (without UV). Similar changes have been noted by other workers for plasma exposure under nitrogen [56].
In addition, and especially after N2/CO2 MLSE plasma treatment in the absence of UV laser, application of Equation (5) indicates that significant polymer chain cross-linking most likely has occurred [32,33] and derived values are presented in Table 8.
With regard to the cooling cycle DSC responses after the first melting, Figure 8c and Table 8 show that while Tc values of plasma-exposed samples showed a slight general decrease compared with the control PET value of 207 °C. The accompanying latent heat, ΔHc values have also increased after the various plasma treatments, apart from the PET-Ar sample for which the converse is observed. However, within error, it is most likely that negligible change has in fact occurred.
During the second heating cycle (see Figure 8b), the melting peaks which suggest the presence of a doublet structure, have generally lower melting point temperatures, Tm2, and heats of fusion, ΔHf, the latter only having significantly increased for the N2/CO2 condition, especially without UV laser.
DSC- and DMA-derived second-order behaviour: Both sets of derived Tg data from the second heating cycle are listed in Table 8 with respective DSC and DMA responses shown in Supplementary Figures S5 and S6. While accepting that DMA is the more sensitive technique for Tg analysis, since it can measure glass transitions of thin layers, which are difficult to be detected by DSC [57], derived values can be affected by the heating and cooling rate; in addition, loading frequencies which can affect the results by 20 °C or more [58,59].
It is apparent from Table 8 that although a suggestion of an increasing Tg trend is evident after plasma exposure under CO2 -containing atmospheres, no significant differences were observed among the different samples. Of these, the PET-N2/CO2 (no UV) sample showed the slightly highest value at 82 °C. However, from DMA analysis as shown in Supplementary Figure S6 as Tan delta and storage modulus vs. temperature, show maxima or Tg values which have shifted from 125 °C for PET to 130–133 °C for 200 W/m2·min plasma-treated samples. In addition, Figure S6 shows a significant increase in the storage modulus for MLSE plasma-treated samples compared to pure polyester, reflecting the proposed increase in cross-linking.
These observed slight increases are corroborated by the similar increases in crystallinity following chain scissions, mainly at PET fibre surfaces, which have been recorded in the literature [53,57]. If, as suggested above, certain plasma treatment conditions also give rise to significant cross-linking (e.g., especially N2/CO2 atmospheres in the presence and absence of UV, see Table 8), then the small increases in Tg (DSC and DMA) will also be positively influenced by this phenomenon.
The positive effect of the absence of UV laser in terms of increasing both Tg and percentage crystallinities for the PET-N2/CO2 (no UV) condition reflects the higher incident of DPPH reactive species and lower RSA value noted in Table 3 and Supplementary Figure S1.

4. Discussion and Conclusions

Generally, with MLSE atmospheric plasma treatment, physical and chemical changes have occurred on the fibre surfaces. Levels of surface erosion or damage for both cotton and polyester observed by SEM increased either with multiple 1 kW plasma scans (=100 W/m2·min dosage/scan) under nitrogen or at a constant 200 W/m2·min plasma dosage with 20% additions of oxygen or carbon dioxide. Radical generation observed by DPPH analysis also increased under the latter condition. However, results suggest that use of simultaneous UV laser irradiation during the plasma treatment, destroys or causes volatilisation of some plasma-generated species, hence giving rise to fewer radicals formed on the fibre surfaces. Furthermore, in both cotton and polyester, while low plasma dosage (200 W/m2·min) favoured formation of free radicals, increasing the plasma power to 3.5 kW had a negative effect indicating in terms of volatilisation of the generated radicals.
For cotton fabric in the presence of a low (20%) concentration of carbon dioxide, XPS analysis detected the appearance of negligible changes in oxygen-containing species, although O/C ratios increased slightly especially under the N2-CO2 (no UV Laser) condition (Table 4). This same sample showed the greatest wettability (Table 7). Methylene blue dye sorption increased following MLSE exposures, especially when the plasma gas was N280%/O220%, although only with UV laser samples were analysed. These results together suggest that the formation of carboxylic acid groups is the reason. Given that the without laser condition under a N2/CO2 atmosphere produces the highest O/C ratio and lowest RSA value (Table 2), a conclusion may be drawn that the laser presence is not essential to optimise –COOH formation during cotton exposure.
For polyester, it is important to remark that the MLSE UV laser atmospheric plasma treatment has increased the hydrophilicity and methylene blue dye uptake of polyester fabric under all plasma conditions. Measurements of O/C ratios and RSA values, showed that treatment with both N2/CO2 and Ar/CO2 plasma without UV irradiation gave the significant with the latter generating the greater. Changes in these parameters were also reflected in increases in Tg and percentage crystallinity values. In addition, the DSC data provide some evidence of polyester chain cross-linking versus oxidation based on the type of the plasma gas, nitrogen or argon, respectively, in the presence of CO2, especially in the absence of UV irradiation Table 8). Therefore, as with the observations for cotton above, the role of the presence of the UV laser with respect to its potential in increasing fibre surface reactivities during MLSE exposure, may be questioned since these results suggest its absence yields greater levels of both physical and chemical morphological changes.
While the examination of the character of each plasma consideration is outside the scope of this paper, the light emitted depends on the species formed such as excited Ar and atomic emission lines observed in Ar/O2 plasma jet spectra accompanied by a background continuum stretching into the far UV (≥200 nm) region [60]. Thus, in attempting to draw conclusions regarding the mechanisms associated with the varying conditions of plasma exposure on both fibre substrates, a general parallel may be proposed between these and the respective well-publicised mechanisms associated with the photolytic and photo-oxidative mechanisms. In the former, absorption of a photon may give rise to the initial rupture of the weakest bonds present, which in cellulose will be the C-O bonds associated with the primary and secondary hydroxyl pendant groups, although similar scissions within the anhydroglucopyranose rings and glucosidic bonds should not be excluded [47,61,62,63,64]. Within polyester, photolytic scissions of polymer chains will be most likely at the C-O bonds within the ester groups, either by Norrish Type I or Type II reactions [65,66]. For both irradiated fibre types, not only will hydrogen radical formation occur but also radical species will exist within the chains themselves, which will be those identified using both DPPH and EPR analytical techniques. In the presence of an oxidative atmosphere and especially oxygen, then the presence of the well-established Bolland and Gee type of mechanisms most likely occur [67] with the formation of hydroperoxy species as intermediates followed by the eventual formation of ketonic and carboxylic acid groups most likely outcomes. The cotton sample exposed under the MLSE N280%/O220% (no UV laser) condition showed the strongest EPR signal of all cotton samples studied and so supports this proposal. While the similarly exposed polyester sample showed lower EPR signal intensities, the presence of oxygen also produced the most intense one.
Of special interest are the observations that the addition of CO2 to the otherwise inert gases Ar and N2 has promoted significant increases in O/C ratios, RSA values and methylene blue absorption for both cotton and polyester, which suggests that under plasma conditions, it exhibits oxidising properties. This is not too surprising since the photolysis of carbon dioxide, especially at short UV wavelengths (163 nm) has been reported to yield CO, O2, and O3, suggested to have been formed via the photolytic formation of oxygen atoms [68]. In addition has been the recent interest in the plasma activation of CO2 in the presence of hydrocarbons as a means of a route to alternative fuels thereby indicating its reactivity with organic materials [69].
With respect to the N2/CO2 condition, the increased polyester surface oxidation under an Ar/CO2 atmosphere is more challenging to explain. While the presence of nitrogen within the plasma gas has been reported to increase the formation of nitrogenous species in cotton [41], the XPS results in Table 5 for polyester do not indicate any such formation. The relative reactivities of argon and nitrogen may be reflected in their respective ionisation potentials of 15.75 and 15.61 eV, which while indicating the greater energy required to ionise and hence activate argon. This, however, offers the suggestion that once ionised, the Ar+ ions formed will have greater energy for subsequent reaction with CO2 and the polyester substrate. Clearly, this interesting observation merits further investigation.
In summary, therefore, we showed that the application of the MLSE plasma in the presence or absence of UV to both cotton and polyester is able to activate respective fibre surfaces with respect to the generation of radical species and oxygen-containing functional groups dependent on plasma dosage and atmospheric type in agreement with previously published work [15,17,18,20]. Previous work in our laboratories [22] has shown that application of this plasma/UV combined system to cotton fabrics impregnated with a flame retardant of low wash durability significantly increases the latter as a consequence of bond formation between the fibre substrate and applied retardant. It is evident that formation of radical intermediate species and increased surface functionality will be contributors to this effect. This then suggests that application of other surface finishes could similarly be applied by exposure to plasma/UV treatment as opposed to the current chemical procedures used. However, whether this effect is dependent upon the presence or absence of UV would require further research.

Supplementary Materials

The following supporting information can be downloaded at: https://www.mdpi.com/article/10.3390/fib10080066/s1, Figure S1: UV–visible spectra for supernatant DPPH solution/exposed (a) cotton and (b) PET samples after 2 kW MLSE treatment under N2/CO2 with and without UV laser. Note that the times in brackets refer to DPPH/fabric immersion times. Figure S2: UV–visible spectra for supernatant DPPH solutions from (a) cotton and (b) PET samples subjected to 3.5 kW MLSE treatment under Ar, N2 and N2/O2 with UV laser, after 24 h immersion. Figure S3: XPS spectra of the pure cotton fabric. (a) full XPS spectrum, (b) C1s high-resolution spectrum. The peaks are curve fitted and deconvoluted using CasaXPS software to calculate the relative concentrations and different types of chemical bonds of the samples. Figure S4: XPS spectra of the pure polyester (PET) fabric, (a) Full spectrum, (b) C1s high-resolution spectrum. The peaks are curve fitted and deconvoluted using CasaXPS software to calculate the relative concentrations of the different types of carbon-containing chemical bonds in the samples. Figure S5: DSC traces during the second heating cycle showing glass transition (Tg) of PET with and without plasma treatment. Figure S6: DMA analysis for PET before and after plasma treatment: (a) Tan delta, (b) storage modulus vs. temp curves.; Table S1: Thermal analysis under flowing air for cotton samples with and without 2 kW MLSE UV laser/plasma treatment. Table S2: Thermal analysis results for PET samples after 2 kW plasma treatment with different plasma gases.

Author Contributions

Conceptualisation, A.R.H. and B.K.K.; methodology, M.A., A.R.H. and B.K.K.; formal analysis, M.A.; investigation, M.A.; resources, B.K.K.; writing—original draft preparation, M.A.; writing—review and editing, A.R.H. and B.K.K.; supervision, A.R.H. and B.K.K.; project administration, B.K.K.; funding acquisition, A.R.H. All authors have read and agreed to the published version of the manuscript.

Funding

This research was funded by The Cotton Industry War Memorial Trust, The Jack Brown Research Studentship.

Institutional Review Board Statement

Not applicable.

Informed Consent Statement

Not applicable.

Data Availability Statement

Data availability statements are not applicable here.

Acknowledgments

Multiplexed Laser Surface Enhancement (MLSE) facility was provided by MTIX Ltd., Huddersfield, UK. EPR analysis was undertaken by Dr Muralidharan Shanmugam at the Manchester Institute of Biotechnology, University of Manchester. XPS was performed at the EPSRC National Facility for XPS (“HarwellXPS”), operated by Cardiff University and UCL, under Contract No. PR16195.

Conflicts of Interest

The authors declare no conflict of interest.

References

  1. Peran, J.; Ražić, S.E. Application of atmospheric pressure plasma technology for textile surface modification. Text. Res. J. 2020, 90, 1174–1197. [Google Scholar] [CrossRef]
  2. McCoustra, M.R.S.; Mather, R.R. Plasma modification of textiles: Understanding the mechanisms involved. Text. Prog. 2019, 50, 185–229. [Google Scholar] [CrossRef]
  3. Zile, A.; Oliveiro, F.R.; Souto, A.P. Plasma treatment in the textile industry. Plasma Process. Polym. 2015, 12, 98–131. [Google Scholar] [CrossRef] [Green Version]
  4. Zhang, C.; Fang, K. Surface modification of polyester fabrics for inkjet printing with atmospheric-pressure air/Ar plasma. Surf. Coat. Technol. 2009, 203, 2058–2063. [Google Scholar] [CrossRef]
  5. Sohbatzadeh, F.; Shakerinasab, E.; Eshghabadi, M.; Ghasemi, M. Characterization and performance of coupled atmospheric pressure argon plasma jet with n-hexane electrospray for hydrophobic layer coatings on cotton textile. Diam. Relat. Mater. 2019, 91, 34–45. [Google Scholar] [CrossRef]
  6. Kale, K.H.; Palaskar, S. Atmospheric pressure plasma polymerization of hexamethyldisiloxane for imparting water repellency to cotton fabric. Text. Res. J. 2010, 81, 608–620. [Google Scholar] [CrossRef]
  7. Ji, Y.-Y.; Hong, Y.-C.; Lee, S.-H.; Kim, S.-D.; Kim, S.-S. Formation of super-hydrophobic and water-repellency surface with hexamethyldisiloxane (HMDSO) coating on polyethyleneteraphtalate fiber by atmospheric pressure plasma polymerization. Surf. Coat. Technol. 2008, 202, 5663–5667. [Google Scholar] [CrossRef]
  8. Horrocks, A.R.; Nazaré, S.; Masood, R.; Kandola, B.; Price, D. Surface modification of fabrics for improved flash-fire resistance using atmospheric pressure plasma in the presence of a functionalized clay and polysiloxane. Polym. Adv. Technol. 2011, 22, 22–29. [Google Scholar] [CrossRef]
  9. Lam, Y.; Kan, C.; Yuen, C. Effect of oxygen plasma pretreatment and titanium dioxide overlay coating on flame retardant finished cotton fabrics. BioResources 2011, 6, 1454–1474. [Google Scholar]
  10. Johansson, K. Plasma modification of natural cellulosic fibres. In Plasma Technologies for Textiles; Shishoo, R., Ed.; Woodhead Publishing: Cambridge, UK, 2007; pp. 247–281. [Google Scholar]
  11. Kan, C.-W.; Lam, C.-F. Atmospheric pressure plasma treatment for grey cotton knitted fabric. Polymers 2018, 10, 53. [Google Scholar] [CrossRef] [Green Version]
  12. Kan, C.-W.; Man, W.-S. Parametric study of effects of atmospheric pressure plasma treatment on the wettability of cotton fabric. Polymers 2018, 10, 233. [Google Scholar] [CrossRef] [Green Version]
  13. Karahan, H.A.; Özdoğan, E.; Demir, A.; Ayhan, H.; Seventekin, N. Effects of atmospheric pressure plasma treatments on certain properties of cotton fabrics. Fibres Text. East. Eur. 2009, 17, 19–22. [Google Scholar]
  14. Karahan, H.A.; Özdoğan, E. Improvements of surface functionality of cotton fibers by atmospheric plasma treatment. Fibers Polym. 2008, 9, 21–26. [Google Scholar]
  15. Tian, L.; Nie, H.; Chatterton, N.P.; Branford-White, C.J.; Qiu, Y.; Zhu, L. Helium/oxygen atmospheric pressure plasma jet treatment for hydrophilicity improvement of grey cotton knitted fabric. Appl. Surf. Sci. 2011, 257, 7113–7118. [Google Scholar] [CrossRef]
  16. Parvinzadeh, M.; Ebrahimi, I. Atmospheric air-plasma treatment of polyester fiber to improve the performance of nanoemulsion silicone. Appl. Surf. Sci. 2011, 257, 4062–4068. [Google Scholar] [CrossRef]
  17. Leroux, F.; Perwuelz, A.; Campagne, C.; Behary, N. Atmospheric air-plasma treatments of polyester textile Structures. J. Adhes. Sci. Technol. 2006, 20, 939–957. [Google Scholar]
  18. Leroux, F.; Campagne, C.; Perwuelz, A.; Gengembre, L. Atmospheric air plasma treatment of polyester textile materials. Textile structure influence on surface oxidation and silicon resin adhesion. Surf. Coat. Technol. 2009, 203, 3178–3183. [Google Scholar] [CrossRef]
  19. Wang, C.X.; Lv, J.C.; Ren, Y.; Zhi, T.; Chen, J.Y.; Zhou, Q.Q.; Lu, Z.Q.; Gao, D.W.; Jin, L.M. Surface modification of polyester fabric with plasma pretreatment and carbon nanotube coating for antistatic property improvement. Appl. Surf. Sci. 2015, 359, 196–203. [Google Scholar] [CrossRef]
  20. Rezaei, F.; Dickey, M.D.; Bourhamc, M.; Hauser, P.J. Surface modification of PET film via a large area atmospheric pressure plasma: An optical analysis of the plasma and surface characterization of the polymer film. Surf. Coat. Technol. 2017, 309, 371–381. [Google Scholar] [CrossRef]
  21. Mistry, P.; Turchan, J. Method and Apparatus for Surface Treatment of Materials Utilizing Multiple Combined Energy Sources. US Patent 9,309,619 B2, 12 April 2016. [Google Scholar]
  22. Horrocks, A.R.; Eivazi, S.; Ayesh, M.; Kandola, B. Environmentally sustainable flame retardant surface treatments for textiles: The potential of a novel atmospheric plasma/UV laser technology. Fibers 2018, 6, 31. [Google Scholar] [CrossRef] [Green Version]
  23. Weclawski, B.T.; Horrocks, A.R.; Ebdon, J.R.; Mosurkal, R.; Kandola, B.K. Combined atmospheric pressure plasma and UV surface functionalisation and diagnostics of nylon 6.6 fabrics. Appl. Surf. Sci. 2021, 562, 150090. [Google Scholar] [CrossRef]
  24. Musa, K.H.; Abdullah, A.; Al-Haiqi, A. Determination of DPPH free radical scavenging activity: Application of artificial neural networks. Food Chem. 2016, 194, 705–711. [Google Scholar] [CrossRef]
  25. Foti, M.C. Use and abuse of the DPPH(•) radical. J. Agric. Food Chem. 2015, 63, 8765–8776. [Google Scholar] [CrossRef] [PubMed]
  26. Ozcelik, B.; Lee, J.H.; Min, D.B. Effects of light, oxygen, and pH on the absorbance of 2,2-Diphenyl-1-picrylhydrazyl. J. Food Sci. 2003, 68, 487–490. [Google Scholar] [CrossRef]
  27. Scheider, C.; Rasband, W.; Eliceiri, K. NIH Image to ImageJ: 25 years of image analysis. Nat. Methods 2012, 9, 671–675. [Google Scholar] [CrossRef]
  28. Collins, T. ImageJ for microscopy. BioTechniques 2007, 43, 25–30. [Google Scholar] [CrossRef]
  29. Gholamzad, E.; Karimi, K.; Masoomi, M. Effective conversion of waste polyester-cotton textile to ethanol and recovery of polyester by alkaline pretreatment. Chem. Eng. J. 2014, 253, 40–45. [Google Scholar] [CrossRef]
  30. Badia, J.D.; Stromberg, E.; Karlsson, S.; Ribes-Greus, A. The role of crystalline, mobile amorphous and rigid amorphous fractions in the performance of recycled poly (ethylene terephthalate) (PET). Polym. Degrad. Stab. 2012, 97, 98–107. [Google Scholar] [CrossRef] [Green Version]
  31. Rahimi, M.; Parvinzadeh, M.; Yousefpour, M.; Ahmadi, S. Thermal characterization and flammability of polyester fiber coated with nonionic and cationic softeners. J. Surf. Deterg. 2011, 14, 595–603. [Google Scholar] [CrossRef]
  32. Stanik, R.; Lucas, P.; Langkamp, A.; Modler, N.; Gude, M.; Pilawka, R. Influence of heat pretreatment on cross-linking behavior and thermal properties of thermoset semi-finished products with powder resin systems. Compos. Theory Pract. 2017, 17, 114–118. [Google Scholar]
  33. Sung, Y.T.; Kum, C.K.; Lee, H.S.; Kim, J.S.; Yoon, H.G.; Kim, W.N. Determining the degree of crosslinking of ethylene vinyl acetate photovoltaic module encapsulants—A comparative study. Polymer 2005, 46, 11844–11848. [Google Scholar] [CrossRef]
  34. Morton, W.E.; Hearle, J.W.S. Physical Properties of Textile Fibres, 3rd ed.; The Textile Institute: Manchester, UK, 1993; pp. 1–73. [Google Scholar]
  35. Dave, H.; Ledwani, L.; Chandwani, N.; Chauhan, N.; Nema, S.K. The removal of impurities from gray cotton fabric by atmospheric pressure plasma treatment and its characterization using ATR-FTIR spectroscopy. J. Text. Inst. 2014, 105, 586–596. [Google Scholar] [CrossRef]
  36. Goodman, I.; Nesbitt, B.F. The structures and reversible polymerization of cyclic oligomers from poly(ethylene terephthalate). J. Polym. Sci. 1960, 1, 384–396. [Google Scholar]
  37. Omerogullari, Z.; Kut, D. Application of low-frequency oxygen plasma treatment to polyester fabric to reduce the amount of flame retardant agent. J. Text. Res. 2012, 82, 613–621. [Google Scholar] [CrossRef]
  38. Ko, T.J.; Oh, K.H.; Moon, M.W. Plasma-induced hetero-nanostructures on a polymer with selective metal co-deposition. Adv. Mater. Interfaces 2015, 2, 1400431. [Google Scholar] [CrossRef]
  39. John, M.J.; Anandjiwala, R.D. Surface modification and preparation techniques for textile materials. In Surface Modification of Textiles; Wei, Q., Ed.; Woodhead Publishing Series in Textile Technology: Cambridge, UK, 2009; pp. 1–25. [Google Scholar]
  40. Raslan, W.M.; Rashed, U.S.; El-Sayad, H.; El-Halwagy, A.A. Ultraviolet protection, flame retardancy and antibacterial properties of treated polyester fabric using plasma-nano technology. Mater. Sci. Appl. 2011, 2, 1432–1442. [Google Scholar] [CrossRef] [Green Version]
  41. Ibrahim, N.A.; Eid, B.M.; Abdel-Aziz, M.S. Effect of plasma superficial treatments on antibacterial functionalization and coloration of cellulosic fabrics. Appl. Surf. Sci. 2017, 392, 1126–1133. [Google Scholar] [CrossRef]
  42. Sabharwal, H.S.; Denes, F.; Nielsen, L.; Young, R.A. Free-radical formation in jute from argon plasma treatment. J. Agric. Food Chem. 1993, 41, 2202–2207. [Google Scholar] [CrossRef]
  43. Makarov, I.; Vinogradov, M.; Mironova, M.; Shandryuk, G.; Golubev, Y.; Berkovich, A. The Thermal Behavior of Lyocell Fibers Containing Bis(trimethylsilyl)acetylene. Polymers 2021, 13, 537. [Google Scholar] [CrossRef]
  44. Kan, C.-W.; Man, S.-W. Surface characterisation of atmospheric pressure plasma treated cotton fabric—Effect of operation parameters. Polymers 2018, 10, 250. [Google Scholar] [CrossRef] [Green Version]
  45. Pranslip, P.; Pruettiphap, M.; Bhanthumnavin, W.; Paosawatyanyong, B.; Kiatkamjornwong, S. Surface modification of cotton fabrics by gas plasmas for colorstrength and adhesion by inkjet ink printing. Appl. Polym. Sci. 2016, 264, 208–220. [Google Scholar]
  46. Ly, B.; Thielemans, W.; Dufresne, A.; Chaussy, D.; Belgacem, M.N. Surface functionalization of cellulose fibres and their incorporation in renewable polymeric matrices. Compos. Sci. Tech. 2008, 68, 3193–3201. [Google Scholar] [CrossRef]
  47. Peters, R.H. Textile Chemistry; Elsevier: Amsterdam, The Netherlands, 1967; Volume 2. [Google Scholar]
  48. Zhou, J.; Cai, D.; Xu, Q.; Zhang, Y.; Fu, F.; Diao, H.; Liu, X. Excellent binding effect of L-methionine for immobilizing silver nanoparticles onto cotton fabrics to improve the antibacterial durability against washing. RSC Adv. 2018, 8, 24458–24463. [Google Scholar] [CrossRef] [PubMed] [Green Version]
  49. Rani, K.V.; Sarma, B.; Sarma, A. Plasma treatment on cotton fabrics to enhance the adhesion of reduced graphene oxide for electro-conductive properties. Diam. Relat. Mater. 2018, 84, 77–85. [Google Scholar] [CrossRef]
  50. Shahidi, S. Novel method for ultraviolet protection and flame retardancy of cotton fabrics by low-temperature plasma. Cellulose 2014, 21, 757–768. [Google Scholar] [CrossRef]
  51. Silva, S.S.; Luna, S.M.; Gomes, M.E.; Benesch, J.; Pashkuleva, I.; Mano, J.F.; Reis, R.L. Plasma surface modification of chitosan membranes: Characterization and preliminary cell response studies. Macromol. Biosci. 2008, 8, 568–576. [Google Scholar] [CrossRef] [PubMed] [Green Version]
  52. da Silva, R.C.L.; Alves, C.; Nascimento, J.H.; Neves, J.R.; Teixeira, V. Surface modification of polyester fabric by non-thermal plasma treatment. J. Phys. Conf. Ser. 2012, 406, 012017. [Google Scholar] [CrossRef]
  53. Fang, K.; Zhang, C. Surface physical–morphological and chemical changes leading to performance enhancement of atmospheric pressure plasma treated polyester fabrics for inkjet printing. Appl. Surf. Sci. 2009, 255, 7561–7567. [Google Scholar] [CrossRef]
  54. Tkavc, T.; Petrinič, I.; Luxbacher, T.; Vesel, A.; Ristić, T.; Zemljič, L.F. Influence of O2 and CO2 plasma treatment on the deposition of chitosan on to polyethyleneterephthalate (PET) surfaces. Int. J. Adhes. 2014, 48, 168–176. [Google Scholar] [CrossRef]
  55. Nourbakhsh, S. Antimicrobial performance of plasma corona modified cotton treated with silver nitrate. Russ. J. Appl. Chem. 2018, 91, 1338–1344. [Google Scholar] [CrossRef]
  56. Mirjalili, M.; Karimi, L. The impact of nitrogen low temperature plasma treatment upon the physical–chemical properties of polyester fabric. J. Text. Inst. 2013, 104, 98–107. [Google Scholar] [CrossRef]
  57. Abiad, M.G.; Campanella, O.H.; Carvajal, M.T. Assessment of thermal transitions by dynamic mechanical analysis (DMA) using a novel disposable powder holder. Pharmaceutics 2010, 2, 78–90. [Google Scholar] [CrossRef] [PubMed] [Green Version]
  58. Li, R. Time-temperature superposition method for glass transition temperature of plastic materials. Mater. Sci. Eng. A 2000, 278, 36–45. [Google Scholar] [CrossRef]
  59. Steinmann, W.; Walter, S.; Beckers, M.; Seide, G.; Gries, T. Thermal analysis of phase transitions and crystallization in polymeric fibers. In Applications of Calorimetry in a Wide Context-Differential Scanning Calorimetry, Isothermal Titration Calorimetry and Microcalorimetry; Elkordy, A.A., Ed.; IntechOpen: London, UK, 2013; Available online: https://www.intechopen.com/books/2519 (accessed on 24 July 2022).
  60. Falahat, A.; Ganjovi, A.; Taraz, M.; Rostami Ravari, M.N.; Shahedi, A. Optical characteristics of a RF DBD plasma jet in various Ar/O2 mixtures. Pramana-J. Phys. 2018, 90, 27. [Google Scholar] [CrossRef]
  61. Phillips, G.O.; Arthur, J.C. Chemical effects of light on cotton cellulose and related compounds: Part II: Photodegradation of cotton cellulose. Text. Res. J. 1964, 34, 572–580. [Google Scholar] [CrossRef]
  62. Kujirai, C. Studies on the photodegradation of cellulose (VII). Mechanism and quantum yield of photodegradation of cellulose. Sen’i Gakkaishi 1966, 22, 84–89. [Google Scholar] [CrossRef]
  63. Yurugi, T.; Iwata, H. Photodegradation of cellulosic materials. Nippon Kagaku Kaishi 1977, 4, 544–548. [Google Scholar] [CrossRef]
  64. Schnabel, W. Photoreactions in biopolymers. In Polymers and Light: Fundamentals and Technical Applications; Wiley-Verlag: Weinheim, Germany, 2007; Chapter 8. [Google Scholar] [CrossRef]
  65. Day, M.; Wiles, D.M. Photochemical degradation of polyethylene terephthalate. Part III: Decomposition products and reaction mechanism. J. Appl. Polym. Sci. 1972, 16, 203–215. [Google Scholar] [CrossRef]
  66. Allen, N.S.; Edge, M. Fundamentals of Polymer Degradation and Stabilisation; Elsevier Applied Science: London, UK; New York, NY, USA, 1992; pp. 80–82. [Google Scholar]
  67. Bolland, J.L.; Gee, G. Kinetic studies in the chemistry of rubber and related materials. II. The kinetics of oxidation of unconjugated olefins. Trans. Faraday Soc. 1946, 42, 236–243. [Google Scholar] [CrossRef]
  68. Loucks, L.F.; Cvetanović, R.J. Photolysis of carbon dioxide at 1633 Å. J. Chem. Phys. 1972, 56, 321–329. [Google Scholar] [CrossRef]
  69. Ong, M.Y.; Nomanbhay, S.; Kusumo, F.; Show, P.L. Application of microwave plasma technology to convert carbon dioxide (CO2) into high value products: A review. J. Clean. Prod. 2022, 336, 130447. [Google Scholar] [CrossRef]
Figure 1. SEM images of cotton fabric treated with different plasma dosages, atmosphere type and UV laser: (a) pure cotton; (b,c) N2100% at 200 and 1000 W/m2·min, respectively; (d) N280%/O220%, 200 W/m2·min; and (e) N280%/CO220%, 200 W/m2·min.
Fibers 10 00066 g001
Figure 2. SEM image of (a) PET fabric and (be) treated with N2100% plasma gas at different plasma dosages: (b) 100, (c) 200, (d) 500, (e) 1000 W/m2·min and in the presence of UV laser.
Fibers 10 00066 g002
Figure 3. SEM images of PET samples after exposure to (a) N280%/CO220% and (b) N280%/O220% atmospheres at 200 W/m2·min plasma dosage and in presence of UV laser.
Fibers 10 00066 g003
Figure 4. UV–visible spectra for supernatant DPPH solution/exposed (a) cotton and (b) PET samples after 200 W/m2·min dosage MLSE treatment under Ar/CO2 with and without UV laser. Note that the times in brackets refer to DPPH/fabric immersion times.
Fibers 10 00066 g004
Figure 5. First derivative EPR spectra for cotton, polyester and nylon fabric treated with 3.5 kW power MLSE treatments. The -1 and -2 represent the numbered replicates. Black starred shapes are likely broad EPR signals due to a paramagnetic O2 signal.
Fibers 10 00066 g005
Figure 6. Brightness values calculated using Image J software of dyed (a) cotton samples at 25 °C and (b) PET samples at 60 °C for methylene blue before and after 200 W/m2·min MLSE treatment. Note that brightness units are arbitrary, although they are absolutely proportional to values in candela/m2.
Fibers 10 00066 g006
Figure 7. Thermal analysis in flowing air of (a) cotton and (b) PET samples without and after MLSE plasma treatment under nitrogen, N2/CO2 and N2/O2 gas mixtures, (a1,b1) TGA, (a2,b2) DTG and (a3,b3) DTA curves.
Fibers 10 00066 g007
Figure 8. DSC traces for PET with and without 200 W/m2·min plasma treatment during the (a) first and (b) second heating cycles; and (c) the cooling cycle.
Fibers 10 00066 g008
Table 1. Cotton and polyester sample MLSE treatment.
Plasma GasPlasma Power (kW)/Number of CyclesPower Dosage (W/m2·min) UV Laser
(228 W)
-00-
N2100%1/2 200
N2100%3.5 */1350
N2100%1/5 500
N2100%1/10 1000
N280%/O220%1/2200
N280%/CO220%1/2200
N280%/CO220%1/2200-
Ar100%1/2 200
Ar80%/O220%1 **/2200
Ar80%/CO220%1/2 200
Ar80%/CO220%1/2 200-
Note * Cotton and polyester EPR studies only. ** Polyester DPPH studies only.
Table 2. RSA values for cotton samples treated with 200 W/m2·min MLSE plasma and immersed in DPPH solution.
Sample CodeUV Laser
(228 W)
RSA, %
15 min60 min
DPPH solution-00
Pure cotton-9.09.0
DPPH/Cot-Ar/CO213.013.0
DPPH/Cot-Ar/CO2 -17.017.0
DPPH/Cot-N2/CO217.018.0
DPPH/Cot-N2/CO2 -15.015.0
Table 3. RSA values for polyester (PET) samples treated with 200 W/m2·min MLSE plasma under different plasma gases with and without UV laser and immersed in DPPH solution.
Sample Code UV Laser
(228 W)
RSA, %
15 min60 min
DPPH solution-00
DPPH/PET--2.3 (24 h)
DPPH/PET-Ar/CO229.230.8
DPPH/PET-Ar/CO2-35.734.1
DPPH/PET-N2/CO222.123.1
DPPH/PET-N2/CO2-13.712.1
DPPH/PET-Ar/O23.58.9
Table 4. XPS results showing the relative average atomic % concentration of elements on the cotton fabric before and after 200 W/m2·min MLSE plasma treatment.
Sample CodeCarbon (1s)Oxygen (1s)Nitrogen (1s)O/C Ratio
Pure cotton68.0 ± 0.631.0 ± 0.51.0 ± 0.20.45
COT/N2-CO265.0 ± 130.0 ± 10.7 ± 0.10.46
COT/N2-CO2 (No UV Laser)66.0 ± 133.0 ± 0.61.0 ± 0.50.50
COT/Ar-CO267.0 ± 0.331.0 ± 1.01.0 ± 0.30.46
COT/Ar-CO2 (No UV laser)68.0 ± 0.131.0 ± 0.20.7 ± 0.30.46
Table 5. XPS results showing the apparent average atomic % concentration of elements on the polyester fabric (PET) before and after 200 W/m2·min MLSE plasma treatment.
Sample CodeCarbon (1s)Oxygen (1s)Silicon (2p)O/C Ratio
PET80.0 ± 0.419.0 ± 0.50.6 ± 0.00.24
PET-N2/CO277.0 ± 1.022.0 ± 1.00.6 ± 0.00.30
PET-N2/CO2
(No UV Laser)
74.0 ± 1.023.0 ± 1.04.0 ± 1.00.32
PET-Ar/CO275.0 ± 1.023.0 ± 1.03.0 ± 1.00.31
PET-Ar/CO2
(No UV Laser)
69.0 ± 1.024.0 ± 1.07.0 ± 1.00.35
Table 6. XPS results showing the relative concentrations of C1s components on the PET fabric before and after 200 W/m2·min dosage MLSE plasma treatment.
Sample CodeConcentration (%) of C1s% of All C-O Bonds
C-C, C-HC-O-CC=OO-C=O
PET68.027.05.0-32
PET-N2/CO252.039.09.01.049
PET-N2/CO2
(No UV Laser)
63.026.011.0-37
PET-Ar/CO257.032.010.0-42
PET-Ar/CO2
(No UV Laser)
46.042.011.01.054
Table 7. Water drop average diameter of cotton and PET fabrics treated with and without 200 W/m2·min MLSE plasma dosage and with and without UV laser.
Sample CodeUV Laser (MJ)Water Drop Diameter after 2 min (mm)
Pure cotton-15.0 ± 0.6
COT-N2/CO265015.0 ± 0.6
COT-N2/CO2-20.0 ± 1.0
COT-Ar/CO265016.0 ± 1.0
PET 1.0 ± 1.0
PET-Ar6505.0 ± 1.0
PET-Ar/CO265020.0 ± 1.0
PET-Ar/CO2 -25.0 ± 1.0
PET-N2/CO265025.0 ± 1.0
PET-N2/CO2 -35.0 ± 1.0
Table 8. DSC analysis of polyester samples: Second-order transition (Tg) and melting (Tm) temperatures, crystallisation temperatures (Tc), fusion enthalpies ΔHf and ΔHf2 (J/g) from the first and second heating cycles, enthalpies of crystallisation (ΔHc) from the cooling cycle, percentage crystallinity (1st cycle) and the derived percentage cross-linking (1st cycle); DMA-derived second-order transition (Tg’).
Sample Tg
(°C)
(DSC)
Tg
(°C)
(DMA)
Tm1 (°C)Tc (°C)Tm2 (°C)ΔHf (J/g)ΔHc (J/g)ΔHf2 (J/g)Crystallinity %
First Heating Cycle
Cross-Linking % from the First Heating Cycle
PET7912525220724656.038.032.040.0 ± 0.1-
PET-Ar7913125220824556.037.033.040.0 ± 0.8-
PET-Ar/CO281130252 20524555.039.031.039.0 ± 0.8-
PET-Ar/CO2 (no UV)8113325220424657.040.034.041.0 ± 0.10.7
PET-N2/CO281133253 20524762.041.038.044.0 ± 0.610.0
PET-N2/CO2 (no UV)82133252 20424567.044.039.048.0 ± 0.319.0
Publisher’s Note: MDPI stays neutral with regard to jurisdictional claims in published maps and institutional affiliations.

