Article

Monofractal Dimension in Quantifying the Image of Neurons in the Plane: Analysis of Image Features of Multipolar Neurons from the Principal Olivary Nucleus in Humans with Age

by
Nebojša Milošević
Department of Biophysics, School of Medicine, University of Belgrade, 11000 Belgrade, Serbia
Fractal Fract. 2022, 6(8), 408; https://doi.org/10.3390/fractalfract6080408
Submission received: 17 June 2022 / Revised: 15 July 2022 / Accepted: 21 July 2022 / Published: 25 July 2022
(This article belongs to the Special Issue Methods for Estimation of Fractal Dimension Based on Digital Images)

Abstract

:
The existing study examines four features of 2D images from the principal olivary nucleus of the adult human. The main goal of the research is to investigate the relationship between monofractal and computational parameters that quantify three features of neuronal images. An additional goal of the research is to examine the change in the four features of the image with age. The samples belonged to the histological collection from the Department of Anatomy of the University of Novi Sad. From the pool of binary images, a sample of medium-sized neurons was selected and further processed. A public computer program (Image J with FracLac plugin) with standard commands that calculate computational and monofractal parameters analyzed all images. The relationship between parameters or between parameters with age was performed by statistical evaluation of Pearson’s correlation coefficient. The monofractal dimension of corresponding images can qualitatively represent image properties and some features decrease with age, while some do not. This study confirms the previous conclusions according to which the monofractal dimension of neuronal image reliably quantifies three features of the image. On the other hand, the study shows the distribution of four features with age.

1. Introduction

Research on the morphology of neurons begins with a qualitative description [1] of the cells in the Central Nervous System (CNS) and their classification [2] is finally confirmed by neurophysiological examinations [3]. As the cellular composition of the human brain is very complex and differs across regions of the CNS [4], this study focuses on only one region of the human CNS: the principal olivary nucleus (PON) [5].
As mentioned earlier [6], the PON is the primary laminar structure of the inferior olivary complex (ION). Qualitative and quantitative analysis of the morphology was based on collecting images of horizontal projections using a light microscope [7]. Only a few studies analyze the morphology of neurons from the PON, mainly through qualitative or semi-qualitative research [8]. They mainly show the types of neurons [6], their histological classification [9], and the association of the proposed types with the function of the PON [8].
The aging process is characterized by time-dependent changes that lead to irreversible processes in the cells of organic systems and a decline in the self-regulatory capacity of the individual [10]. Hundreds of theories have been proposed, but the most common division is into primary and secondary aging, or maturation and aging [11]. As primary aging is a consequence of the course of time, secondary aging is a consequence of environmental factors [12]. The aging of cells in the CNS is reflected by several processes, such as decreasing cell number, the disappearance of spines, and the reduction of complexity of dendrites [13].
The initial study of the human PON investigated the morphology of three age groups: the second group of maturation and two groups of aging [8]. In this study, the quantitative analysis examined the properties of neurons and dendrites using computational parameters. Further, neurons were more precisely classified through parameters of size, shape, and complexity [14]. Nevertheless, the latest study promotes monofractal parameters in quantifying astrocytes from the PON [15].
Due to the above, the main goal was to examine the distribution of multipolar neurons of the human PON over the years. From the available sample, those belonging to the group of medium-sized neurons [9] were chosen. Images were analyzed with monofractal analysis, i.e., the fractal analysis type that presents only one fractal dimension value. The morphology was quantified with parameters, which describe four image features (size, shape, complexity, and homogeneity). Therefore, the relationship between the monofractal parameters and corresponding computational parameters was examined at the beginning of the research.

2. Materials and Methods

The study investigates brain samples from 30 humans; in particular, from bilateral sections of the PON. These samples belonged to the histological collections of the department of Anatomy of the University of Novi Sad after approval of the Ethics committee (University of Novi Sad). The samples were collected from cadavers aged 35 to 95 years [8], without disorders in the CNS [16]. The brains were cut into pieces that corresponded to the dimensions of the human PON (2 cm in length and 1.25 cm in width). A more detailed explanation of the histological procedure can be seen in the previous publication [8,9].

2.1. Image Acquisition

The samples were analyzed by microscope “Leica DC 100” (Leica Microsystems, Wetzlar, Germany) using the system magnification of 400× [7]. The impregnated neurons were fully visible in horizontal cross-sectional images. If images were problematic, i.e., if neurons were broken or poorly impregnated, they were excluded from the sample, but only those with dense and homogeneous precipitate were recorded [8]. All identified neurons were permanently recorded by a digital camera “Leica DC 100” [7]. Simultaneously, neurons were transformed into digital images using the accompanying software “Digital Camera System” (Leica Microsystems, Heerbrugg, Switzerland). Finally, the whole neuron was recovered by analyzing several images correlated with the body size of a neuron.

2.2. Post-Processing

All images, i.e., the horizontal sections, were loaded into Image J (http://rsbweb.nih.gov/ij (accessed on 10 May 2022), National Institute of Health, Bethesda, Rockville, MD, USA). The following steps in editing were made using various subcommands of the package [17]. Firstly, the image of the entire neuron was reconstructed, and the RGB image was converted into grayscale [16]. After the previous step, the trajectory was rebuilt through the boundary of the soma and the dendritic axis (Figure 1A). Then, each grayscale image was converted into a binary format (Figure 1B) by removing the axon and other artifacts [16]. The previous steps in image adjustment were done by two specialists (neuroanatomy) with more than five years of experience in this image processing method [9]. At the end of this part of the processing, 139 binary images were isolated and further processed to quantify four features.

2.3. Presentation and Quantification

We examined each image by calculating four computational and four monofractal parameters. These parameters quantify the four properties of the image: (i) the size, (ii) the shape, (iii) the complexity, and (iv) the homogeneity.
(i) The size. The binary image (Figure 1B) quantified this feature, measuring the projection area of the neuron (A) and the fractal dimension of the binary image (Dbin). Both parameters were calculated using the Image J program by commands: Measure-Area and Tools-Fractal Box Count [18]. Concurrently, the A quantifies the image area, the Dbin estimates the space-filling property of the neuron. The Dbin estimates how neuronal projection fills the plane defined by image size. The reader can find a more detailed explanation in previous publications [18,19,20]. The value ranges between 1 and 2, where the maximum value means that the entire frame of the image is filled with black pixels.
(ii) The shape. The binary-outline image quantified this characteristic after the neural field was constructed (Figure 1C) and the border was reduced to the single-pixel line [20]. First, two parameters were calculated: perimeter (Pnf) and fractal dimension of outline image (Dout). The Pnf evaluates the extent of the neural field (i.e., the polygon), and the Dout evaluates the irregularity in the shape. The Dout represents the deviation from the value of classic geometric figures [18]. Both parameters were calculated using standard commands in Image J: Measure-Perimeter and Tools-Fractal Box Count.
(iii) The complexity. The binary-skeletonized image (Figure 1D) investigated this characteristic. This type of image was obtained when all dendrites were reduced to a single-pixel broad line, and the cell body was removed [21]. Two parameters quantified this feature: the maximum intersection of the dendrite and the circle (Nm) and the fractal dimension of the skeletonized image (Dskel). The Nm was obtained with the mathematical model, which evaluates the complexity of the dendritic tree. As previously discussed [22], each image was overlaid with a series of equidistantly arranged concentric circles, and the maximal number of intersections (between dendrites and circle) was calculated. The Dskel simultaneously quantified dendritic aberrations, and the complexity of the dendritic tree and its value represented the degree of complexity [18,19,20,21]. Although the Nm was calculated on the binary image, the Dskel was calculated on the binary-skeletonized image, using the previously mentioned commands of the Image J.
(iv) The homogeneity. Only one parameter quantified this property—the lacunarity (Λ). This parameter was obtained on the binary image (Figure 1B), and it evaluates the heterogeneity of the image in its simultaneous translation and rotation [17]. The Λ was obtained by the Image J plugin, FracLac [23], using the box counting method. Images with low Λ imply homogeneity based on similarly sized gaps and slight rotational variance [17].

2.4. Statistics

The results were analyzed using the demo version of the SPS program v26 (IBM SPSS Statistics, Chicago, IL, USA). First, the relationship between monofractal and corresponding computational parameters and the distribution with age was evaluated by the correlation coefficient. Their statistical evaluation was performed by the procedure outlined in [24]. The data distribution was tested using four criteria, which are presented in the table. First, the difference in monofractal parameters between three age groups was analyzed with one-way ANOVA, while statistical significance between all pairs was examined by a Bonferroni post hoc test [24]. A value of p < 0.05 was considered significant.

3. Results

3.1. Comparison of Monofractal and Computational Parameters

Examination of the correlation between parameters, which quantify the size and shape of neurons and the complexity of the dendritic field, was shown in Table 1. Section 2.3 shows a more detailed explanation of both parameters, monfractal and computational.
Firstly, values of computational parameters (from lowest to highest) were divided into twelve intervals. For the As, the intervals were equidistant, while Pnf and Nm were divided so that the gaps would be the same for all parameters. Then, for each interval, the number of images was recorded, and the mean value of parameters was calculated. Finally, the dependence between the computational and monofractal parameters was fitted with a straight line, along with the correlation coefficient. Since the nature of the distribution of the six parameters was not investigated, Spearman’s correlation coefficient was calculated instead of Pearson’s. To recall, although the correlation between two parameters is usually checked using Pearson’s coefficient, it is only relevant if the distribution of the parameters is normal [24]. Unlike Pearson’s coefficient, Spearman’s coefficient is used without regard to the nature of the distribution. The statistical evaluation of the distribution was performed by calculating the t value and comparing it with the tabular values for the case of the two-tailed t-test.
Table 1 shows the mean values of the computational and monofractal parameters of the three image properties (size, shape, and complexity). Mean values were recorded across intervals along with the number of cells in each interval (N). Spearman’s correlation coefficient (R) and significance level (p) evaluated the distributions of pairs (As-Dbin, Pnf-Dout and Nm-Dskel). From Table 1, it is clear that all the monofractal parameters are correlated with the computational ones. The Dbin and Dskel are strongly correlated with As and Nm (p < 0.001), while Dout is weakly correlated with Pnf (p = 0.041).

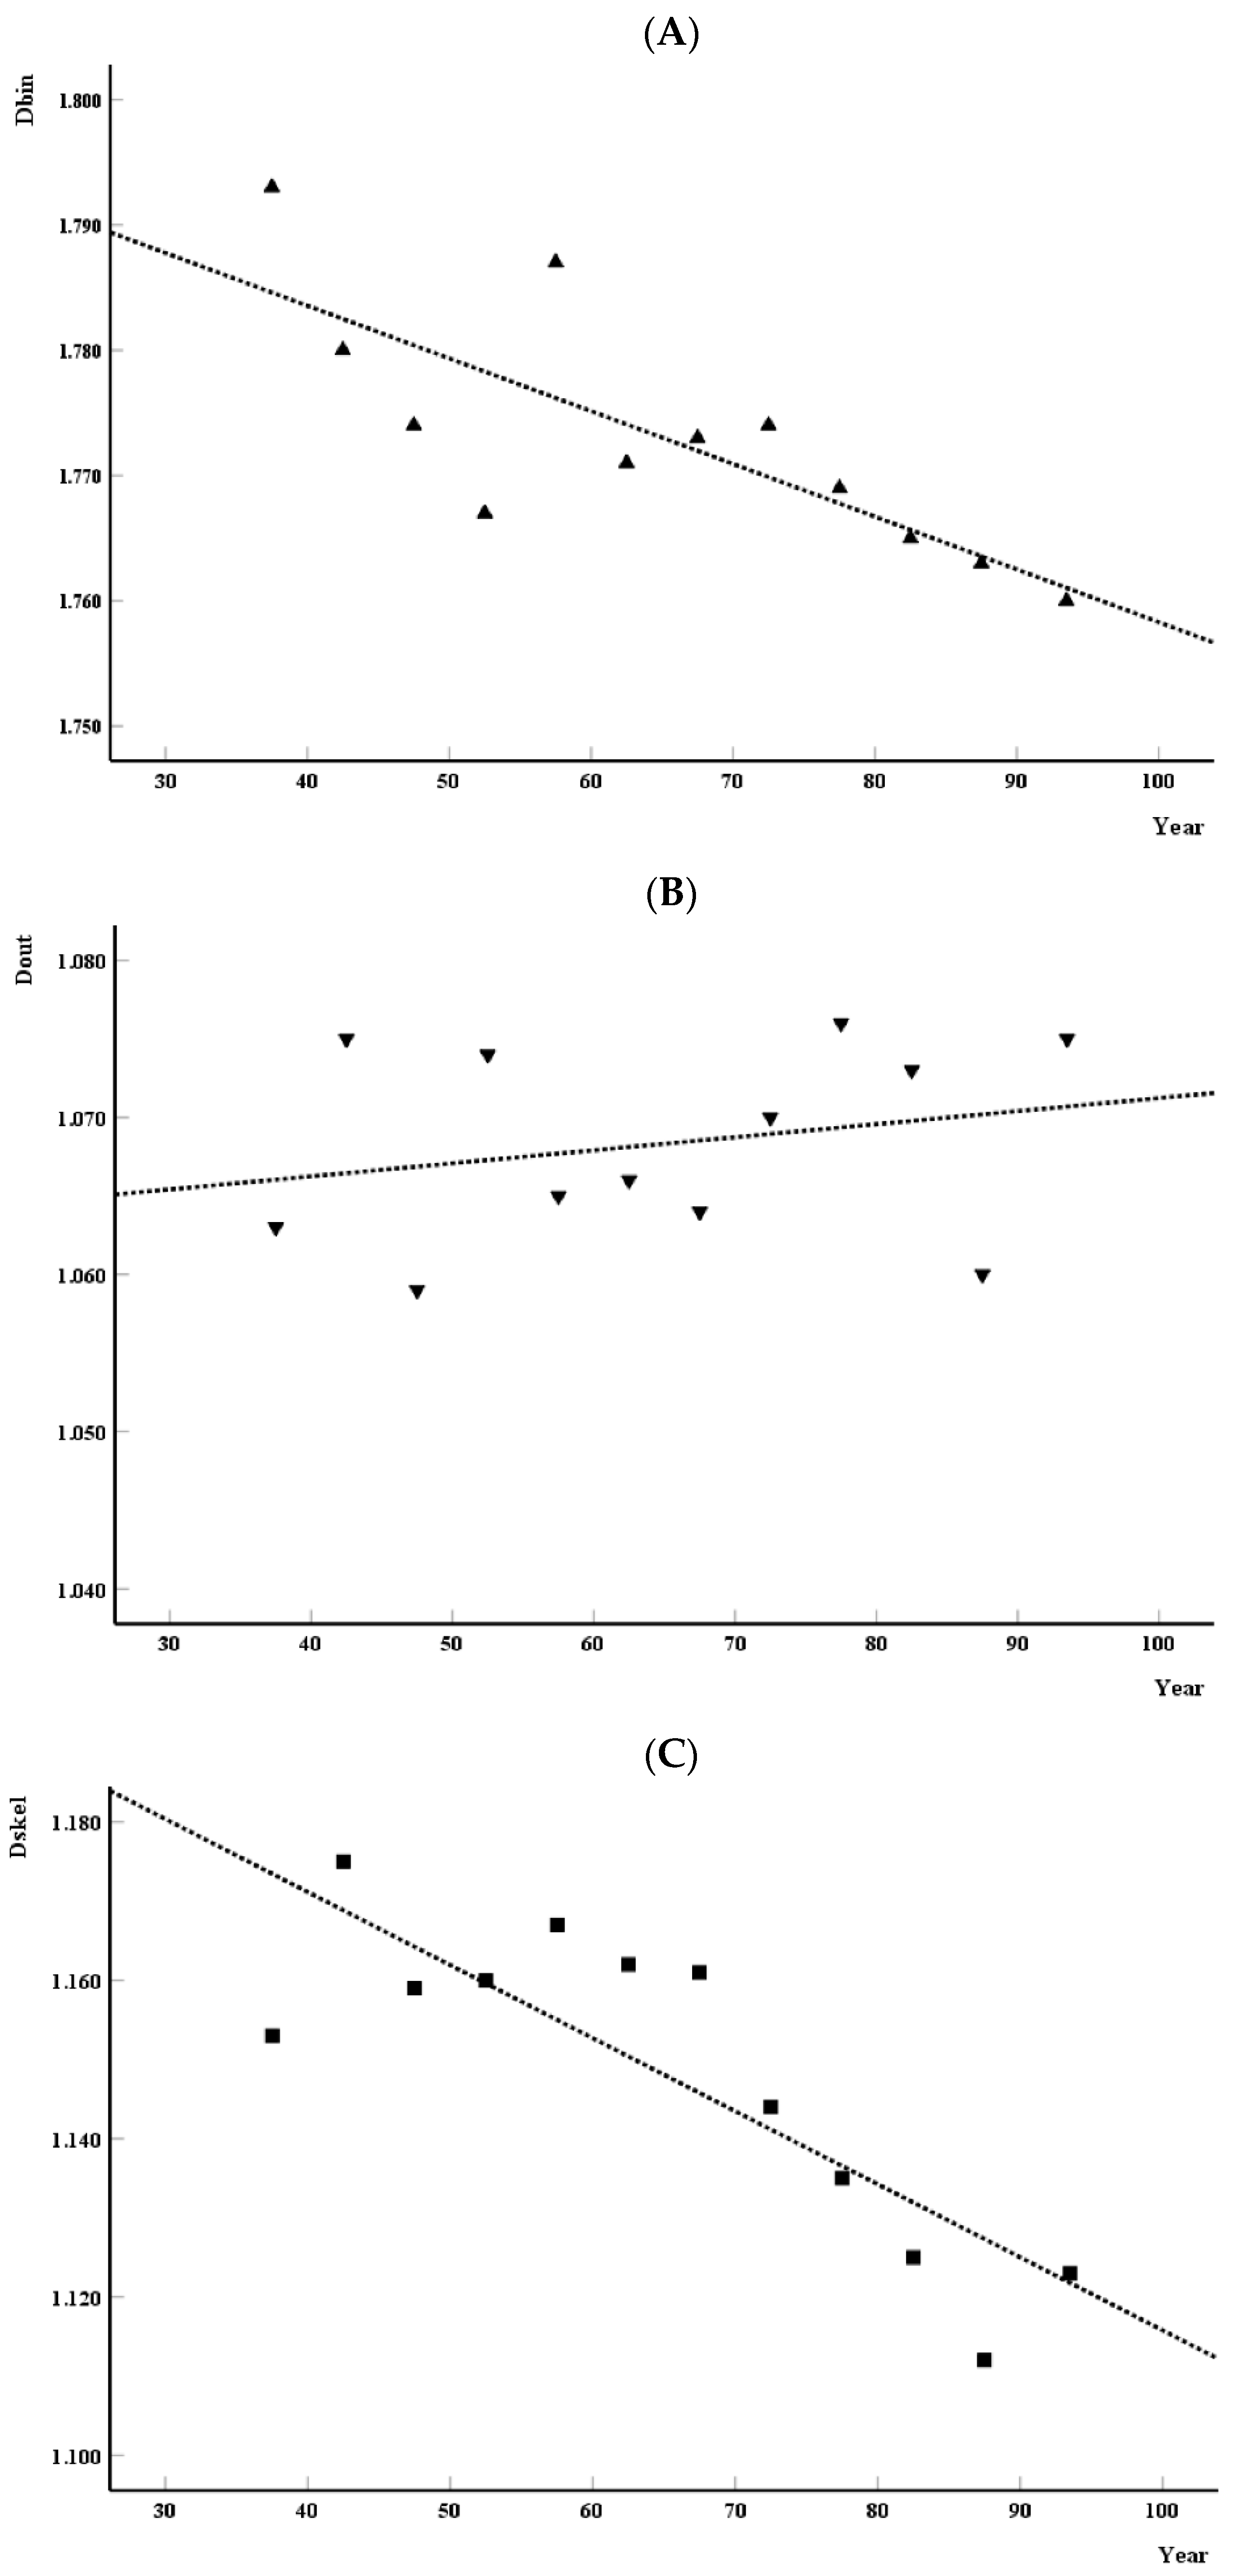
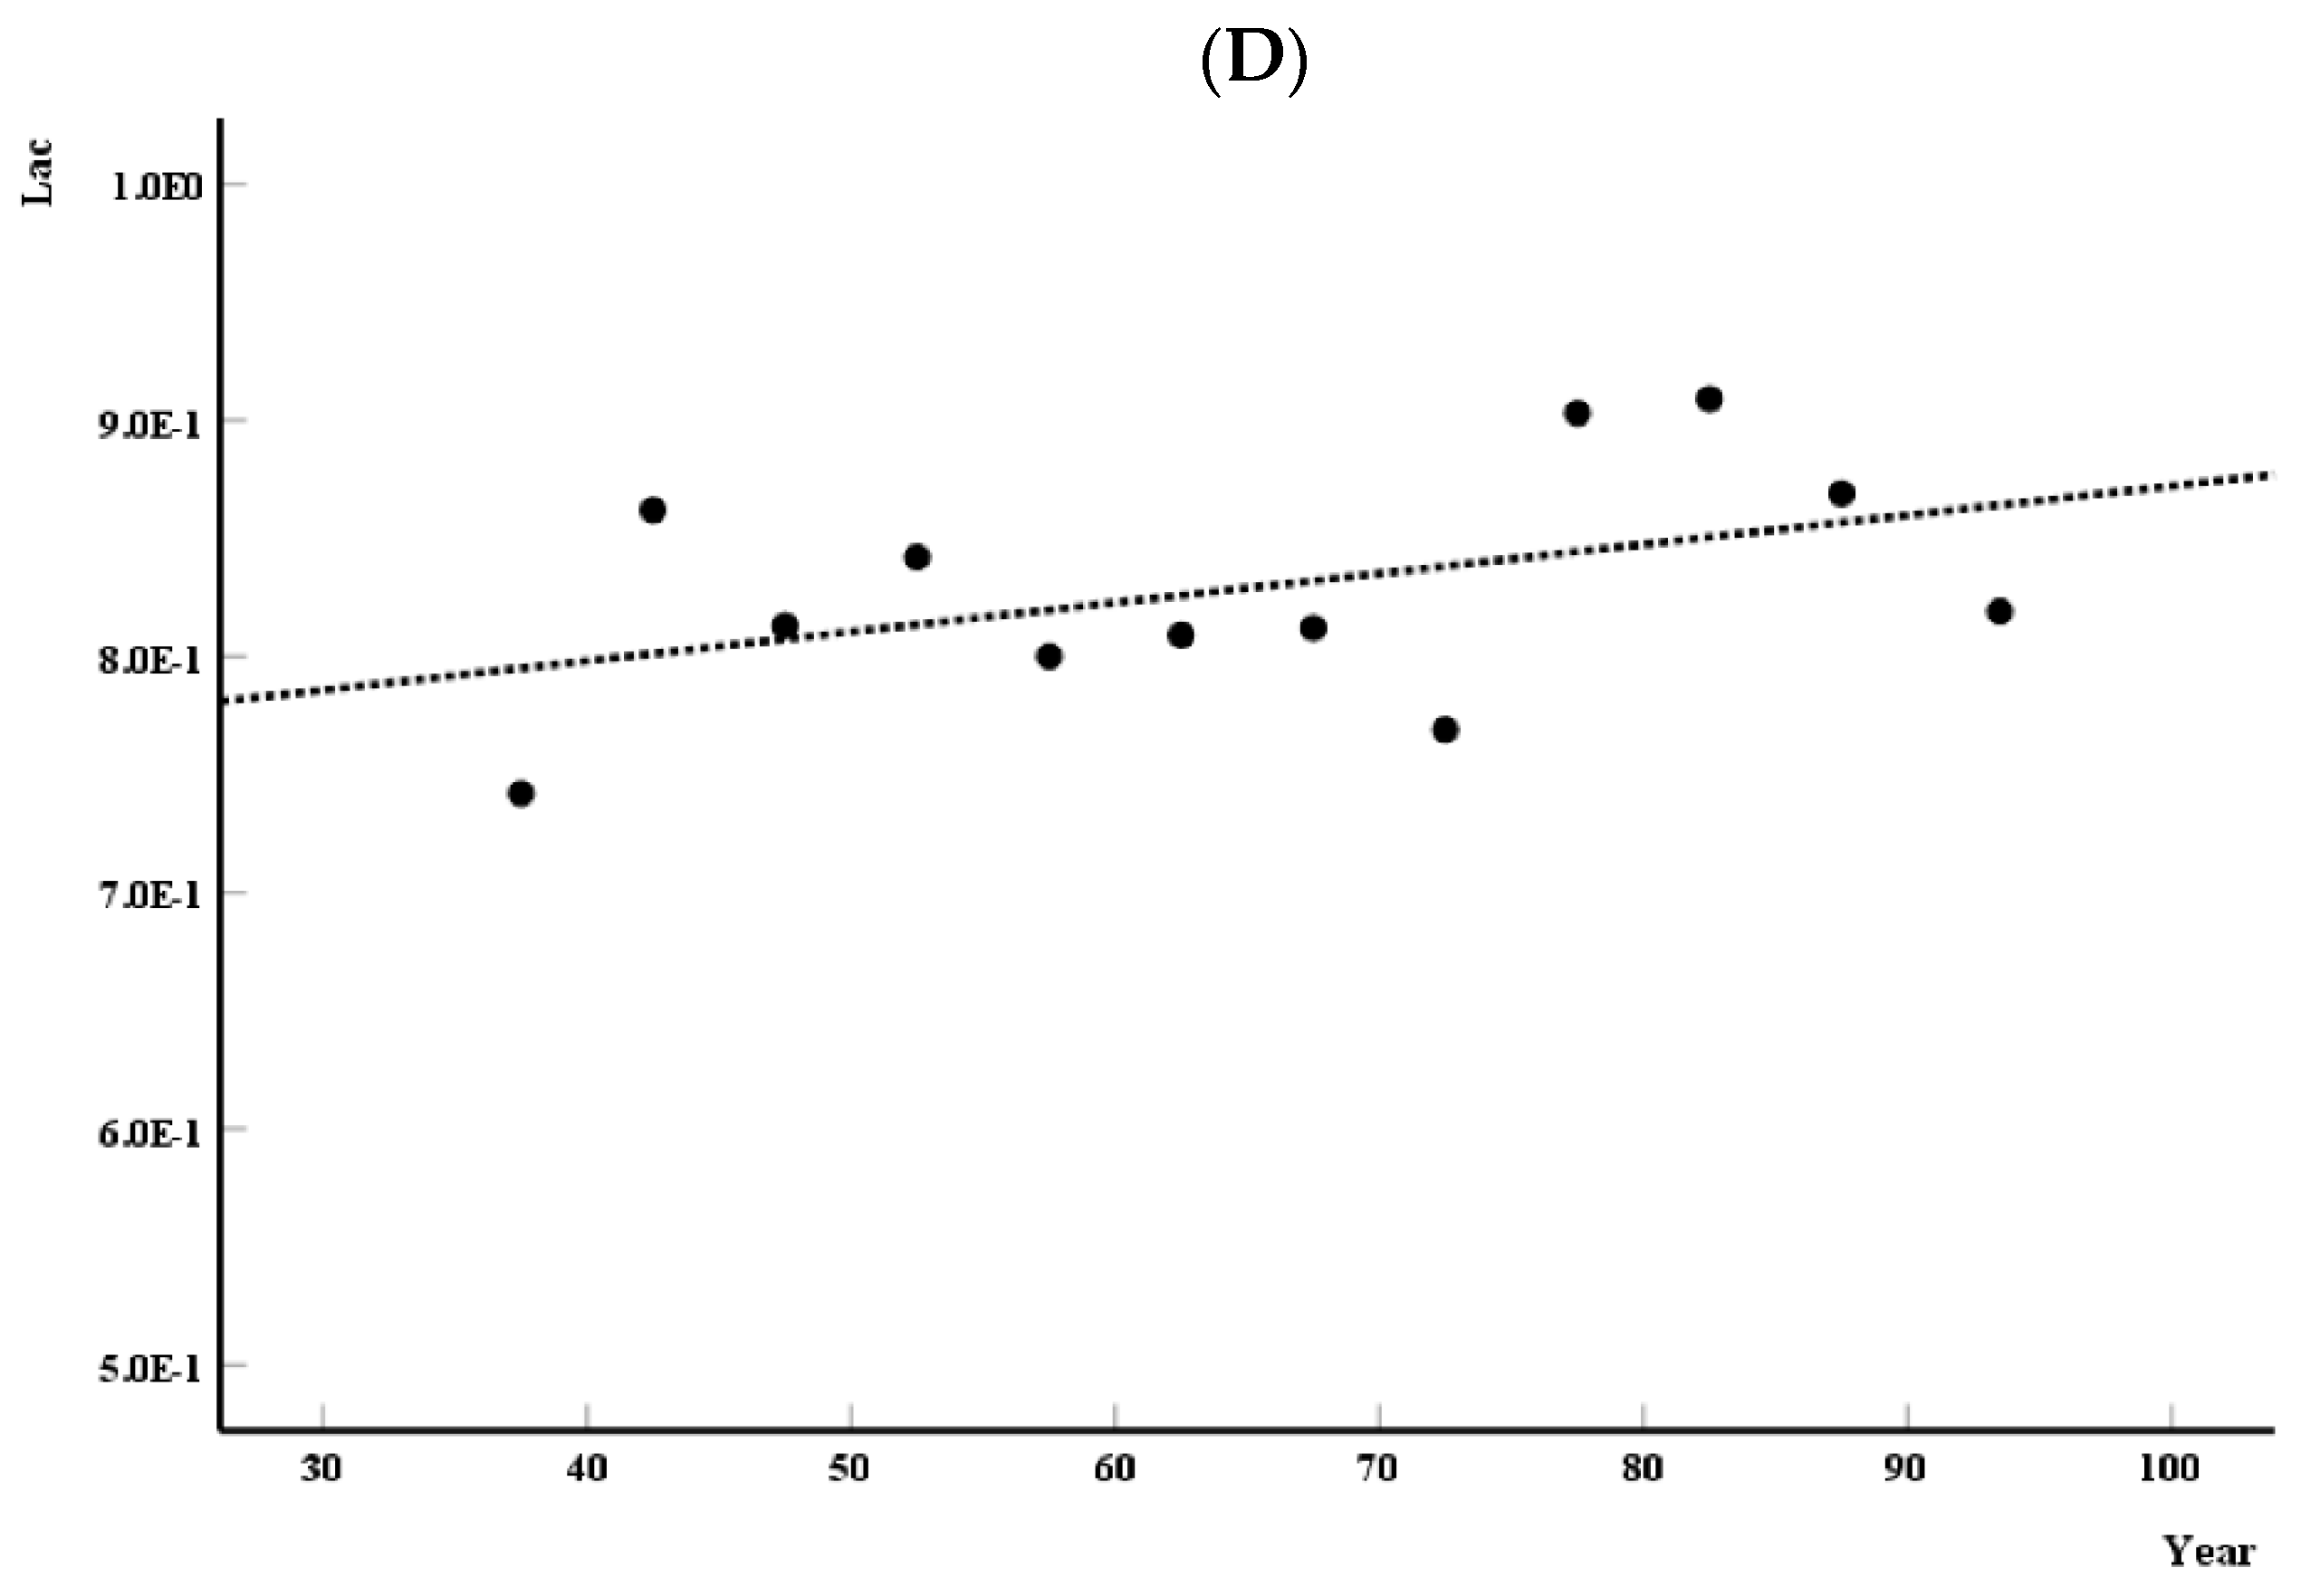
3.2. Analysis of the Distribution of Monofractal Parameters over the Years

This part of the research examined the change in monofractal parameters with age on the sample of 139 cells. Considering that only one type of multipolar neuron of the PON was used in the research, the character of the distribution of the parameters in the sample was first investigated. The coefficient of variation (CV), skewness (m3), and kurtosis (m4) were calculated for each parameter (Table 2). As the number of examined cells (more than 100), the distribution was checked by the Shapiro–Wilk test (p). Looking at all criteria, only the distribution of monofractal dimensions has the form of a normal distribution. On the other hand, the Λ does not satisfy the Shapiro–Wilk test criterion. Therefore, in further work, monofractal dependence on age was checked with the Pearson correlation coefficient, while the Spearman coefficient was used for the Λ.
The analysis began by dividing the age interval into 12 equidistant intervals and calculating the mean value of the parameter in each interval. After the distribution was plotted, it was fitted with a straight line. Then, the evaluation was performed by calculating the appropriate correlation coefficient. Figure 2 shows the age distribution of Dbin (Figure 2A), Dout (Figure 2B), Dskel (Figure 2C), and Λ (Figure 2D). Each part of the figure shows either Pearson’s (Figure 2A–C) or Spearman’s (Figure 2D) correlation coefficients and a statistical evaluation of fit quality. The vertical lines illustrate previously defined [8] age intervals. The results showed that Dbin and Dskel decrease with age, while Dout and Λ increase. The statistical evaluation of the correlation coefficient Dbin and Dskel showed a significant decrease in value with age (p = 0.002 and p = 0.001, respectively). On the other hand, Pearson’s and Spearman’s coefficient values for Dout and Λ still showed no significant growth with age (p = 0.447 and p = 0.132, respectively).

3.3. Examining the Characteristics of the Image between Age Groups

The examined sample was previously classified into three age groups [8]: (a) the second maturation group (46 cells), (b) the first group of aging (44 cells), and (c) the second group of aging (49 cells). Table 3 shows all groups’ statistical parameters (mean, standard deviation, and standard error) of the four monofractal parameters (Dbin, Dout, Dsle; and Λ). The standard deviation values are shown to show the parameters’ variability in the groups. Values of two parameters (Dbin and Dskel) decrease with age. On the other hand, two parameters (Dout and Λ) have the highest values in the third age group, while the lowest values are in the second. The statistical analysis showed that the third group showed significant differences only in two parameters (Dskel and Λ). Namely, for Dskel, high significance (p < 0.001) was found between all pairs, while for Λ, a standard difference (p < 0.05) was seen between the second and third groups.

4. Discussion

The main aim of this study is to examine the morphology of human brain neuron images over the years. For this purpose, a sample of neurons of the human PON was used, more precisely, multipolar neurons of medium size [9]. Morphology is quantified by monofractal analysis, which defines an image by a single value of the fractal dimension [18]. Across three versions of a neuronal image, this parameter quantified four features of neuronal image: size, shape, complexity, and homogeneity [25].
The first part of the research examines the relationship between the image’s monofractal and standard computational parameters (Section 3.1). The parameters that quantify only three features of the image were investigated. To my knowledge, the computational parameter quantifies the neuron image’s homogeneity was not reported. The correlation was checked using the neuron’s area, the neuronal field’s perimeter [1,7,8], and the number of dendrite intersections. Previous publications have demonstrated the use of these parameters in quantifying the imaging properties of neurons [1,7,16]. The results unequivocally show that monofractal parameters can quantify the three image properties (Table 1). Of them, only the shape of the neural field is better represented by the computational parameter [9].
However, this study is the first to examine the relationship between the perimeter and the monofractal dimension of a neural field boundary. In addition, the monofractal dimension of the skeletonized image was also firstly investigated. The results confirm the findings of previous studies [18,19,21,26]. Regarding the size of the neurons, the results confirm previous studies in monkeys [2,19,26,27,28,29], dentate nucleus [7], neostriatum [1,16], and retinal images [19,21,28,29]. Nevertheless, quantifying the neurons’ image indicates indirect confirmation of how fractal dimension can describe the three image properties [18,21,30].
The second part of the study analyzed the distribution of monofractal parameters with age. This part is the central part of this research because, for the first time, the distribution of the four features of the image of neurons was quantified with monofractal parameters. The results showed that only two image properties (size and complexity) decrease as age increases. Although the other two properties appear to increase with age, the statistical analysis clearly shows that there is no change with age. These results represent both an improvement on previously published and a novelty [25]. Namely, previous publications either only analyzed the distribution of computational parameters over the years [8] or examined the difference between monofractal parameters between predefined age groups [9]. In both cases, the study looked at all the multipolar neurons in the human PON.
The third part of the study examined the difference between the three age groups of multipolar neurons in the human PON. These groups were determined according to previous suggestions [8]. It seems like a repeat of previously published results [9]. Nevertheless, a smaller sample of neurons was used here, and two new monofractal parameters (Dbin and Λ). The results show that only two characteristics (complexity and homogeneity) differ between groups. The complexity of the third age group is significantly different from the others; in contrast, the homogeneity only differs from the second (Table 3). In the end, this study is a confirmation of the previous results [18,26,28,31] and an improvement of the last ones [9,15].

5. Conclusions

According to the author’s knowledge, this is the first study to show an image quantified by only one value of the fractal dimension. The author proposes the monofractal name for this way of using fractal analysis. Additionally, for the first time, the properties of neurons from all levels of maturation and aging were investigated. Further research will examine the ability of monofractal analysis of neuronal images on different materials.

Funding

This research received no external funding.

Institutional Review Board Statement

The study was conducted in accordance with the Declaration of Helsinki, and approved by the Ethics Committee of University of Novi Sad, Serbia (01-3367/1, 17 December 2015).

Informed Consent Statement

The brain samples were from cadavers and belonged to the histological collection of the Department of Anatomy at the University of Novi Sad, Serbia.

Data Availability Statement

Not applicable.

Acknowledgments

The Laboratory of Neuroanatomy (Faculty of Medicine, University of Novi Sad, Serbia) and Laboratory of Image analysis in Medicine (Faculty of Medicine, University of Belgrade, Serbia) supported this work. Assistance with all question/problems/ideas and solutions concerning fractal analysis by collaborators from Laboratory of Image analysis in Medicine is gratefully acknowledged.

Conflicts of Interest

The author declares no conflict of interest.

References

  1. Krstonošiċ, B. Morphological Analysis of Two Dimensional Projection of Neurons in the Human Neostriatum. Ph.D. Thesis, University of Novi Sad, Novi Sad, Serbia, 2013. [Google Scholar]
  2. Schierwagen, A.; Costa, L.F.; Alpar, A.; Gärtner, U.; Arendt, T. Neuromorphological phenotyping in transgenic mice: A multiscale fractal analysis, Volume II. In Mathematical Modeling of Biological Systems; Deutsch, A., de la Parra, R.B., De Boer, R.J., Diekmann, O., Jagers, P., Kisdi, E., Kretzschmar, M., Lansky, P., Meta, H., Eds.; Birkhäuser: Boston, MA, USA, 2008; pp. 185–192. [Google Scholar]
  3. Mason, A. Larkman, Correlations between morphology and electrophysiology of pyramidal neurons in slices of rat visual cortex. II. Electrophysiology. J. Neurosci. 1990, 10, 1415–1428. [Google Scholar] [CrossRef] [PubMed] [Green Version]
  4. Herculano-Houzel, S. The glia/neuron ratio: How it varies uniformly across brain structures and species and what that means for brain physiology and evolution. Glia 2014, 62, 1377–1391. [Google Scholar] [CrossRef]
  5. Ausim Azizi, S. And the olive said to the cerebellum: Organization and functional significance of the olivo-cerebellar system. Neuroscientist 2007, 13, 616–625. [Google Scholar] [CrossRef] [PubMed]
  6. Bozhilova-Pastirova, A.; Ovtscharoff, W. The Inferior Olivary Complex; Advances in Anatomy, Embryology and Cell Biology; Springer: Berlin/Heidelberg, Germany, 2000; Volume 155, pp. 3–84. [Google Scholar] [CrossRef]
  7. Marić, D. Qualitative and Quantitative Analysis of Adult Human Dentate Nucleus Neurons Morphology. Ph.D. Thesis, University of Novi Sad, Novi Sad, Serbia, 2010. [Google Scholar]
  8. Radošević, D. A Morphological Analysis of the Neuronal and Glial Cells in the Human Principal Olivary Nucleus. Ph.D. Dissertation, University of Novi Sad, Novi Sad, Serbia, 2019. [Google Scholar]
  9. Stojić, D.; Radošević, D.; Rajković, N.; Marić, D.L.; Milošević, N.T. Classification by morphology of multipolar neurons of the human principal olivary nucleus. Neurosci. Res. 2021, 170, 66–75. [Google Scholar] [CrossRef] [PubMed]
  10. Levine, M.E.; Lu, A.T.; Quach, A.; Chen, B.H.; Assimes, T.L.; Bandinelli, S.; Hou, L.; Baccarelli, A.A.; Stewart, J.D.; Li, Y.; et al. An Epigenetic Biomarker of Aging for Lifespan and Healthspan. Aging 2018, 10, 573–591. [Google Scholar] [CrossRef] [PubMed] [Green Version]
  11. Ely, J.T.; Krone, C.A. Aging: Predictions of a New Perspective on Old Data. Exp. Biol. Med. 2002, 227, 939–942. [Google Scholar] [CrossRef] [PubMed]
  12. Sultan, F.; Glickstein, M. The cerebellum: Comparative and animal studies. Cerebellum 2007, 6, 168–176. [Google Scholar] [CrossRef] [PubMed]
  13. Duan, H.; Wearne, S.L.; Rocher, A.B.; Macedo, A.; Morrison, J.H.; Hof, P.R. Age-related dendritic and spine changes in corticocortically projecting neurons in macaque monkeys. Cereb. Cortex 2003, 13, 950–961. [Google Scholar] [CrossRef] [PubMed]
  14. Renehan, W.E.; Jin, Z.; Zhang, X.; Schweitzer, L. Structure and function of gustatory neurons in the nucleus of the solitary tract. I. A classification of neurons based on morphological features. J. Comp. Neurol. 1994, 347, 531–544. [Google Scholar] [CrossRef] [PubMed]
  15. Stojić, D.; Radošević, D.; Rajković, N.; Milošević, N.T. 2D Images of astrocytes in the human principal olivary nucleus: Monofractal analysis of the morphology. J. Biosci. Med. 2021, 9, 38–48. [Google Scholar] [CrossRef]
  16. Krstonošić, B.; Milošević, N.T.; Gudović, R.; Marić, D.L.; Ristanović, D. Neuronal images of the putamen in the adult human neostriatum: A revised classification supported by a qualitative and quantitative analysis. Anat. Sci. Int. 2012, 87, 115–125. [Google Scholar] [CrossRef] [PubMed]
  17. Karperien, A.; Jelinek, H.F. ImageJ in Computational Fractal-Based Neuroscience: Pattern Extraction and Translation Research. In The Fractal Geometry of the Brain; Di Ieva, A., Ed.; Springer: New York, NY, USA, 2016; pp. 503–522. [Google Scholar]
  18. Milošević, N.T. The Morphology of Brain Neurons: Box Counting Method in Quantitative Analysis of 2D Image. In The Fractal Geometry of the Brain; Di Ieva, A., Ed.; Springer: New York, NY, USA, 2016; pp. 109–126. [Google Scholar]
  19. Kesić, S.; Spasić, S.Z. Application of Higuchi’s fractal dimension from basic to clinical neurophysiology: A review. Comput. Methods Programs Biomed. 2016, 133, 55–70. [Google Scholar] [CrossRef] [PubMed]
  20. Jelinek, H.F.; Elston, G.N.; Zietsch, B. Fractal analysis: Pitfalls and revelations in neuroscience. In Fractals in Biology and Medicine IV; Losa, G.A., Merlini, D., Nonnenmacher, T.F., Weibel, E.R., Eds.; Birkhäuser: Basel, Switzerland, 2005; pp. 85–94. [Google Scholar]
  21. Fernandez, E.; Jelinek, H.F. Use of fractal theory in neuroscience: Methods, advantages, and potential problems. Methods 2001, 24, 309–321. [Google Scholar] [CrossRef] [PubMed]
  22. Ristanović, D.; Milošević, N.T.; Štulić, V. Application of modified Sholl analysis to neuronal dendritic arborization of the cat spinal cord. J. Neurosci. Methods 2006, 158, 212–218. [Google Scholar]
  23. Karperien, A. FracLac for ImageJ. Version 2.0. 2007. Available online: https://imagej.nih.gov/ij/plugins/fraclac/fraclac-manual.pdf (accessed on 10 May 2022).
  24. Riffenburgh, R.H. Statistics in Medicine; Academic Press: London, UK, 1999. [Google Scholar]
  25. Vranes, V.; Milošević, N.T. Monofractal analysis of digital images of the human dentate nucleus: Correlation, classification and morphometric analysis. In Proceeding of Arithmetic Methods in Mathematical Physics and Biology; Banaszak, G., Milewski, J., Waliszewski, P., Eds.; University of Poznan: Bedlewo, Poland, 2018; p. 14.10. [Google Scholar]
  26. Favela, L.H.; Coey, C.A.; Griff, E.R.; Richardson, M.J. Fractal analysis reveals subclasses of neurons and suggests an explanation of their spontaneous activity. Neurosci. Lett. 2016, 626, 54–58. [Google Scholar] [CrossRef] [PubMed]
  27. Rowland, C.; Harland, B.; Smith, J.H.; Moslehi, S.; Dalrymple-Alford, J.; Taylor, R.P. Investigating Fractal Analysis as a Diagnostic Tool That Probes the Connectivity of Hippocampal Neurons. Front. Physiol. 2022, 23, 932598. [Google Scholar] [CrossRef] [PubMed]
  28. Di Ieva, A.; Grizzi, F.; Jelinek, H.F.; Pellionisz, A.J.; Losa, G.A. Fractals in the neurosciences, part I: General principles and basic neurosciences. Neuroscientist 2014, 20, 403–417. [Google Scholar] [CrossRef] [PubMed]
  29. Losa, G.A.; Di Ieva, A.; Grizzi, F.; De Vico, G. On the fractal nature of nervous cell system. Front. Neuroanat. 2011, 5, 45. [Google Scholar] [CrossRef] [Green Version]
  30. Cornforth, D.; Jelinek, H.F. Monofractal and multifractal analysis for interpretation of function-structure relationships in finite size biological material. In Classification and Application of Fractals; Mitchell, E.W., Murray, E.R., Eds.; Nova Science Publishers: New York, NY, USA, 2011; pp. 1–22. [Google Scholar]
  31. Puškaš, N.; Zaletel, I.; Stefanović, B.D.; Ristanović, D. Fractal dimension of apical dendritic arborization differs in the superficial and the deep pyramidal neurons of the rat cerebral neocortex. Neurosci. Lett. 2015, 589, 88–91. [Google Scholar] [CrossRef] [PubMed]
Figure 1. (A) A multipolar neuron in gray-scale with a delineated body and a dendrite line of the same (B) A gray-scale multipolar neuron converted into a binary image whose body is filled with black pixels. Symbols A, Nm, and Λ indicate the parameters to be calculated. (C) A binary-outline image constructed around the ends of the dendrites that define the neural field. The symbols Pnf and Dout are the parameters that quantify the neuronal field. (D) A binary-skeletonized dendritic image of a binary image from which a body has been removed. Dendrites are displayed with a single-wide pixel line, and the Dskel represents a parameter that quantifies this image.
Fractalfract 06 00408 g001
Figure 2. (AD): Distribution of four image properties (Dbin, Dout, Dskel and Lac) with age.
Fractalfract 06 00408 g002aFractalfract 06 00408 g002b
Table 1. Mean values of computational (As, Pnf and Nm) and monfractal (Dbin, Dout and Dskel) parameters in 12 intervals. The symbol N shows the number of images in each interval. In contrast, signs R and p show the Spearman correlation coefficients and significance level, respectively.
SizeShapeComplexity
NAs (pix2)DbinNPnf (pix)DoutNNmDskel
5154081.737111841.09426.51.137
13160461.747614871.06887.61.113
12167321.7631816771.060128.51.113
13173611.7652118911.062259.51.137
14181201.7622721201.0702010.61.149
14188851.7672222791.0752111.51.149
15195351.7781724941.0742312.41.155
14203141.772927051.0681313.41.166
14209681.787829051.070814.41.173
11217051.787530931.058315.31.154
7223001.794332981.064317.31.218
7229841.803236211.088118.21.250
R0.604 0.173 0.423
p<0.001 0.041 <0.001
The table for the two-tailed t-test mark significance levels.
Table 2. The coefficient of variation (CV), skewness (m3), kurtosis (m4), and p-value of the Shapiro-Wilk test of four parameters (Dbin, Dout, Dskel and Λ) were calculated for the present sample. Parameters were normally distributed if CV < 50%, m3, m4 ∈ (−1, 1) and p > 0.05.
ParametersCV (%)m3m4p
Dbin1.410.4290.7970.062
Dout1.50−0.097−0.4320.482
Dskel3.75−0.1990.0140.737
Λ15.88−0.1620.4710.027
Table 3. Mean values, standard deviation (SD) and standard errors (SE) of four monofractal parameters (Dbin, Dout, Dskel and Λ) in three age groups of multipolar neurons in the human PON. The symbol * indicates the statistical significance between the groups.
DbinDoutDskelΛ
Group 1 (46 cells)
Mean1.7751.0681.1620.82
SD0.0260.0160.0400.10
SE0.0040.0020.0060.01
Group 2 (44 cells)
Mean1.7741.0671.1570.79
SD0.0250.0170.0400.13
SE0.0040.0020.0060.02
Group 3 (49 cells)
Mean1.7661.0701.1260.88
SD0.0230.0160.0410.15
SE0.0030.0020.0060.02
Difference//*** 1–3; ** 2–3* 2–3
*—p = 0.05, **—p = 0.01 and ***—p = 0.001.
Publisher’s Note: MDPI stays neutral with regard to jurisdictional claims in published maps and institutional affiliations.

