Article

Volume of Interest-Based Fractal Analysis of Huffaz’s Brain

by
Iqbal Jamaludin
1,
Mohd Zulfaezal Che Azemin
2,*,
Mohd Izzuddin Mohd Tamrin
3 and
Abdul Halim Sapuan
1
1
Department of Diagnostic Imaging and Radiotherapy, Kulliyyah of Allied Health Sciences, International Islamic University Malaysia, Kuantan 25200, Malaysia
2
Department of Optometry and Visual Science, Kulliyyah of Allied Health Sciences, International Islamic University Malaysia, Kuantan 25200, Malaysia
3
Department of Information System, Kulliyyah of Information and Communication Technology, International Islamic University Malaysia, Kuala Lumpur 53100, Malaysia
*
Author to whom correspondence should be addressed.
Fractal Fract. 2022, 6(7), 396; https://doi.org/10.3390/fractalfract6070396
Submission received: 7 June 2022 / Revised: 13 July 2022 / Accepted: 17 July 2022 / Published: 19 July 2022
(This article belongs to the Special Issue Methods for Estimation of Fractal Dimension Based on Digital Images)

Abstract

:
The robust process in memorising the Quran is expected to cause neuroplasticity changes in the brain. To date, the analysis of neuroplasticity is limited in binary images because greyscale analysis requires the usage of more robust processing techniques. This research work aims to explore and characterise the complexity of textual memorisation brain structures using fractal analysis between huffaz and non-huffaz applying global box-counting, global Fourier fractal dimension (FFD), and volume of interest (VOI)-based analysis. The study recruited 47 participants from IIUM Kuantan Campus. The huffaz group had their 18 months of systematic memorisation training. The brain images were acquired by using MRI. Global box-counting and FFD analysis were conducted on the brain. Magnetic resonance imaging (MRI) found no significant statistical difference between brains of huffaz and non-huffaz. VOI-based analysis found nine significant areas: two for box-counting analysis (angular gyrus and medial temporal gyrus), six for FFD analysis (BA20, BA30, anterior cingulate, fusiform gyrus, inferior temporal gyrus, and frontal lobe), and only a single area (BA33) showed significant volume differences between huffaz and non-huffaz. The results have highlighted the sensitivity of VOI-based analysis because of its local nature, as compared to the global analysis by box-counting and FFD.

1. Introduction

Advanced medical imaging modalities such as magnetic resonance imaging (MRI), computerised tomography (CT), and positron emission tomography (PET) have shown to be the heart of radiological services, providing better radiological images that not only help radiologists diagnose disease better, but also estimate the manifestation of the pathology at an earlier stage. However, due to the total reliance for visual diagnosis of the radiological images by the radiologists, the time taken for the diagnosis to be made may be compromised, leading to longer decision management for the patient. The timing for diagnosis can be further reduced with the usage of voxel-based morphometry (VBM) and fractal analysis (FA) [1]. This software will help radiologists to make a diagnosis decision based on the algorithm setting depending on the pixels and voxels appearance on the radiological images, reducing their time for visual and manual diagnosis of the images.
FA has been widely applied in clinical fields [2]. FA demonstrates the ability to estimate the complexity dynamics which include changes in the biological structure [3,4,5,6]. Applications of FA include anatomical, histological, and structural imaging (i.e., MRI) [7]. Apart from disease detection and measuring the aging effect, FA is also capable of estimating the topological complexity of an object [8].
The role of FA in clinical application has caught the attention of several researchers in recent years. Albeit with the presence of applications in clinical and medical fields, there is still a lack of discussion and new information regarding the effectiveness of FA in analysing textual memorisation brain structures of huffaz. To date, the application of FA in textual memorisation has still not been extensively investigated.
The aim of this research was to demonstrate the capability of binary and greyscale fractal analysis to identify and locate the possible brain areas that underwent neuroplasticity changes due to the memorisation process.

2. Literature Review

2.1. Text Memorisation

Huffaz, the plural word of hafiz, is the term used for a Muslim who memorise all the 30 chapters in the Quran. During the golden age of the Muslim world, many Muslim scholars memorised the Quran before venturing into science and technology such as medicine, surgery, optics, mathematics, and science [9].
The process of memorising the Quran is strenuous to the brain as continuous repetition is needed to ensure the verses will be stored permanently in the brain. Memorising the Quran is hard, but the review of the memorised verses will be harder. In the process of adding new verses, the huffaz must make sure that the verses they have memorised earlier will be stored permanently by constantly reviewing the memorised verses at the same time as adding the new verses of the Quran [9]. Hence, the effect of memorising the Quran on brain structures is estimated, as the countless repetition and reviewing of verses can stimulate neuroplasticity in the brain region.
As strenuous as it may be, the countless repetition of the Quran is expected to cause brain structural changes and neuroplasticity to the brain. The continuous repetition of Quranic verses may involve more than one faculty of the brain, as huffaz are required to read, visualize, and repeat their memorisation in front of their teacher. This event may lead to multiple structures and regions activation within the brain, causing permanent changes to the brain cortex and its capacity.
In one study [10], 19 huffaz were recruited to investigate the relationship between structural change in the brain and text memorization. It was found that the huffaz group had larger total grey and white matter volumes than the controls. The participants comprised adults with a diverse age range of 35 to 80 years old, and all participants in the huffaz group were males.
Similarly, a VBM analysis was conducted on 21 professionally qualified pandits who memorised at least ~40,000 words of Hindu text and 21 controls from a technical college to match the pandit participants in gender, age, and the number of languages spoken [11]. Both studies [10,11] did not match the text memorisers in terms of educational background and fractal measurement was not implemented in the analysis.

2.2. Brain and Neuroplasticity

Cognitive training, learning new skills, learning new languages, spatial memory, and memorizing the scriptures have proved to reverse or slow down the process [12,13]. The faster the decline of cortical structures occurs, the higher the prevalence of dementia.
Since the usage of fractal analysis is still not common compared to VBM, it is of great interest for researchers to employ this technique for the analysis of textual memorisation of brain structures. Most previous studies emphasize the effect of training on working memory, undermining the possible factors associated by textual memorisation on the development of neuroplasticity in the brain.

2.3. Fractal Analysis

Previous research defined the fractal as a complement for Euclidean dimension in the case of irregular objects that possess self-similar characteristics [14]. They further concluded that fractals have a fractional dimension, which measures their structural complexity. Their idea was supported by [15], who summed up that the fractal dimension (FD) enables the fractal analysis to take place for fractal geometry.
The practical applications of fractal analysis can be seen in natural phenomena such as measuring the British coast (origin of fractal application), rocks [16], soil [17], and in the biological field [18]. Due to its ability in quantifying complex compositions, fractal analysis has been applied in measuring the geometric complexity of brain structures [2,8,14]. The usage of fractal analysis has made the monitoring of pathological progression in the brain to be more accurate as a complementary technique apart from the standard radiological examination using MRI images [2,4,14].

2.4. Application of Fractal Analysis in Neuroscience

Most of the studies conducted previously were concerned about the relationship between fractal dimension value and disease progression especially in the brain, mainly acute stroke [19], schizophrenia [5], and multiple sclerosis [7]. Apart for disease detection and measuring the aging effect, fractal analysis is also capable of estimating the topological complexity of an object. It leads to fractal analysis being proposed as an indicator for the magnitude of brain alteration in psychological and neurological disturbances [2,20].
Fractal analysis has also proven to be more accurate in giving detailed information compared to other voxel-wise measurement methods for the measurement of white matter changes in several pathologies [20]. On the other hand, the effectiveness and sensitivity of fractal dimension has also been used for brain development and any association of brain changes in relation to a person’s age.

3. Methodology

3.1. Demographic Data and Subjects Characteristics

A total of 47 participants aged between 20 to 25 years (mean ± SD age, 22.55 ± 1.472 years) were enrolled into the study following an MRI screening process. The recruitment was made through the usage of social media advertisements such as Facebook and the WhatsApp application. The number of participants recruited for huffaz was 23 and non-huffaz was 24, and met the required sample size to be analysed statistically.
All huffaz and non-huffaz were undergoing tertiary education for an undergraduate science-based bachelor’s degree program at IIUM Kuantan Campus. The huffaz group was recruited from students who graduated from Tahfiz Certificate Program Darul Quran-IIUM, where they spent one and half years (approximately 18 months) after finishing their secondary education (Sijil Pelajaran Malaysia level) memorising the Quran. All the volunteers were aware about the objectives of the research.
Specific inclusion criteria were required to be met for the recruitment of the huffaz and non-huffaz groups. Among the inclusion criteria for both groups were strongly right-handed orientation and no reported head trauma, systemic, psychiatric, neurologic, and endocrine disorders. They also needed to be free from any metallic implant within their body and not claustrophobic (phobia relating to a fear of small and confined spaces). A consent form in accordance with the Declaration of Helsinki [21] was obtained from the subjects after a deliberate explanation about the research was given to the subjects. There were two sites where the study took place. All the scanning of a volunteer’s brain by MRI were conducted at the Department of Radiology, IIUM Medical Centre, Kuantan, Pahang. Upon completion of the scanning process, the pre-processing and analysis of the images were conducted at the Kulliyyah of Allied Health Sciences, IIUM Kuantan Campus.

3.2. Ethical Approval

The research obtained two ethical clearance which followed the tenets of the Declaration of Helsinki. The first ethical approval was at the kulliyyah (faculty) level, known as Kulliyyah Postgraduate and Research Committee (KPGRC), Kulliyyah of Allied Health Sciences (Ethical Approval Reference: KAHS 2016/05/07, IIUM/310/G/13/4/4-199, approved on 30 May 2016). Upon approval from the kulliyyah, the university-level ethical approval known as IIUM Research Ethical Committee (IREC) was sought after. The ethical approval reference is IREC: IIUM/504/14/11/3/IREC 654, approved on 1 September 2016.

3.3. MRI Imaging Protocols

The MRI images of the brain were acquired using a high resolution 3 Tesla magnetic resonance scanner (Magnetom, Siemens, Erlangen, Germany). The standard T1-Weighted 3D-MPRAGE (3D-Magnetisation Prepared Rapid Gradient Echo) protocol pre-set within the MRI system was used to scan the brain of the huffaz and non-huffaz. The TR value used is 1880 ms and TE is 3 ms with TA of 4.23 min. The voxel size used for this protocol was 1.0 mm × 1.0 mm × 1.0 mm. The FoV in the read direction was 250 mm. The slice thickness during acquisition of the images was set at 1.0 mm with only single averaging. The conversion of image format from DICOM into NIfTI was performed with a dedicated computer for image conversion purposes.

3.4. Image Registration, Segmentation, and Normalisation

Brain images were pre-processed using VBM, one of the SPM12 pipeline applications under the MATLAB platform. MNI standards were adopted for the registration, segmentation, and normalisation processes. The unified segmentation procedure is based on a probabilistic model derived from a mixture of Gaussians [22]. The methodology has been validated extensively [23]. Figure 1 shows the slices of brain images processed by SPM12. The x-axis represents the direction of the images (from left to right), the y-axis represents the slices depth, and the z-axis represents the number of slices for the images.

3.5. Thresholding—Otsu’s Method

Thresholding in general is an image processing technique used to segment the complex greyscale images into simplified binary images, allowing easy analysis of the data on the images. It partitions the images into foreground and background pixels, with the foreground containing the information pixels and the background mostly consisting of noise [24,25,26]. Equation (1) shows the thresholding process as follow:
g ( x , y ) = 1   i f   f ( x , y ) > T g ( x , y ) = 0   i f   o t h e r w i s e
where g(x,y) is the binarised image of f(x,y).
The main reason for the thresholding application is to extract the main information against the background noise [27,28,29,30]. Thresholding in image processing is normally categorised as global and local thresholding. Global thresholding only applies a single cut-off value based on the image histogram throughout the whole images. This technique is simple, fast, requires minimal input from the operator, and functions excellently on images with uniform pixel intensity against the background noise [31] but performs poorly on images with diverse pixel values. Local thresholding, on the other hand, partitions the images in multiple regions based on their characteristics. The local threshold cut-off is determined by the individual pixels between foreground and background pixel values [27]. Due to its simple, easy, and unsupervised capacity, global thresholding has been the technique of choice for thresholding in the image binarisation process [29].
Otsu’s method was used as thresholding technique. It is a parameter-free binarisation approach is and easier to use as it only exploits the zeroth- and the first-order of the grey-level histogram [27], hence making it ideal for global thresholding of uniform pixel values images.

3.6. Box-Counting Fractal Dimension (FD)

For a set of points in a Euclidean dimension D, Hausdorff’s fractal dimension FD can be computed using the following expression:
F D = lim s 0 log N ( s ) / log ( s )
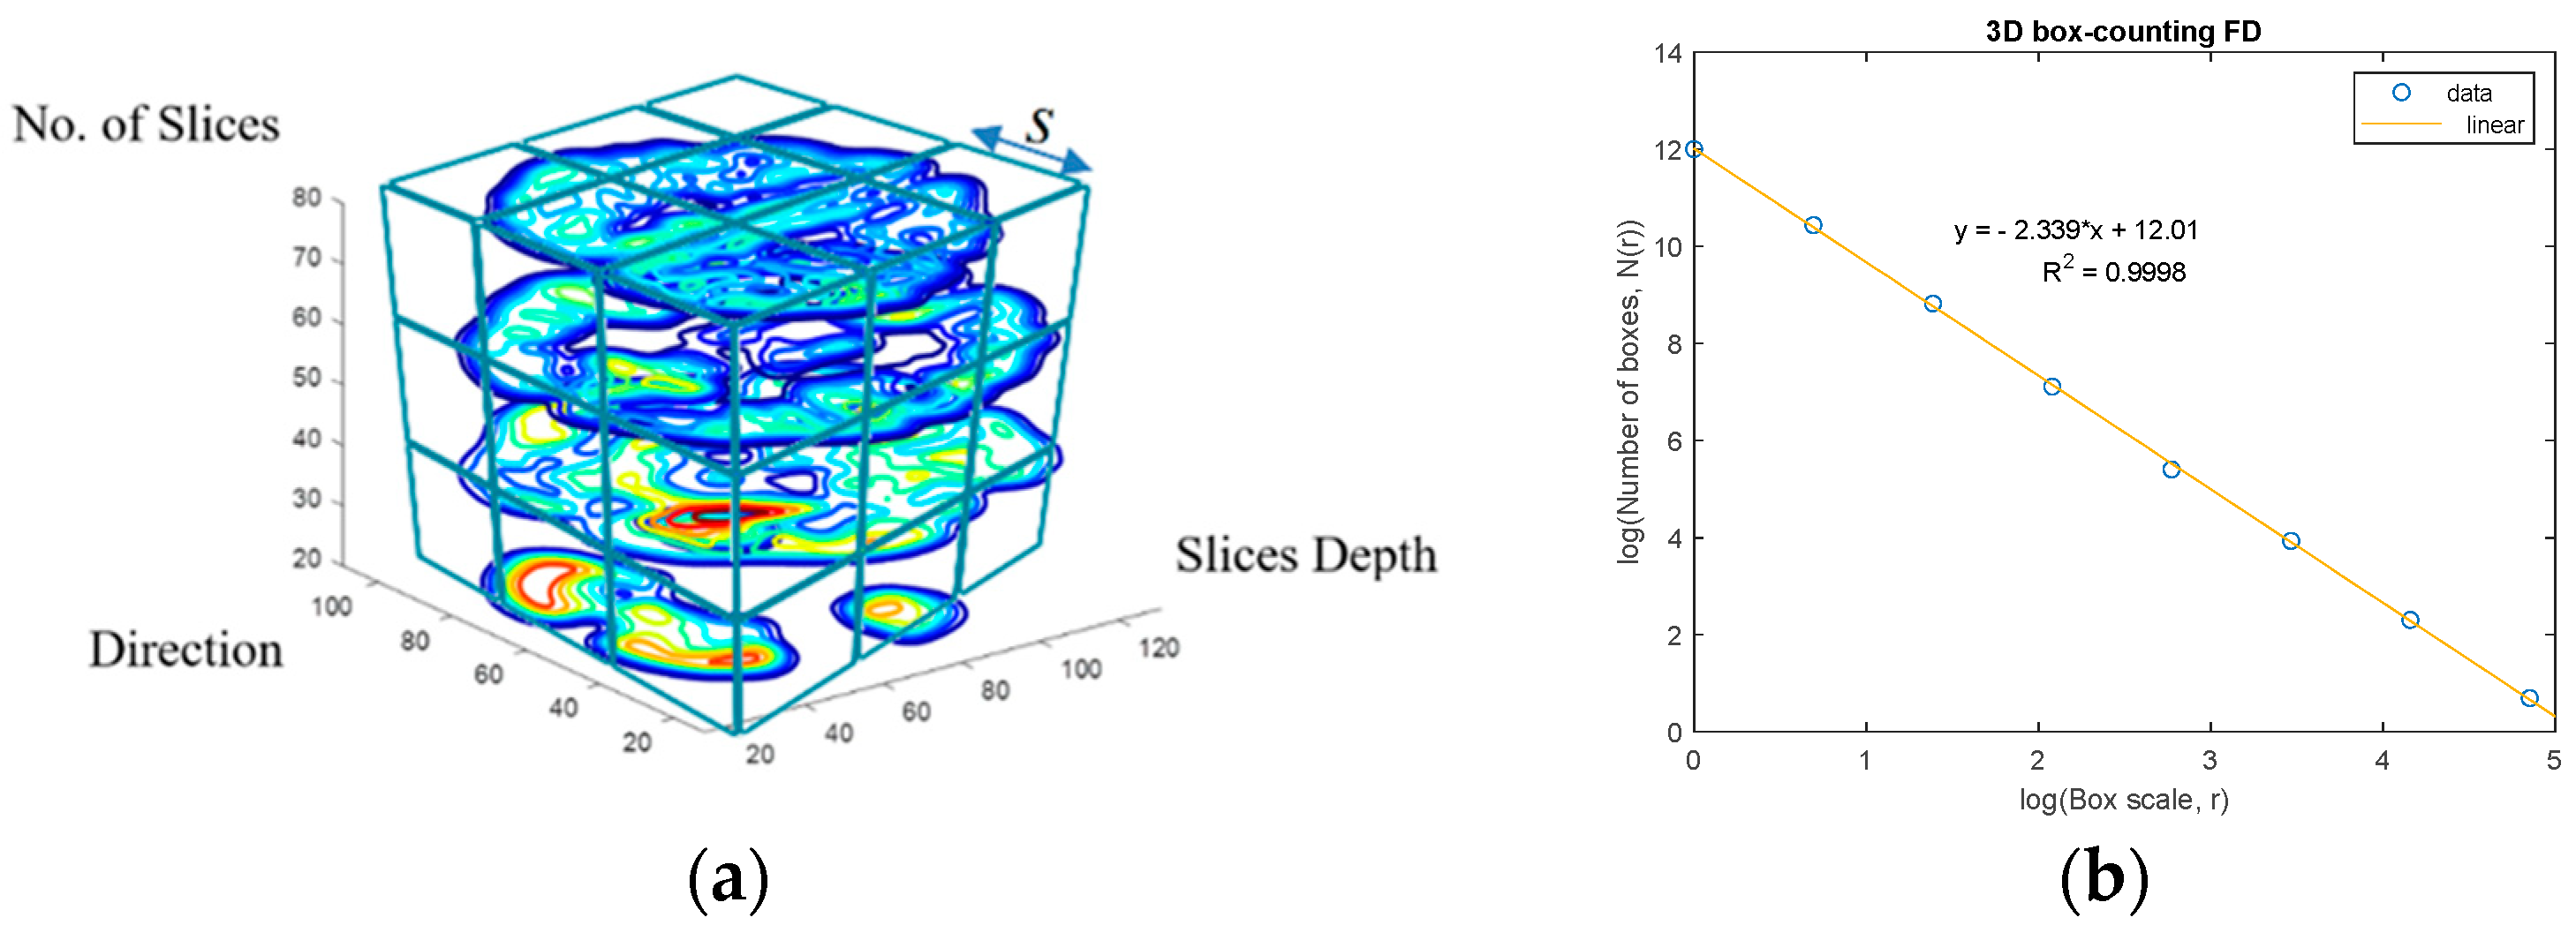
where N is the counting of the hypercubes of dimension D of length s that cover the object. Practically, the key approach for estimating box-counting FD involves two steps: Firstly, by arranging a mesh of minimum box sizes (s) to cover the whole matter. The second step involves the enumeration of the number of boxes (N) that overlap the matter. Estimation of the FD value can then be calculated from the slope of log Number (N) against log box-size (s) [32]. An example of 3D box-counting analysis is shown in Figure 2.

3.7. Fourier Fractal Dimension (FFD)

Conversely, fractal behaviour can also be observed in the frequency domain where the relationship between power spectral density P and frequency f can be expressed as:
P ( f ) f β  
The 3D FFD values are related to the slope of log P(f) versus log f following the work of [6]:
F F D = 4 + β / 2
Practically, 3D FFD can be calculated via the following steps. Firstly, transform the MRI images into the frequency domain using a 3D fast Fourier transform function. The resulting power spectral density p values are then averaged radially around the centre of the image which corresponds to the zeroth frequency. An estimation of the FFD value can then be calculated from the slope of log Number (N) against log box-size (s). An example of 3D FFD analysis is shown in Figure 3.
The advantage of global FFD compared to the previously used global box-counting technique is that no thresholding of the brain images was required, while at the same time no human input was needed to compute the FFD analysis [33].

3.8. Volume of Interest (VOI)-Based Analysis on Brain Structures

Previously, we employed box-counting and FFD methods to measure the global fractal dimension of the brains. In addition, VOI-based analysis was conducted to find out which brain region of the huffaz has significant change compared to non-huffaz in term of its neuroplasticity.
The measurement and calculation for VOI of the brains between huffaz and non-huffaz were performed using masking technique from Wake Forest University Pickatlas and Talairach Daemon (TD) atlas (http://www.fmri.wfubmc.edu/cms/software) (accessed on 1 January 2022). The statistical analysis of the VOI with significant differences was analysed using a two-sample t-test by SPSS. The masking methodology was performed by the work of [34]. Small-volume correction (SVC) was performed prior to the masking process to ensure the correct positioning of each anatomical structure and that they were identical globally.
TD masking classifies the masking of brain MRI images into five subclasses, namely Brodmann area, hemisphere, anatomic labels, lobar, and tissue types. The masking process is important to ensure that the VOI calculation made later will truly represent the region of interest without any interference from the surrounding or nearby voxel structure. Every minute part of the brain was being calculated and measured, reducing the chance of missing the important region that usually failed to be detected by standard surface image analysis software such as VBM. The values of VOI obtained by MATLAB analysis ranged between 0.01 mm3 and 700 mm3.
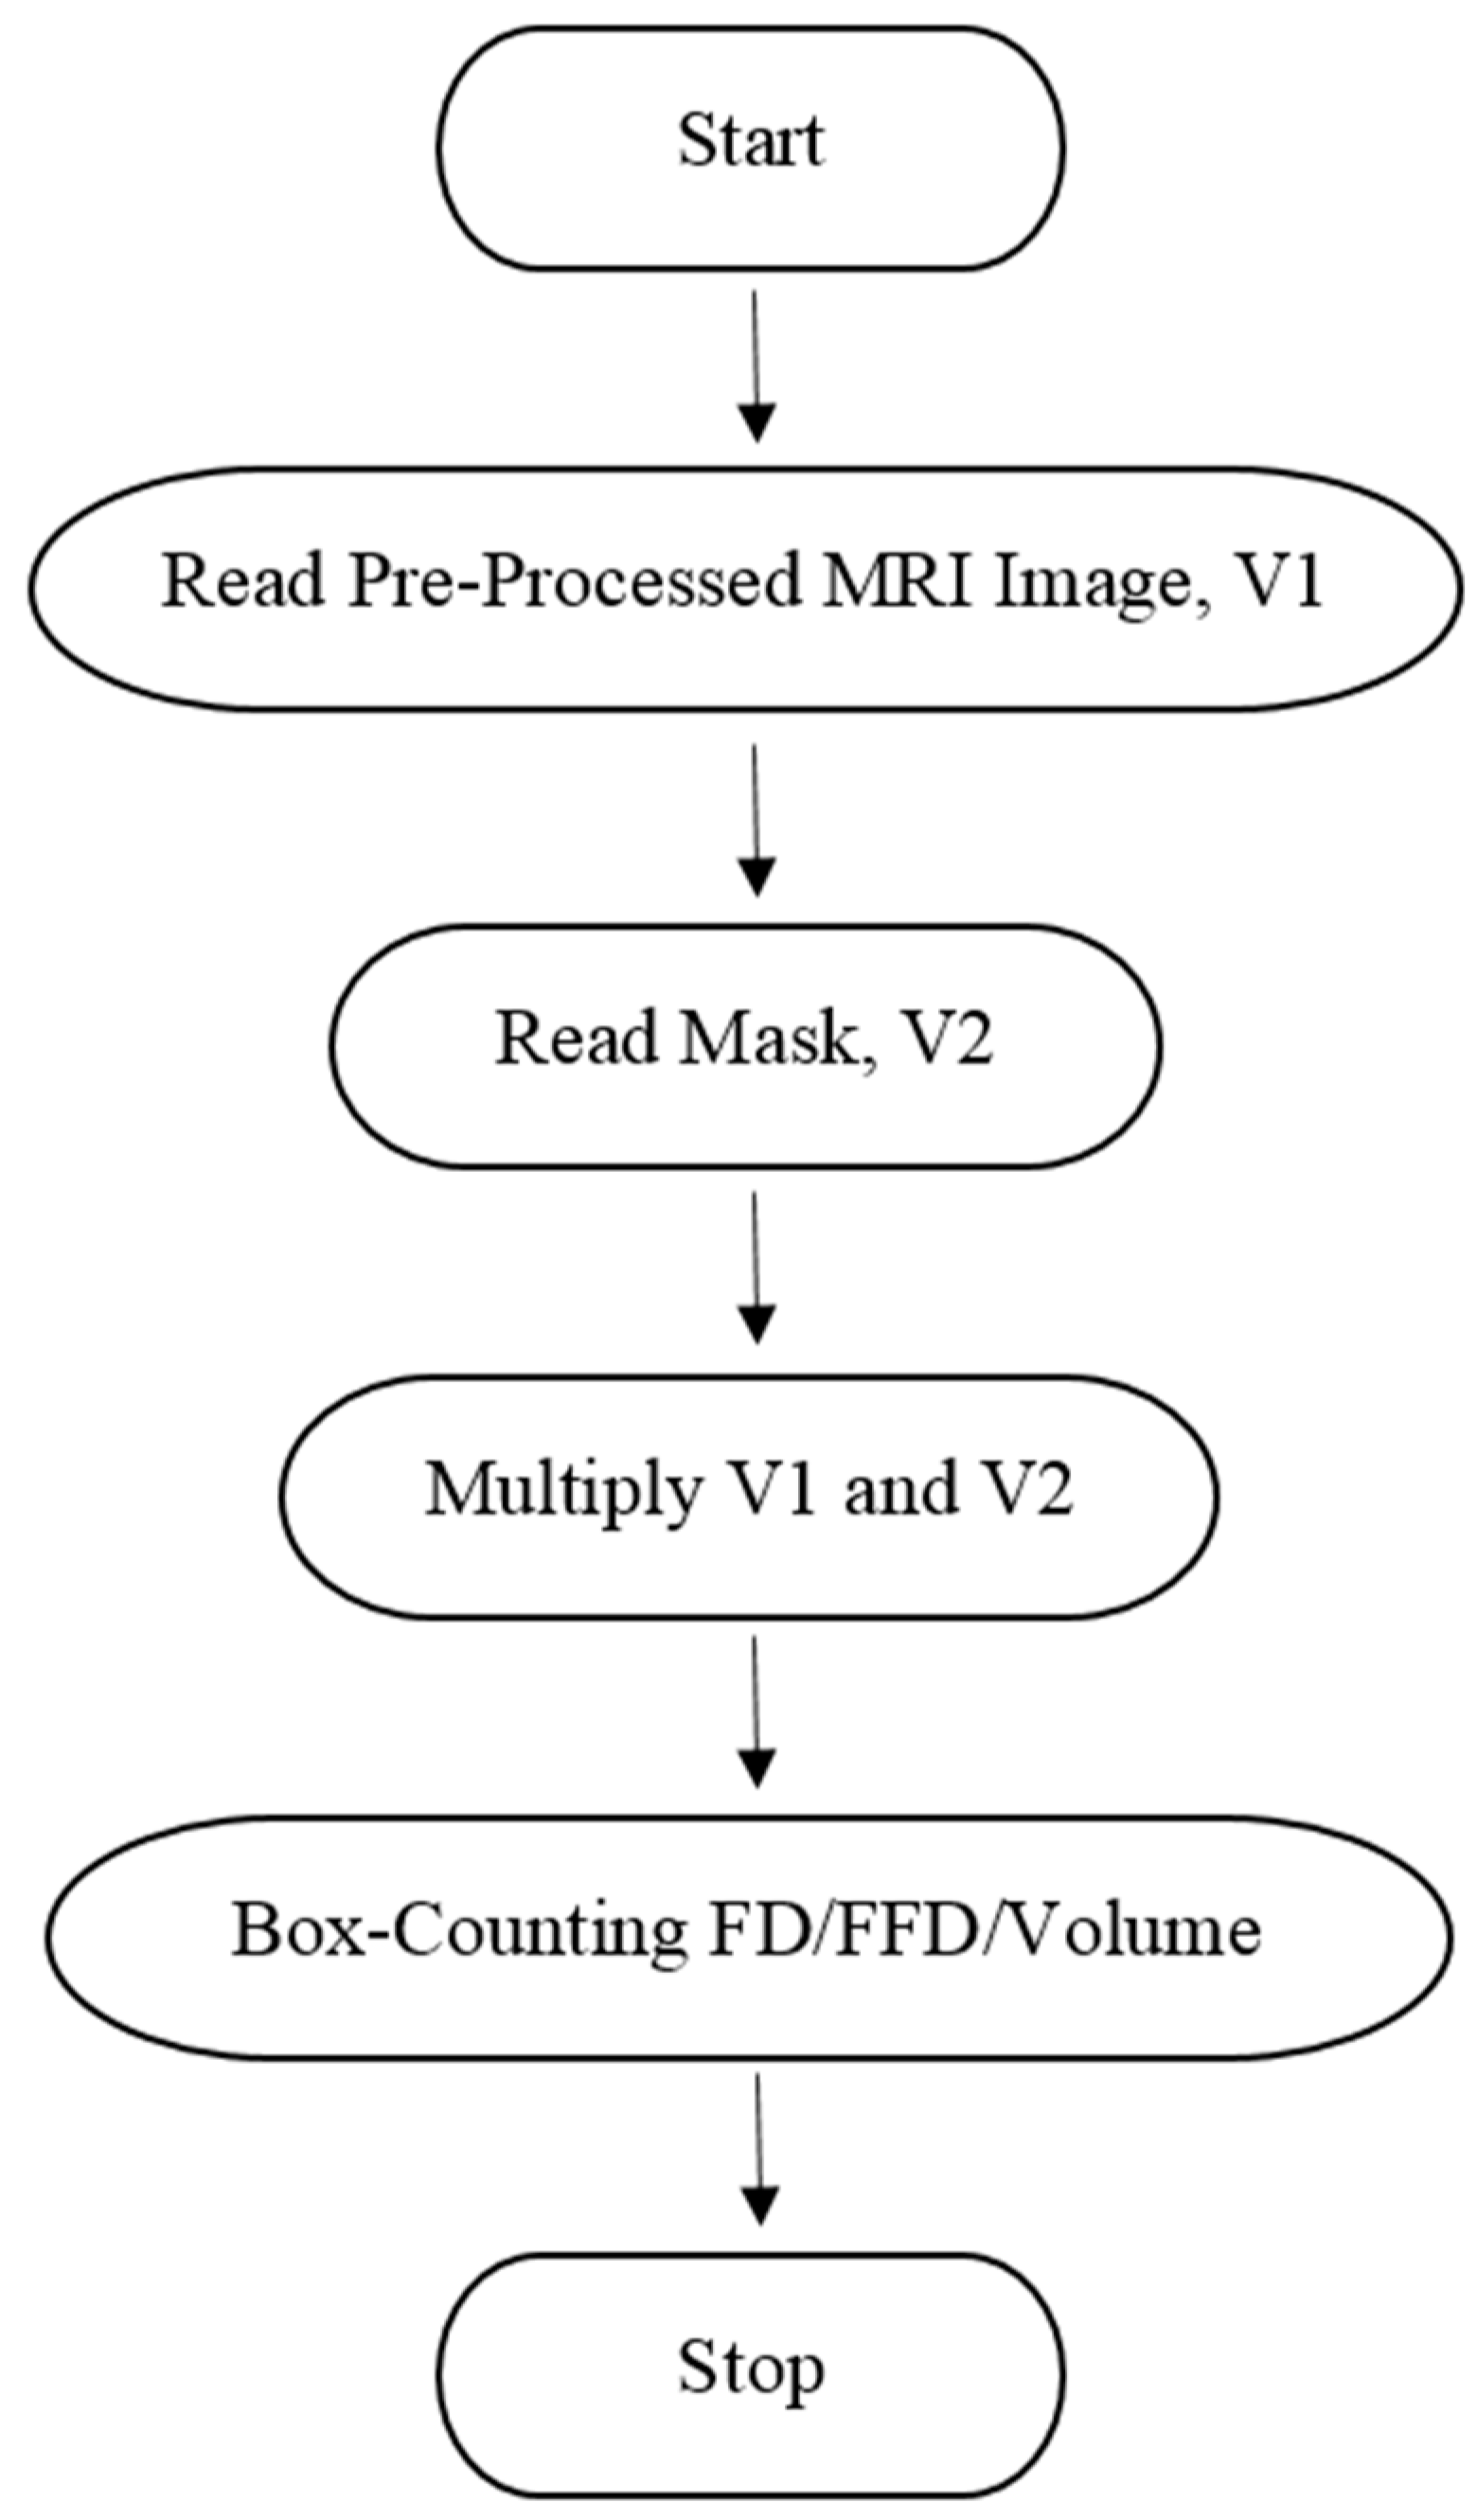
Figure 4 shows the flow of the masking process for VOI-based analysis. The pre-processed brain MRI images were initially tagged as V1, with the masked images template tagged as V2. The pre-processed and masked images were then multiplied (V1 vs. V2). Box-Counting FD, FFD, and volume calculation were then conducted on the multiplied images.
Following the global and VOI-based analyses, the FD, FFD, and volume measurements were then calculated and analysed using a two-sample t-test to compare the mean values between huffaz and non-huffaz groups, with p-values < 0.05 considered as statistically significant differences.

4. Experiments and Results

4.1. Global Fractal Analysis on Brain Structures

There were no significant differences detected in global fractal analyses for FD, FFD, and volume measurements between huffaz and non-huffaz groups.

4.2. Results from VOI-Based Analysis

The masking and VOI-based analysis performed earlier gave the FD values of VOI according to their specific regions and anatomical structures. The FD values were then statistically measured using a two-sample t-test to compare the mean values of the two groups, with the results of the statistical analysis presented in Table 1.
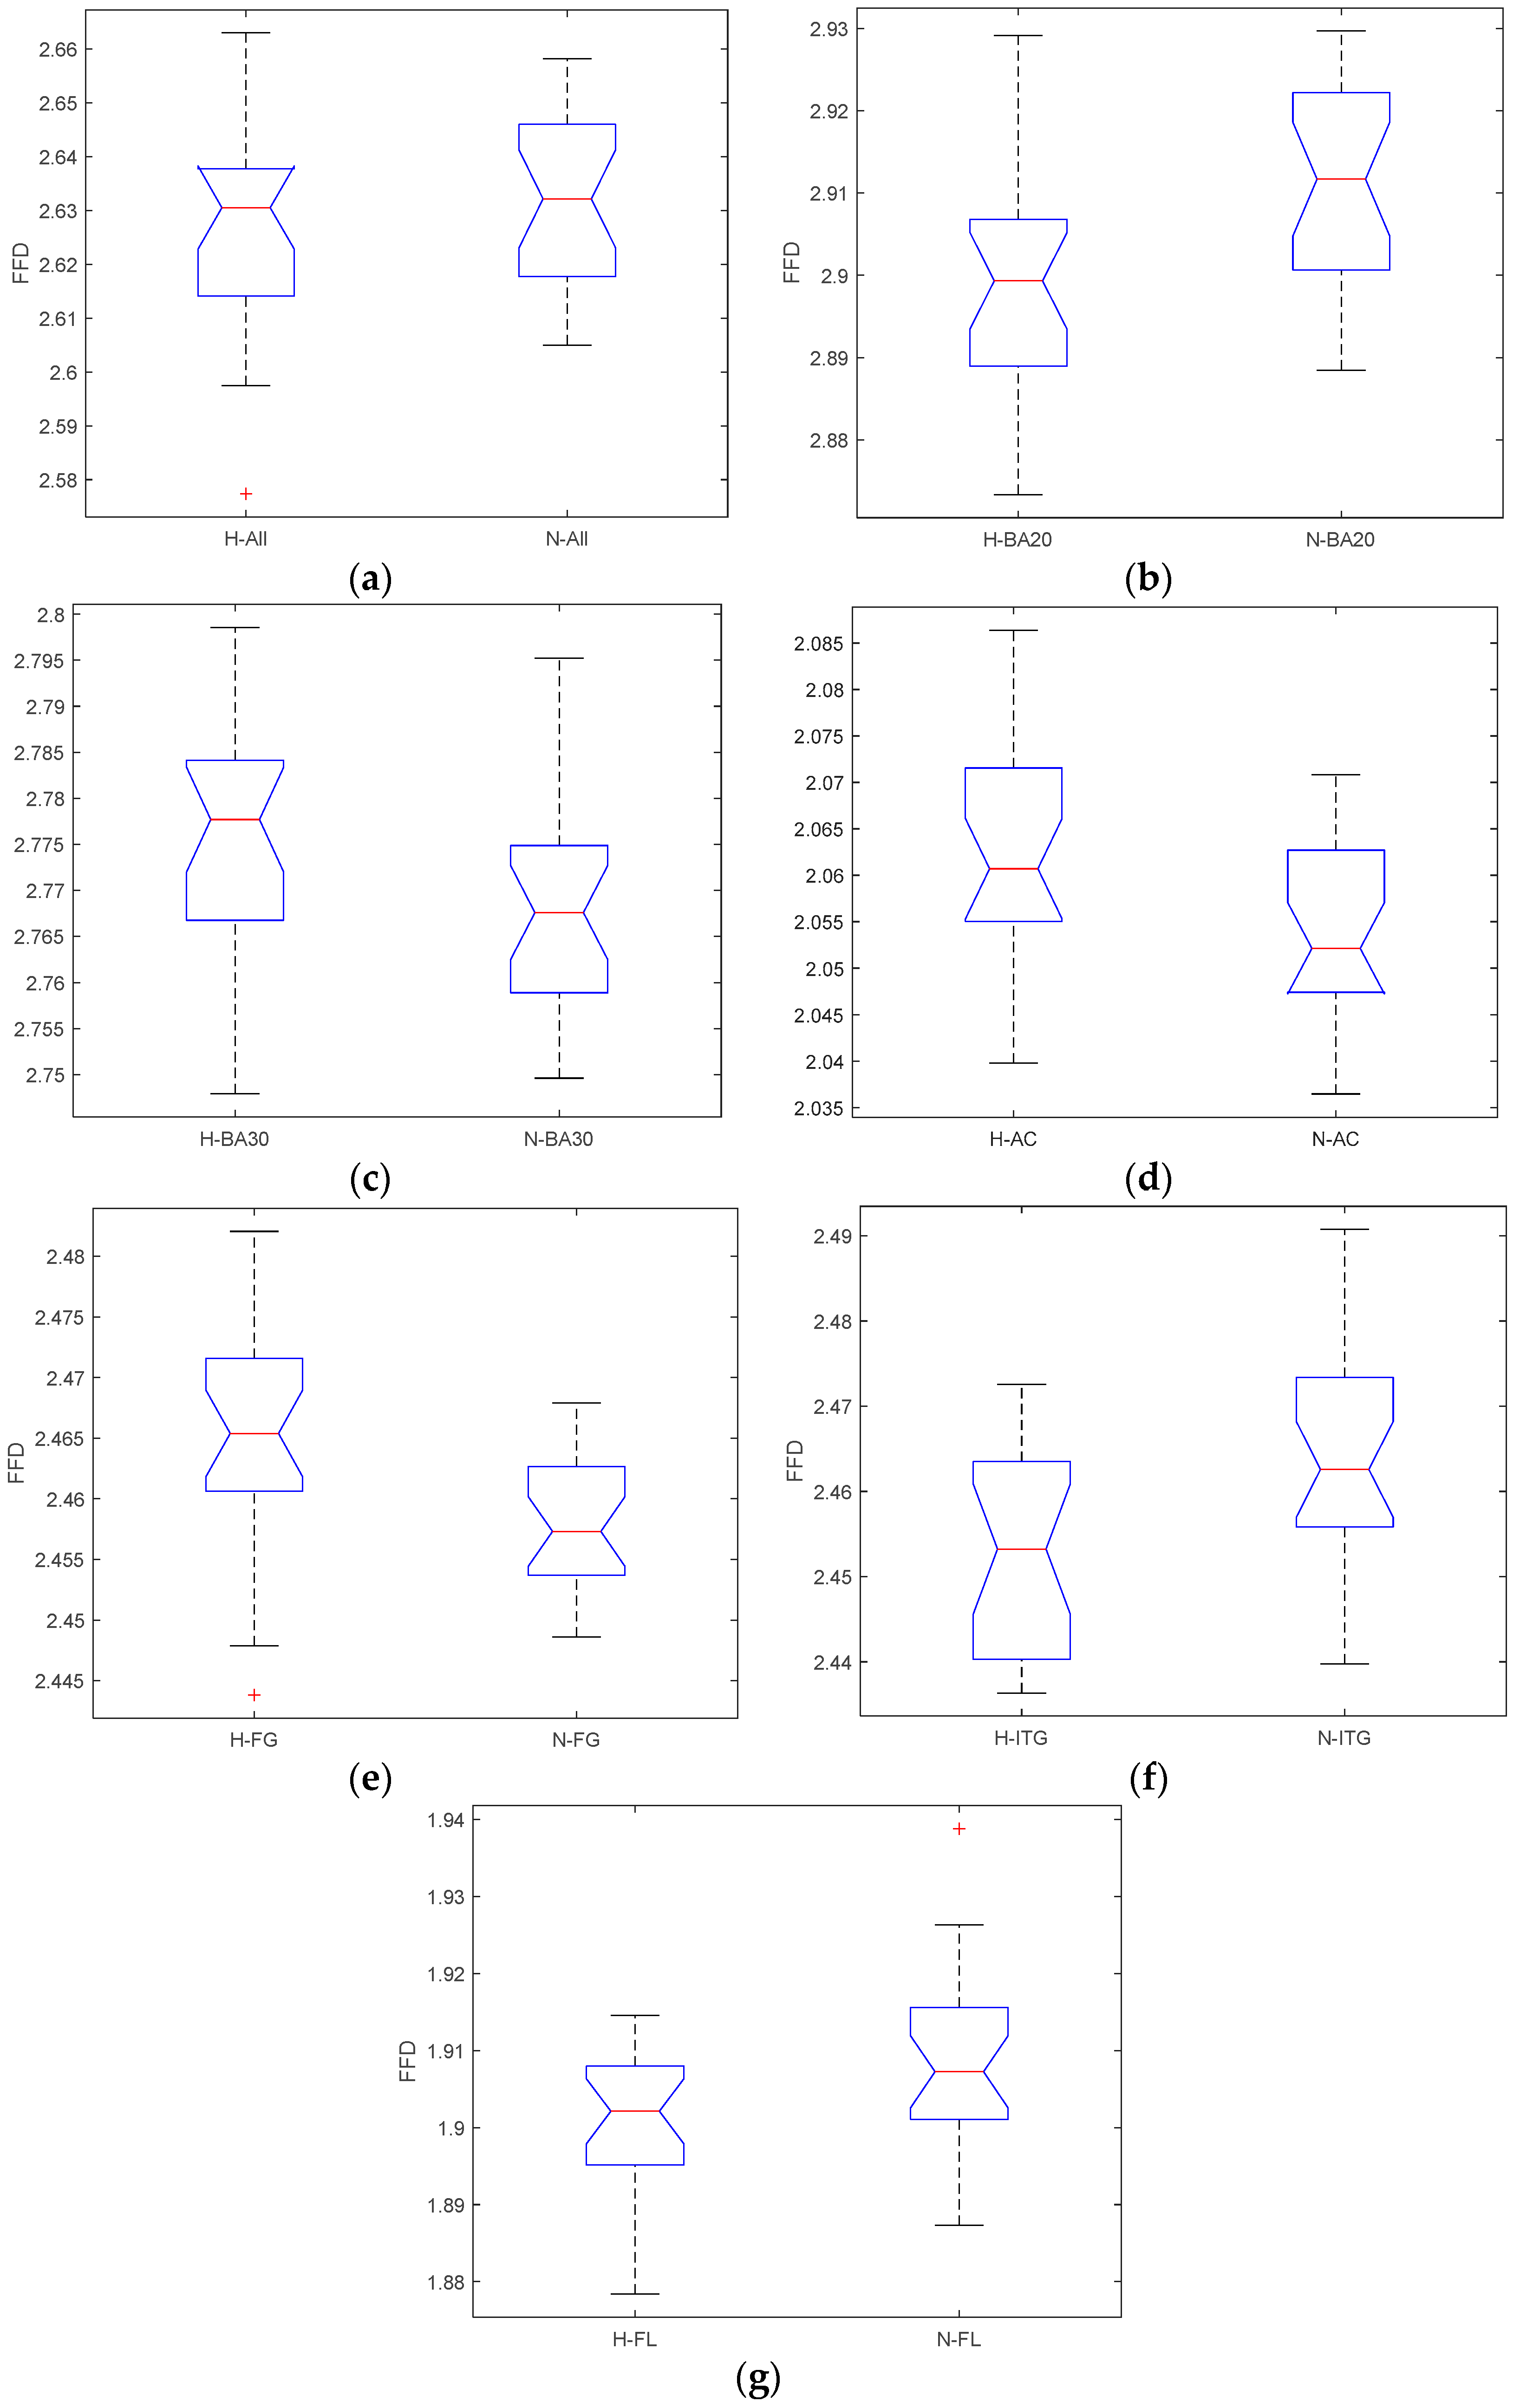
There were nine areas that were significant (p-value < 0.05) between huffaz and non-huffaz. Each technique of measurement (box-counting FD, FFD, and volume) found different areas, while global analyses conducted earlier failed to detect any significant region using the respective techniques. Figure 5, Figure 6 and Figure 7 provide the visual summary of the distribution for the box-counting FD, FFD and volume, respectively.

5. Discussion

5.1. Global Binary Analysis

The failure of global box-counting FD analysis to detect any significant difference between brain regions of huffaz and non-huffaz in our study was suspected from the use of Otsu’s method to segment and threshold our greyscale images into binary images. Our previous work [33] has shown that FD measurement may be jeopardised with thresholding from greyscale images to binary images. The binarisation may also cause loss of information from the original greyscale images. Thresholding may also fail to eliminate the presence of background noise from the foreground pixel since it depends on a single histogram to determine the threshold level [28].
In short, thresholding of greyscale images to binary images using Otsu’s method may corrupt the image analysis performed by using global 3D box-counting FD. This binarisation technique is required as box-counting analysis needs the greyscale images to be in binary format.

5.2. Global Greyscale Analysis

Similar to earlier results (global binary analysis), the analysis of brain MRI images between huffaz and non-huffaz in this experiment found no significant difference using global FFD analysis. The previous discussion found that the effect of the global thresholding method used to be the causes for such a finding, where the causes for such a similar finding in this experiment are the subjects’ age, health status, and education level.
Global FFD analyses found a result with no significant difference of brain structures between huffaz and non-huffaz. This finding may be due to three possible causes mentioned earlier. As the huffaz and non-huffaz groups in this experiment were in the age range of 20 to 25 years, the finding in this experiment follow the pattern of grey matter changes study by [35] where they found no significant reduction in grey matter between 21–25 years and 26–30 years age groups. Significant structural changes were detected in the brain [36] and the eye [37] at 45 and 42 years, respectively. Another study [38], however, in an attempt to investigate the brain sizes among Asian populations for brain atlas development using PET/CT brain images, found no shrinking of brain volume occurred due to aging. The study only found the gender factor to be the cause of differences between brain morphology changes between Asian populations.
The second possible reason for the finding in this experiment may be due to homogenous data between our huffaz and non-huffaz groups. The recruitment of the volunteers for both huffaz and non-huffaz groups were from healthy young adults. In the early recruitment phase of the study, 13 volunteers out of an initial 60 were omitted due to incidental findings on their brain MRI images. This finding indicated the appearance of abnormal brain MRI images. As this study attempts to investigate the effect of memorizing the Quran on brain structures, any existence of pathology within the brain will greatly influence the calculated FD. The FD of brains with pathologies were shown to be reduced if compared to healthy brains [5,7]. On the other hand, consistent FD values were found across healthy subjects with consistent differences of FD values appearing for brains with pathologies [5].
The usage of global fractal analysis at greyscale level in pathology detection is proven, with the ability among others to distinguish between benign and malignant tumours [39], toxicology research in fish [40], and small vessel disease in the eyes [41]. The homogeneity of our healthy volunteers may produce consistent FD values between huffaz and non-huffaz, resulting in no significant difference detected by the statistical analysis of the two-sample t-test conducted.
The volunteers involved in this study were tertiary level students during the data collection period. Thus, it is assumed that the huffaz and non-huffaz group members possess similar intellectual capability. As brain total volume is associated with intelligence, especially the grey matter [42], a higher brain total volume indicates that a person has an edge in knowledge and problem-solving skills compared to a person with low brain total volume. Since our huffaz and non-huffaz groups were at the same level of tertiary education, it is deduced that their intelligence levels would be nearly the same as each other, hence their brain volume.
With regards to equal intellectual capacity between our huffaz and non-huffaz groups, it can be deduced that their brain volume is almost similar, denoted by no significant difference detected between huffaz and non-huffaz brain structures using global FFD analysis. However, some brain structural changes were expected to manifest due to possible neuroplasticity formation for the huffaz group, and that requires a more advanced analysis in the future. It is hoped the differences between the brain structures of huffaz and non-huffaz are detected visually and statistically since the conducted experiments, using global box-counting FD for 3D and global FFD technique, failed to detect any differences here.

5.3. VOI-Based Analysis

In this experiment, a VOI-based analysis study was used to determine the possible brain regions that differ between huffaz and non-huffaz groups. This experiment contrasts with the previous experiment where the application of a masking technique for the brain MRI images was performed for analysis using a VOI-based technique. Upon completion of the masking process, the FD values were calculated using box-counting FD and FFD, and the total grey matter volume was measured. The statistical analysis performed on Statistical Package for Social Sciences (SPSS, version 24.0, IBM, Chicago, IL, USA) found two areas (angular gyrus and middle temporal gyrus) for box-counting, six areas (BA20, BA30, anterior cingulate, fusiform gyrus, inferior temporal gyrus, and frontal lobe) for FFD, and only single area (BA33) for total grey matter volume to differ significantly between huffaz and non-huffaz groups.
In the box-counting analysis, it was found that angular gyrus and middle temporal gyrus exhibited differences in structures for the huffaz compared to the non-huffaz group. These differences can be related to the formation of neuroplasticity on both structures, as detected by 3D box-counting analysis [5]. Three-dimensional FD box-counting has proven to be useful in clinical applications [5,7,14,43], with its applications on the memory, cognitive function, and neuroplasticity of the brain offering wide opportunities for future fractal analyses.
The next FD analysis was conducted using FFD on the masked brain MRI images. The main finding in this experiment was the sensitivity of FFD compared to 3D box-counting FD in detecting the changes within grey matter, with six areas detected: BA20, BA30, anterior cingulate, fusiform gyrus, inferior temporal gyrus, and frontal lobe. BA20 is part of the inferior temporal gyrus, with this area believed to play a major role in visual processing and memory storage [44]. Much previous research shows that repetition in the memorising process will lead to cortical thickening and neuroplasticity occurrence in this area. BA30 on the other hand is part of the anterior cingulate gyrus, which functions mostly on comprehension and language acquisition. This finding is in line with a study by [11] that found an increase in cortical volume for pandits at bilateral temporal cortices, anterior cingulate cortices, and the hippocampus.
The FFD analysis conducted proved a possible neuroplasticity occurrence in the frontal lobe of huffaz group members compared to the non-huffaz group. All six areas of the finding are consistent with the functional activity for memory encoding, memory storage, and memory retrieval.
The significant importance of FFD cannot be denied in detecting possible changes to the brain. FFD has proven to ease the computation analysis as no human input is needed prior to running it. It is also sensitive to images with low signal-to-noise ratio, while at the same time it employs robust and detailed analysis. Thus, the application of the greyscale feature is mandated in the future to prevent any false-negative error from occurring. The results from this type of analysis can in many ways facilitate improvements in clinical or research settings.
As presented in Table 1, only BA33 shows a statistically significant difference between huffaz and non-huffaz brain MRI images for the analysis of volume. This finding is in contrast with the previous FFD technique which found six areas that were significantly different statistically between the huffaz and non-huffaz groups. The area detected, BA33, is also not detected by global FFD, even though the same masking technique was applied in both studies.
The robust memorisation process undertaken by huffaz in their 18 months of tahfiz training do affect the occurrence of neuroplasticity on their brain, as compared to non-huffaz with the same age, health status, and educational background. This difference, which is possible to be monitored and measured applying MRI and VOI-based analysis using FD, suggests that brains which undergo memorisation training appear to exhibit neuroplasticity that can be quantified using box-counting FD, FFD, and volume analysis. The efficacy of those analysis techniques in locating the significant areas not only proves that it is able to detect areas with pathology conditions but also possible neuroplasticity formation due to extensive use of the brain.

5.4. Limitations of the Study

The use of a brain atlas here that was based on Caucasian brain size may be the limitation of this experiment, since the participants in this study were all Asians. The unavailability of a brain atlas for masking a specific Asian ethnicity brain, apart from an attempt by [38] to develop an atlas of Malaysian brain using PET/CT and [45] using Malaysian neonates’ brain, may lead to its development in the future so that a specific brain atlas can be used for a specific ethnicity brain for Malaysians. This will resort to a more accurate masking process which in turn will produce more reliable and accurate data and present results of the specific population. However, since all the brain MRI images have been spatially normalised according to an earlier MNI template, the results can be conclusive since the MNI template relocates the various brain anatomical parts to be identical globally.
The current sample size of 47, with 23 being huffaz, may limit the generalisation of the outcomes of this research work. It is noteworthy to highlight that this sample size is comparable to similar studies which recruited 19 huffaz [10] and 21 pandits [11].

6. Conclusions

In conclusion, fractal-based analysis, either box-counting or FFD, can, and should, complement an existing well-established conventional volume-based method such as VBM. The application of VOI-based analysis was justified to be sufficiently sensitive for detecting brain structural changes and should also be used collectively with global box-counting and FFD analysis. It has been proven here that while VBM is sensitive when analysing MRI images, regional analysis by fractal analysis is also important as it may give an insight into the functionally distinct regions. The findings contributed to the current knowledge by suggesting that the measurement of fractal analysis based on the specific volume of interest was proven to detect significant areas that were undetected by both conventional global box-counting and FFD analysis.

Author Contributions

Conceptualization, M.Z.C.A. and A.H.S.; Formal analysis, I.J., M.I.M.T. and A.H.S.; Writing—original draft preparation, I.J. Writing—review and editing, M.Z.C.A. and M.I.M.T. All authors have read and agreed to the published version of the manuscript.

Funding

This research received no external funding.

Institutional Review Board Statement

The study was conducted in accordance with the Declaration of Helsinki, and approved by the Institutional Ethics Committee of International Islamic University Malaysia (protocol code IIUM/504/14/11/3/IREC 654, approved on 1 September 2016).

Informed Consent Statement

Informed consent was obtained from all subjects involved in the study.

Data Availability Statement

The data presented in this study are available on request from the corresponding author. The data are not publicly available due to privacy.

Conflicts of Interest

The authors declare no conflict of interest.

References

  1. Farahibozorg, S.; Hashemi-Golpayegani, S.M.; Ashburner, J. Age- and Sex-Related Variations in the Brain White Matter Fractal Dimension throughout Adulthood: An MRI Study. Clin. Neuroradiol. 2015, 25, 19–32. [Google Scholar] [CrossRef] [PubMed] [Green Version]
  2. Di Ieva, A.; Esteban, F.J.; Grizzi, F.; Klonowski, W.; Martin-Landrove, M. Fractals in the Neurosciences, Part II: Clinical Applications and Future Perspectives. Neuroscientist 2015, 21, 30–43. [Google Scholar] [CrossRef] [PubMed]
  3. Valentim, C.A.; Inacio, C.M.; David, S.A. Fractal methods and power spectral density as means to explore EEG patterns in patients undertaking mental tasks. Fractal Fract. 2021, 5, 225. [Google Scholar] [CrossRef]
  4. Marzi, C.; Giannelli, M.; Tessa, C.; Mascalchi, M.; Diciotti, S. Fractal analysis of MRI data at 7 T: How much complex is the cerebral cortex? IEEE Access 2021, 9, 69226–69234. [Google Scholar] [CrossRef]
  5. Squarcina, L.; De Luca, A.; Bellani, M.; Brambilla, P.; Turkheimer, F.E.; Bertoldo, A. Fractal analysis of MRI data for the characterization of patients with schizophrenia and bipolar disorder. Phys. Med. Biol. 2015, 60, 1697–1716. [Google Scholar] [CrossRef]
  6. Nezafat, N.B.; Ghoranneviss, M.; Elahi, S.M.; Shafiekhani, A.; Ghorannevis, Z.; Solaymani, S. Microstructure, micromorphology, and fractal geometry of hard dental tissues: Evaluation of Atomic Force Microscopy images. Microsc. Res. Tech. 2019, 82, 1884–1890. [Google Scholar] [CrossRef] [PubMed]
  7. Roura, E.; Maclair, G.; Andorrà, M.; Juanals, F.; Pulido-Valdeolivas, I.; Saiz, A.; Blanco, Y.; Sepulveda, M.; Llufriu, S.; Martínez-Heras, E.; et al. Cortical fractal dimension predicts disability worsening in multiple sclerosis patients. NeuroImage Clin. 2021, 30, 102653. [Google Scholar] [CrossRef] [PubMed]
  8. Di Ieva, A.; Grizzi, F.; Jelinek, H.; Pellionisz, A.J.; Losa, G.A. Fractals in the Neurosciences, Part I: General Principles and Basic Neurosciences. Neurosci. Rev. J. Bringing Neurobiol. Neurol. Psychiatry 2013, 20, 403–417. [Google Scholar] [CrossRef]
  9. Keblawi, F. Memorisation of the Qur’an: Opening the Research Agenda. J. Qur’anic Stud. 2014, 16, 168–195. [Google Scholar] [CrossRef]
  10. Rahman, M.A.; Aribisala, B.S.; Ullah, I.; Omer, H. Association between scripture memorization and brain atrophy using magnetic resonance imaging. Acta Neurobiol. Exp. 2020, 80, 90–97. [Google Scholar] [CrossRef] [Green Version]
  11. Hartzell, J.F.; Davis, B.; Melcher, D.; Miceli, G.; Jovicich, J.; Nath, T.; Singh, N.C.; Hasson, U. Brains of verbal memory specialists show anatomical differences in language, memory and Visual systems. NeuroImage 2016, 131, 181–192. [Google Scholar] [CrossRef] [PubMed] [Green Version]
  12. Hamaide, J.; De Groof, G.; Van der Linden, A. Neuroplasticity and MRI: A perfect match. NeuroImage 2016, 131, 13–28. [Google Scholar] [CrossRef] [PubMed]
  13. Jiang, L.; Cao, X.; Li, T.; Tang, Y.; Li, W.; Wang, J.; Li, C. Cortical thickness changes correlate with cognition changes after cognitive training: Evidence from a Chinese community study. Front. Aging Neurosci. 2016, 8, 118. [Google Scholar] [CrossRef]
  14. Grizzi, F.; Castello, A.; Qehajaj, D.; Russo, C.; Lopci, E. The complexity and fractal geometry of nuclear medicine images. Mol. Imaging Biol. 2018, 21, 401–409. [Google Scholar] [CrossRef]
  15. Di Ieva, A. The Fractal Geometry of the Brain; Springer: New York, NY, USA, 2016. [Google Scholar]
  16. Meng, Q.; Qin, Q.; Yang, H.; Zhou, H.; Wu, K.; Wang, L. Fractal characteristics of the pore structure of coral powder–cement slurry under different fractal models. Fractal Fract. 2022, 6, 145. [Google Scholar] [CrossRef]
  17. Zhao, X.; Yang, B.; Yuan, S.; Shen, Z.; Feng, D. Seepage–fractal model of embankment soil and its application. Fractal Fract. 2022, 6, 277. [Google Scholar] [CrossRef]
  18. Yin, Y.; Guo, J.; Peng, G.; Yu, X.; Kong, Y. Fractal operators and fractional dynamics with 1/2 order in Biological Systems. Fractal Fract. 2022, 6, 378. [Google Scholar] [CrossRef]
  19. Zappasodi, F.; Olejarczyk, E.; Marzetti, L.; Assenza, G.; Pizzella, V.; Tecchio, F. Fractal dimension of EEG activity senses neuronal impairment in acute stroke. PLoS ONE 2014, 9, e100199. [Google Scholar]
  20. Liu, Y.; Chen, L.; Wang, H.; Jiang, L.; Zhang, Y.; Zhao, J.; Song, Y. An improved differential box-counting method to estimate fractal dimensions of gray-level images. J. Vis. Commun. Image Represent. 2014, 25, 1102–1111. [Google Scholar] [CrossRef]
  21. Yip, C.; Han, N.L.R.; Sng, B.L. Legal and ethical issues in research. Indian J. Anaesth. 2016, 60, 684–688. [Google Scholar]
  22. SPM12 Manual—Statistical Parametric Mapping. Available online: https://www.fil.ion.ucl.ac.uk/spm/doc/manual.pdf/ (accessed on 1 January 2022).
  23. Ashburner, J.; Friston, K.J. Unified segmentation. Neuroimage 2005, 26, 839–851. [Google Scholar] [CrossRef] [PubMed]
  24. Guo, X.; Tang, C.; Zhang, H.; Chang, Z. Automatic thresholding for defect detection. ICIC Express Lett. 2012, 6, 159–164. [Google Scholar]
  25. Shahriar Sazzad, T.M.; Tanzibul Ahmmed, K.M.; Hoque, M.U.; Rahman, M. Development of automated brain tumor identification using MRI images. In Proceedings of the 2019 International Conference on Electrical, Computer and Communication Engineering (ECCE), Cox’sBazar, Chittagong, Bangladesh, 7–9 February 2019. [Google Scholar]
  26. Selvaraj, D.; Dhanasekaran, R. A Review on Tissue Segmentation and Feature Extraction of MRI Brain images. Int. J. Comput. Sci. Eng. Technol. 2013, 4, 1313–1332. [Google Scholar]
  27. Chen, X.; Li, S.; Hu, J.; Liang, Y. A survey on Otsu’s image segmentation methods. J. Comput. Inf. Syst. 2014, 10, 4287–4298. [Google Scholar]
  28. Nie, F.; Zhang, P. Image Segmentation Based on Framework of Two-dimensional Histogram and Class Variance Criterion. Int. J. Signal Processing Image Processing Pattern Recognit. 2015, 8, 79–88. [Google Scholar] [CrossRef]
  29. Nyo, M.T.; Mebarek-Oudina, F.; Hlaing, S.S.; Khan, N.A. Otsu’s Thresholding technique for MRI image brain tumor segmentation. Multimed. Tools Appl. 2022, 1–13. [Google Scholar] [CrossRef]
  30. Xue-guang, W.; Shu-hong, C. An Improved Image Segmentation Algorithm Based on Two-Dimensional Otsu’s Method. Inf. Sci. Lett. 2012, 1, 77–83. [Google Scholar] [CrossRef]
  31. Xiao, L.; Ouyang, H.; Fan, C.; Umer, T.; Poonia, R.C.; Wan, S. Gesture image segmentation with Otsu’s method based on noise adaptive angle threshold. Multimed. Tools Appl. 2020, 79, 35619–35640. [Google Scholar] [CrossRef]
  32. Che Azemin, M.Z.; Ab Hamid, F.; Wang, J.J.; Kawasaki, R.; Kumar, D.K. Box-Counting Fractal Dimension Algorithm Variations on Retina Images. In Advanced Computer and Communication Engineering Technology; Sulaiman, H., Othman, M., Othman, M., Rahim, Y., Pee, N., Eds.; Springer: Berlin/Heidelberg, Germany, 2016; Volume 362, pp. 337–343. [Google Scholar]
  33. Azemin, M.Z.; Kumar, D.K.; Wong, T.Y.; Wang, J.J.; Mitchell, P.; Kawasaki, R.; Wu, H. Age-related rarefaction in the fractal dimension of retinal vessel. Neurobiol. Aging 2012, 33, 194.e1–194.e4. [Google Scholar] [CrossRef]
  34. Maldjian, J.A.; Laurienti, P.J.; Kraft, R.A.; Burdette, J.H. An automated method for neuroanatomic and cytoarchitectonic atlas-based interrogation of fMRI data sets. NeuroImage 2003, 19, 1233–1239. [Google Scholar] [CrossRef]
  35. Bourisly, A.K.; El-Beltagi, A.; Cherian, J.; Gejo, G.; Al-Jazzaf, A.; Ismail, M. A voxel-based morphometric magnetic resonance imaging study of the brain detects age-related gray matter volume changes in healthy subjects of 21–45 years old. Neuroradiol. J. 2015, 28, 450–459. [Google Scholar] [CrossRef] [PubMed]
  36. Podgórski, P.; Bladowska, J.; Sasiadek, M.; Zimny, A. Novel volumetric and surface-based magnetic resonance indices of the aging brain—Does male and female brain age in the same way? Front. Neurol. 2021, 12, 645729. [Google Scholar] [CrossRef]
  37. Che Azemin, M.Z.; Ab Hamid, F.; Aminuddin, A.; Wang, J.J.; Kawasaki, R.; Kumar, D.K. Age-related rarefaction in retinal vasculature is not linear. Exp. Eye Res. 2013, 116, 355–358. [Google Scholar] [CrossRef]
  38. Azmi, M.H.; Saripan, M.I.; Nordin, A.J. Brain anatomical variations among Malaysian population. In Proceedings of the IEEE Conference on Biomedical Engineering and Sciences (IECBES 2014), Kuala Lumpur, Malaysia, 8–10 December 2014. [Google Scholar]
  39. Yan, Y.; Zhu, W.; Wu, Y.-y.; Zhang, D. Fractal dimension differentiation between benign and malignant thyroid nodules from ultrasonography. Appl. Sci. 2019, 9, 1494. [Google Scholar] [CrossRef] [Green Version]
  40. Manera, M.; Sayyaf Dezfuli, B.; Castaldelli, G.; DePasquale, J.A.; Fano, E.A.; Martino, C.; Giari, L. Perfluorooctanoic acid exposure assessment on common carp liver through image and ultrastructural investigation. Int. J. Environ. Res. Public Health 2019, 16, 4923. [Google Scholar] [CrossRef] [Green Version]
  41. Aliahmad, B.; Kumar, D.K.; Hao, H.; Unnikrishnan, P.; Che Azemin, M.Z.; Kawasaki, R.; Mitchell, P. Zone specific fractal dimension of retinal images as predictor of stroke incidence. Sci. World J. 2014, 2014, 467462. [Google Scholar] [CrossRef] [Green Version]
  42. Nave, G.; Jung, W.H.; Karlsson Linnér, R.; Kable, J.W.; Koellinger, P.D. Are Bigger Brains Smarter? Evidence From a Large-Scale Preregistered Study. Psychol. Sci. 2019, 30, 43–54. [Google Scholar] [CrossRef] [Green Version]
  43. Dave, V.P.; Pappuru, R.R.; Gindra, R.; Ananthakrishnan, A.; Modi, S.; Trivedi, M.; Harikumar, P. OCT angiography fractal analysis-based quantification of macular vascular density in branch retinal vein occlusion eyes. Can. J. Ophthalmol. 2019, 54, 297–300. [Google Scholar] [CrossRef]
  44. Schneider, W.X. Selective visual processing across competition episodes: A theory of task-driven visual attention and working memory. Philos. Trans. R. Soc. B Biol. Sci. 2013, 368, 20130060. [Google Scholar] [CrossRef] [Green Version]
  45. Bai, J.; Abdul-Rahman, M.F.; Rifkin-Graboi, A.; Chong, Y.S.; Kwek, K.; Saw, S.M.; Qiu, A. Population Differences in Brain Morphology and Microstructure among Chinese, Malay, and Indian Neonates. PLoS ONE 2012, 7, e47816. [Google Scholar] [CrossRef] [Green Version]
Figure 1. Slices of brain images by SPM12.
Fractalfract 06 00396 g001
Figure 2. Illustration of 3D box−counting fractal dimension applied on MRI images. (a) Step 1: Count the number of boxes N with scale s that cover the MRI voxels and (b) Step 2: Estimate FD based on the slope of the least−squares−fit of the log−log relationship.
Fractalfract 06 00396 g002
Figure 3. Illustration of 3D Fourier fractal dimension applied on MRI images. Note that for simplicity, only a cross−section of the MRI is shown. (a) Step 1: Convert the MRI image into the frequency domain using fast Fourier transform, (b) Step 2: Sample the power spectrum radially starting from the centre, and (c) Step 3: Estimate FFD based on the slope of the least−squares−fit of the log−log relationship.
Fractalfract 06 00396 g003
Figure 4. The flowchart of VOI-based analysis with masking.
Fractalfract 06 00396 g004
Figure 5. Box-counting FD values for huffaz and non-huffaz measured in the following VOI: (a) whole brain structure, (b) angular gyrus, and (c) middle temporal gyrus. The plus signs (+) indicate outliers.
Fractalfract 06 00396 g005
Figure 6. FFD values for huffaz and non-huffaz measured in the following VOI: (a) whole brain structure, (b) Brodmann area 20, (c) Brodmann area 30, (d) anterior cingulate, (e) fusiform gyrus, (f) inferior temporal gyrus, and (g) frontal lobe. The plus signs (+) indicate outliers.
Fractalfract 06 00396 g006
Figure 7. Volume for huffaz and non-huffaz measured in the following VOI: (a) whole brain structure and (b) Brodmann area 33. The plus signs (+) indicate outliers.
Fractalfract 06 00396 g007
Table 1. Two-sample t-test of VOI-based analysis between huffaz and non-huffaz.
Technique of MeasurementNumber of Samples (Huffaz)Areap-Value
Box-counting FD 47 (23)All
Angular Gyrus
Middle Temporal Gyrus
0.329
0.048
0.015
FFD47 (23)All
BA20
BA30
Anterior Cingulate
Fusiform Gyrus
Inferior Temporal Gyrus
Frontal Lobe
0.351
0.002
0.035
0.012
0.003
0.012
0.048
Volume47 (23)All
BA33
0.986
0.026
Publisher’s Note: MDPI stays neutral with regard to jurisdictional claims in published maps and institutional affiliations.