
Influence of Training and Single Exercise on Leptin Level and Metabolism in Obese Overweight and Normal-Weight Women of Different Age


Abstract
1. Introduction
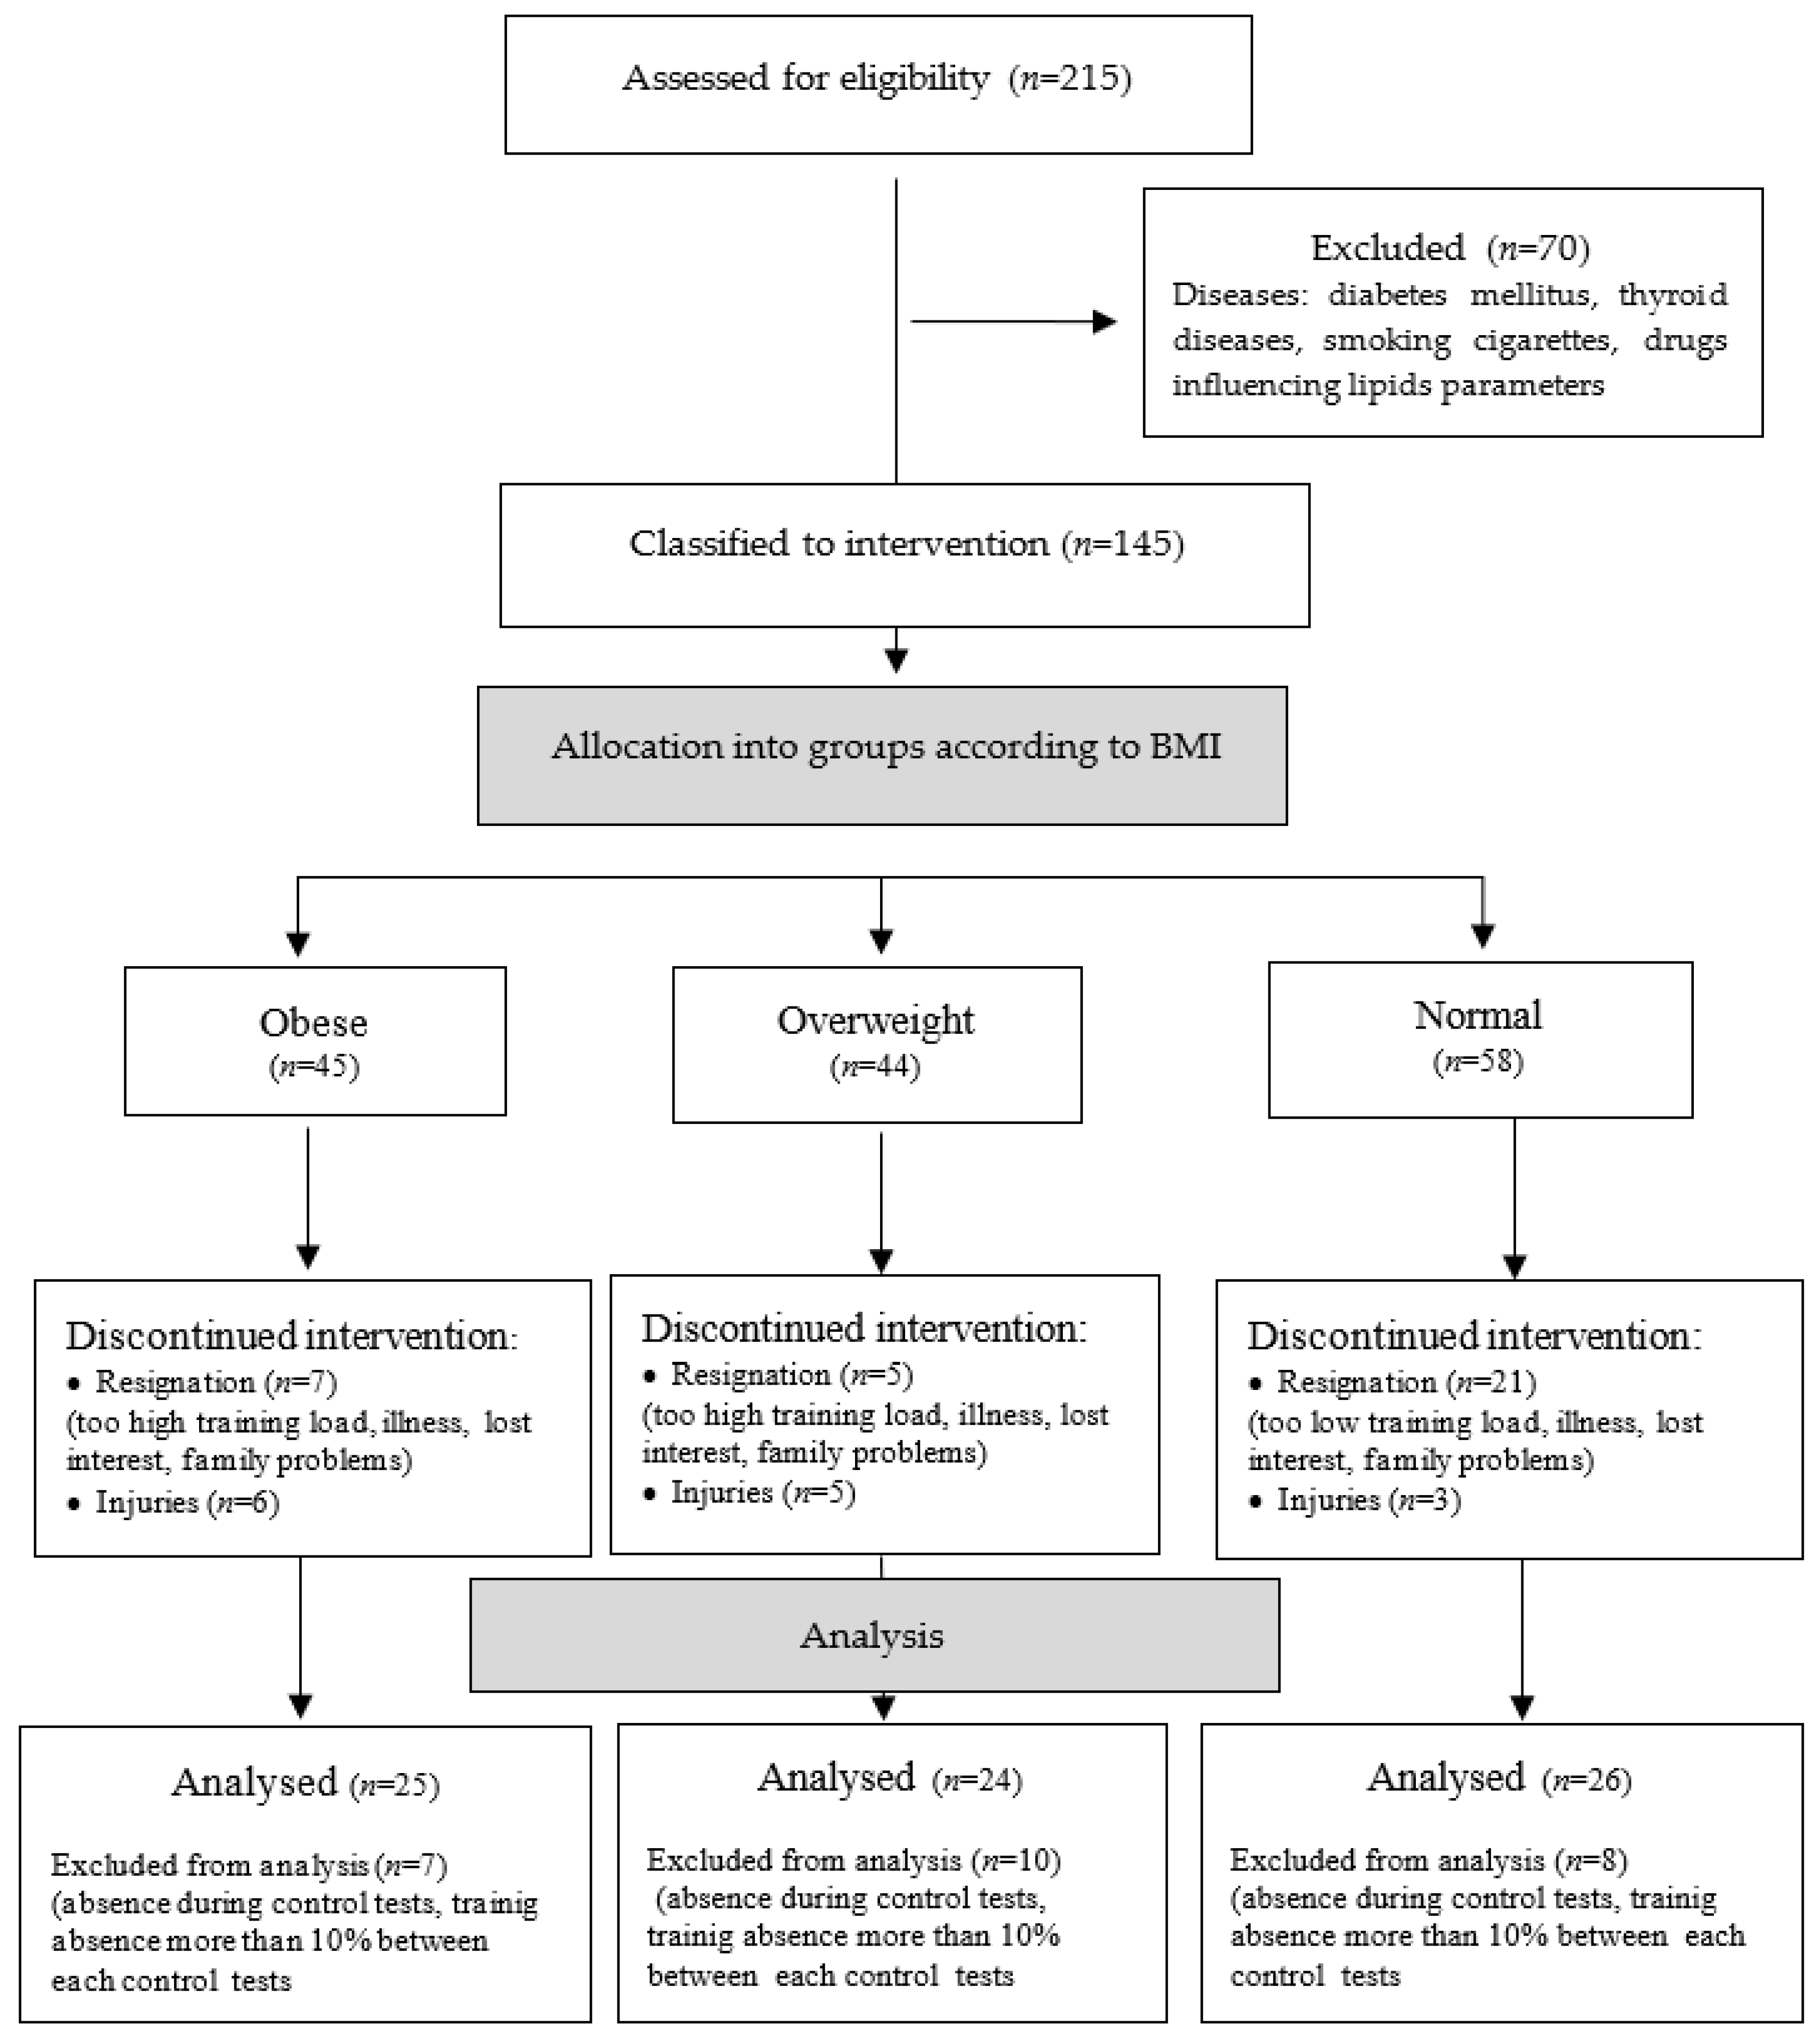
2. Material and Methods
2.1. Participants
2.2. Training Characteristics
2.3. Follow-Up Examinations
2.3.1. Anthropometric Parameters
2.3.2. Physical Performance Submaximal Test
2.3.3. Biochemical Tests
2.4. Statistical Analysis
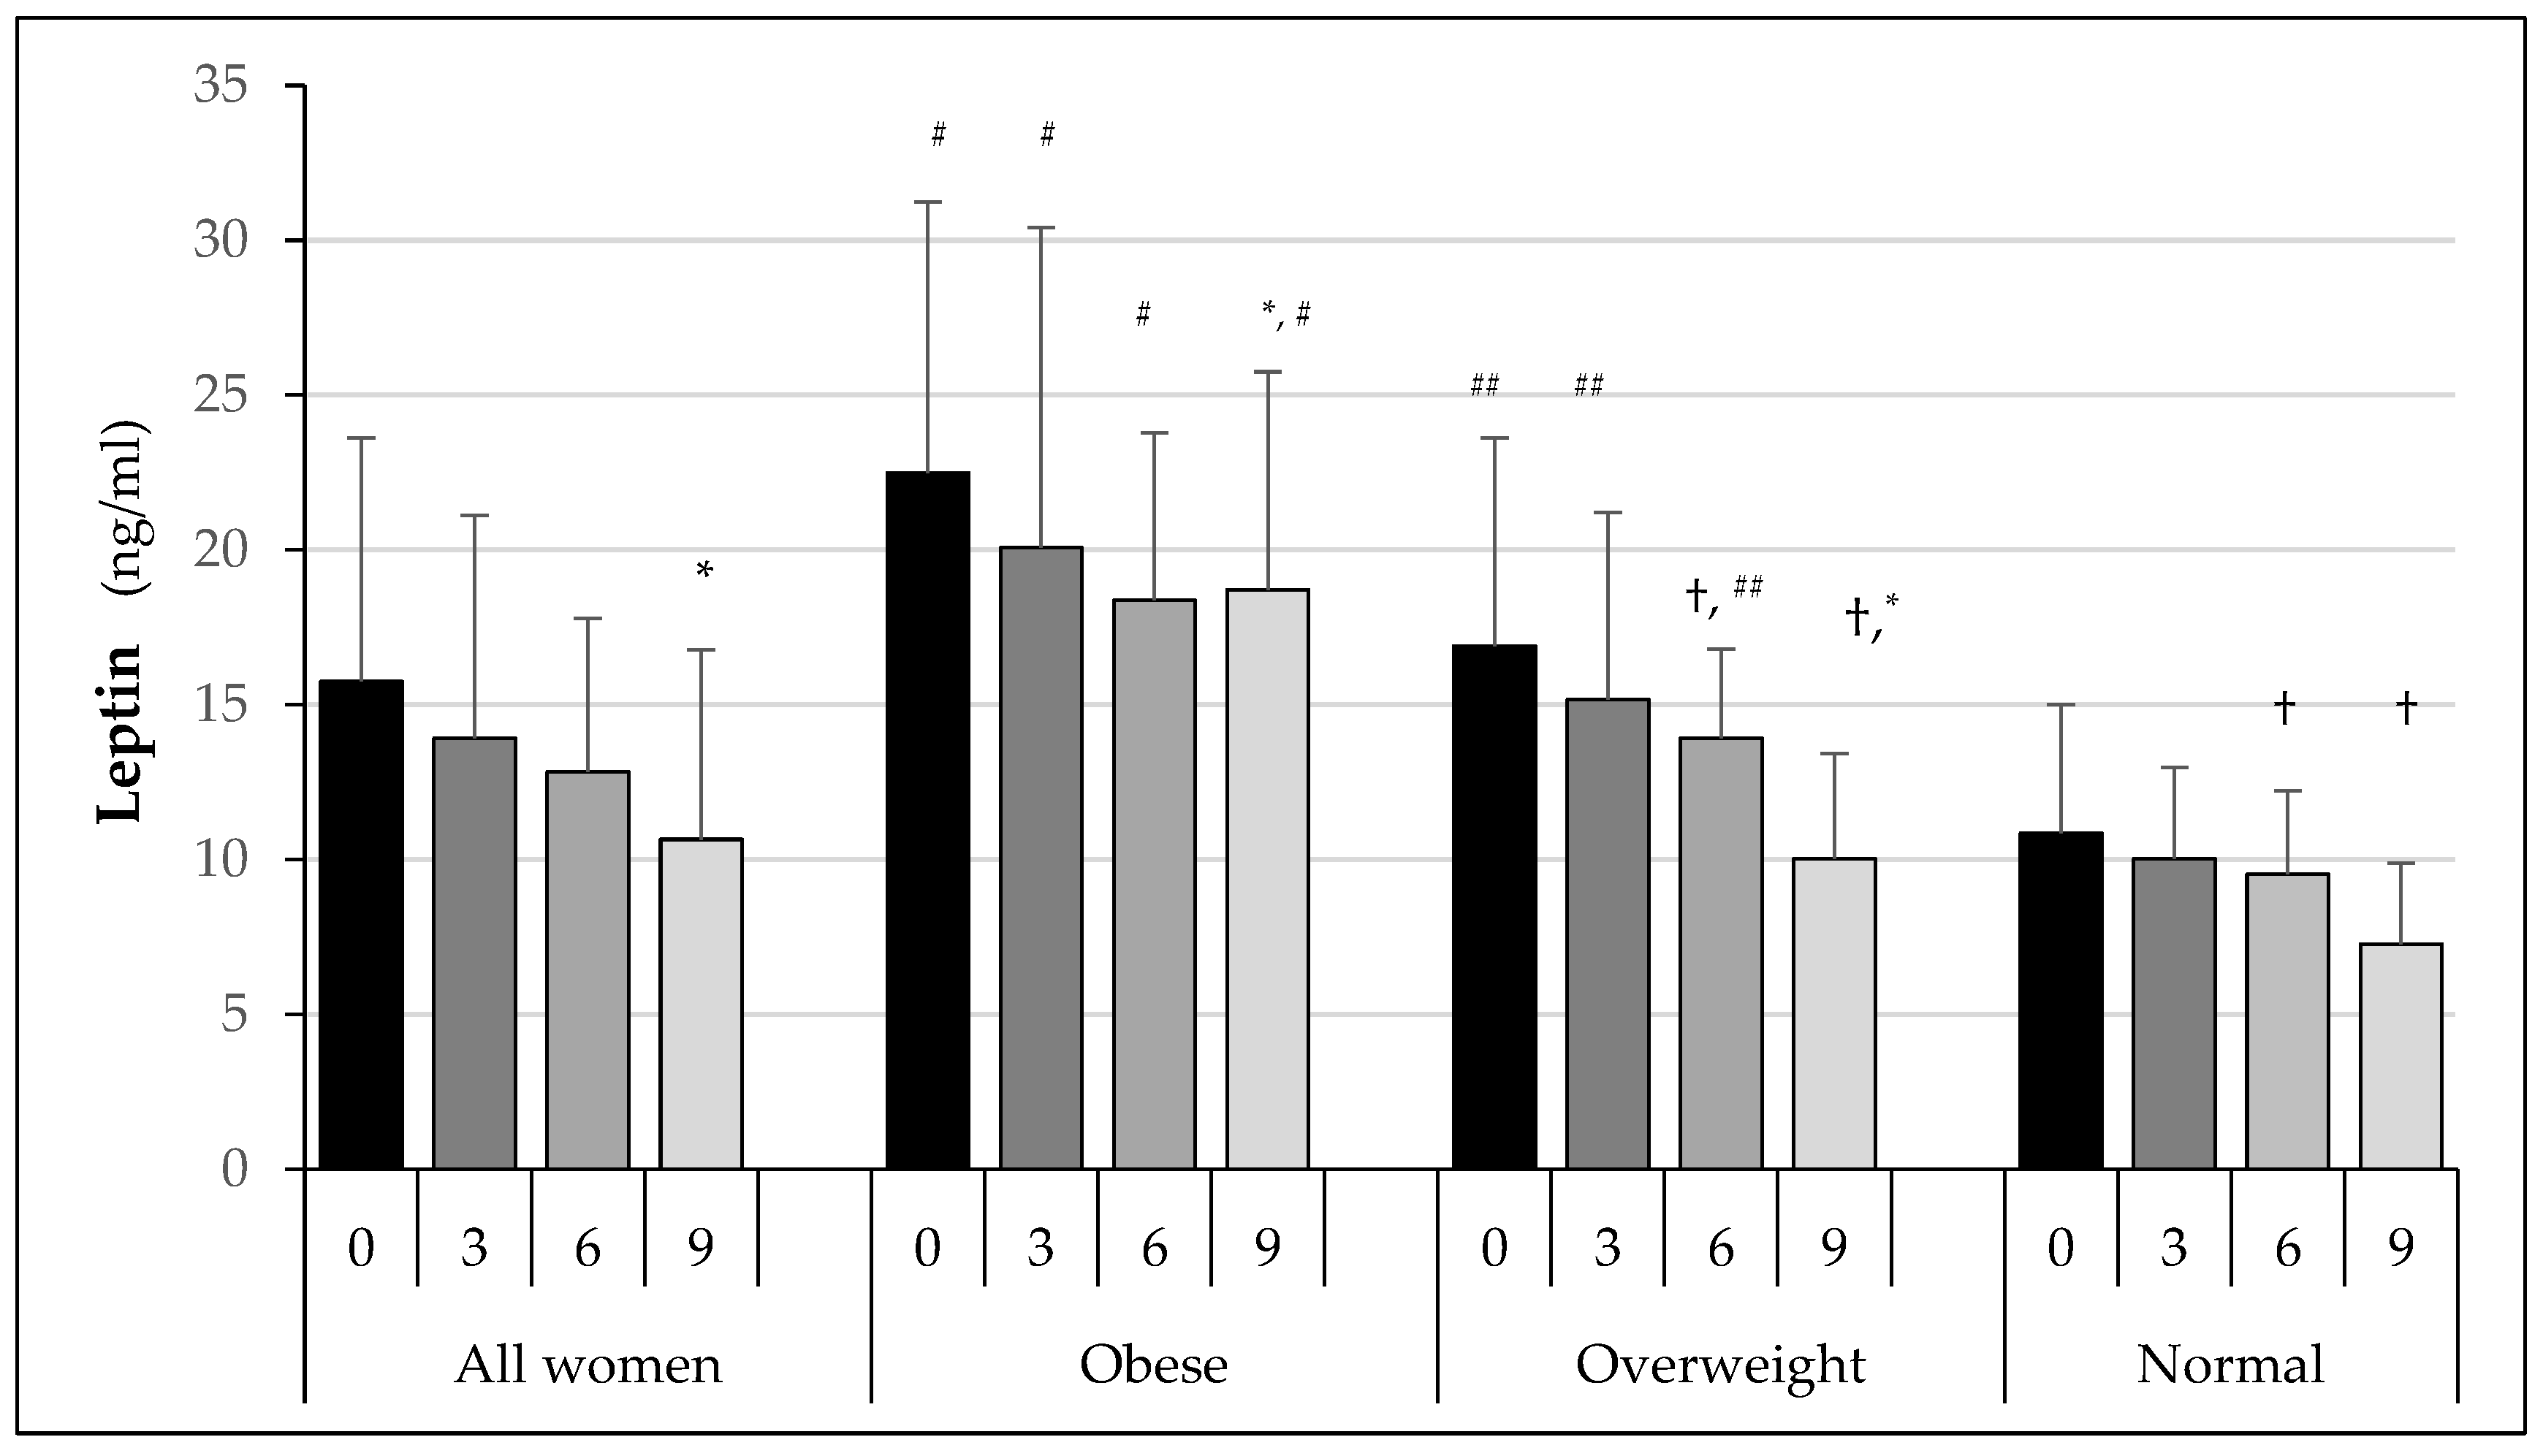
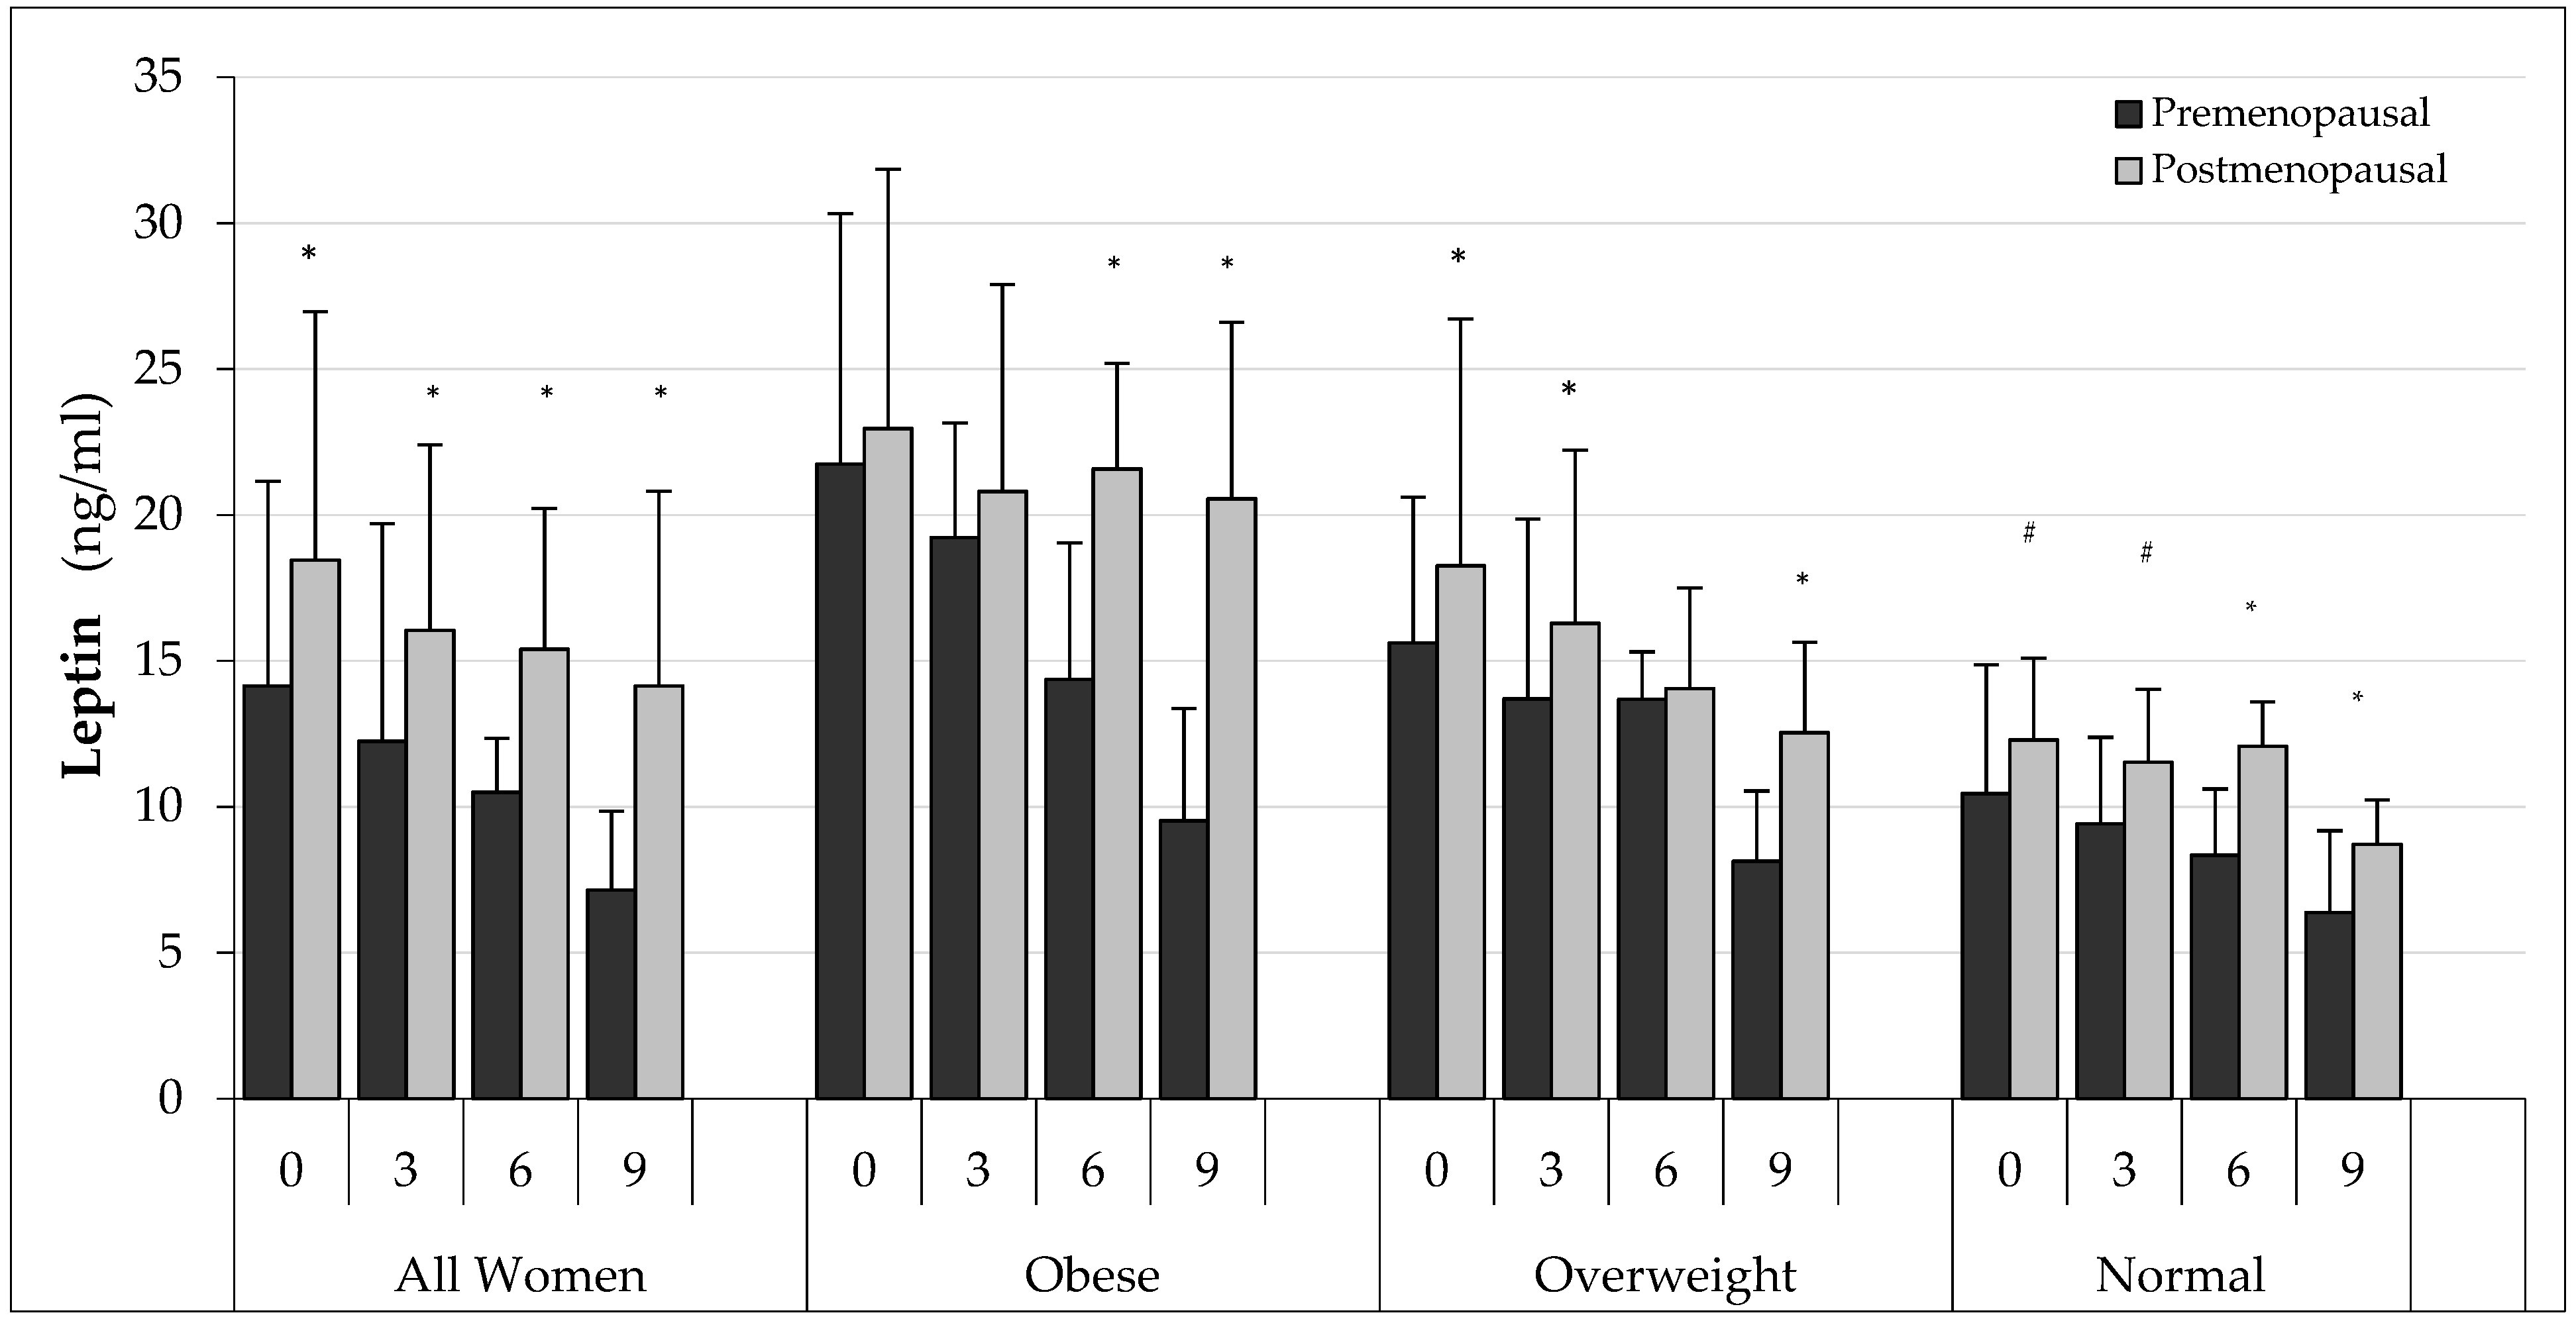
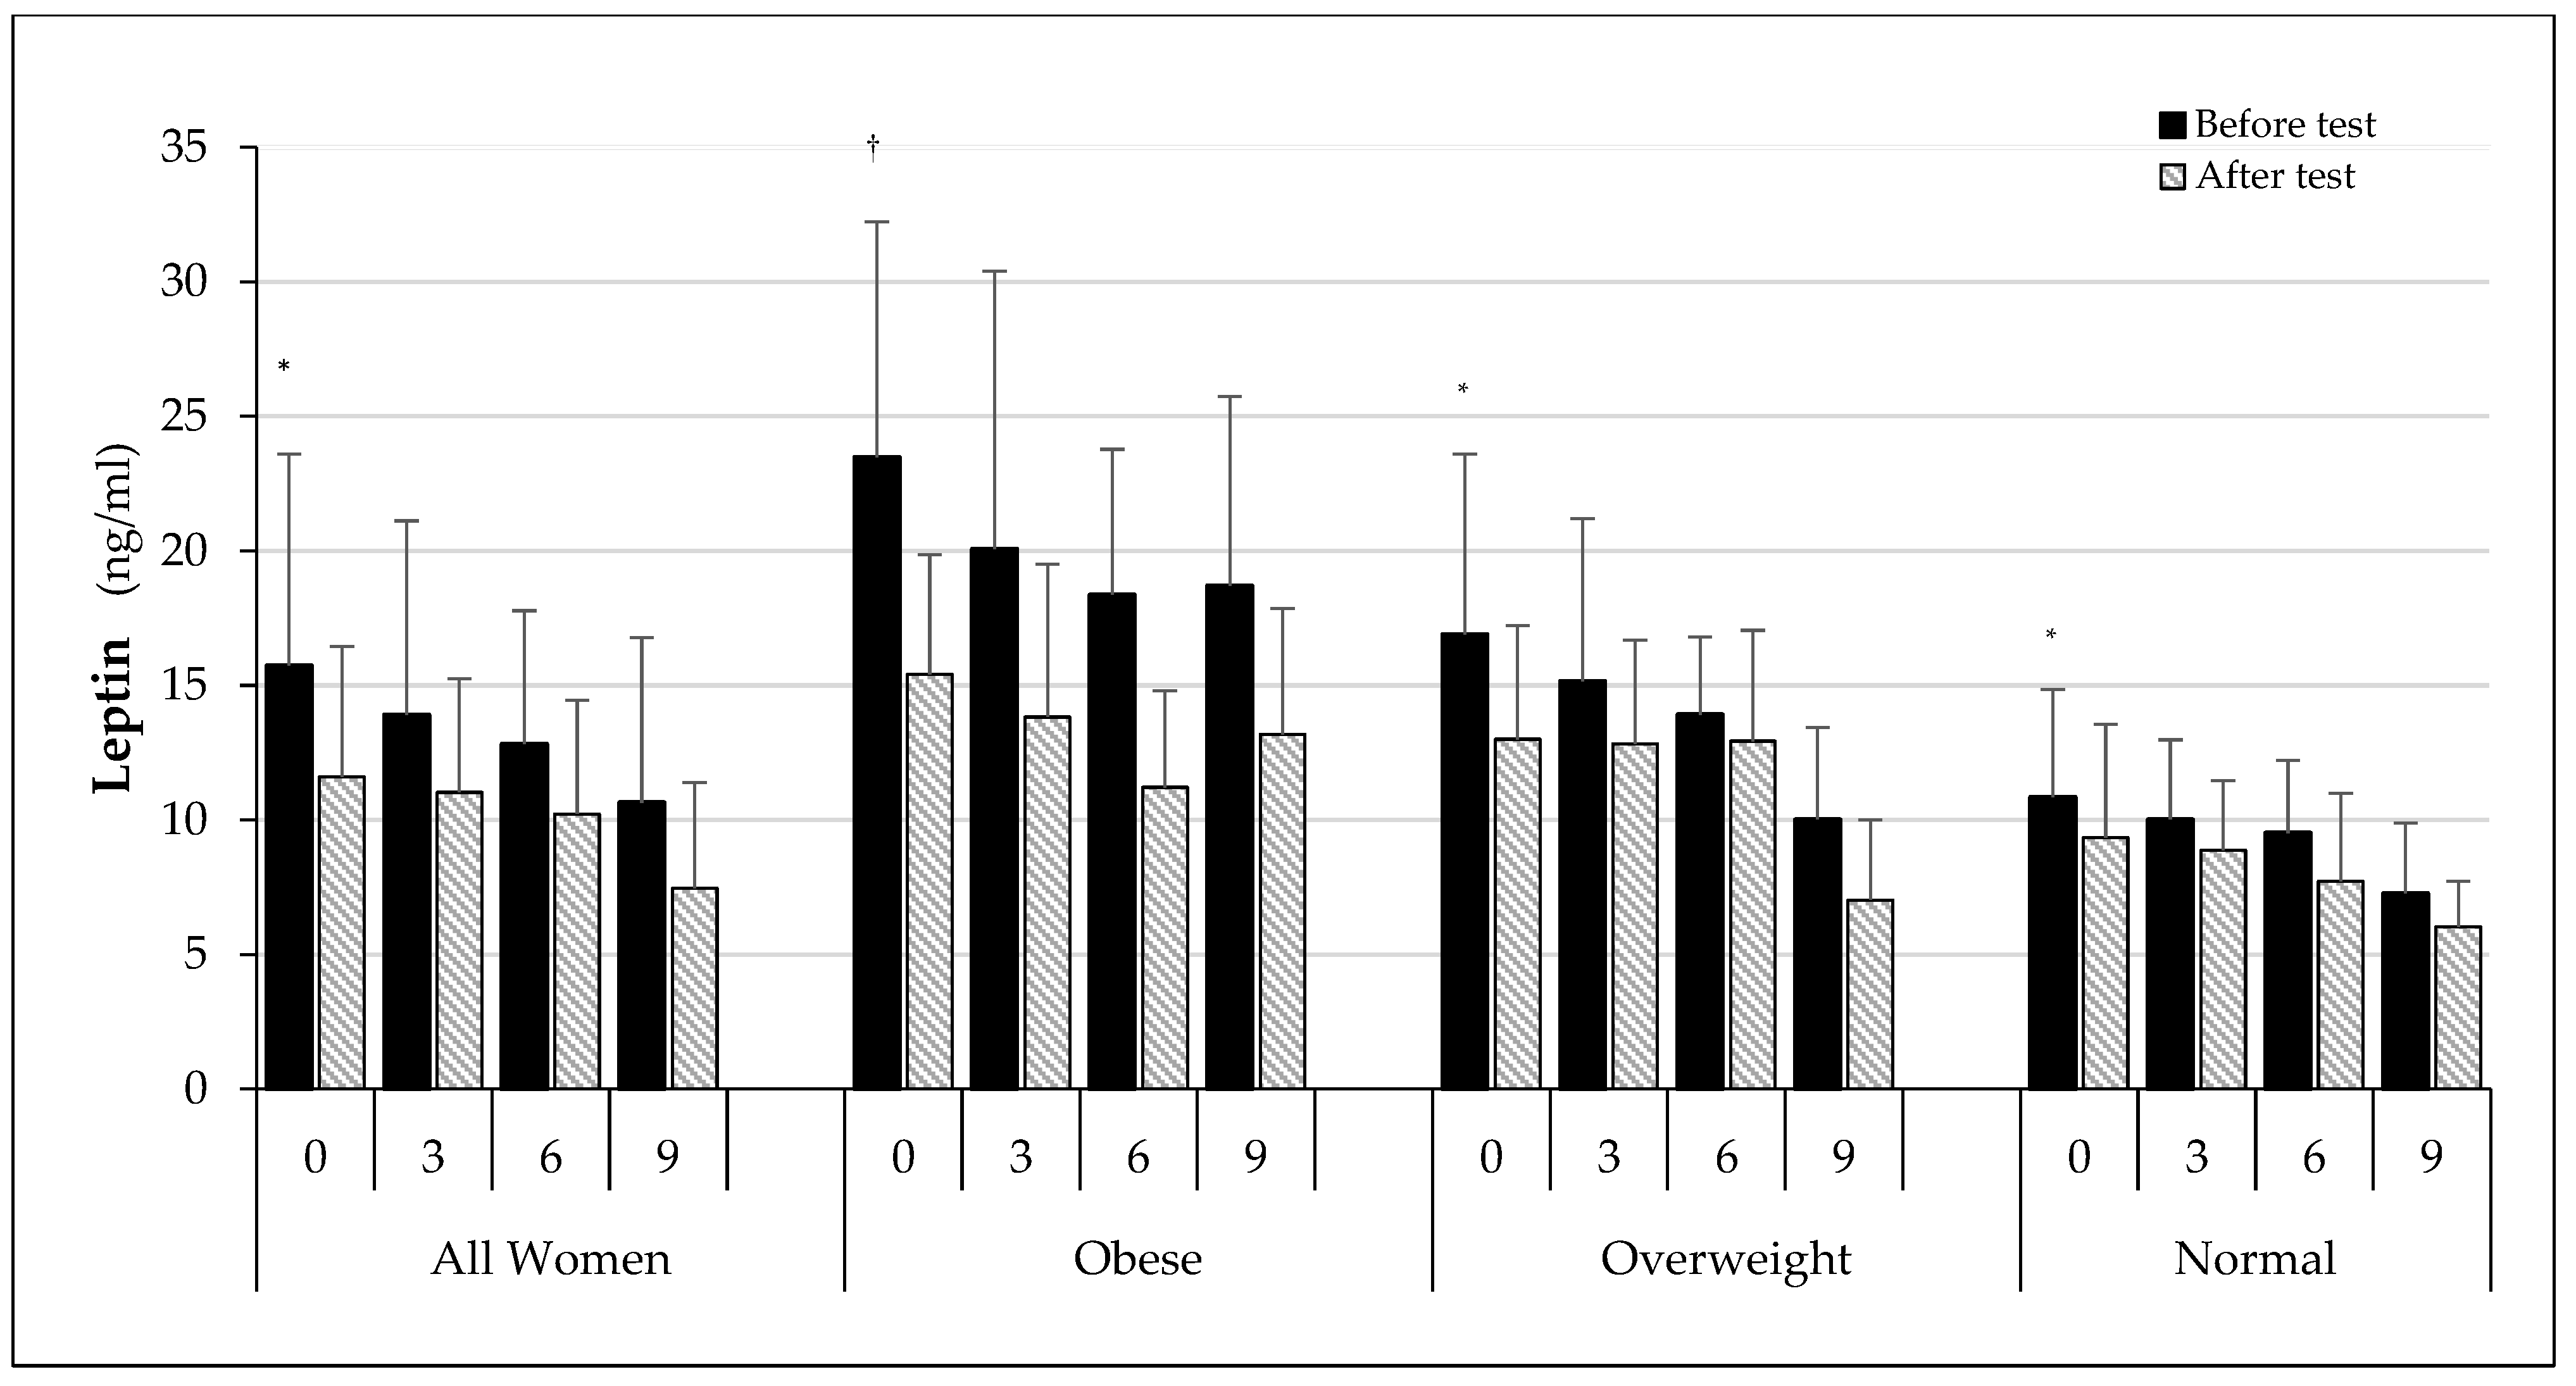
3. Results
3.1. Anthropometric Parameters
3.2. Training Intensity and Physical Performance
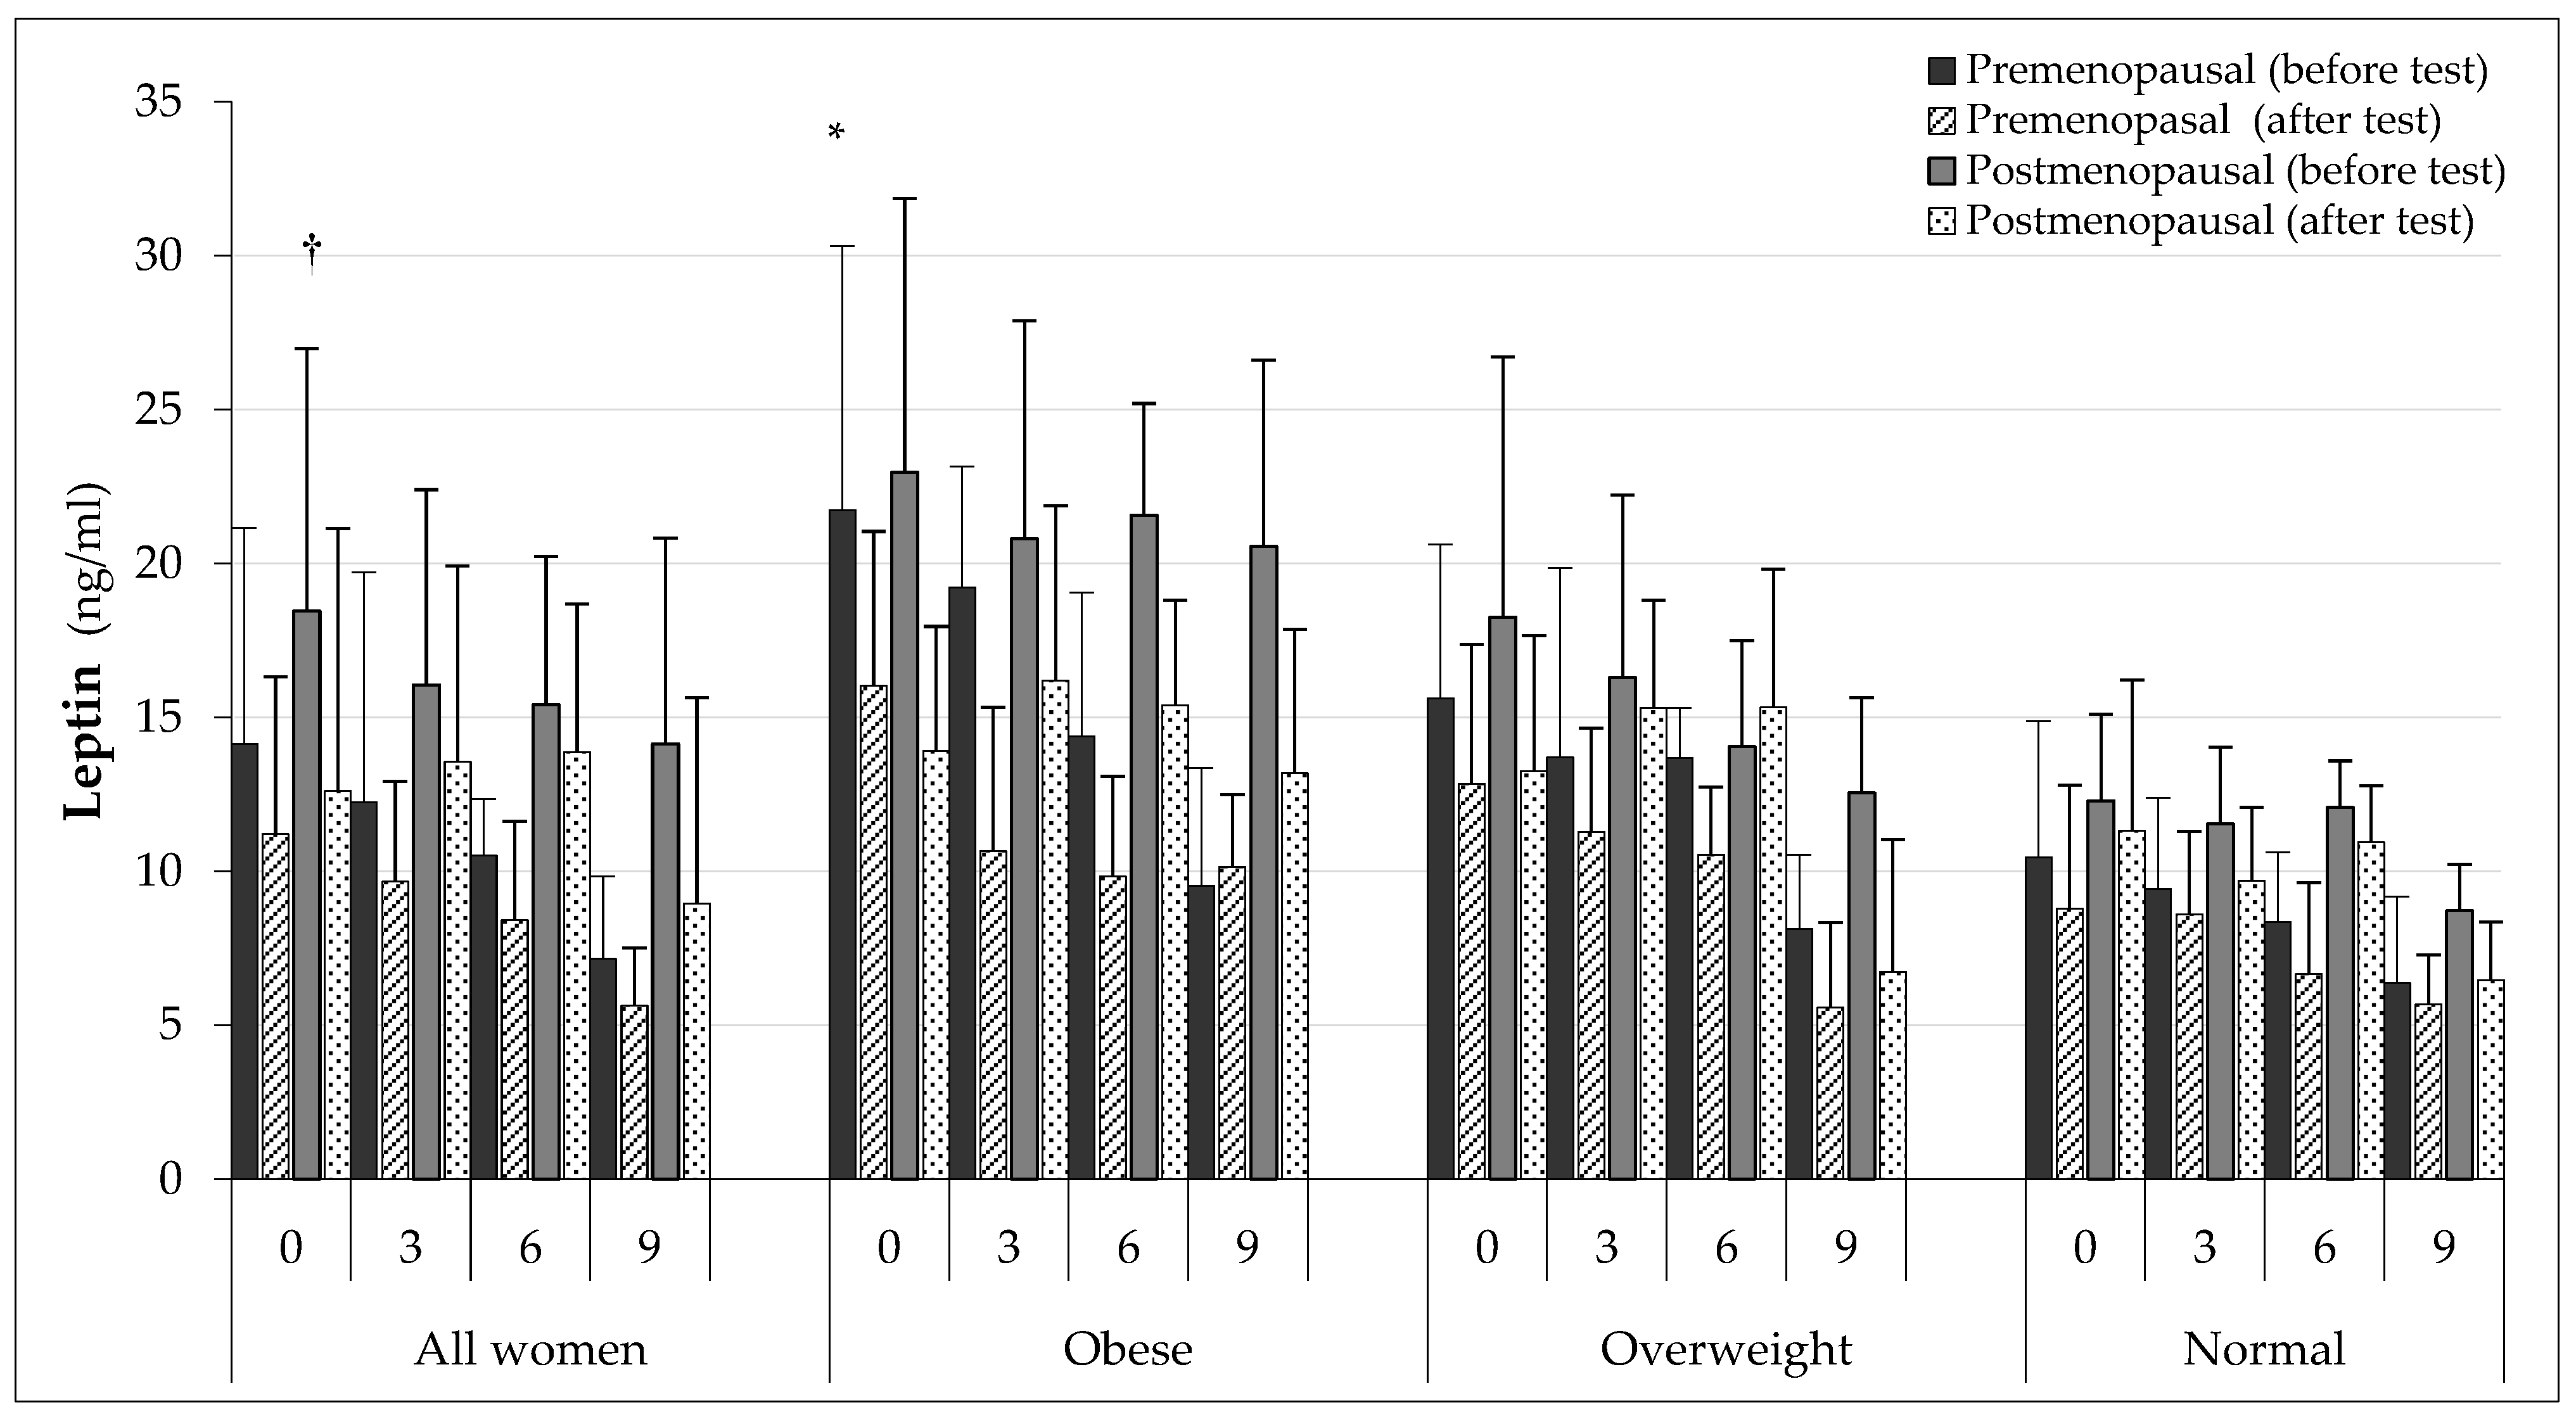
3.3. Biochemical Test
4. Discussion
5. Conclusions
Author Contributions
Funding
Institutional Review Board Statement
Informed Consent Statement
Data Availability Statement
Acknowledgments
Conflicts of Interest
References
- Bays, H.E.; González-Campoy, J.M.; Bray, G.A.; Kitabchi, A.E.; Bergman, D.A.; Schorr, A.B.; Rodbard, H.W.; Henry, R.R. Pathogenic potential of adipose tissue and metabolic consequences of adipocyte hypertrophy and increased visceral adiposity. Expert. Rev. Cardiovasc. Ther. 2008, 6, 343–368. [Google Scholar] [PubMed]
- Hube, F.; Lietz, U.; Igel, M.; Jensen, P.B.; Tornqvist, H.; Joost, H.G.; Hauner, H. Differences in leptin mRNA levels between omental and subcutaneos abdominal adipose tissue from obese humans. Horm. Metab. Res. 1996, 28, 690–693. [Google Scholar] [CrossRef]
- Sommer, C.; Lee, S.; Gulseth, H.L.; Jensen, J.; Drevon, C.A.; Birkeland, K.I. Soluble leptin receptor predicts insulin sensitivity and correlates with upregulation of metabolic pathways in men. J. Clin. Endocrinol. Metab. 2018, 103, 1024–1032. [Google Scholar] [CrossRef]
- Jequier, E. Leptin signaling, adiposity and energy balance. Ann. N. Y. Acad. Sci. 2002, 967, 379–388. [Google Scholar] [CrossRef] [PubMed]
- Obradovic, M.; Sudar-Milovanovic, E.; Soskic, S.; Essack, M.; Arya, S.; Stewart, A.J.; Gojobori, T.; Isenovic, E.R. Leptin and obesity: Role and clinical implication. Front. Endocrinol. 2021, 12, 585887. [Google Scholar] [CrossRef] [PubMed]
- Silha, J.V.; Krsek, M.; Skrha, J.V.; Sucharda, P.; Nyomba, B.L.; Murphy, L.J. Plasma resistin, adiponectin and leptin levels in lean and obese subjects: Correlations with insulin resistance. Eur. J. Endocrinol. 2003, 149, 331–335. [Google Scholar] [CrossRef] [PubMed]
- Sinha, M.H.; Caro, J.F. Clinical aspects of leptin. Vitam. Horm. 1998, 54, 1–30. [Google Scholar] [PubMed]
- Sinha, M.K.; Opentanova, I.; Ohannesian, P.J.; Kolaczyński, J.W.; Heiman, M.L.; Hale, J.; Becker, G.W.; Bowsher, R.R.; Stephens, T.W.; Caro, J.F. Evidence of free and bound leptin in human circulation. Studies in lean and obese subjects and during short-term fasting. J. Clin. Invest. 1996, 98, 1277–1282. [Google Scholar] [CrossRef]
- Misch, M.; Puthanveetil, P. The Head-to-Toe Hormone: Leptin as an Extensive Modulator of Physiologic Systems. Int. J. Mol. Sci. 2022, 23, 5439. [Google Scholar] [CrossRef]
- Ahima, R.S.; Lazar, M.A. Adipokines and the peripheral and neural control of energy balance. Molec. Endocrinol. 2008, 22, 1023–1031. [Google Scholar] [CrossRef]
- Trayhurn, P.; Bing, C. Appetite and energy balance signals from adipocytes. Philos. Trans. R Soc. Lond. B Biol. Sci. 2006, 361, 1237–1249. [Google Scholar] [CrossRef] [PubMed]
- Trayhurn, P.; Wood, S. Adipokines: Inflammation and the pleiotropic role of white adipose tissue. Br. J. Nutr. 2004, 92, 347–355. [Google Scholar] [CrossRef] [PubMed]
- Veniant, M.M.; LeBel, C.P. Leptin: From animals to humans. Curr. Pharm. Des. 2003, 9, 811–818. [Google Scholar] [CrossRef] [PubMed]
- Chan, Y.Y.; Clifton, D.K.; Steiner, R.A. Role of NPY neurones in GH-dependent feedback signalling to the brain. Horm. Res. 1996, 145, 12–14. [Google Scholar] [CrossRef] [PubMed]
- Magni, P. Hormonal control of the neuropeptide system. Curr. Protein Pept. Sci. 2003, 4, 45–57. [Google Scholar] [CrossRef] [PubMed]
- Jackson, M.B.; Ahima, R.S. Neuroendocrine and metabolic effects of adipocyte-derived hormones. Clin. Sci. 2006, 110, 143–152. [Google Scholar] [CrossRef]
- Skowrońska, B.; Fichna, M.; Fichna, P. Adipose tisse role in endocrine system. Endokrynol. Otył. Zab. Przem. Mat. 2005, 1, 21–29. [Google Scholar]
- Ronti, T.; Lupattelli, G.; Mannarino, E. The endocrine function of adipose tissue: An update. Clin. Endocrin. 2006, 64, 355–365. [Google Scholar] [CrossRef]
- Margetic, S.; Gazzola, C.; Pegg, G.G.; Hill, R.A. Leptin: A review of its paripheral actions and interactions. Int. J. Obes. 2002, 26, 1407–1433. [Google Scholar] [CrossRef]
- Klein, C.; Coppack, S.W.; Mohamed-Alli, V.; Landt, M. Adipose tissue leptin production and plasma leptin kinetics in humans. Diabetes 1996, 45, 984–987. [Google Scholar] [CrossRef]
- Haffner, S.M.; Miettinen, H.; Karhapää, P.; Mykkänen, L.; Laakso, M. Leptin concentrations, sex hormone, and cortisol in nondiabetic men. J. Clin. Endocrinol. Metab. 1997, 82, 1807–1809. [Google Scholar] [CrossRef] [PubMed]
- Mantzoros, C.S.; Magkos, F.; Brinkoetter, M.; Sienkiewicz, E.; Dardeno, T.A.; Kim, S.Y.; Hamnvik, O.P.; Koniaris, A. Leptin in human physiology and pathophysiology. Am. J. Physiol. Endocrinol. Metab. 2011, 301, E567–E584. [Google Scholar] [CrossRef] [PubMed]
- Luukkaa, V.; Pesonen, U.; Huhtaniemi, I.; Lehtonen, A.; Tilvis, R.; Tuomilehto, J.; Koulu, M.; Huupponen, R. Inverse correlation between serum testosterone and leptin in men. J. Clin. Endocrinol. Metab. 1998, 83, 3243–3246. [Google Scholar] [CrossRef] [PubMed][Green Version]
- Meier, U.; Gressner, A.M. Endocrine regulation of energy metabolism: Review of pathobiochemical and clinical chemical aspects of leptin, ghrelin, adiponectina and resistin. Clin. Chem. 2004, 50, 1511–1525. [Google Scholar] [CrossRef]
- Kodama, S.; Saito, K.; Tanaka, S.; Maki, M.; Yachi, Y.; Asami, M.; Sugawara, A.; Totsuka, K.; Shimano, H.; Ohashi, Y.; et al. Cardiorespiratory fitness as a quantitative predictor of all-cause mortality and cardiovascular events in healthy men and women: A meta-analysis. JAMA 2009, 301, 2024–2035. [Google Scholar] [CrossRef]
- Milewicz, T.; Krzysiek, J.; Janczar-Saif, A.; Sztefko, K.; Krzyczkowska-Sendrakowska, M. Zaleźność stężenia leptyny od wieku, poziomu insuliny, SHBG i hormonów płciowych u kobiet. Endokryn. Pol. 2005, 56, 883–890. [Google Scholar]
- Yafasova, A.; Mandrup, C.M.; Egelund, J.; Nyberg, M.; Stallknecht, B.; Hellsten, Y.; Nielsen, L.B.; Christoffersen, C. Effect of menopause and exercise training on plasma apolipoprotein M and sphingosine-1-phosphate. J. Appl. Physiol. (1985) 2019, 126, 214–220. [Google Scholar] [CrossRef]
- Hickey, M.S.; Houmard, J.A.; Considine, R.V.; Tyndall, G.L.; Midgette, J.B.; Gavigan, K.E.; Weidner, M.L.; McCammon, M.R.; Israel, R.G.; Caro, J.F. Gender-dependent effects of exercise training on serum leptin levels in humans. Am. J. Physiol. 1997, 272, 562–566. [Google Scholar] [CrossRef]
- Murawska-Cialowicz, E.; Wolanski, P.; Zuwala-Jagiello, J.; Feito, Y.; Petr, M.; Kokstejn, J.; Stastny, P.; Goliński, D. Effect of HIIT with Tabata Protocol on Serum Irisin, Physical Performance, and Body Composition in Men. Int. J. Environ. Res. Public Health 2020, 17, 3589. [Google Scholar] [CrossRef]
- Kraemer, R.R.; Chu, H.; Castracane, V.D. Leptin and exercise. Exp. Biol. Med. 2002, 227, 701–708. [Google Scholar] [CrossRef]
- Desgorces, F.D.; Chennaoui, M.; Gomez-Merino, D.; Drogou, C.; Guezennec, C.Y. Leptin response to acute prolonged exercise after training in rowers. Eur. J. Appl. Physiol. 2004, 91, 677–681. [Google Scholar] [CrossRef] [PubMed]
- Desgorces, F.D.; Chennaoui, M.; Gomez-Merino, D.; Drogou, C.; Bonneau, D.; Guezennec, C.Y. Leptin, catecholamines and free fatty acids related to reduced recovery delays after training. Eur. J. Appl. Physiol. 2004, 93, 153–158. [Google Scholar] [CrossRef] [PubMed]
- Ramazan, S.; Balci, M.K.; Balci, N.; Karayalcin, U. Acute effect of exercise on plasma leptin level and insulin resistance in obese women with stable caloric intake. Endocrinol. Res. 2007, 32, 9–17. [Google Scholar]
- Ozcelik, O.; Celik, H.; Agar, A.; Serhatlioglu, S.; Kelestimur, H. Investigation of the influence of training status on the relationship between the acute exercise and serum leptin levels in obese females. Neuroendocrinol. Lett. 2004, 25, 381–385. [Google Scholar] [PubMed]
- Charmas, M.; Opaszowski, B.H.; Charmas, R.; Jówko, E.; Sadowski, J.; Dorofeyeva, L. Hormonal and metabolit response in middle-aged women to moderate physical effort during aerobics. J. Strength Cond. Res. 2009, 23, 954–961. [Google Scholar] [CrossRef]
- Elias, A.N.; Pandian, M.R.; Wang, L.; Suarez, E.; James, N.; Wilson, A.F. Leptin and IGF-I levels in unconditioned male volunteers after short-term exercise. Psychoneuroendocrinology 2000, 25, 453–461. [Google Scholar] [CrossRef]
- Gibney, J.; Healy, M.L.; Sönksen, P.H. The growth hormone/insulin-like growth factor-I axis in exercise and sport. Endocrin. Rev. 2007, 28, 603–624. [Google Scholar] [CrossRef]
- Ehrynborg, C.; Lange, K.H.W.; Dall, R.; Christiansen, J.S.; Lundberg, P.A.; Baxter, R.C.; Boroujerdi, M.A.; Bengtsson, B.A.; Healey, M.L.; Pentecost, C.; et al. The growth hormone/insulin-like growth factor-axis hormones and bone markers in elite athletes in response to a maximum exercise test. J. Clin. Endocrinol. Metab. 2003, 88, 394–401. [Google Scholar] [CrossRef]
- Trujillo, M.E.; Sullivan, S.; Harten, I.; Schneider, S.H.; Greenberg, A.S.; Fried, S.K. Interleukin–6 regulates human adipose tissue lipid metabolism and leptin production in vitro. JCEM 2004, 89, 5577–5582. [Google Scholar] [CrossRef]
- Nemet, D.; Eliakim, A.; Zaldivar, F.; Cooper, D.M. Effect of rhIL-6 infusion on GH/IGF-I axis mediators in humans. Am. J. Physiol. Regul. Integr. Comp. Physiol. 2006, 291, 1663–1668. [Google Scholar] [CrossRef]
- Ropelle, E.R.; Fernandes, M.F.A.; Flores, M.B.S.; Ueno, M.; Rocco, S.; Marin, R.; Cintra, D.E.; Velloso, L.A.; Franchini, K.G.; Saad, M.J.A.; et al. Central exercise action increases the AMPK and mTOR response to leptin. PLoS ONE 2008, 3, 3856. [Google Scholar] [CrossRef] [PubMed]
- Cocchi, D.; De Gennaro Colonna, V.; Bagnasco, M.; Bonacci, D.; Muller, E.E. Leptin regulates GH secretion in the rat by acting on GHRH and somatostatinergic functions. J. Endocrinol. 1999, 162, 95–99. [Google Scholar] [CrossRef] [PubMed][Green Version]
- Scacchi, M.; Pincelli, A.I.; Cavagnini, F. Growth hormone in obesity. Int. J. Obes. Relat. Metab. Disord. 1999, 23, 260–271. [Google Scholar] [CrossRef] [PubMed]
- Rodríguez-Pacheco, F.; Luque, R.M.; Tena-Sempere, M.; Malagón, M.M.; Castaño, J.P. Ghrelin induces growth hormone secretion via a nitric oxide/cGMP signalling pathway. J. Neuroendocrinol. 2008, 20, 406–412. [Google Scholar] [CrossRef]
- Foster-Schubert, K.E.; McTiernan, A.; Scott Frayo, R.; Schwartz, R.S.; Rajan, K.B.; Yutaka, Y.; Tworoger, S.S.; Cummings, D.E. Human plasma ghrelin levels increase during a one-year exercise program. J. Clin. Endocrinol. Metab. 2005, 9, 820–825. [Google Scholar] [CrossRef]
- Faggioni, R.; Giamila Fantuzzi, G.; Fuller, J.; Dinarello, C.A.; Feingold, K.R.; Grunfeld, C. IL-1b mediates leptin induction during inflammation. Am. J. Physiol. (Regul. Integr. Comp. Physiol.) 1898, 43, R204–R208. [Google Scholar]
- Antonioli, L.; Moriconi, D.; Masi, S.; Bottazzo, D.; Pellegrini, C.; Fornai, M.; Anselmino, M.; Ferrannini, E.; Blandizzi, C.; Taddei, S.; et al. Differential impact of weight loss and glycemic control on inflammasome signaling. Obesity (Silver Spring) 2020, 28, 609–615. [Google Scholar] [CrossRef]
- Murawska-Ciałowicz, E.; Jethon, Z.; Milczarska, J. Effect of endurance exercise on blood levels of leptin in women and men. Przeg. Lek. 2003, 60, 91–94. [Google Scholar]
- Bouassida, A.; Zalleg, D.; Bouassida, S.; Zaouali, M.; Feki, Y.; Zbidi, A.; Tabka, Z. Leptin its implication in physical exercise and training: A short review. J. Sports Sci. Med. 2006, 5, 172–181. [Google Scholar]
- Hilton, L.K.; Loucks, A.B. Low energy availability, not exercise stress, suppresses the diurnal rhythm of leptin in healthy young women. Am. J. Physiol. Endocrinol. Metab. 2000, 278, 43–49. [Google Scholar] [CrossRef]
- Torjman, M.C.; Zafeiridis, A.; Paolone, A.M.; Wilkerson, C.; Considine, R.V. Serum leptin during recovery following maximal incremental and prolonged exercise. Inr. J. Sports Med. 1999, 20, 444–450. [Google Scholar] [CrossRef]
- Bouassida, A.; Chatard, J.C.; Chamari, K.; Zaouali, M.; Feki, Y.; Gharbi, N.; Zbidi, A.; Tabka, Z. Effect of energy expenditure and training status on leptin response to sub-maximal cycling. J. Sports Sci. Med. 2009, 8, 190–196. [Google Scholar]
- Mueller, W.M.; Gregoire, F.M.; Stanhope, K.L.; Mobbs, C.V.; Mizuno, T.M.; Warden, C.H.; Stern, J.S.; Havel, P.J. Evidence that glukose metabolism regulates leptin secretion from cultured rat adipocytes. Endocrinology 1998, 139, 551–558. [Google Scholar] [CrossRef]
- Couillard, C.; Mouriege, P.; Prud’homme, D.; Nadeau, A.; Tremblay, A.; Bouchard, C.; Despres, J.P. Plasma leptin concentrations: Gender differences and associations with metabolic risk factors for cardiovascular disease. Diabetologia 1997, 40, 1178–1184. [Google Scholar] [CrossRef]
- Boden, G.; Chen, X.; Mozzoli, M.; Ryan, I. Effect of fasting on serum leptin in normal human subjects. J. Clin. Endocrinol. Metab. 1996, 81, 3419–3423. [Google Scholar]
- Nindl, B.C.; Kraemer, W.J.; Arciero, P.J.; Samatallee, N.; Leone, C.D.; Mayo, M.F.; Hafeman, D.L. Leptin concentrations experience a delayed reduction after resistance exercise in men. Med. Si. Sports Exerc. 2002, 34, 608–613. [Google Scholar]
- Vatansever-Ozen, S.; Tiryaki-Sonmez, G.; Yuktasir, B.; Yalcin, H.B.; Bugdayci, G.; Willems, M. Effects of exercise on leptin and acylated ghrelin hormones in trained males. J. Exerc. Physiol. 2010, 12, 20–30. [Google Scholar]
- Tremblay, A.; Dutheil, F.; Drapeau, V.; Metz, L.; Lesour, B.; Chapier, R.; Pereira, B.; Verney, J.; Baker, J.S.; Vinet, A.; et al. Long-term effects of high-intensity resistance and endurance exercise on plasma leptin and ghrelin in overweight individuals: The RESOLVE Study. Appl. Physiol. Nutr. Metab. 2019, 44, 1172–1179. [Google Scholar] [CrossRef]
- Zaman, G.S.; Abohashrh, M.; Ahmad, I.; Dera, A.A.; Alshahrani, M.S.; Ahmad, I.; Alam, M.M.; Mahmood, S.E.; Mansuri, N.; Irfan, S.; et al. The Impact of Body Resistance Training Exercise on Biomedical Profile at High Altitude: A Randomized Controlled Trial. Bio. Med. Res. Int. 2021, 2021, 6684167. [Google Scholar] [CrossRef]
- Karamouzis, I.; Karamouzis, M.; Vrabas, I.S.; Christoulas, K.; Kyriazis, N.; Giannoulis, E.; Mandroukas, K. The effects of marathon swimming on serum leptin and plasma neuropeptide Y levels. Clin. Chem. Lab. Med. 2002, 40, 132–136. [Google Scholar] [CrossRef]
- Zaccaria, M.; Ermolao, A.; Roi, G.S.; Englaro, P.; Tegon, G.; Varnier, M. Leptin reduction after endurance races differing in duration and energy expenditure. Eur. J. Appl. Physiol. 2002, 87, 108–111. [Google Scholar] [CrossRef] [PubMed]
- Leal-Cerro, A.; Garcia-Luna, P.P.; Astorga, R.; Parejo, J.; Peino, R.; Dieguez, C.; Casanueva, F.F. Serum leptin levels in male marathon athletes before and after the marathon run. J. Clin. Endocrinol. Metab. 1998, 83, 2376–2379. [Google Scholar] [CrossRef] [PubMed]


| Group | All Women (AW) | Obese (O) | Overweight (OW) | Normal (N) |
|---|---|---|---|---|
| Premenopausal (PRE) | 38.24 ± 8.32 (n = 42) | 38.07 ± 7,74 (n = 12) | 40.05 ± 8,36 (n = 13) | 37.81 ± 8.30 (n = 17) |
| Postmenopausal (POST) | 56.67 ± 5.58 (n = 33) | 55.26 ± 4.58 (n = 13) | 57.19 ± 5.54 (n = 11) | 54.93 ± 4.39 (n = 9) |
| Parameter | Stage | All Women (AW) | Obese (O) | Overweight (OW) | Normal (N) |
|---|---|---|---|---|---|
| 0 | 70.51 ± 12.73 # | 86.67 ± 12.15 †,†† | 71.79 ± 6.12 ## | 60.68 ± 5.36 | |
| Body mass | 3 | 70.06 ± 10.09 ## | 83.81 ± 10.15 # | 70.23 ± 5.61 | 62.18 ± 4.01 |
| (kg) | 6 | 68.34 ± 8.99 | 79.97 ± 7.08 ## | 69.83 ± 5.61 | 61.86 ± 4.13 |
| 9 | 67.33 ± 9.56 | 76.47 ± 6.36 | 68.10 ± 5.13 | 59.67 ± 5.67 | |
| 0 | 26.49 ± 4.49 ## | 32.67 ± 2.43 # | 26.98 ± 1.46 # | 22.68 ± 1.78 | |
| BMI | 3 | 26.43 ± 3.63 ## | 31.59 ± 2.81 # | 26.97 ± 1.29 | 23.08 ± 1.83 |
| (kg/m2) | 6 | 25.69 ± 3.88 | 30.83 ± 2.44 | 25.75 ± 1.68 | 22.58 ± 1.86 |
| 9 | 25.50 ± 3.66 | 29.54 ± 2.17 | 24.46 ± 2.67 | 22.35 ± 1.85 | |
| 0 | 34.63 ± 5.82 | 41.35 ± 3.28 # | 35.75 ± 2.10 | 28.98 ± 3.78 | |
| FAT | 3 | 34.34 ± 5.25 | 40.93 ± 4.53 ## | 35.28 ± 2.86 | 30.13 ± 3.82 |
| (%) | 6 | 33.75 ± 5.64 | 40.21 ± 3.81 | 35.36 ± 3.99 | 29.66 ± 3.62 |
| 9 | 33.78 ± 5.46 | 38.58 ± 3.77 | 35.47 ± 3.97 | 29.36 ± 3.95 | |
| 0 | 25.13 ± 8.58 † | 35.82 ± 7.07 † | 25.59 ± 4.53 # | 17.84 ± 3.38 | |
| FAT | 3 | 24.30 ± 6.66 | 34.30 ± 6.49 # | 24.79 ± 2.79 | 18.84 ± 3.00 |
| (kg) | 6 | 23.72 ± 6.72 | 32.60 ± 5.06 | 24.49 ± 3.64 | 18.60 ± 3.46 |
| 9 | 23.15 ± 6.52 †† | 29.53 ± 4.44 | 24.18 ± 5.26 | 17.80 ± 3.80 | |
| 0 | 157.90 ± 13.60 † | 155.30 ± 14.35 † | 158.20 ± 13.65 † | 158.90 ± 13.22 † | |
| HR | 3 | 152.50 ± 13.91 | 148.10 ± 12.37 | 153.80 ± 13.68 | 152.20 ± 14.57 ## |
| (b/min) | 6 | 148.80 ± 14.83 | 145.60 ± 12.25 | 146.50 ± 11.66 | 151.50 ± 17.19 |
| 9 | 146.60± 14.30 | 141.40 ± 13.55 | 146.70 ± 9.55 | 148.10 ± 16.62 | |
| 0 | 27.04 ± 7.94 | 20.87 ± 5.79 | 25.01 ± 4.96 | 31.81 ± 7.97 * | |
| VO2max | 3 | 28.60 ± 8.20 | 23.63 ± 5.28 | 27.06 ± 6.38 | 33.32 ± 8.85 ** |
| (ml/kg/min) | 6 | 31.65 ± 9.75 | 26.01 ± 5.65 | 29.13 ± 5.86 ### | 34.55 ± 10.82 *** |
| 9 | 33.49 ± 9.41 ††† | 30.23 ± 5.59 ††† | 31.04 ± 8.72 ††† | 37.11 ± 10.46 ††† |
Publisher’s Note: MDPI stays neutral with regard to jurisdictional claims in published maps and institutional affiliations. |
© 2022 by the authors. Licensee MDPI, Basel, Switzerland. This article is an open access article distributed under the terms and conditions of the Creative Commons Attribution (CC BY) license (https://creativecommons.org/licenses/by/4.0/).
Share and Cite
Murawska-Ciałowicz, E.; Kaczmarek, A.; Kałwa, M.; Oniszczuk, A. Influence of Training and Single Exercise on Leptin Level and Metabolism in Obese Overweight and Normal-Weight Women of Different Age. Int. J. Environ. Res. Public Health 2022, 19, 12168. https://doi.org/10.3390/ijerph191912168
Murawska-Ciałowicz E, Kaczmarek A, Kałwa M, Oniszczuk A. Influence of Training and Single Exercise on Leptin Level and Metabolism in Obese Overweight and Normal-Weight Women of Different Age. International Journal of Environmental Research and Public Health. 2022; 19(19):12168. https://doi.org/10.3390/ijerph191912168
Chicago/Turabian StyleMurawska-Ciałowicz, Eugenia, Agnieszka Kaczmarek, Małgorzata Kałwa, and Anna Oniszczuk. 2022. "Influence of Training and Single Exercise on Leptin Level and Metabolism in Obese Overweight and Normal-Weight Women of Different Age" International Journal of Environmental Research and Public Health 19, no. 19: 12168. https://doi.org/10.3390/ijerph191912168
APA StyleMurawska-Ciałowicz, E., Kaczmarek, A., Kałwa, M., & Oniszczuk, A. (2022). Influence of Training and Single Exercise on Leptin Level and Metabolism in Obese Overweight and Normal-Weight Women of Different Age. International Journal of Environmental Research and Public Health, 19(19), 12168. https://doi.org/10.3390/ijerph191912168