
Stunting as a Synonym of Social Disadvantage and Poor Parental Education

 , ,
, , 
Abstract
1. Introduction
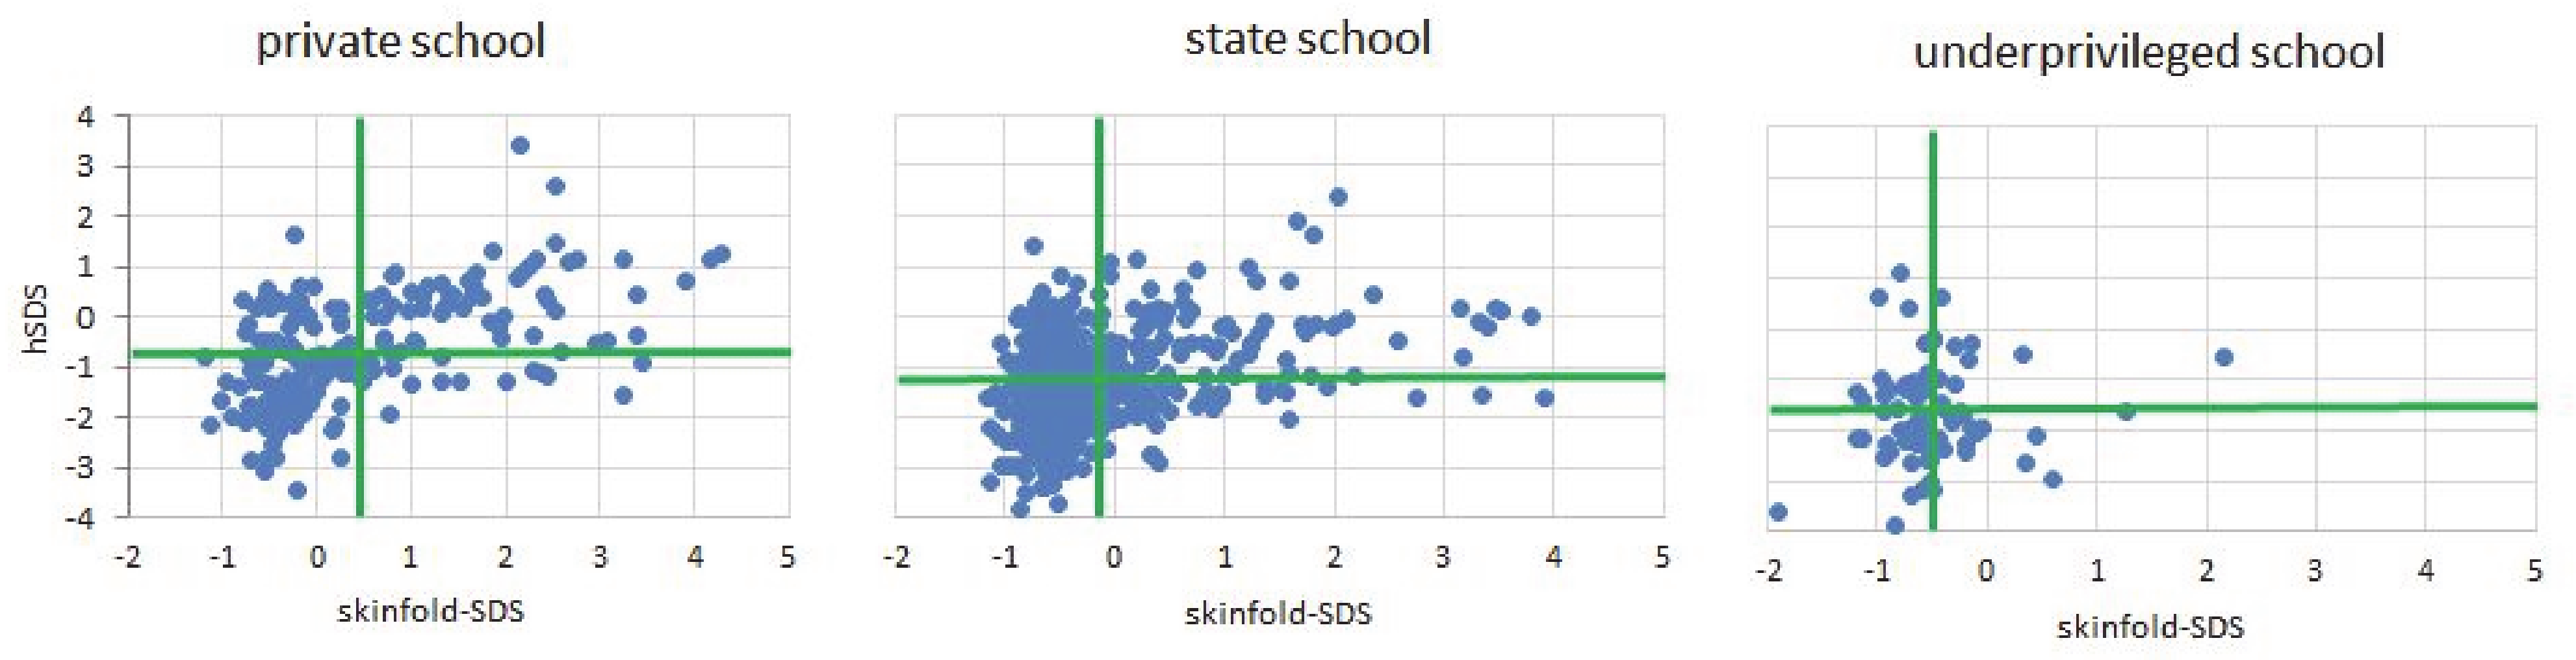
- The shortness in height of SEPE disadvantaged children is not associated with anthropometric indicators of poor nutrition.
- SEPE disadvantaged children are delayed in dental development, and
- SEPE disadvantaged children show lower self-confidence, and consider their fathers’ social role as inferior.
- A lack of parental school attainment is associated with short stature.
2. Sample and Methods
2.1. Participants and Design
2.2. Procedure
2.3. Instruments
2.4. Data Analysis
3. Results
4. Discussion
4.1. Summary of Main Results
4.2. Interpretation of the Main Results
4.3. Implications to Parents, Policymakers, Administrators or Clinicians
4.4. Strengths and Limitations
5. Conclusions
Author Contributions
Funding
Institutional Review Board Statement
Informed Consent Statement
Data Availability Statement
Conflicts of Interest
Abbreviations
| BMI_SDS | body mass index SDS |
| CI | confidence interval |
| EDUfather | father’s maximum educational achievement |
| EDUmother | mother’s maximum educational achievement |
| FI | Frame Index: elbow breadth divided by body height |
| GRP | gross regional product |
| hSDS | height SDS |
| LADDERself_SDS | SDS of subjective self-confidence |
| LADDfath_SDS | SDS of the perceived social status of the father |
| MUAC_SDS | mid-upper arm circumference SDS |
| SDS | standard deviation score |
| SEPE | social, economic, political and emotional condition |
| sittheight_SDS | sitting height SDS |
| skinfold_SDS | sum of triceps and subscapular skinfold SDS |
| toothsum_SDS | sum of erupted permanent teeth SDS |
| TVfW_SCORE | household score derived from availability of water, television, and refrigerator |
| SF | average of three measurements of triceps and three measurements of subscapular skinfold thickness |
References
- Scheffler, C.; Hermanussen, M.; Bogin, B.; Liana, D.S.; Taolin, F.; Cempaka, P.M.V.P.; Irawan, M.; Ibbibah, L.F.; Mappapa, N.K.; Payong, M.K.E.; et al. Stunting Is Not a Synonym of Malnutrition. Eur. J. Clin. Nutr. 2019. [Google Scholar] [CrossRef]
- Wit, J.-M.; Boersma, B. Catch-up Growth: Definition, Mechanisms, and Models. J. Pediatr. Endocrinol. Metab. 2002, 15 (Suppl. 5), 1229–1241. [Google Scholar]
- Scheffler, C.; Bogin, B.; Hermanussen, M. Catch-up Growth Is a Better Indicator of Undernutrition than Thresholds for Stunting. Public Health Nutr. 2020, 1–10. [Google Scholar] [CrossRef]
- Schlesinger, E. Wachstum, Gewicht Und Konstitution Der Kinder Und Der Heranwachsenden Jugend Während Des Krieges. Z. Für Kinderheilkd. 1919, 22, 80–123. [Google Scholar]
- Hermanussen, M.; Bogin, B.; Scheffler, C. Stunting, Starvation and Refeeding: A Review of Forgotten 19th and Early 20th Century Literature. Acta Paediatr. 2018, 107, 1166–1176. [Google Scholar] [CrossRef] [PubMed]
- Pfaundler, M. Körpermaß-Studien an Kindern. Z. Für Kinderheilkd. 1916, 14, 1–148. [Google Scholar] [CrossRef]
- Scheffler, C.; Hermanussen, M.; Rogol, A. Stunting: Historical Lessons That Catch-up Growth Tells Us for Mapping Growth Restoration. Arch. Dis. Child. 2020. [Google Scholar] [CrossRef] [PubMed]
- Karlsson, O.; Neve, J.-W.; Subramanian, S.V. Weakening Association of Parental Education: Analysis of Child Health Outcomes in 43 Low- and Middle-Income Countries. Int. J. Epidemiol. 2019, 48, 83–97. [Google Scholar] [CrossRef]
- Mensch, B.S.; Chuang, E.K.; Melnikas, A.J.; Psaki, S.R. Evidence for Causal Links between Education and Maternal and Child Health: Systematic Review. Trop. Med. Int. Health 2019, 24, 504–522. [Google Scholar] [CrossRef]
- Groth, D.; Scheffler, C.; Hermanussen, M. Body Height in Stunted Indonesian Children Depends Directly on Parental Education and Not via a Nutrition Mediated Pathway—Evidence from Tracing Association Chains by St. Nicolas House Analysis. Anthropol. Anz. 2019. [Google Scholar] [CrossRef]
- Statistics Kupang City. Available online: https://kupangkota.bps.go.id/dynamictable/2020/04/29/177/jumlah-penduduk-rumah-tangga-dan-rata-rata-anggota-rumah-tangga-kota-kupang-2010-2016-2019.html (accessed on 24 November 2020).
- West-Timor; Wikipedia, Ed.; 2020. Available online: https://en.wikipedia.org/w/index.php?title=West_Timor&oldid=980142405 (accessed on 10 December 2020).
- List of Indonesian Provinces by GRP per Capita; Wikipedia, Ed.; 2020. Available online: https://en.wikipedia.org/w/index.php?title=List_of_Indonesian_provinces_by_GRP_per_capita&oldid=988332143 (accessed on 23 November 2020).
- Bogin, B. Patterns of Human Growth; Cambridge University Press: Cambridge, UK, 2020; ISBN 978-1-108-37997-7. [Google Scholar]
- Green, L.J. The Interrelationships among Height, Weight and Chronological, Dental and Skeletal Ages. Angle Orthod. 1961, 31, 189–193. [Google Scholar]
- Lewis, A.B. Comparisons between Dental and Skeletal Ages. Angle Orthod. 1991, 61, 87–92. [Google Scholar] [CrossRef] [PubMed]
- Kumar, V.; Venkataraghavan, K.; Krishnan, R.; Patil, K.; Munoli, K.; Karthik, S. The Relationship between Dental Age, Bone Age and Chronological Age in Underweight Children. J. Pharm. Bioallied. Sci. 2013, 5, 73–79. [Google Scholar] [CrossRef] [PubMed]
- Manjunatha, B.S.; Soni, N.K. Estimation of Age from Development and Eruption of Teeth. J. Forensic. Dent. Sci. 2014, 6, 73–76. [Google Scholar] [CrossRef] [PubMed]
- Maynard, L.M.; Wisemandle, W.; Roche, A.F.; Chumlea, W.C.; Guo, S.S.; Siervogel, R.M. Childhood Body Composition in Relation to Body Mass Index. Pediatrics 2001, 107, 344–350. [Google Scholar] [CrossRef] [PubMed]
- Wells, J.C.K. Sexual Dimorphism in Body Composition across Human Populations: Associations with Climate and Proxies for Short- and Long-Term Energy Supply. Am. J. Hum. Biol. 2012, 24, 411–419. [Google Scholar] [CrossRef]
- Scheffler, C.; Obermüller, J. Development of Fat Distribution Patterns in Children and Its Association with the Type of Body Shape Assessed by the Metric-Index. Anthr. Anz. 2012, 69, 45–55. [Google Scholar] [CrossRef]
- Pfaundler, M. Über Die Indices Der Körperfülle Und Über “Unterernährung”. Z. Für Kinderheilkd. 1921, 29, 217–244. [Google Scholar] [CrossRef]
- Wagner, R. Die Zahlenmäßige Beurteilung Des Ernährungszustandes Durch Indices. Z. Für Kinderheilkd. 1921, 28, 38–50. [Google Scholar] [CrossRef]
- Frisancho, A.R.; Garn, S.M. Skin-Fold Thickness and Muscle Size: Implications for Developmental Status and Nutritional Evaluation of Children from Honduras. Am. J. Clin. Nutr. 1971, 24, 541–546. [Google Scholar] [CrossRef]
- Friedman, J.F.; Phillips-Howard, P.A.; Mirel, L.B.; Terlouw, D.J.; Okello, N.; Vulule, J.M.; Hawley, W.A.; Nahlen, B.L.; Kuile, F. Progression of Stunting and Its Predictors among School-Aged Children in Western Kenya. Eur. J. Clin. Nutr. 2005, 59, 914–922. [Google Scholar] [CrossRef] [PubMed]
- Frisancho, A.R. Triceps Skin Fold and Upper Arm Muscle Size Norms for Assessment of Nutrition Status. Am. J. Clin. Nutr. 1974, 27, 1052–1058. [Google Scholar] [CrossRef]
- Rietsch, K.; Godina, E.; Scheffler, C. Decreased External Skeletal Robustness in Schoolchildren--a Global Trend? Ten Year Comparison of Russian and German Data. PLoS ONE 2013, 8, 68195. [Google Scholar] [CrossRef] [PubMed]
- MacArthur SES & Health Network|Research. Available online: https://macses.ucsf.edu/research/psychosocial/usladder.php (accessed on 21 December 2020).
- Bradshaw, M.; Kent, B.V.; Henderson, W.M.; Setar, A.C. Subjective Social Status, Life Course SES, and BMI in Young Adulthood. Health Psychol. 2017, 36, 682–694. [Google Scholar] [CrossRef] [PubMed]
- Amir, D.; Valeggia, C.; Srinivasan, M.; Sugiyama, L.S.; Dunham, Y. Measuring Subjective Social Status in Children of Diverse Societies. PLoS ONE 2019, 14, 0226550. [Google Scholar] [CrossRef]
- Böker, S.; Hermanussen, M.; Scheffler, C. Westernization of Self-Perception in Modern Affluent Indonesian School Children. Hum. Biol. Public Health 2021, 1. (in print). [Google Scholar]
- Kliegman, R.M.; Behrman, R.E.; Jenson, H.B.; Stanton, B.M. Textbook of Pediatrics, 16th ed.; Saunders: Philadelphia, PA, USA; London, UK; Toronto, ON, Canada, 1999. [Google Scholar]
- Schrade, L.; Scheffler, C. Assessing the Applicability of the Digital Laser Rangefinder GLM Professional Bosch 250 VF for Anthropometric Field Studies. Anthr. Anz. 2013, 70, 137–145. [Google Scholar] [CrossRef]
- Knussmann, R. Anthropologie: Handbuch Der Vergleichenden Biologie Des Menschen; Fischer: Stuttgart, Germany, 1988. [Google Scholar]
- Desrosiers, J.; Hébert, R.; Bravo, G.; Dutil, E. Comparison of the Jamar Dynamometer and the Martin Vigorimeter for Grip Strength Measurements in a Healthy Elderly Population. Scand. J. Rehabil. Med. 1995, 27, 137–143. [Google Scholar]
- Sipers, W.M.; Verdijk, L.B.; Sipers, S.J.; Schols, J.M.; van Loon, L.J. The Martin Vigorimeter Represents a Reliable and More Practical Tool Than the Jamar Dynamometer to Assess Handgrip Strength in the Geriatric Patient. J. Am. Med. Dir. Assoc. 2016, 17. [Google Scholar] [CrossRef]
- Growth Reference Data for 5–19 Years. Available online: https://www.who.int/tools/growth-reference-data-for-5to19-years (accessed on 21 December 2020).
- Hasibuan, S.N.; Pulungan, A.; Scheffler, C.; Groth, D.; Hermanussen, M. Environmental Stimulation on Height: The Story from Indonesia. Anthr. Anz. 2020, 77, 423–429. [Google Scholar] [CrossRef]
- Raivio, T.; Miettinen, P.J. Constitutional Delay of Puberty versus Congenital Hypogonadotropic Hypogonadism: Genetics, Management and Updates. Best Pract. Res. Clin. Endocrinol. Metab. 2019, 33, 101316. [Google Scholar] [CrossRef] [PubMed]
- De Leonibus, C.; Marcovecchio, M.L.; Chiarelli, F. Update on Statural Growth and Pubertal Development in Obese Children. Pediatr. Rep. 2012, 4, 35. [Google Scholar] [CrossRef] [PubMed]
- Lartey, A. What Would It Take to Prevent Stunted Growth in Children in Sub-Saharan Africa? Proc. Nutr. Soc. 2015, 74, 449–453. [Google Scholar] [CrossRef] [PubMed]
- Ostrove, J.M.; Adler, N.E.; Kuppermann, M.; Washington, A.E. Objective and Subjective Assessments of Socioeconomic Status and Their Relationship to Self-Rated Health in an Ethnically Diverse Sample of Pregnant Women. Health Psychol. 2000, 19, 613. [Google Scholar] [CrossRef] [PubMed]
- Allen, A.J.; McNeely, J.M.; Waldstein, S.R.; Evans, M.K.; Zonderman, A.B. Subjective Socioeconomic Status Predicts Framingham Cardiovascular Disease Risk for Whites, Not Blacks. Ethn. Dis. 2014, 24, 150–154. [Google Scholar]
- Jeong, J.; Kim, R.; Subramanian, S.V. How Consistent Are Associations between Maternal and Paternal Education and Child Growth and Development Outcomes across 39 Low-Income and Middle-Income Countries? J. Epidemiol. Community Health 2018, 72, 434–441. [Google Scholar] [CrossRef]
- Vaivada, T.; Akseer, N.; Akseer, S.; Somaskandan, A.; Stefopulos, M.; Bhutta, Z.A. Stunting in Childhood: An Overview of Global Burden, Trends, Determinants, and Drivers of Decline. Am. J. Clin. Nutr. 2020, 112, 777S–791S. [Google Scholar] [CrossRef]
- Pusat Data dan Statistik Pendidikan. In Statistik Sekolah Dasar (SD) 2013/2014; Secretariat General, Ministry of Education and Culture: Jakarta, Indonesia, 2014; p. 1. Available online: http://publikasi.data.kemdikbud.go.id/uploadDir/isi_FC056553-B68A-43B4-90DE-A6FBD13B99C7_.pdf (accessed on 18 August 2017).


| (a) | |||||||||
| Boys | Private | State | Underprivileged | Difference Private and Underprivileged | |||||
| Mean | SD | Mean | SD | Mean | SD | p | CI 95% | ||
| height SDS | −0.63 | 1.2 | −1.37 | 0.89 | −1.92 | 0.79 | <0.000 | −1.685 | −0.899 |
| sittheight_SDS | 0.54 | 1.14 | −0.11 | 0.84 | −0.73 | 0.62 | <0.000 | −1.632 | 0.541 |
| toothsum_SDS | 0.04 | 0.95 | 0.01 | 0.96 | −0.16 | 0.91 | 0.225 | −0.544 | 0.129 |
| BMI_SDS | 0.09 | 1.88 | −1.11 | 1.53 | −1.66 | 1 | <0.000 | −2.347 | −1.150 |
| Livi.Index | 2.35 | 0.15 | 2.27 | 0.12 | 2.25 | 0.07 | <0.000 | −0.150 | −0.055 |
| Pelid.Index | 96.2 | 6.62 | 93.28 | 5.34 | 92.48 | 2.64 | <0.000 | −5.788 | −1.661 |
| MUAC_SDS | 0.56 | 1.28 | −0.17 | 0.78 | −0.48 | 0.44 | <0.000 | −1.433 | −0.643 |
| skinfold_SDS | 0.59 | 1.31 | −0.18 | 0.76 | −0.5 | 0.29 | <0.000 | −1.481 | −0.682 |
| Frame.Index | 38.32 | 2.01 | 38.73 | 1.85 | 39.01 | 1.68 | 0.050 | −0.001 | 1.377 |
| handgrip_SDS | 0.05 | 1.11 | 0.02 | 0.92 | −0.21 | 0.95 | 0.175 | −0.647 | 0.119 |
| JUMP_SDS | −0.44 | 0.97 | 0.19 | 0.96 | 0.08 | 0.9 | 0.003 | 0.181 | 0.860 |
| EDUfather | 12.52 | 2.84 | 11.22 | 2.81 | 8.44 | 2.88 | <0.000 | −5.152 | −3.026 |
| EDUmother | 12.38 | 2.7 | 11.14 | 2.57 | 7.9 | 2.99 | <0.000 | −5.482 | −3.461 |
| math (grade) | 76.02 | 13.81 | 73.22 | 11.1 | 68.63 | 7.51 | 0.002 | −11.954 | −2.834 |
| language (grade) | 77.82 | 10.35 | 76.57 | 10.38 | 70.48 | 7.12 | <0.000 | −10.864 | −3.820 |
| TVfW_SCORE | 6.26 | 0.64 | 6.01 | 0.99 | 4.72 | 1.26 | <0.000 | −1.849 | −1.229 |
| LADDERself_SDS | 0.02 | 0.94 | −0.02 | 1.04 | 0.28 | 1.33 | 0.184 | −0.124 | 0.640 |
| LADDERfath_SDS | 0.23 | 0.81 | −0.1 | 1.04 | −0.04 | 1.06 | 0.098 | −0.589 | 0.050 |
| (b) | |||||||||
| Girls | Private | State | Underprivileged | Difference Private and Underprivileged | |||||
| Mean | SD | Mean | SD | Mean | SD | p | CI 95% | ||
| height SDS | −0.74 | 0.99 | −1.17 | 1.01 | −1.34 | 1.1 | 0.005 | −1.023 | −0.193 |
| sittheight_SDS | 0.26 | 0.99 | −0.03 | 0.97 | −0.55 | 0.94 | <0.000 | −1.213 | −0.416 |
| toothsum_SDS | −0.15 | 1.1 | −0.01 | 0.97 | −0.43 | 0.8 | 0.184 | −0.700 | 0.136 |
| BMI_SDS | −0.2 | 1.31 | −0.84 | 1.35 | −1.25 | 1.27 | <0.000 | −1.576 | −0.520 |
| Livi.Index | 2.32 | 0.12 | 2.27 | 0.11 | 2.25 | 0.11 | 0.006 | −0.116 | −0.019 |
| Pelid.Index | 95.06 | 4.92 | 93.18 | 4.48 | 93.3 | 3.72 | 0.068 | −3.646 | 0.128 |
| MUAC_SDS | 0.4 | 1.1 | −0.12 | 0.92 | −0.32 | 0.84 | 0.001 | −1.148 | −0.301 |
| skinfold_SDS | 0.35 | 1.06 | −0.07 | 0.95 | −0.51 | 0.75 | <0.000 | −1.256 | −0.451 |
| Frame.Index | 36.89 | 1.98 | 37.48 | 1.74 | 37.75 | 1.88 | 0.035 | 0.062 | 1.652 |
| handgrip_SDS | −0.1 | 1.09 | 0.1 | 0.96 | −0.22 | 0.74 | 0.538 | −0.538 | 0.282 |
| JUMP_SDS | −0.51 | 0.75 | 0 | 0.97 | 0.55 | 1 | <0.000 | 0.726 | 1.391 |
| EDUfather | 12.49 | 3.14 | 11.19 | 2.83 | 9.16 | 3.73 | <0.000 | −4.693 | −1.983 |
| EDUmother | 12.21 | 3.43 | 11.11 | 2.65 | 9.44 | 3.15 | <0.000 | −4.154 | −1.394 |
| math (grade) | 75.34 | 12.36 | 75.07 | 10.36 | 71.96 | 6.24 | 0.167 | −8.189 | 1.436 |
| language (grade) | 79.89 | 8.56 | 79.55 | 9.87 | 73.64 | 6.98 | 0.001 | −9.765 | −2.729 |
| TVfW_SCORE | 6.29 | 0.58 | 5.86 | 0.99 | 4.81 | 1.31 | <0.000 | −1.811 | −1.135 |
| LADDERself_SDS | 0.03 | 0.9 | 0.03 | 1.07 | −0.05 | 1.21 | 0.717 | −0.475 | 0.328 |
| LADDERfath_SDS | 0.22 | 0.75 | −0.11 | 1.08 | 0.16 | 0.86 | 0.742 | −0.368 | 0.263 |
| Age (Years) | Girls | Boys | ||
|---|---|---|---|---|
| N | SD | N | SD | |
| 6 | 2.1 | 1.1 | 1.5 | 0.9 |
| 7 | 3 | 0.9 | 2.4 | 0.9 |
| 8 | 3.7 | 0.9 | 3 | 0.9 |
| 9 | 4.7 | 1.4 | 4.1 | 1.1 |
| 10 | 5.8 | 1.2 | 5.1 | 1.2 |
| 11 | 6.5 | 0.9 | 6.1 | 1.1 |
| 12 | 6.8 | 0.8 | 6.4 | 1 |
| School | Girls | Boys | ||||
|---|---|---|---|---|---|---|
| Private | State | Underprivileged | Private | State | Underprivileged | |
| Pelidisi | 0.28 | 0.33 | 0.02 | 0.55 | 0.16 | 0.08 |
| Livi | 0.19 | 0.18 | −0.10 | 0.52 | 0.06 | −0.29 |
| BMI_SDS | 0.44 | 0.47 | 0.16 | 0.65 | 0.29 | 0.07 |
| skinfold_SDS | 0.43 | 0.40 | 0.13 | 0.61 | 0.28 | 0.09 |
| MUAC_SDS | 0.49 | 0.54 | 0.32 | 0.69 | 0.42 | 0.22 |
| School | EDUfather | EDUmother | Math Grades | Language Grades |
|---|---|---|---|---|
| Private | 0.162 | 0.205 | 0.181 | 0.141 |
| underprivileged | 0.060 | 0.199 | 0.186 | 0.241 |
| Component | Anthrop | Household | Education | Sport | Perception |
|---|---|---|---|---|---|
| % of variance | 23.34 | 13.68 | 8.89 | 8.80 | 7.29 |
| BMI_SDS | 0.917 | −0.064 | 0.151 | 0.057 | 0.003 |
| Frame.Index | 0.500 | −0.014 | −0.236 | 0.325 | 0.039 |
| EDUfather | 0.077 | −0.295 | 0.760 | 0.093 | −0.037 |
| EDUmother | 0.100 | −0.306 | 0.773 | 0.047 | −0.090 |
| average school grades | 0.075 | 0.093 | 0.584 | −0.086 | 0.194 |
| Water | −0.037 | 0.723 | −0.020 | −0.046 | −0.150 |
| TV | −0.004 | 0.697 | −0.130 | 0 | −0.003 |
| Fridge | −0.119 | 0.717 | −0.168 | 0.079 | 0.012 |
| toothsum_SDS | 0.205 | −0.136 | −0.093 | 0.428 | −0.146 |
| MUAC_SDS | 0.940 | −0.059 | 0.147 | 0.067 | −0.018 |
| skinfold_SDS | 0.911 | −0.080 | 0.136 | −0.036 | 0.013 |
| handgrip_SDS | 0.289 | 0.074 | 0.199 | 0.683 | −0.055 |
| JUMP_SDS | −0.316 | 0.111 | −0.023 | 0.758 | 0.151 |
| LADDERself_SDS | −0.050 | −0.092 | 0.024 | 0.059 | 0.785 |
| LADDERfath_SDS | 0.064 | −0.038 | 0.043 | −0.095 | 0.780 |
Publisher’s Note: MDPI stays neutral with regard to jurisdictional claims in published maps and institutional affiliations. |
© 2021 by the authors. Licensee MDPI, Basel, Switzerland. This article is an open access article distributed under the terms and conditions of the Creative Commons Attribution (CC BY) license (http://creativecommons.org/licenses/by/4.0/).
Share and Cite
Scheffler, C.; Hermanussen, M.; Soegianto, S.D.P.; Homalessy, A.V.; Touw, S.Y.; Angi, S.I.; Ariyani, Q.S.; Suryanto, T.; Matulessy, G.K.I.; Fransiskus, T.; et al. Stunting as a Synonym of Social Disadvantage and Poor Parental Education. Int. J. Environ. Res. Public Health 2021, 18, 1350. https://doi.org/10.3390/ijerph18031350
Scheffler C, Hermanussen M, Soegianto SDP, Homalessy AV, Touw SY, Angi SI, Ariyani QS, Suryanto T, Matulessy GKI, Fransiskus T, et al. Stunting as a Synonym of Social Disadvantage and Poor Parental Education. International Journal of Environmental Research and Public Health. 2021; 18(3):1350. https://doi.org/10.3390/ijerph18031350
Chicago/Turabian StyleScheffler, Christiane, Michael Hermanussen, Sugi Deny Pranoto Soegianto, Alexandro Valent Homalessy, Samuel Yan Touw, Sevany Isabella Angi, Queen Sugih Ariyani, Tjahyo Suryanto, Giovanni Kathlix Immanuel Matulessy, Taolin Fransiskus, and et al. 2021. "Stunting as a Synonym of Social Disadvantage and Poor Parental Education" International Journal of Environmental Research and Public Health 18, no. 3: 1350. https://doi.org/10.3390/ijerph18031350
APA StyleScheffler, C., Hermanussen, M., Soegianto, S. D. P., Homalessy, A. V., Touw, S. Y., Angi, S. I., Ariyani, Q. S., Suryanto, T., Matulessy, G. K. I., Fransiskus, T., Safira, A. V. C., Puteri, M. N., Rahmani, R., Ndaparoka, D. N., Payong, M. K. E., Indrajati, Y. D., Purba, R. K. H., Manubulu, R. M., Julia, M., & Pulungan, A. B. (2021). Stunting as a Synonym of Social Disadvantage and Poor Parental Education. International Journal of Environmental Research and Public Health, 18(3), 1350. https://doi.org/10.3390/ijerph18031350