The Potential of Small Dams for Conjunctive Water Management in Rural Municipalities


 ,
,  ,
, 
Abstract
1. Introduction
2. Materials and Methods
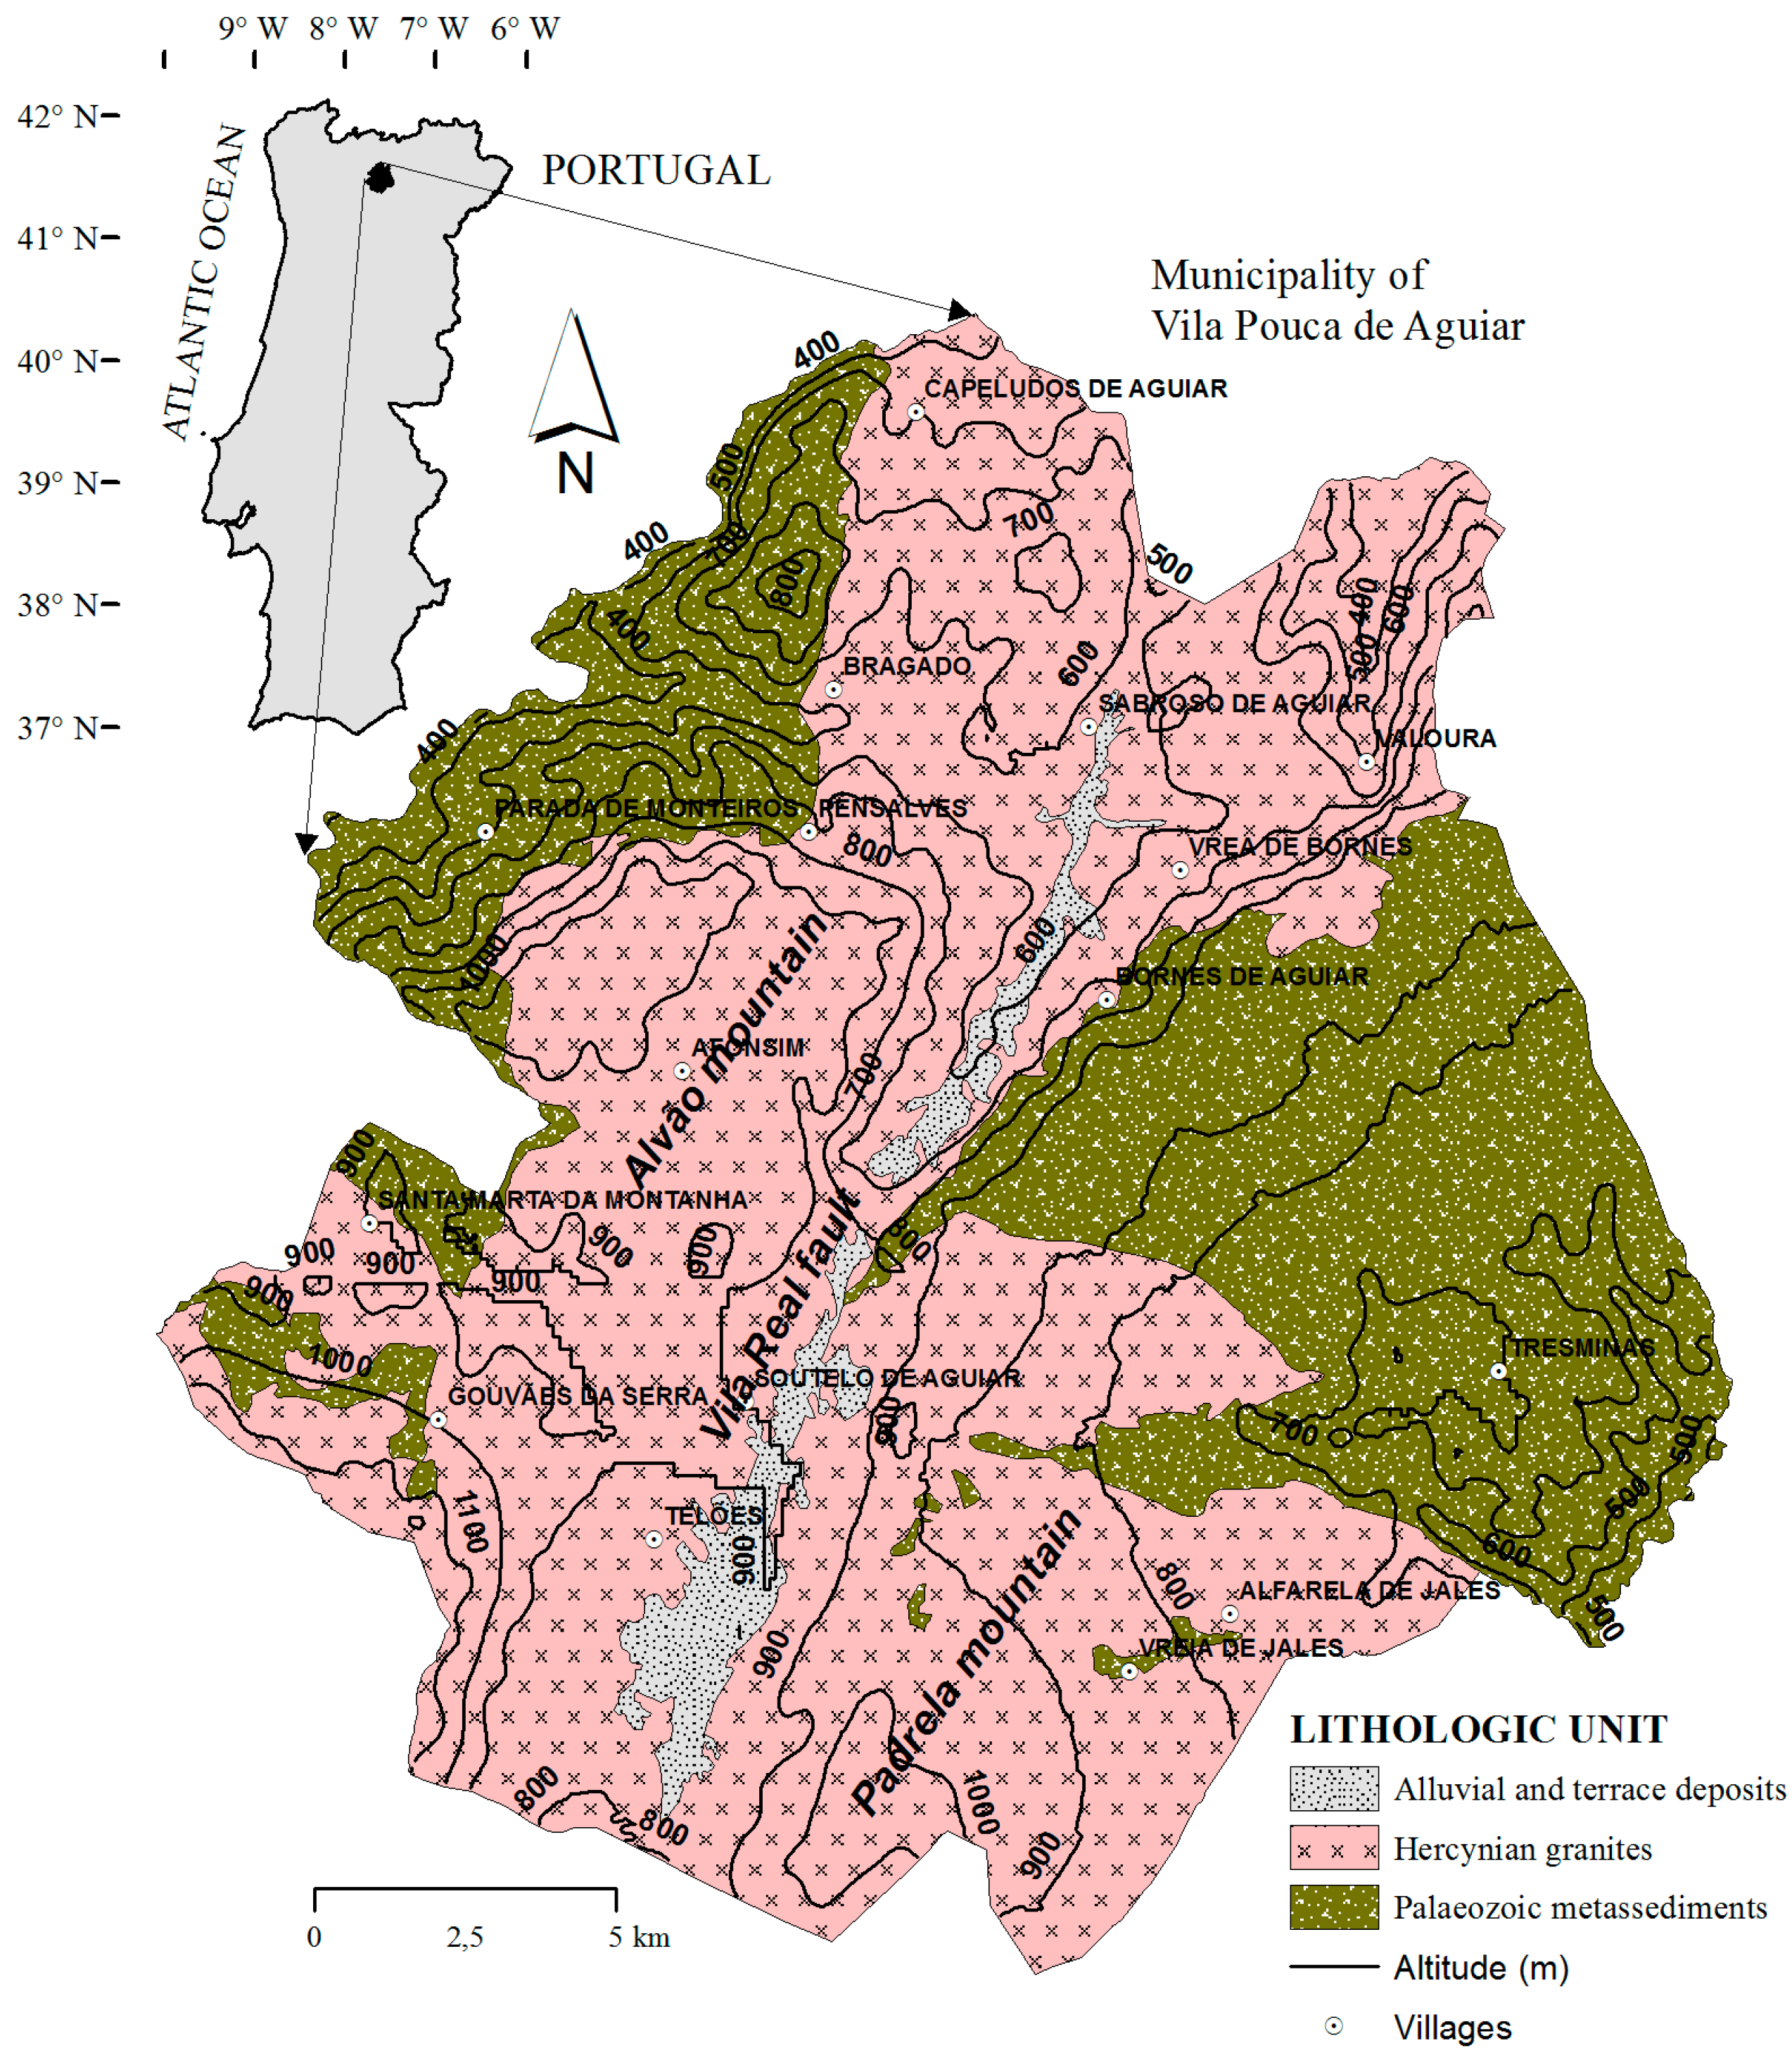
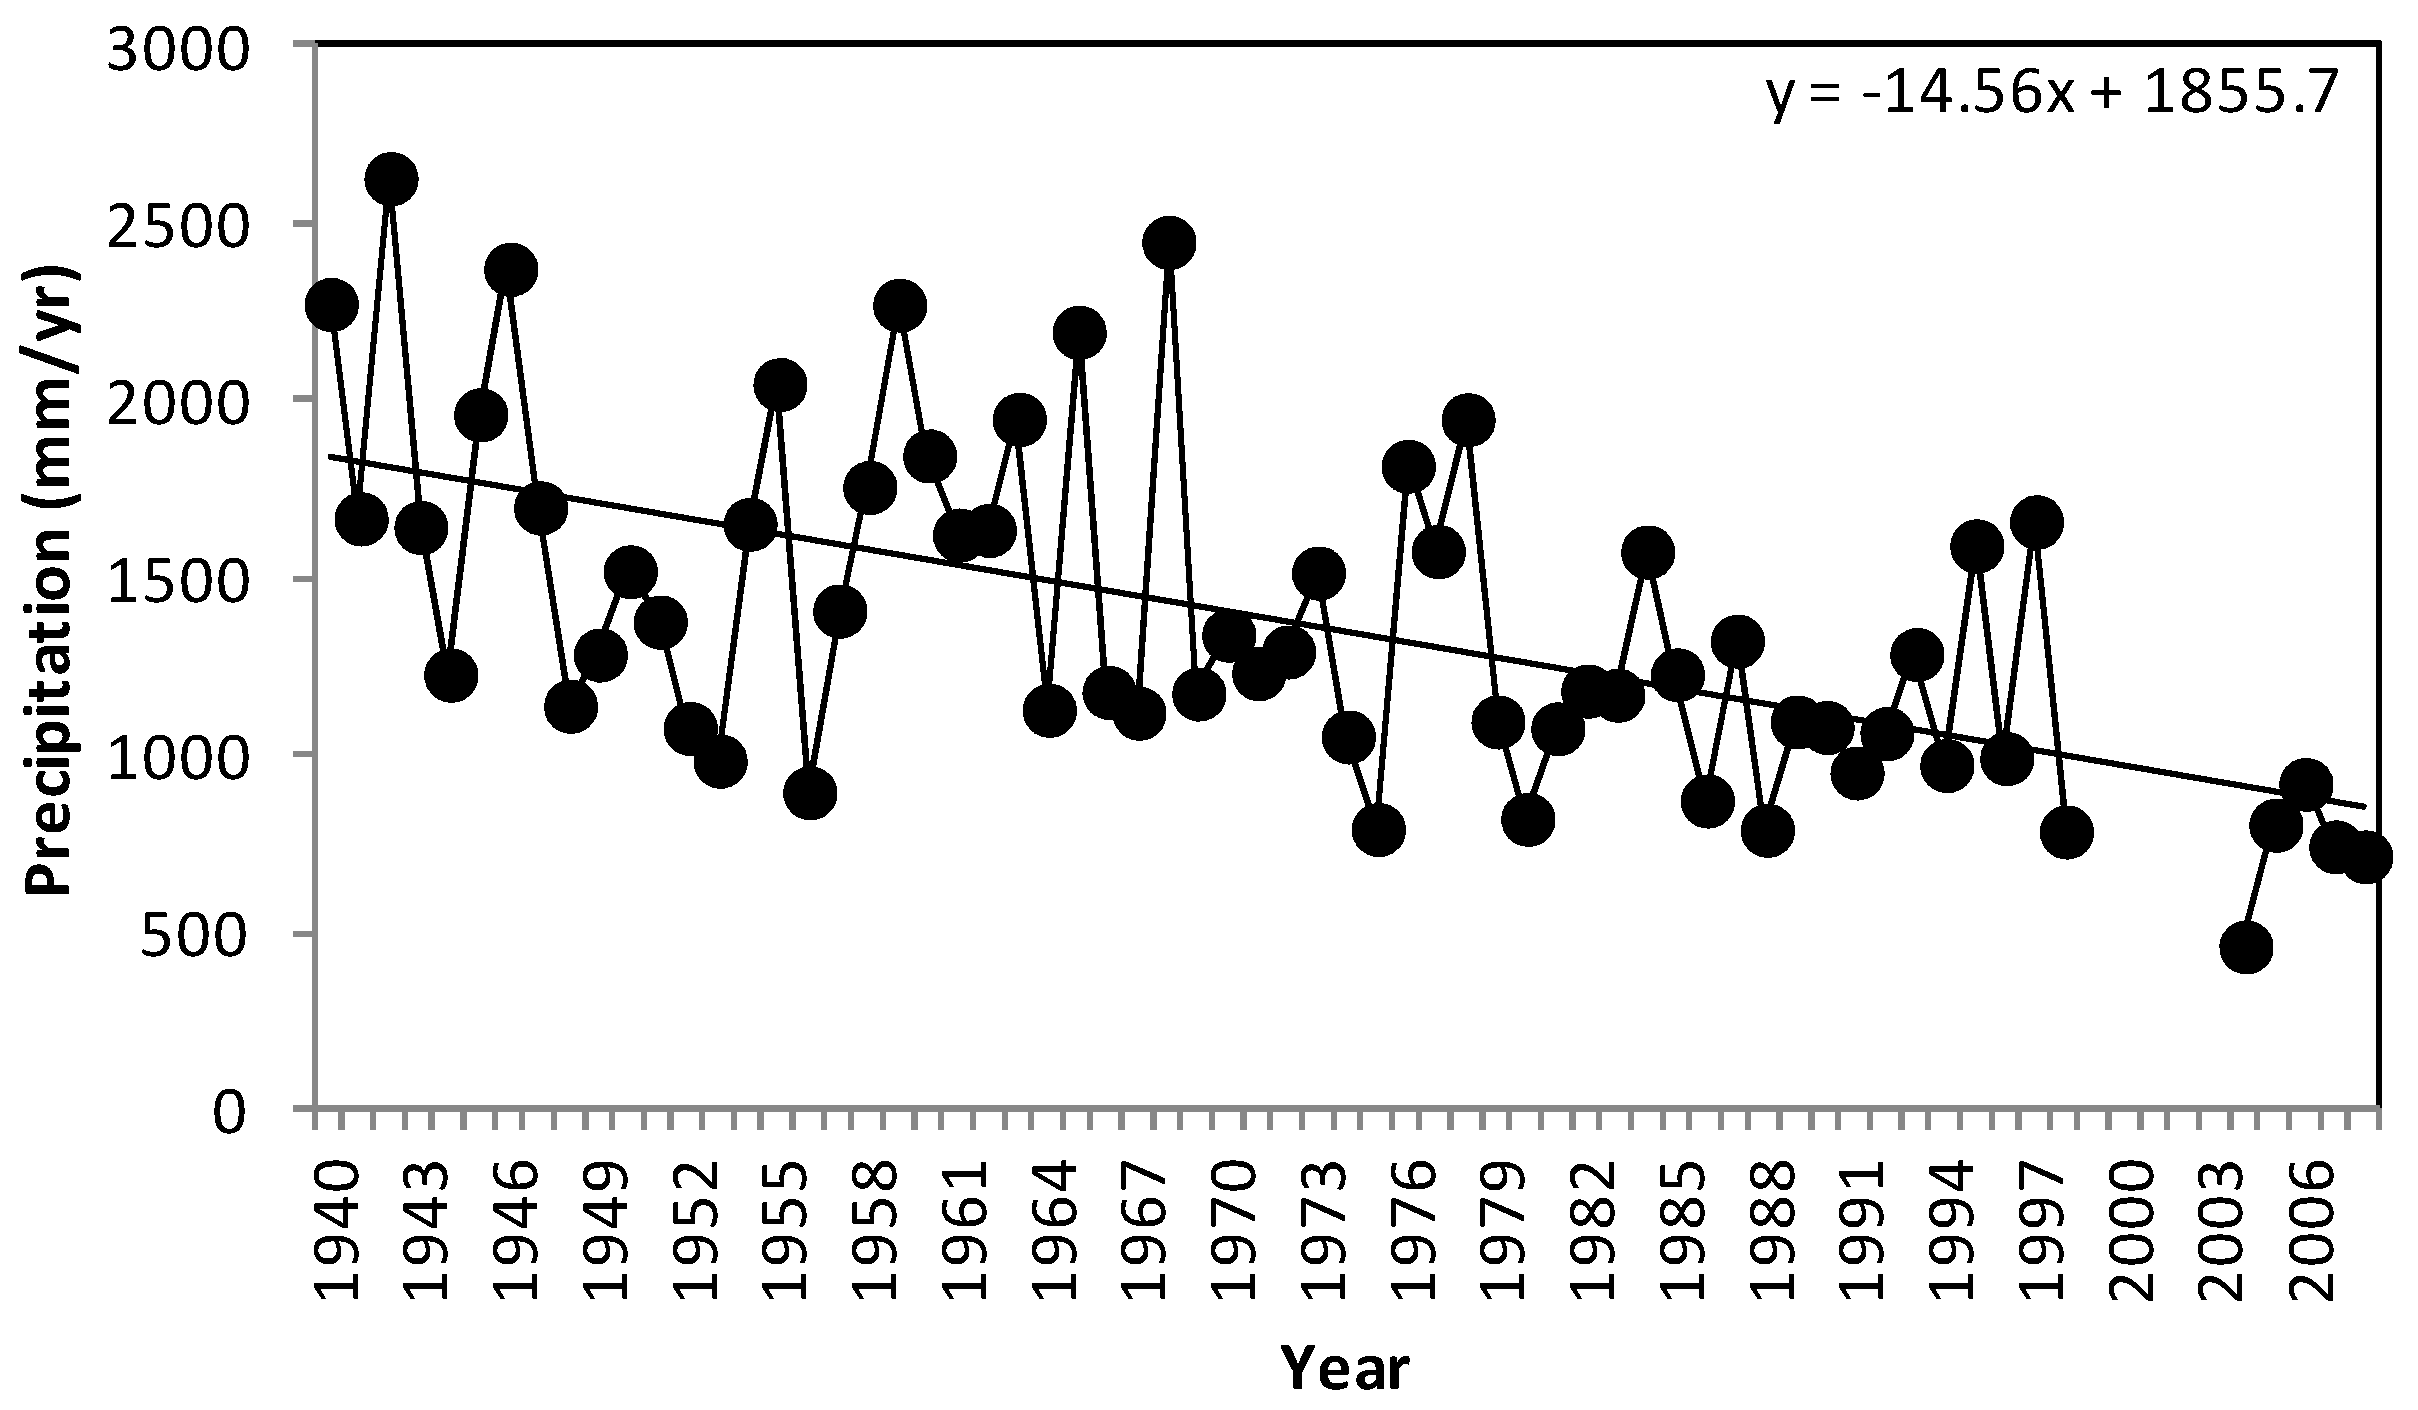
2.1. Study Area
2.2. Conceptual Approach
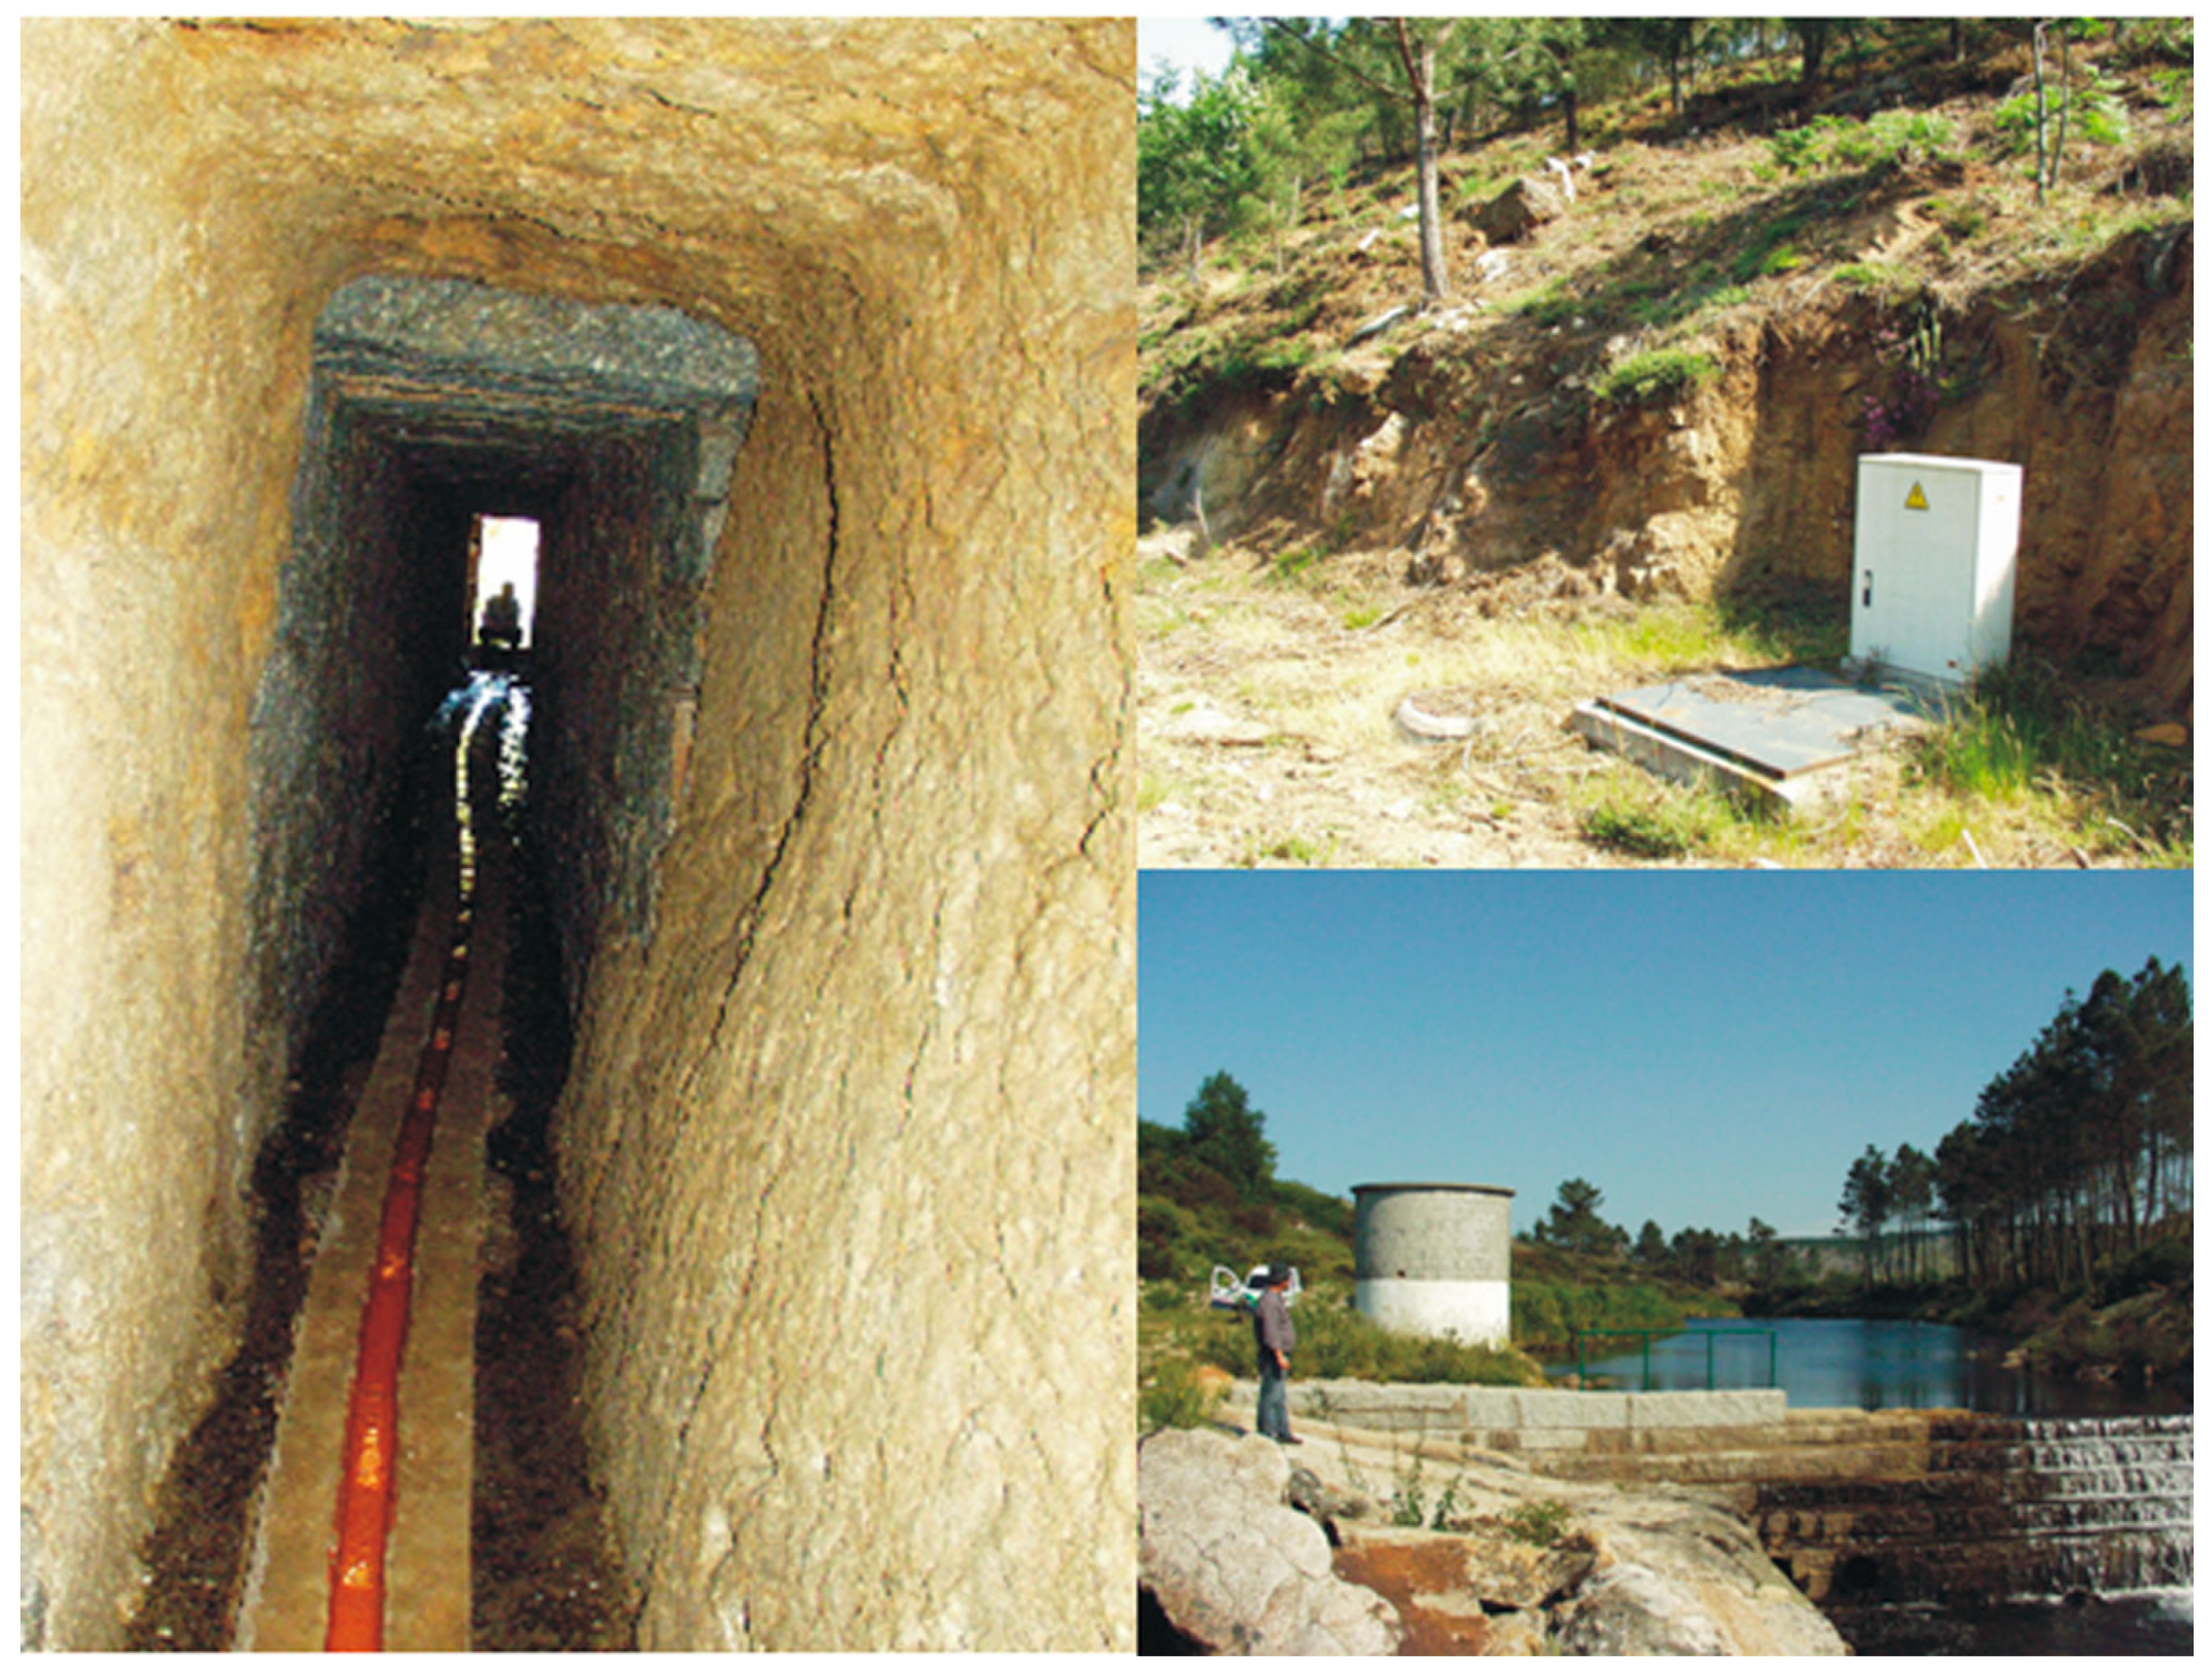
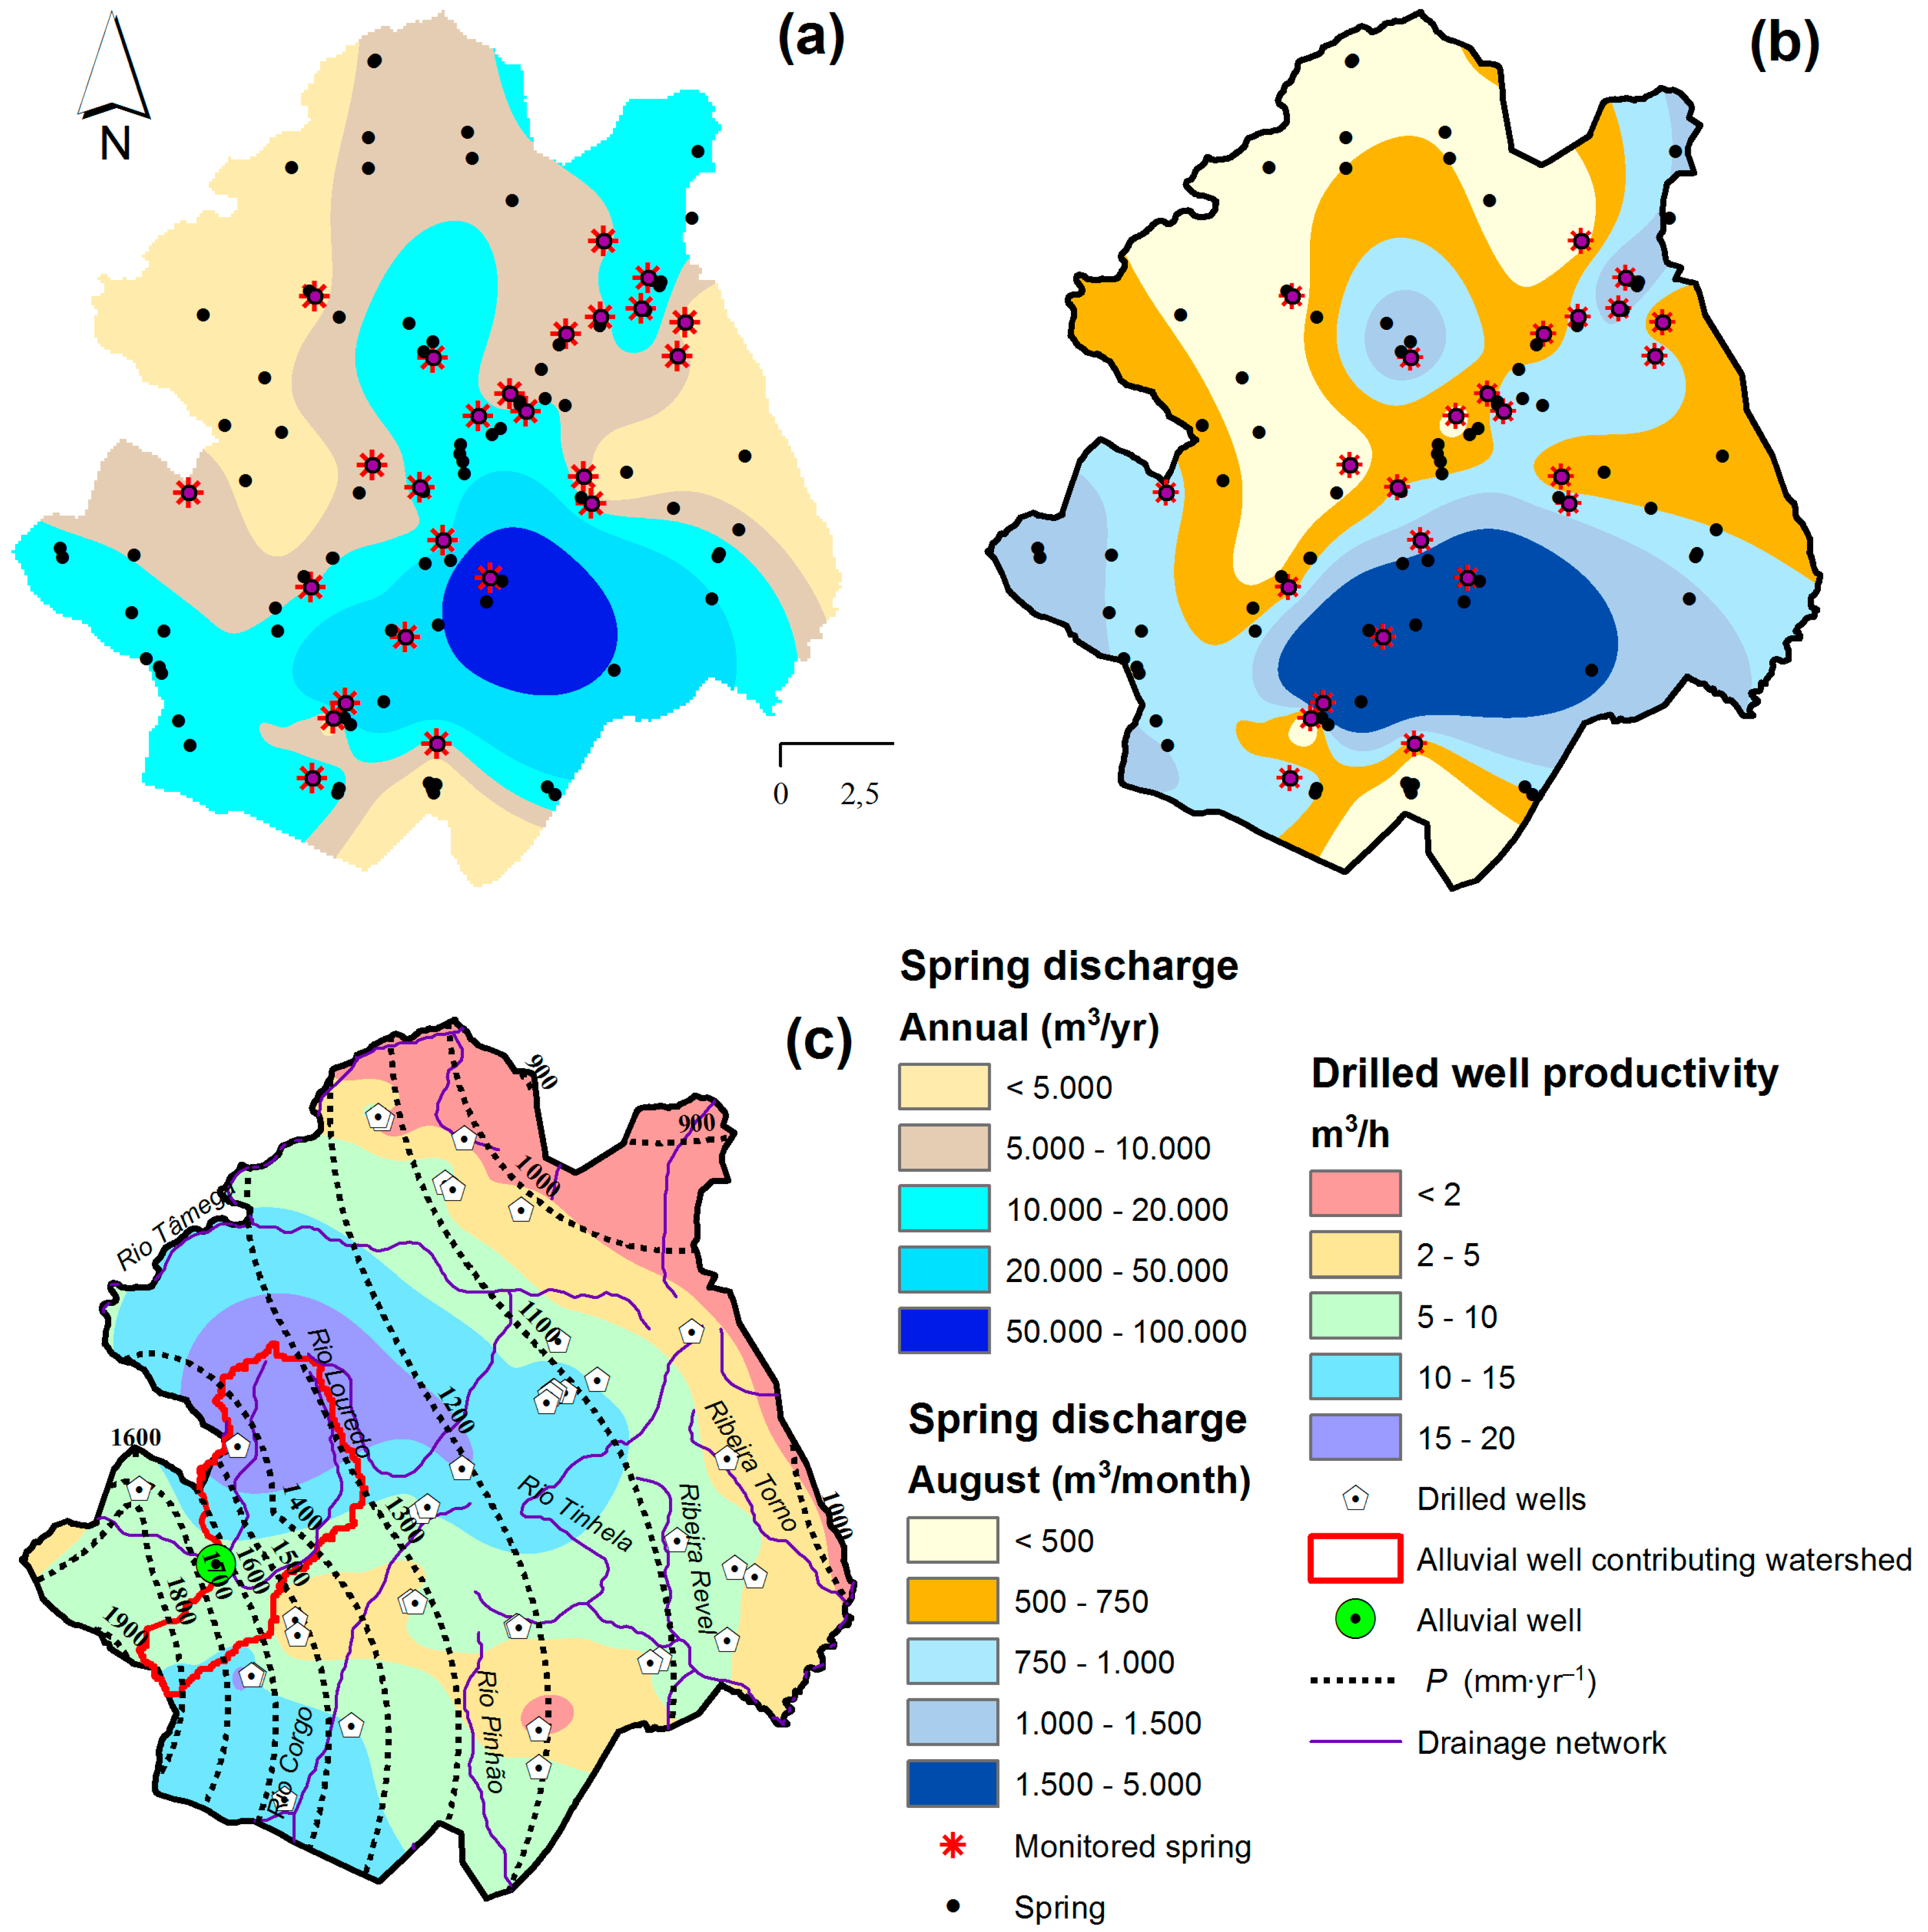
2.3. Hydrologic Model and GIS Assessments
2.4. Data and Software
3. Results
4. Discussion
5. Conclusions
Author Contributions
Funding
Conflicts of Interest
References
- Molinos-Senante, M.; Donoso, G. Water scarcity and affordability in urban water pricing: A case study of Chile. Util. Policy 2016, 43, 107–116. [Google Scholar] [CrossRef]
- Udimal, T.B.; Jincai, Z.; Ayamba, E.C.; Mensah Owusu, S. China’s water situation; the supply of water and the pattern of its usage. Int. J. Sustain. Built Environ. 2017, 6, 491–500. [Google Scholar] [CrossRef]
- Kifle Arsiso, B.; Mengistu Tsidu, G.; Stoffberg, G.H.; Tadesse, T. Climate change and population growth impacts on surface water supply and demand of Addis Ababa, Ethiopia. Clim. Risk Manag. 2017, 18, 21–33. [Google Scholar] [CrossRef]
- Misra, A.K.; Masoodi, M.; Poyil, R.P.; Tewari, N.K. Water demand and waste management with respect to projected urban growth of Gurugram city in Haryana. Beni-Suef Univ. J. Basic Appl. Sci. 2018, 7, 336–343. [Google Scholar] [CrossRef]
- Sharma, B.; Molden, D.; Cook, S. Water use efficiency in agriculture: Measurement, current situation and trends. In Managing Water and Fertilizer for Sustainable Agricultural Intensification; International Fertilizer Industry Association (IFA): Paris, France, 2015. [Google Scholar]
- Tortajada, C.; González-Gómez, F.; Biswas, A.K.; Buurman, J. Water demand management strategies for water-scarce cities: The case of Spain. Sustain. Cities Soc. 2019, 45, 649–656. [Google Scholar] [CrossRef]
- Doungmanee, P. The nexus of agricultural water use and economic development level. Kasetsart J. Soc. Sci. 2016, 37, 38–45. [Google Scholar] [CrossRef]
- Curran, S.R.; De Sherbinin, A. Completing the Picture: The Challenges of Bringing “ Consumption” into the Population- Environment Equation. Popul. Environ. 2016, 26, 107–131. [Google Scholar] [CrossRef]
- Stavenhagen, M.; Buurman, J.; Tortajada, C. Saving water in cities: Assessing policies for residential water demand management in four cities in Europe. Cities 2018, 79, 187–195. [Google Scholar] [CrossRef]
- Boholm, Å.; Prutzer, M. Experts’ understandings of drinking water risk management in a climate change scenario. Clim. Risk Manag. 2017, 16, 133–144. [Google Scholar] [CrossRef]
- Aubin, D.; Riche, C.; Vande Water, V.; La Jeunesse, I. The adaptive capacity of local water basin authorities to climate change: The Thau lagoon basin in France. Sci. Total Environ. 2019, 651, 2013–2023. [Google Scholar] [CrossRef]
- Huang, Y.-C.; Lee, C.-M. Designing an Optimal Water Supply Portfolio for Taiwan under the Impact of Climate Change: Case Study of the Penghu Area. J. Hydrol. 2019, 573, 235–245. [Google Scholar] [CrossRef]
- Clara, N.; Verdaguer, M.; Gernjak, W.; Molinos-Senante, M.; Santana, M.; Poch, M. Optimal fresh water blending: A methodological approach to improve the resilience of water supply systems. Sci. Total Environ. 2017, 624, 1308–1315. [Google Scholar]
- Furlong, C.; Jegatheesan, J.; Currell, M.; Iyer-Raniga, U.; Khan, T.; Ball, A.S. Is the global public willing to drink recycled water? A review for researchers and practitioners. Util. Policy 2019, 56, 53–61. [Google Scholar] [CrossRef]
- Ross, A. Speeding the transition towards integrated groundwater and surface water management in Australia. J. Hydrol. 2016, 567, e1–e10. [Google Scholar] [CrossRef]
- Pacheco, F.A.L.; Van der Weijden, C.H. Weathering of plagioclase across variable flow and solute transport regimes. J. Hydrol. 2012, 420–421, 46–58. [Google Scholar] [CrossRef]
- Pacheco, F.A.L.; Van der Weijden, C.H. Modeling rock weathering in small watersheds. J. Hydrol. 2014, 513, 13–27. [Google Scholar] [CrossRef]
- Terêncio, D.P.S.; Sanches Fernandes, L.F.; Cortes, R.M.V.; Pacheco, F.A.L. Improved framework model to allocate optimal rainwater harvesting sites in small watersheds for agro-forestry uses. J. Hydrol. 2017, 550, 318–330. [Google Scholar] [CrossRef]
- Terêncio, D.P.S.; Sanches Fernandes, L.F.; Cortes, R.M.V.; Moura, J.P.; Pacheco, F.A.L. Rainwater harvesting in catchments for agro-forestry uses: A study focused on the balance between sustainability values and storage capacity. Sci. Total Environ. 2018, 613, 1079–1092. [Google Scholar] [CrossRef]
- Valle, R.F.; Varandas, S.G.P.; Sanches Fernandes, L.F.; Pacheco, F.A.L. Groundwater quality in rural watersheds with environmental land use conflicts. Sci. Total Environ. 2014, 493, 812–827. [Google Scholar] [CrossRef]
- Pacheco, F.A.L.; Sanches Fernandes, L.F. Environmental land use conflicts in catchments: A major cause of amplified nitrate in river water. Sci. Total Environ. 2016, 548, 173–188. [Google Scholar] [CrossRef]
- Santos, R.M.B.; Sanches Fernandes, L.F.; Pereira, M.G.; Cortes, R.M.V.; Pacheco, F.A.L. A framework model for investigating the export of phosphorus to surface waters in forested watersheds: Implications to management. Sci. Total Environ. 2015, 536, 295–305. [Google Scholar] [CrossRef]
- Pacheco, F.A.L.; Santos, R.M.B.; Sanches Fernandes, L.F.; Pereira, M.G.; Cortes, R.M.V. Controls and forecasts of nitrate yields in forested watersheds: A view over mainland Portugal. Sci. Total Environ. 2015, 537, 421–440. [Google Scholar] [CrossRef]
- Garrels, R.M.; Mackenzie, F.T. Origin of the Chemical Compositions of Some Springs and Lakes. In Advances in Chemistry; ACS Publications: Washington, DC, USA, 2009; ISBN 9780841200685. [Google Scholar]
- Velbel, M.A.; Price, J.R. Solute geochemical mass-balances and mineral weathering rates in small watersheds: Methodology, recent advances, and future directions. Appl. Geochem. 2007, 22, 1682–1700. [Google Scholar] [CrossRef]
- Pacheco, F.A.L.; Alencoão, A.M.P. Role of fractures in weathering of solid rocks: Narrowing the gap between laboratory and field weathering rates. J. Hydrol. 2006, 316, 248–265. [Google Scholar] [CrossRef]
- Pacheco, F.A.L.; Van der Weijden, C.H. Integrating topography, hydrology and rock structure in weathering rate models of spring watersheds. J. Hydrol. 2012, 428, 32–50. [Google Scholar] [CrossRef]
- Pacheco, F.A.L.; Van der Weijden, C.H. Role of hydraulic diffusivity in the decrease of weathering rates over time. J. Hydrol. 2014, 512, 87–106. [Google Scholar] [CrossRef]
- Pacheco, F.A.L.; Van Der Weijden, C.H. Mineral weathering rates calculated from spring water data: A case study in an area with intensive agriculture, the Morais Massif, northeast Portugal. Appl. Geochem. 2002, 17, 583–603. [Google Scholar] [CrossRef]
- Pacheco, F.A.L. Application of Correspondence Analysis in the Assessment of Groundwater Chemistry. Math. Geol. 1998, 30, 129–161. [Google Scholar] [CrossRef]
- Pacheco, F.A.L.; Landin, P.M.B. Two-way regionalized classification of multivariate datasets and its application to the assessment of hydrodynamic dispersion. Math. Geol. 2005, 37, 393–417. [Google Scholar] [CrossRef]
- Stahn, H.; Tomini, A. On conjunctive management of groundwater and rainwater. Resour. Energy Econ. 2017, 49, 186–200. [Google Scholar] [CrossRef]
- Wang, C.X.; Li, Y.P.; Huang, G.H.; Zhang, J.L. A type-2 fuzzy interval programming approach for conjunctive use of surface water and groundwater under uncertainty. Inf. Sci. 2016, 340, 209–227. [Google Scholar] [CrossRef]
- Sekar, I.; Randhir, T.O. Spatial assessment of conjunctive water harvesting potential in watershed systems. J. Hydrol. 2007, 334, 39–52. [Google Scholar] [CrossRef]
- Sanches Fernandes, L.F.; Terêncio, D.P.S.; Pacheco, F.A.L. Rainwater harvesting systems for low demanding applications. Sci. Total Environ. 2015, 529, 91–100. [Google Scholar] [CrossRef]
- Lafforgue, M.; Lenouvel, V. Closing the urban water loop: Lessons from Singapore and Windhoek. Environ. Sci. Water Res. Technol. 2015, 1, 622–631. [Google Scholar] [CrossRef]
- Sanches Fernandes, L.F.; Pacheco, F.A.L.; Cortes, R.M.V.; Jesus, J.J.B.; Varandas, S.G.P.; Santos, R.M.B. Integrative assessment of river damming impacts on aquatic fauna in a Portuguese reservoir. Sci. Total Environ. 2017, 601–602, 1108–1118. [Google Scholar]
- Álvarez, X.; Valero, E.; Santos, R.M.B.; Varandas, S.G.P.; Sanches Fernandes, L.F.; Pacheco, F.A.L. Anthropogenic nutrients and eutrophication in multiple land use watersheds: Best management practices and policies for the protection of water resources. Land Use Policy 2017, 69, 1–11. [Google Scholar] [CrossRef]
- Zemmouri, H.; Drouiche, M.; Sayeh, A.; Lounici, H.; Mameri, N. Chitosan application for treatment of Beni- Amrane’s water dam. Energy Procedia 2013, 36, 558–564. [Google Scholar] [CrossRef]
- Odeh, T.; Mohammad, A.H.; Hussein, H.; Ismail, M.; Almomani, T. Over-pumping of groundwater in Irbid governorate, northern Jordan: A conceptual model to analyze the effects of urbanization and agricultural activities on groundwater levels and salinity. Environ. Earth Sci. 2019, 78, 40. [Google Scholar]
- Mohammad, A.H.; Jung, H.C.; Odeh, T.; Bhuiyan, C.; Hussein, H. Understanding the impact of droughts in the Yarmouk Basin, Jordan: Monitoring droughts through meteorological and hydrological drought indices. Arab. J. Geosci. 2018, 11, 103. [Google Scholar] [CrossRef]
- Santos, R.M.B.; Sanches Fernandes, L.F.; Pereira, M.G.; Cortes, R.M.V.; Pacheco, F.A.L. Water resources planning for a river basin with recurrent wildfires. Sci. Total Environ. 2015, 526, 1–13. [Google Scholar] [CrossRef]
- Santos, R.M.B.; Sanches Fernandes, L.F.; Moura, J.P.; Pereira, M.G.; Pacheco, F.A.L. The impact of climate change, human interference, scale and modeling uncertainties on the estimation of aquifer properties and river flow components. J. Hydrol. 2014, 59, 1297–1314. [Google Scholar] [CrossRef]
- Pacheco, F.A.L. Regional groundwater flow in hard rocks. Sci. Total Environ. 2015, 506, 182–195. [Google Scholar] [CrossRef]
- Sanches Fernandes, L.F.; Santos, C.; Pereira, A.; Moura, J. Model of management and decision support systems in the distribution of water for consumption: Case study in North Portugal. Eur. J. Environ. Civ. Eng. 2011, 15, 411–426. [Google Scholar] [CrossRef]
- Fernandes, L.F.S.; Marques, M.J.; Oliveira, P.C.; Moura, J.P. Decision support systems in water resources in the demarcated region of Douro—Case study in Pinhão river basin, Portugal. Water Environ. J. 2014, 28, 350–357. [Google Scholar] [CrossRef]
- Neitsch, S.; Arnold, J.; Kiniry, J.; Williams, J. Soil & Water Assessment Tool Theoretical Documentation Version 2009; Texas Water Resources Institute Technical Report No. 406; Texas A&M University System: College Station, TX, USA, 2011; pp. 1–647. [Google Scholar]
- Valera, C.A.; Valle Junior, R.F.; Varandas, S.G.P.; Sanches Fernandes, L.F.; Pacheco, F.A.L. The role of environmental land use conflicts in soil fertility: A study on the Uberaba River basin, Brazil. Sci. Total Environ. 2016, 562, 463–473. [Google Scholar] [CrossRef]
- Pacheco, F.A.L.; Landim, P.M.B.; Szocs, T. Anthropogenic impacts on mineral weathering: A statistical perspective. Appl. Geochem. 2013, 36, 34–48. [Google Scholar] [CrossRef]
- Bellu, A.; Sanches Fernandes, L.F.; Cortes, R.M.V.; Pacheco, F.A.L. A framework model for the dimensioning and allocation of a detention basin system: The case of a flood-prone mountainous watershed. J. Hydrol. 2016, 533, 567–580. [Google Scholar] [CrossRef]
- Pacheco, F.A.L.; Szocs, T. “Dedolomitization reactions” driven by anthropogenic activity on loessy sediments, SW Hungary. Appl. Geochem. 2006, 21, 614–631. [Google Scholar] [CrossRef]
- Hybel, A.M.; Godskesen, B.; Rygaard, M. Selection of spatial scale for assessing impacts of groundwater-based water supply on freshwater resources. J. Environ. Manag. 2015, 160, 90–97. [Google Scholar] [CrossRef]
- Brunner, M.I.; Zappa, M.; Stähli, M. Scale matters: Effects of temporal and spatial data resolution on water scarcity assessments. Adv. Water Resour. 2019, 123, 134–144. [Google Scholar] [CrossRef]
- Lathuillière, M.J.; Bulle, C.; Johnson, M.S. A contribution to harmonize water footprint assessments. Glob. Environ. Chang. 2018, 53, 252–264. [Google Scholar] [CrossRef]
- Sun, S.; Wang, Y.; Liu, J.; Cai, H.; Wu, P.; Geng, Q.; Xu, L. Sustainability assessment of regional water resources under the DPSIR framework. J. Hydrol. 2016, 532, 140–148. [Google Scholar] [CrossRef]
- Woodhouse, P.; Muller, M. Water Governance—An Historical Perspective on Current Debates. World Dev. 2017, 92, 225–241. [Google Scholar] [CrossRef]
- Furlong, C.; Gan, K.; De Silva, S. Governance of Integrated Urban Water Management in Melbourne, Australia. Util. Policy 2016, 43, 48–58. [Google Scholar] [CrossRef]
- Saimy, I.S.; Yusof, N.A.M. The Need for Better Water Policy and Governance in Malaysia. Procedia-Soc. Behav. Sci. 2013, 81, 371–375. [Google Scholar] [CrossRef][Green Version]
- Perramond, E.P. Water governance in New Mexico: Adjudication, law, and geography. Geoforum 2013, 45, 83–93. [Google Scholar] [CrossRef]
- Liu, J.; Andrews, C.; He, X.; Zheng, C.; Zhang, A.; Yao, Y. Integration of groundwater into China’s south-north water transfer strategy. Sci. Total Environ. 2018, 658, 550–557. [Google Scholar]
- Morsy, K.M.; Morsy, A.M.; Hassan, A.E. Groundwater sustainability: Opportunity out of threat. Groundw. Sustain. Dev. 2018, 7, 277–285. [Google Scholar] [CrossRef]
- Jaafar, H.H. Feasibility of groundwater recharge dam projects in arid environments. J. Hydrol. 2014, 512, 16–26. [Google Scholar] [CrossRef]
- Fonseca, A.R.; Sanches Fernandes, L.F.; Fontainhas-Fernandes, A.; Monteiro, S.M.; Pacheco, F.A.L. From catchment to fish: Impact of anthropogenic pressures on gill histopathology. Sci. Total Environ. 2016, 550, 972–986. [Google Scholar] [CrossRef]
- Sanches Fernandes, L.F.; Fernandes, A.C.P.; Ferreira, A.R.L.; Cortes, R.M.V.; Pacheco, F.A.L. A partial least squares—Path modeling analysis for the understanding of biodiversity loss in rural and urban watersheds in Portugal. Sci. Total Environ. 2018, 626, 1069–1085. [Google Scholar] [CrossRef]
- Ferreira, A.R.L.; Sanches Fernandes, L.F.; Cortes, R.M.V.; Pacheco, F.A.L. Assessing anthropogenic impacts on riverine ecosystems using nested partial least squares regression. Sci. Total Environ. 2017, 583, 466–477. [Google Scholar] [CrossRef]
- Murshed, S.B.; Kaluarachchi, J.J. Scarcity of fresh water resources in the Ganges Delta of Bangladesh. Water Secur. 2018, 4–5, 8–18. [Google Scholar] [CrossRef]


| Source | Resource Availability (m3) | |||
|---|---|---|---|---|
| Municipality | Vila Pouca de Aguiar and Bornes de Aguiar/Pedras Salgadas | |||
| Annual | In July and August | Annual | In July and August | |
| Springs | 1,246,123 | 166,188 | 317,580 | 21,017 |
| Drilled wells (8 h pumping every day) | 831,032 | 141,162 | 188,340 | 31,992 |
| Alluvial well | 470,844 | 62,779 | 470,844 | 62,779 |
| Resource demand (m3) | ||||
| Total consumption in 2011 | 1,099,302 | 314,086 | 457 332 | 171,500 |
| Balance (Surplus/deficit) | ||||
| Actual situation | 1,448,697 | 56,043 | 519,432 | –55,711 |
| Scenario “5–15” | 1,156,402 | –9577 | 401,994 | –87,226 |
| Identification and Characterization | Water Availability | Location Constraints | Global Rank | |||||||
|---|---|---|---|---|---|---|---|---|---|---|
| Catchment | Area (km2) | Long-Term Precipitation (mm/yr) | Surface Water (Mm3/yr) | Groundwater (Mm3/yr) | Rank 1 | Forest Cover (%) | Rank 2 | Altitude Difference (m) | Rank 3 | |
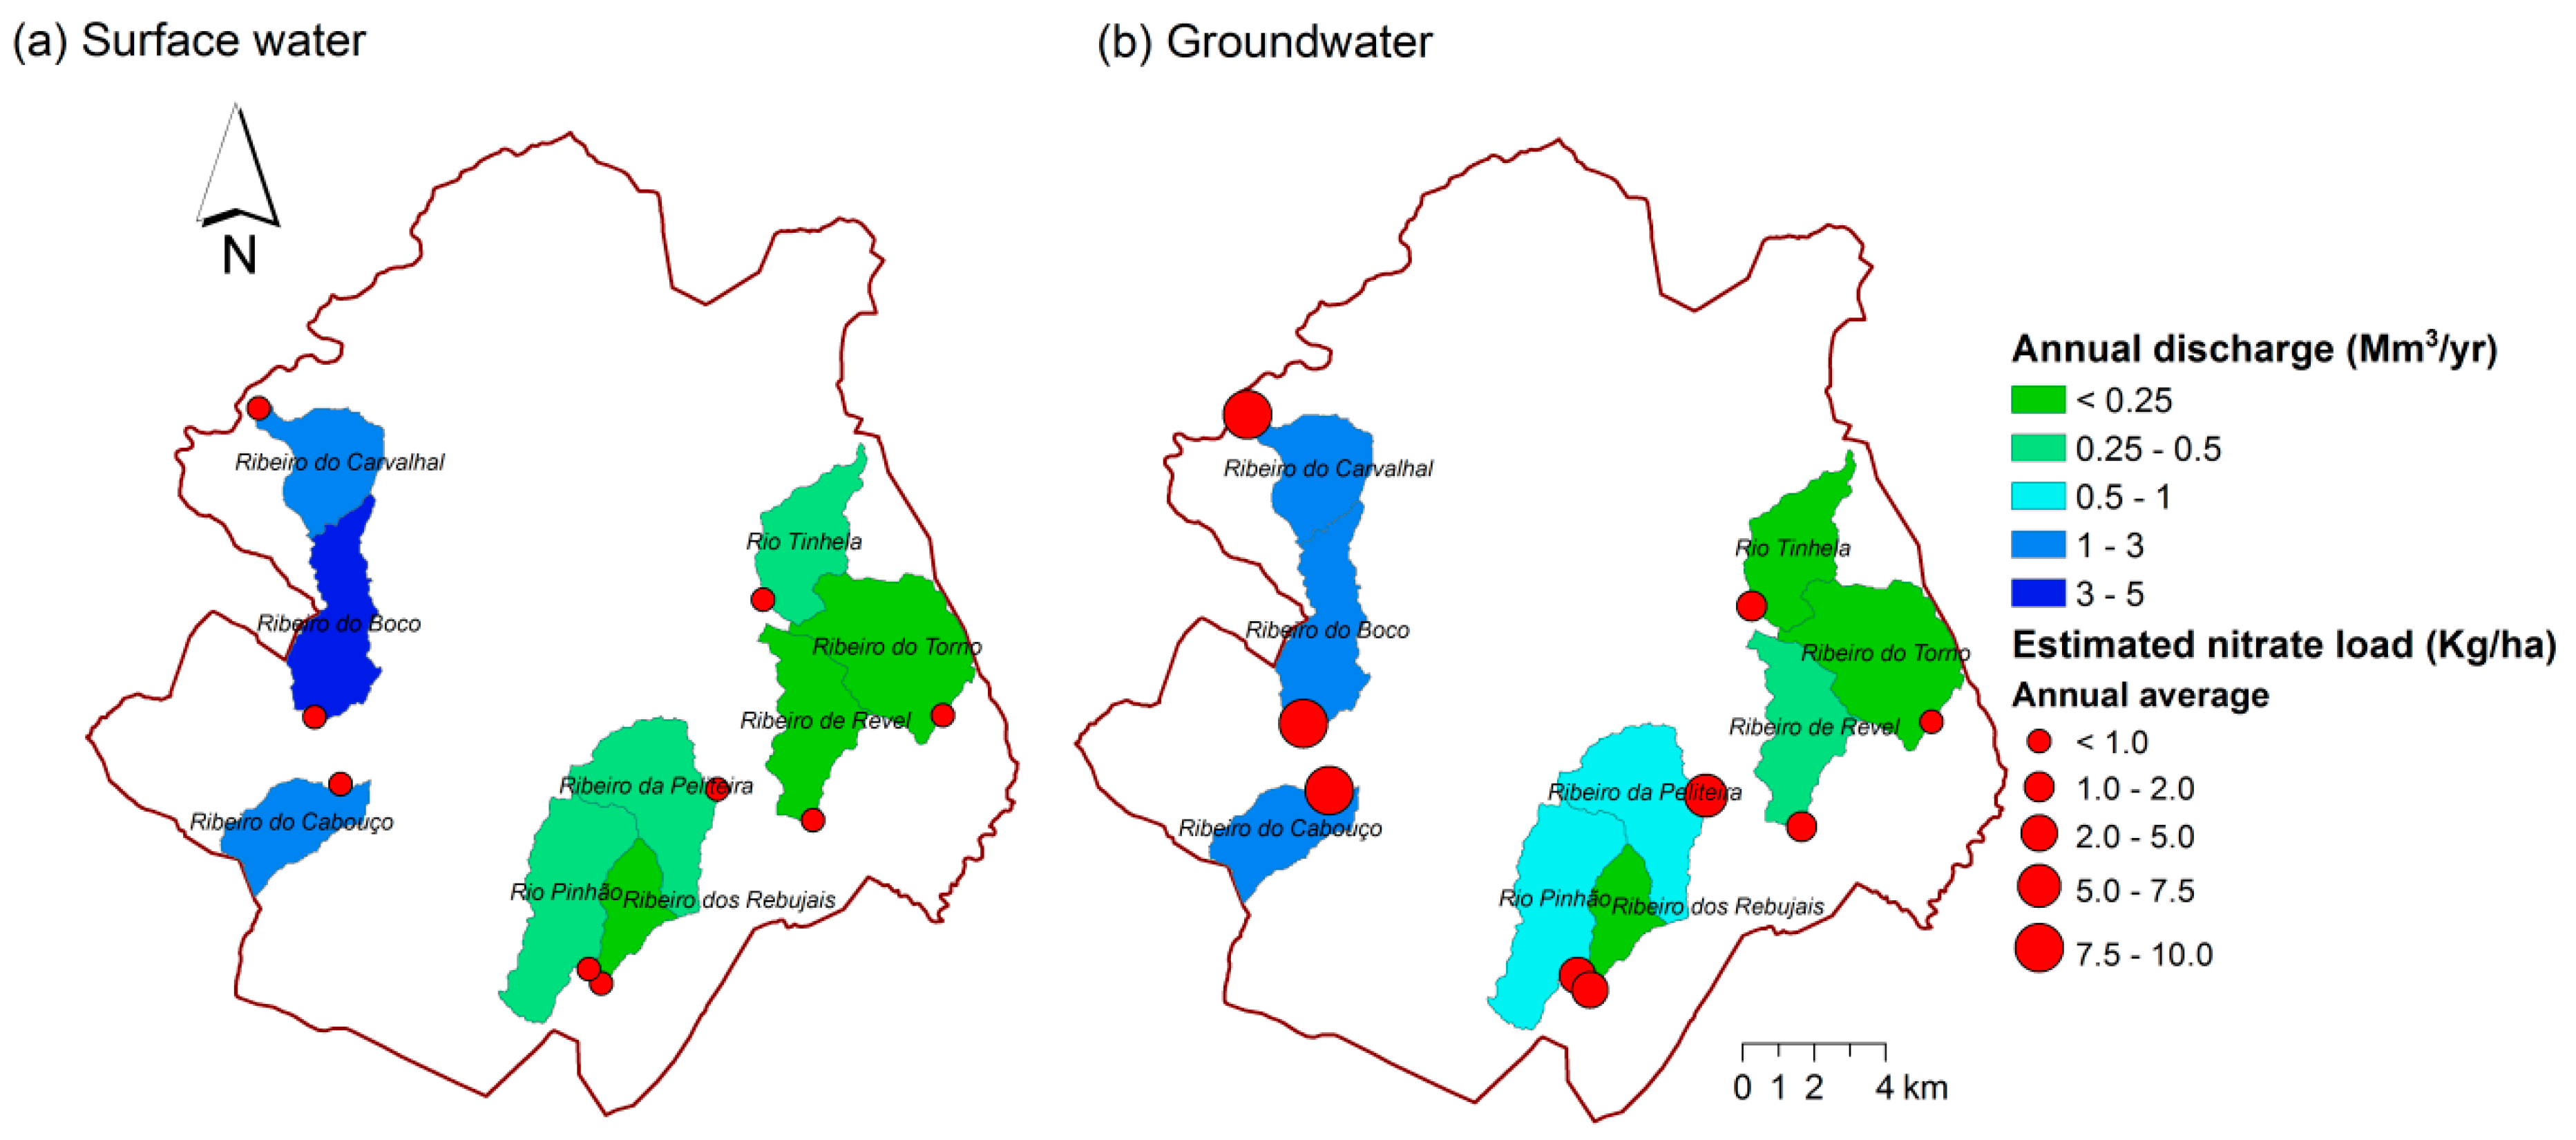
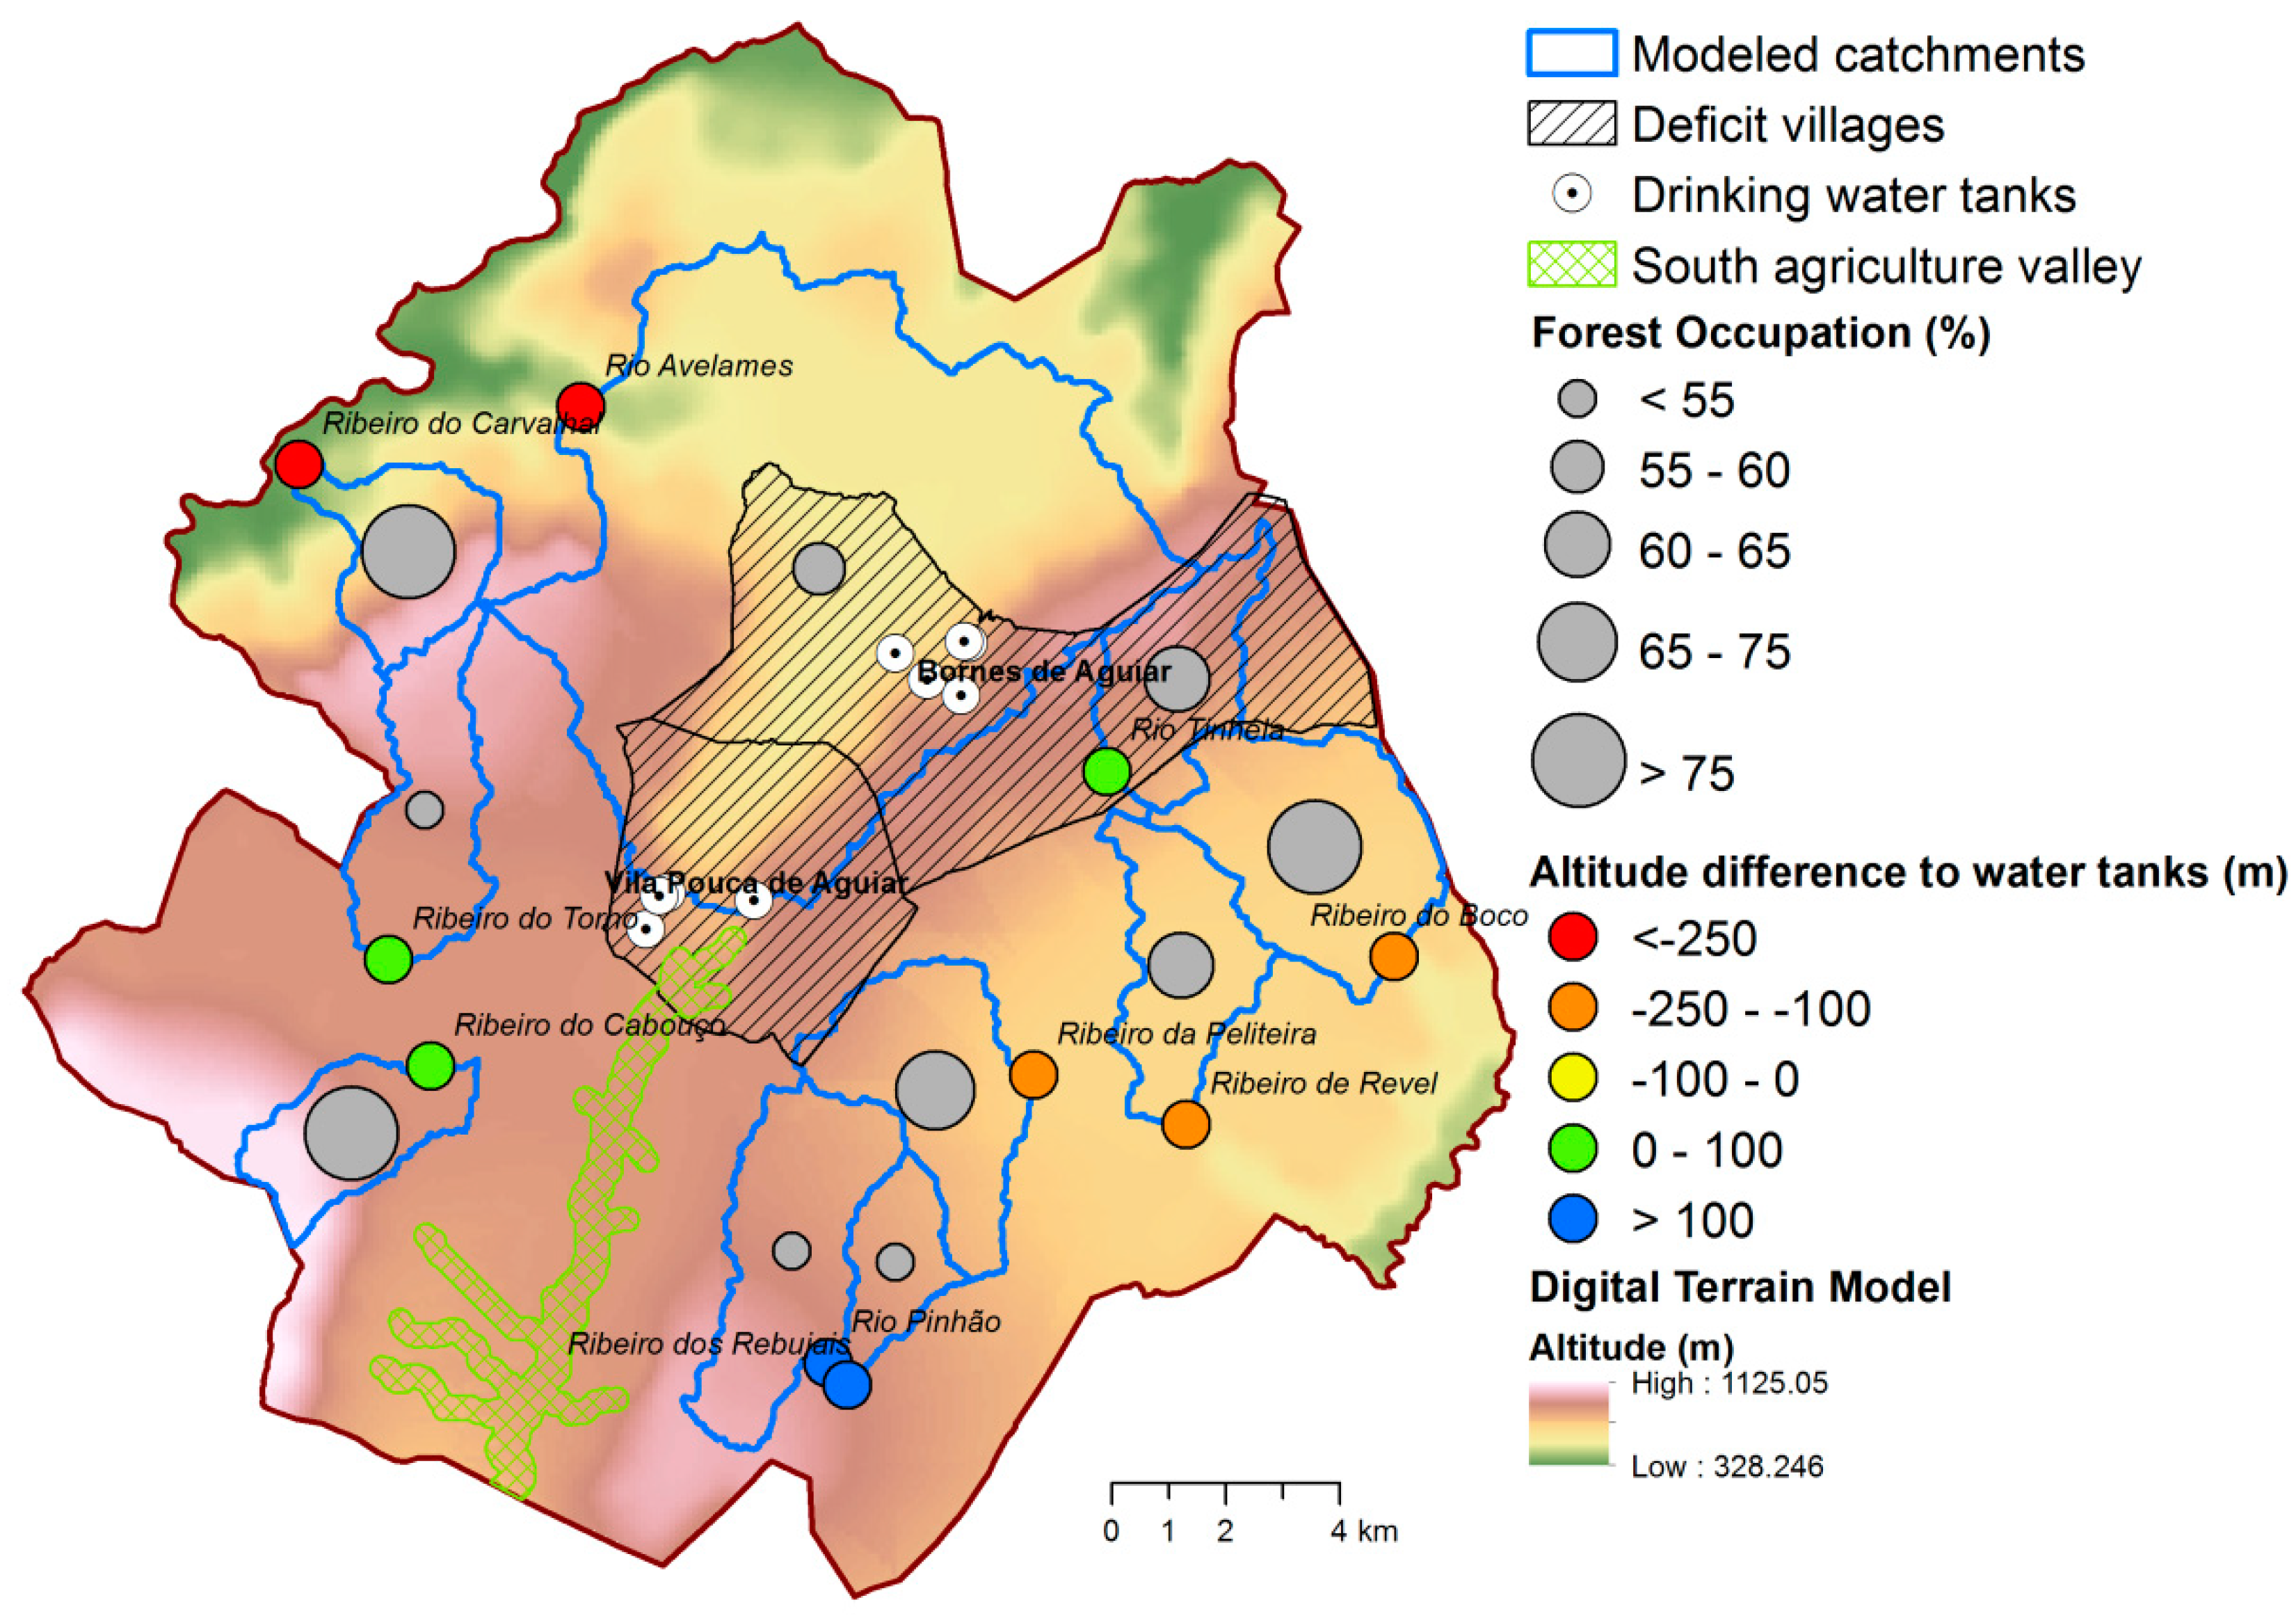
| Ribeiro do Cabouço | 7.1 | 1405.9 | 2.4 | 1.5 | 7.0 | 84.8 | 8.0 | 86.8 | 6.0 | 21.0 |
| Ribeiro do Carvalhal | 7.9 | 1405.9 | 2.7 | 1.3 | 8.0 | 88.8 | 9.0 | -411.2 | 1.0 | 18.0 |
| Rio Pinhão | 13.0 | 815.4 | 0.4 | 1.0 | 6.0 | 52.1 | 2.0 | 138.2 | 9.0 | 17.0 |
| Ribeiro do Torno | 14.6 | 665.2 | 0.2 | 0.2 | 3.0 | 81.3 | 7.0 | 87.0 | 7.0 | 17.0 |
| Ribeiro da Peliteira | 11.8 | 815.4 | 0.4 | 0.9 | 5.0 | 66.3 | 6.0 | -108.7 | 4.0 | 15.0 |
| Rio Tinhela | 8.3 | 815.4 | 0.3 | 0.2 | 4.0 | 64.6 | 5.0 | 73.4 | 5.0 | 14.0 |
| Ribeiro do Boco | 9.8 | 1405.9 | 3.4 | 2.1 | 9.0 | 53.0 | 3.0 | -190.7 | 2.0 | 14.0 |
| Ribeiro dos Rebujais | 4.8 | 815.4 | 0.1 | 0.2 | 1.0 | 49.1 | 1.0 | 126.3 | 8.0 | 10.0 |
| Ribeiro de Revel | 9.3 | 815.4 | 0.2 | 0.3 | 2.0 | 62.9 | 4.0 | -115.8 | 3.0 | 9.0 |
© 2019 by the authors. Licensee MDPI, Basel, Switzerland. This article is an open access article distributed under the terms and conditions of the Creative Commons Attribution (CC BY) license (http://creativecommons.org/licenses/by/4.0/).
Share and Cite
Soares, S.; Terêncio, D.; Fernandes, L.; Machado, J.; Pacheco, F.A.L. The Potential of Small Dams for Conjunctive Water Management in Rural Municipalities. Int. J. Environ. Res. Public Health 2019, 16, 1239. https://doi.org/10.3390/ijerph16071239
Soares S, Terêncio D, Fernandes L, Machado J, Pacheco FAL. The Potential of Small Dams for Conjunctive Water Management in Rural Municipalities. International Journal of Environmental Research and Public Health. 2019; 16(7):1239. https://doi.org/10.3390/ijerph16071239
Chicago/Turabian StyleSoares, Sara, Daniela Terêncio, Luís Fernandes, João Machado, and Fernando A.L. Pacheco. 2019. "The Potential of Small Dams for Conjunctive Water Management in Rural Municipalities" International Journal of Environmental Research and Public Health 16, no. 7: 1239. https://doi.org/10.3390/ijerph16071239
APA StyleSoares, S., Terêncio, D., Fernandes, L., Machado, J., & Pacheco, F. A. L. (2019). The Potential of Small Dams for Conjunctive Water Management in Rural Municipalities. International Journal of Environmental Research and Public Health, 16(7), 1239. https://doi.org/10.3390/ijerph16071239