A Framework for Rice Heavy Metal Stress Monitoring Based on Phenological Phase Space and Temporal Profile Analysis

Abstract
1. Introduction
2. Materials
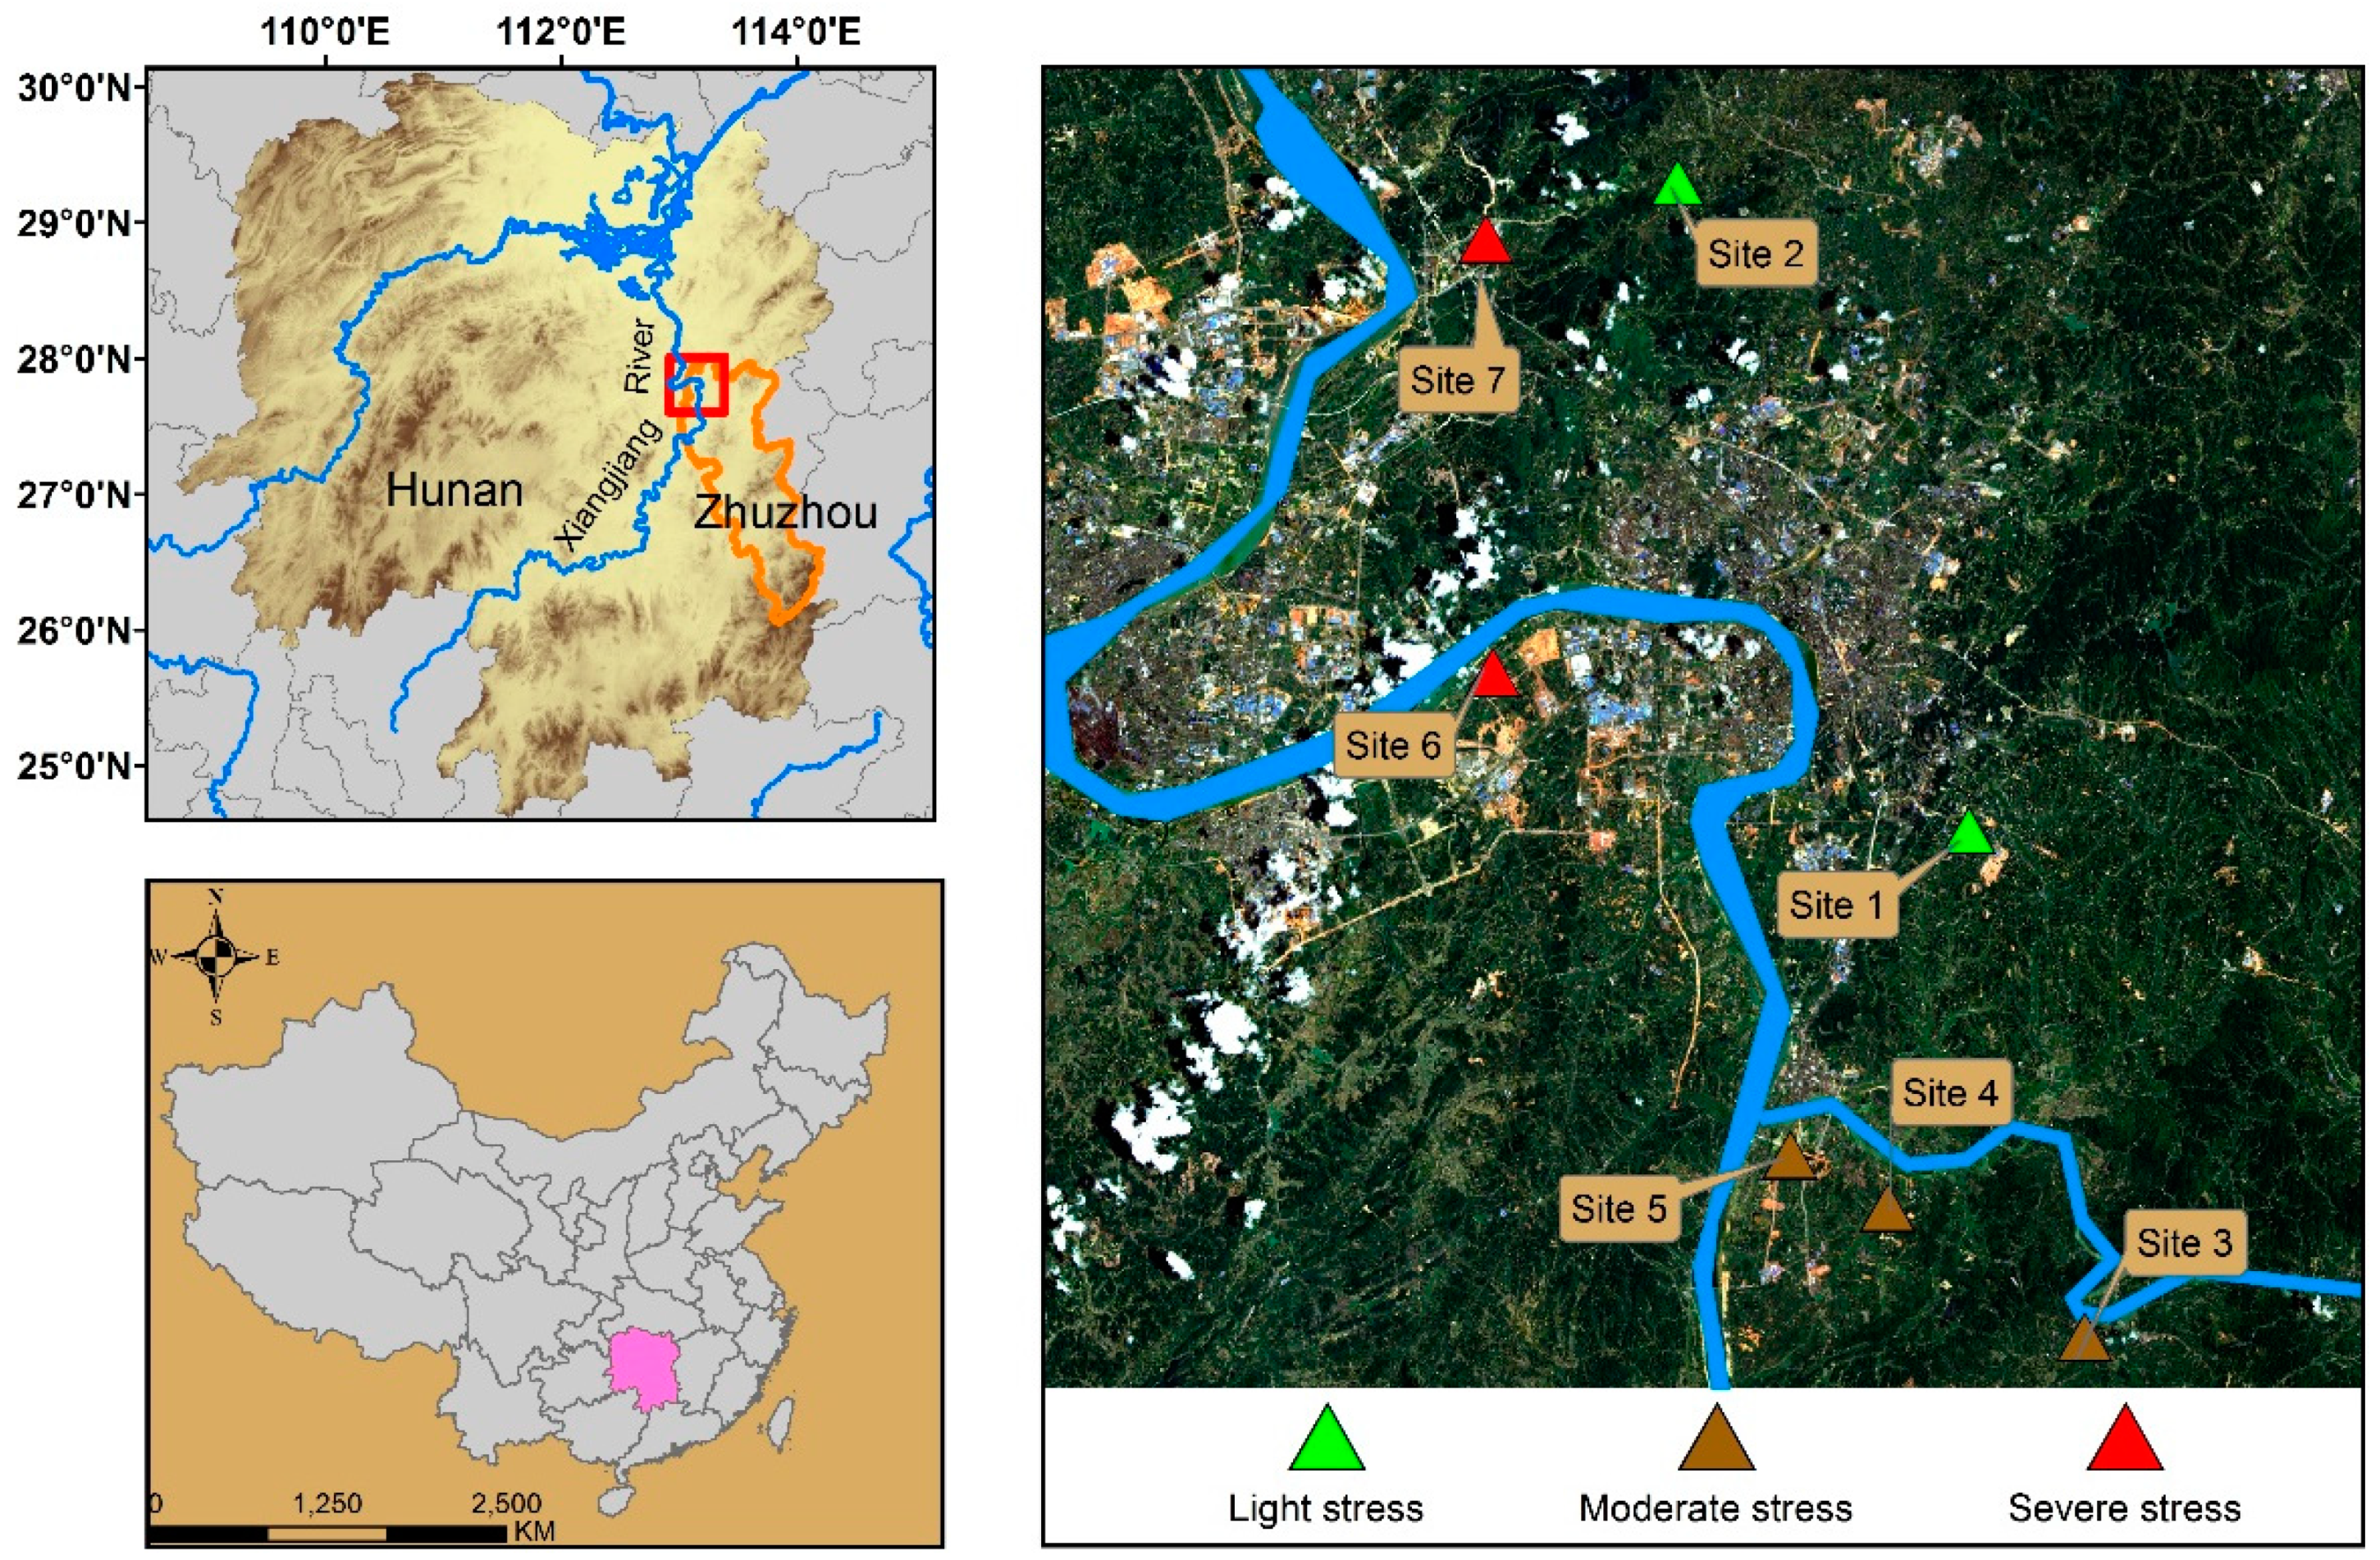
2.1. Study Area
2.2. Field Sampling
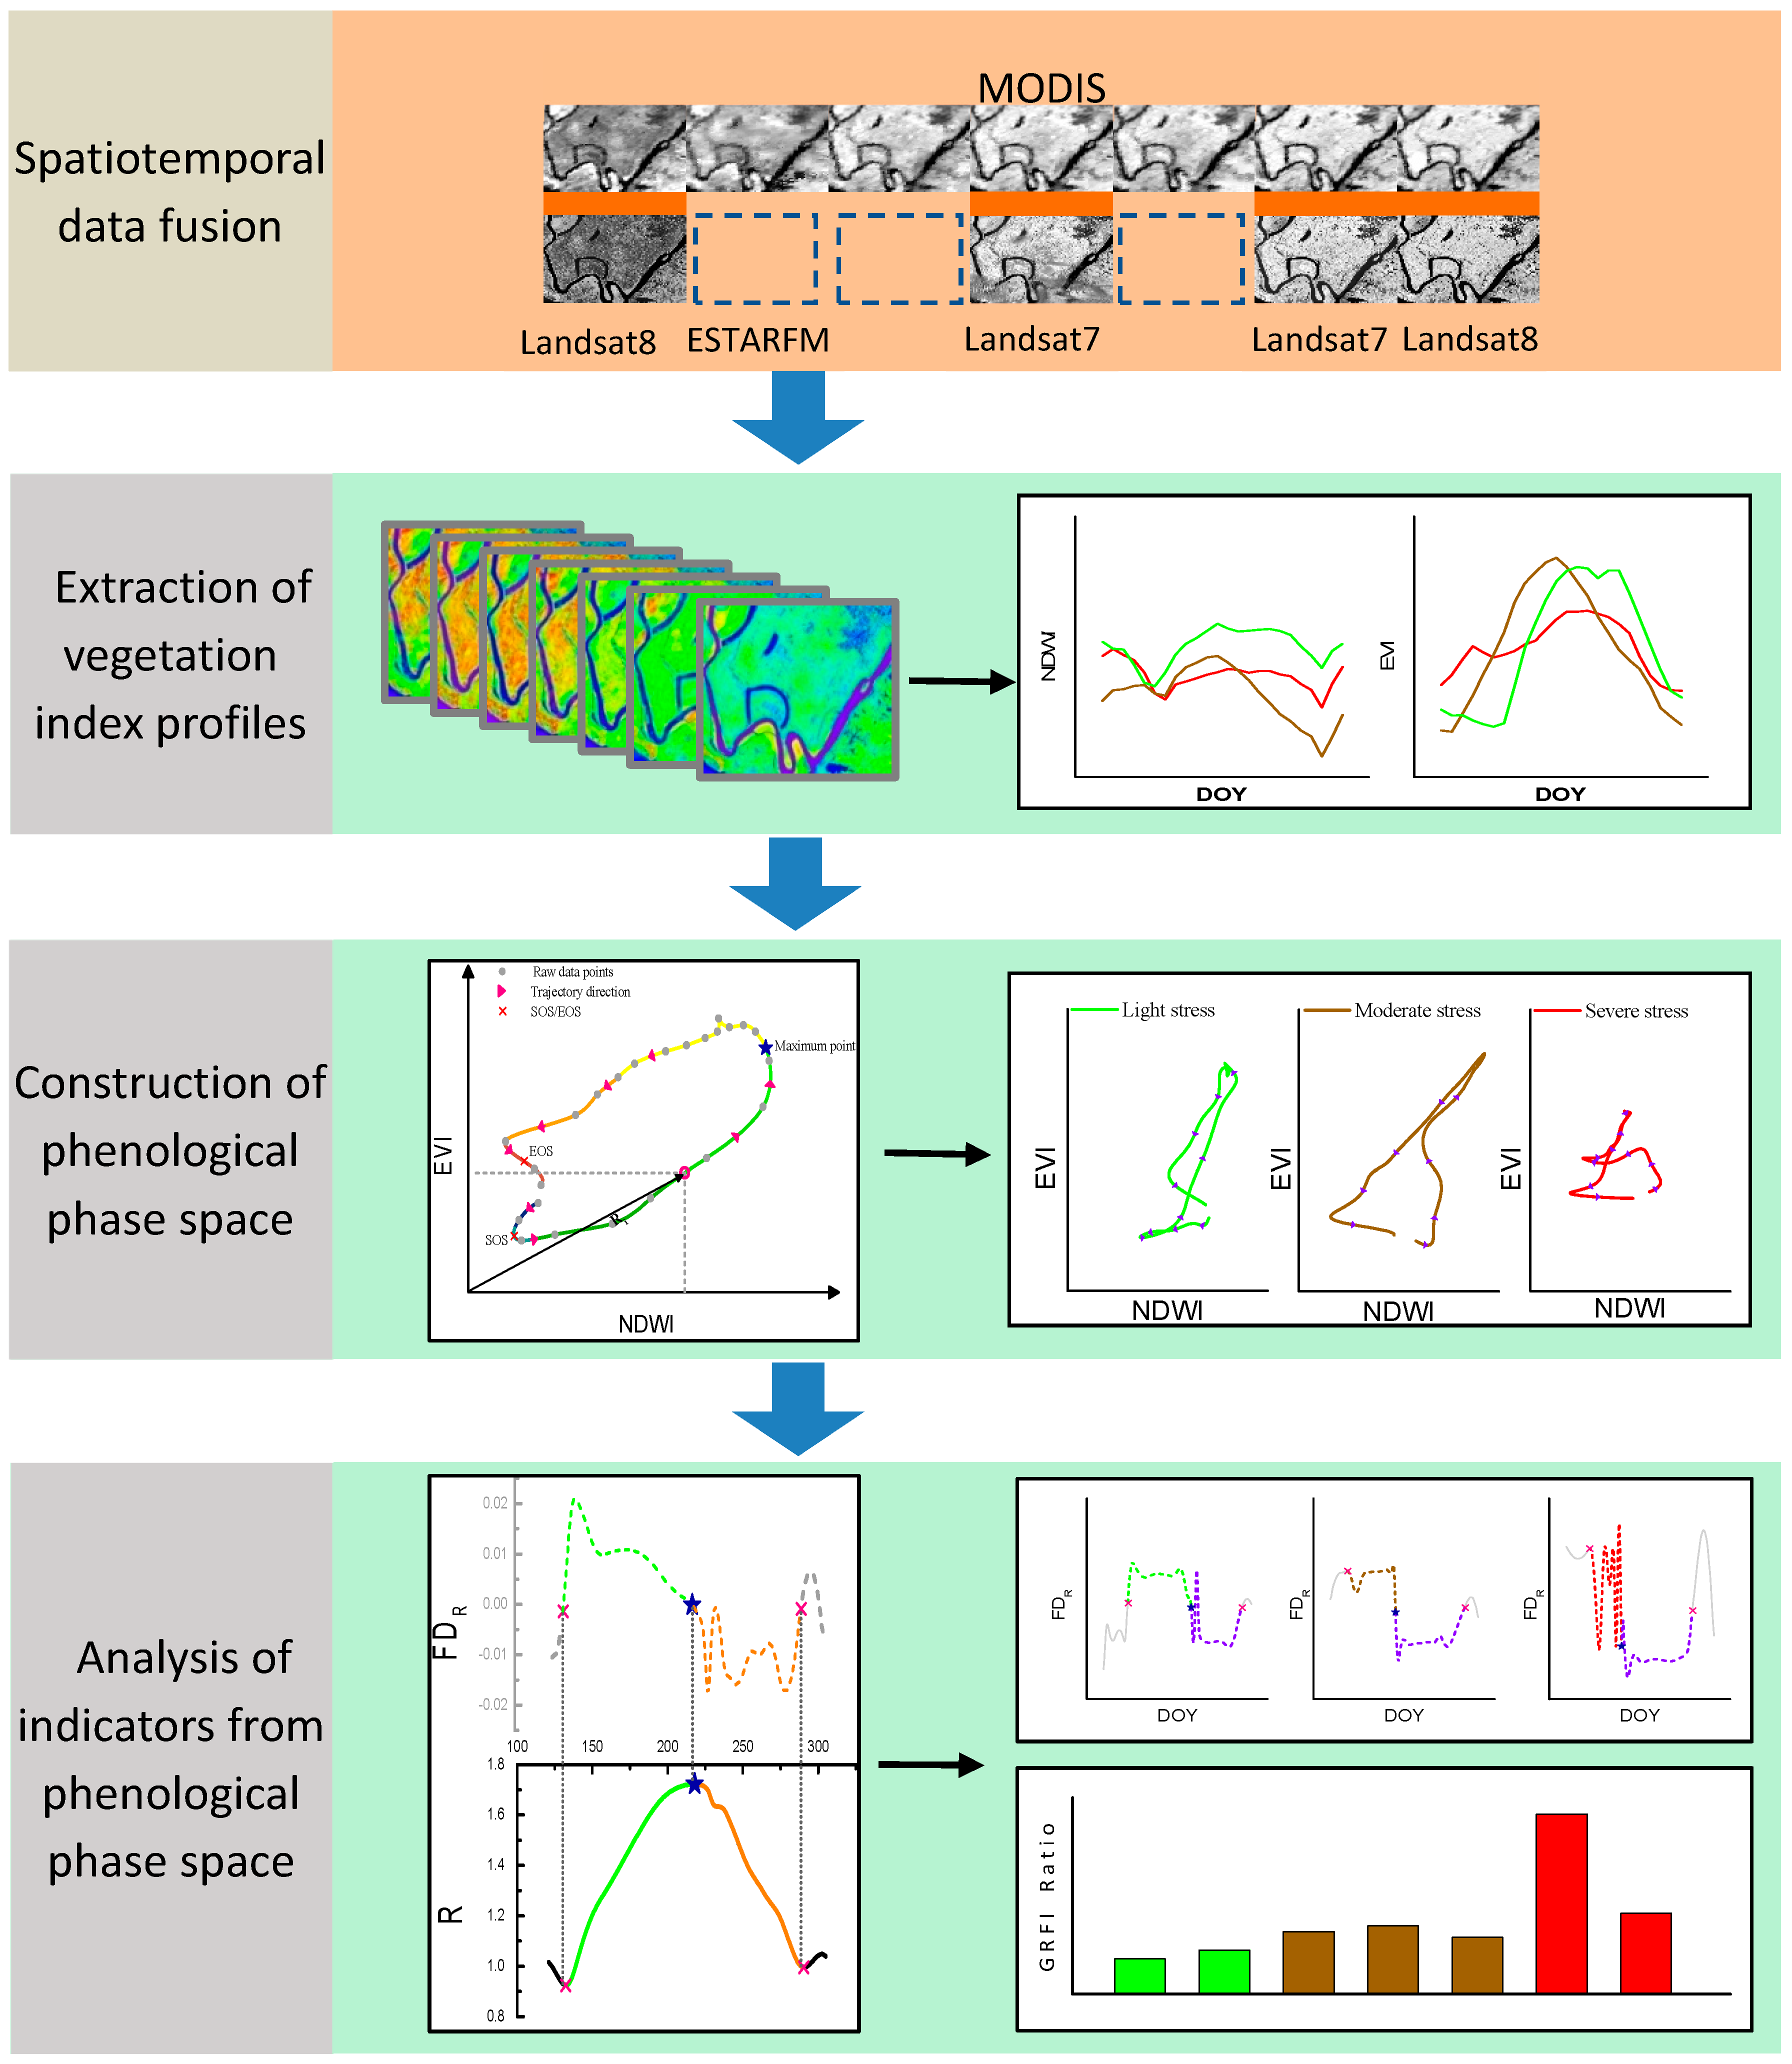
3. Method
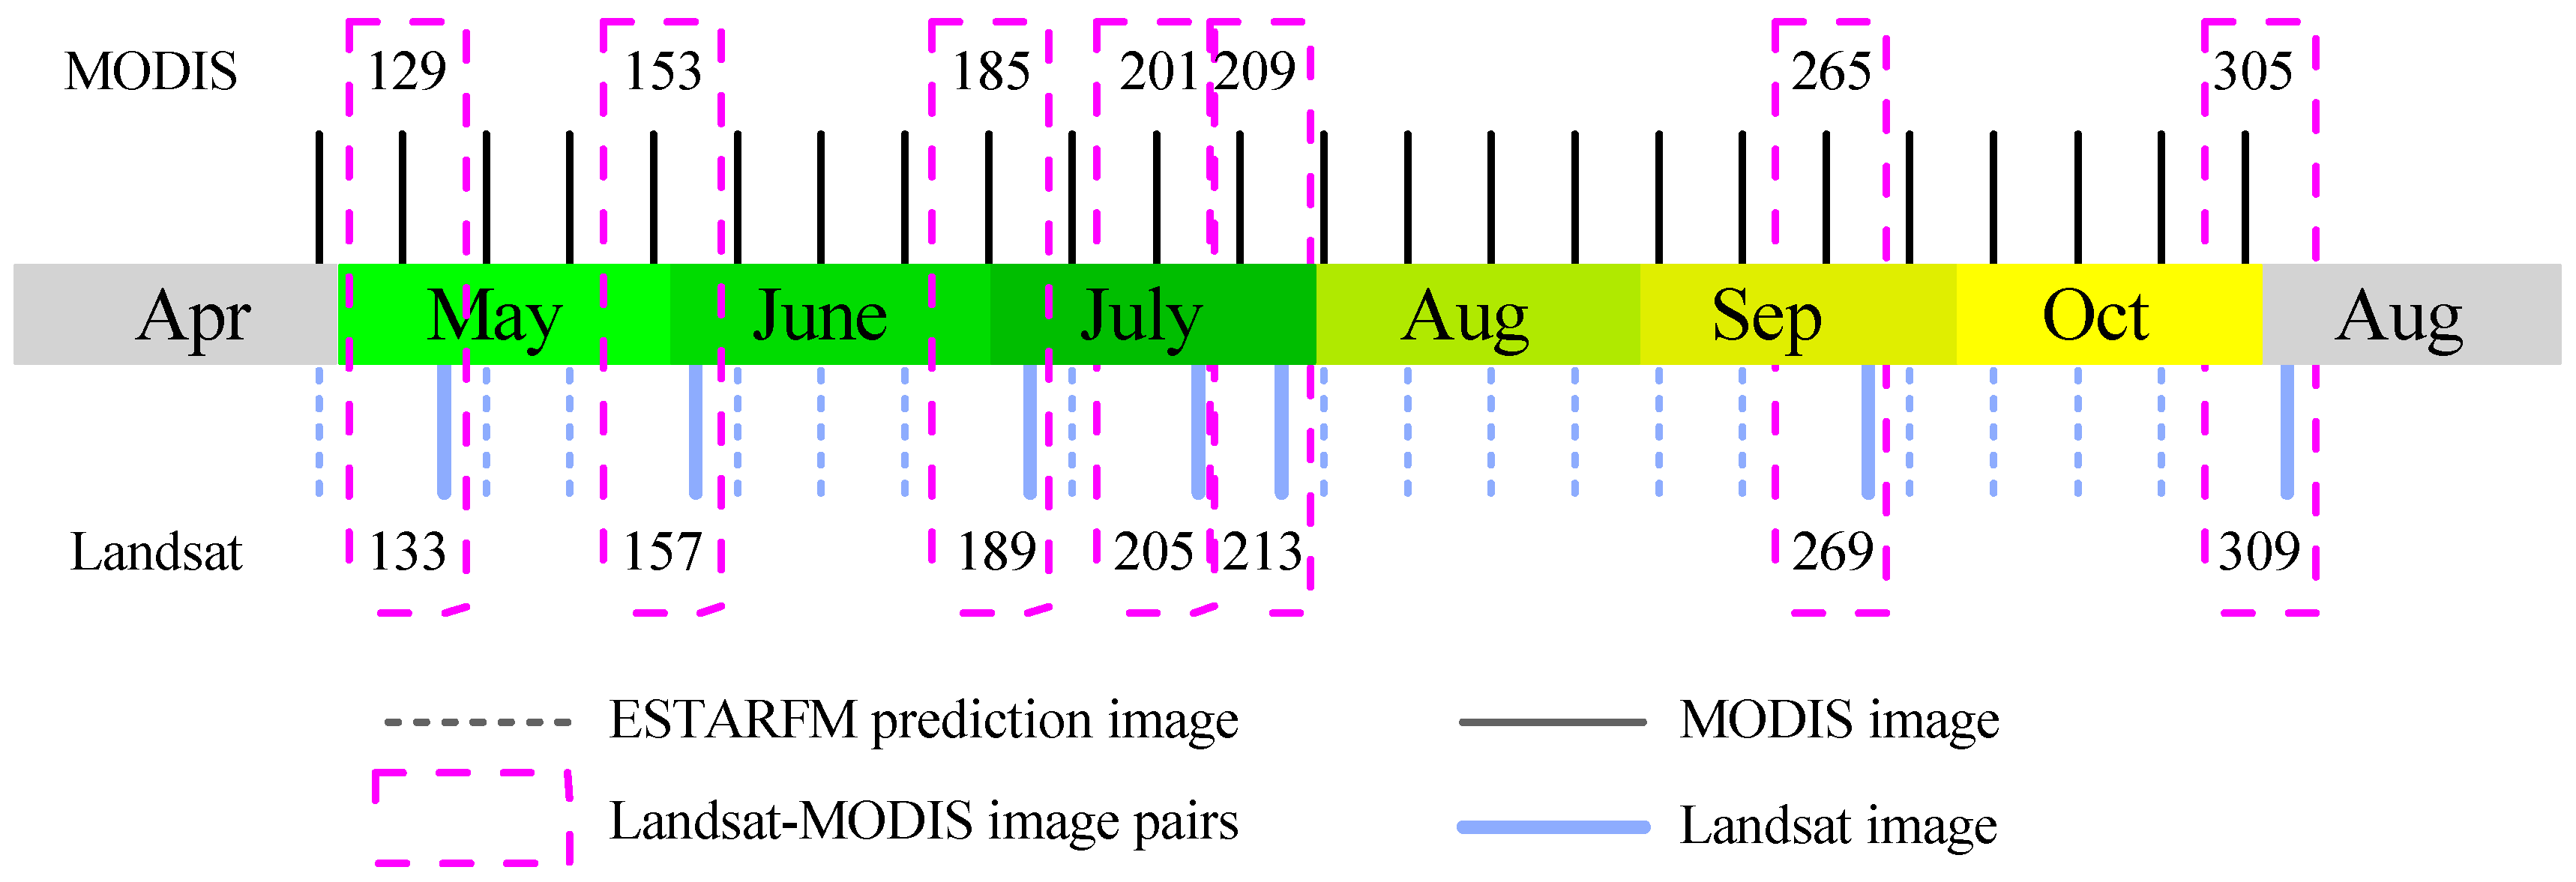
3.1. The Generation of Synthetic Landsat Time Series
3.1.1. Data Preparation
3.1.2. Generation of Synthetic Landsat Time-Series Data using ESTARFM
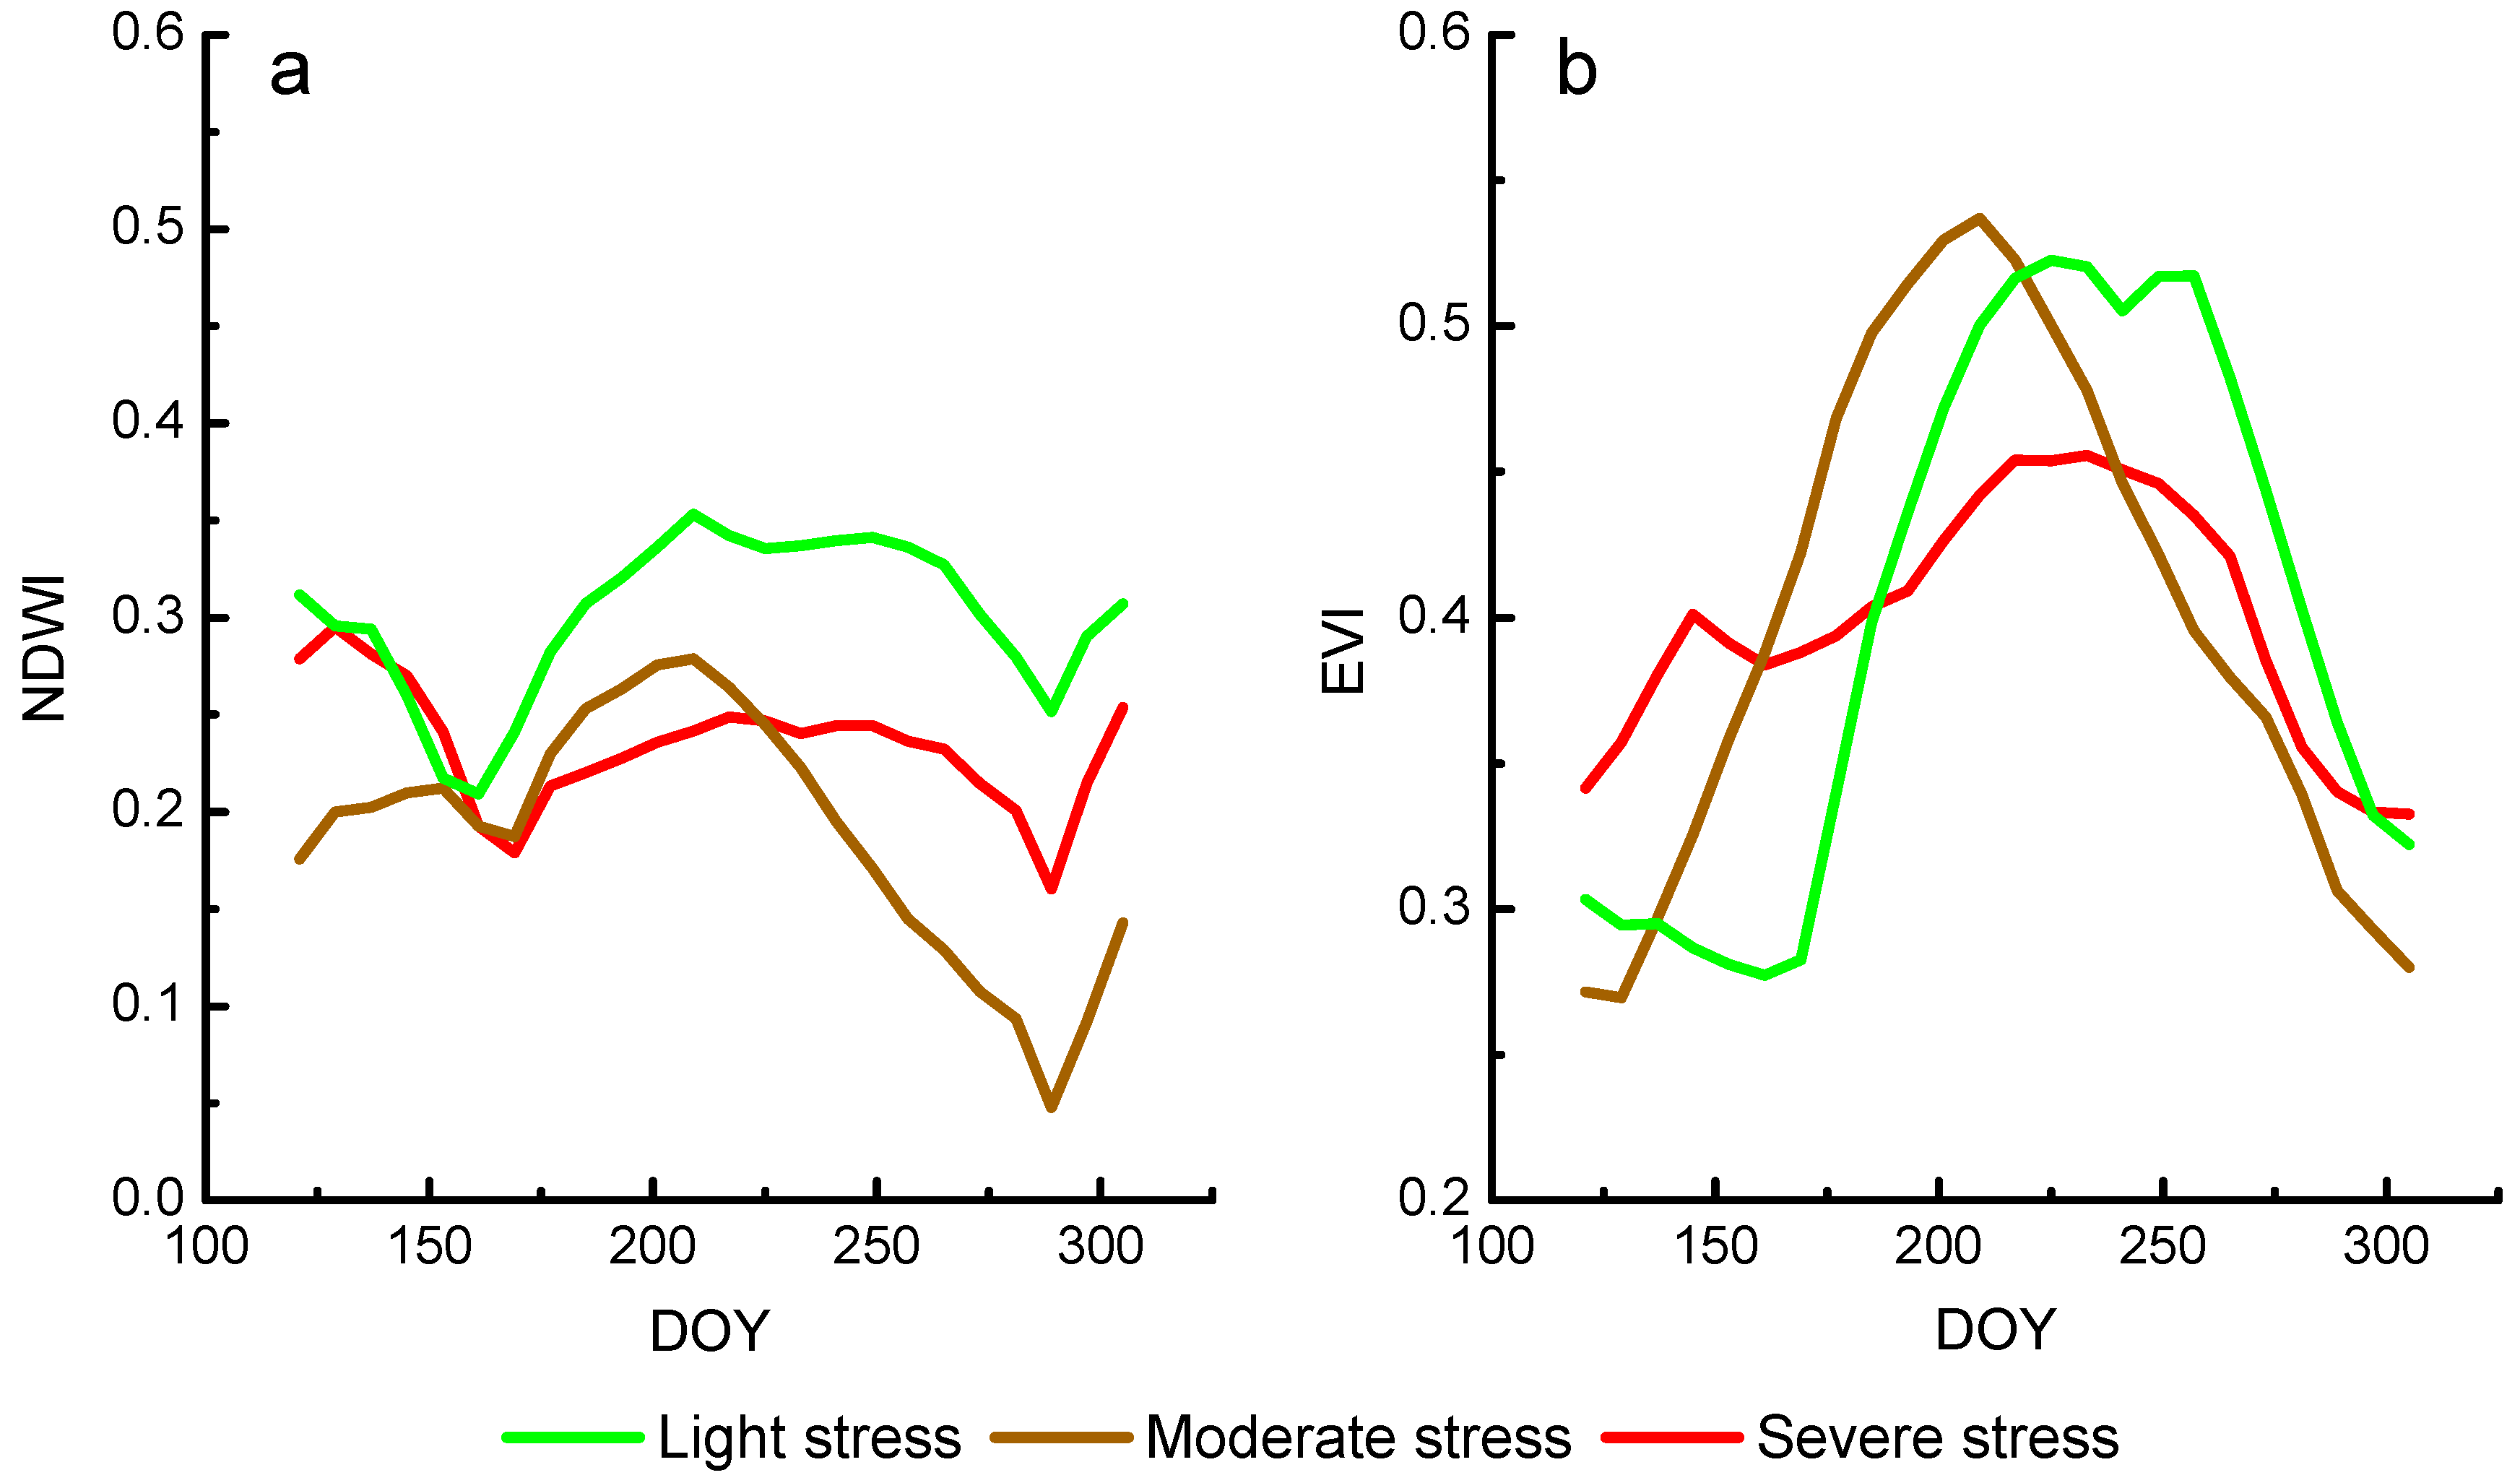
3.2. Extraction of Vegetation Index Profiles from Synthetic Landsat Time-Series Data
3.2.1. Selection of Vegetation Indices
3.2.2. Extraction of Vegetation Index Profiles
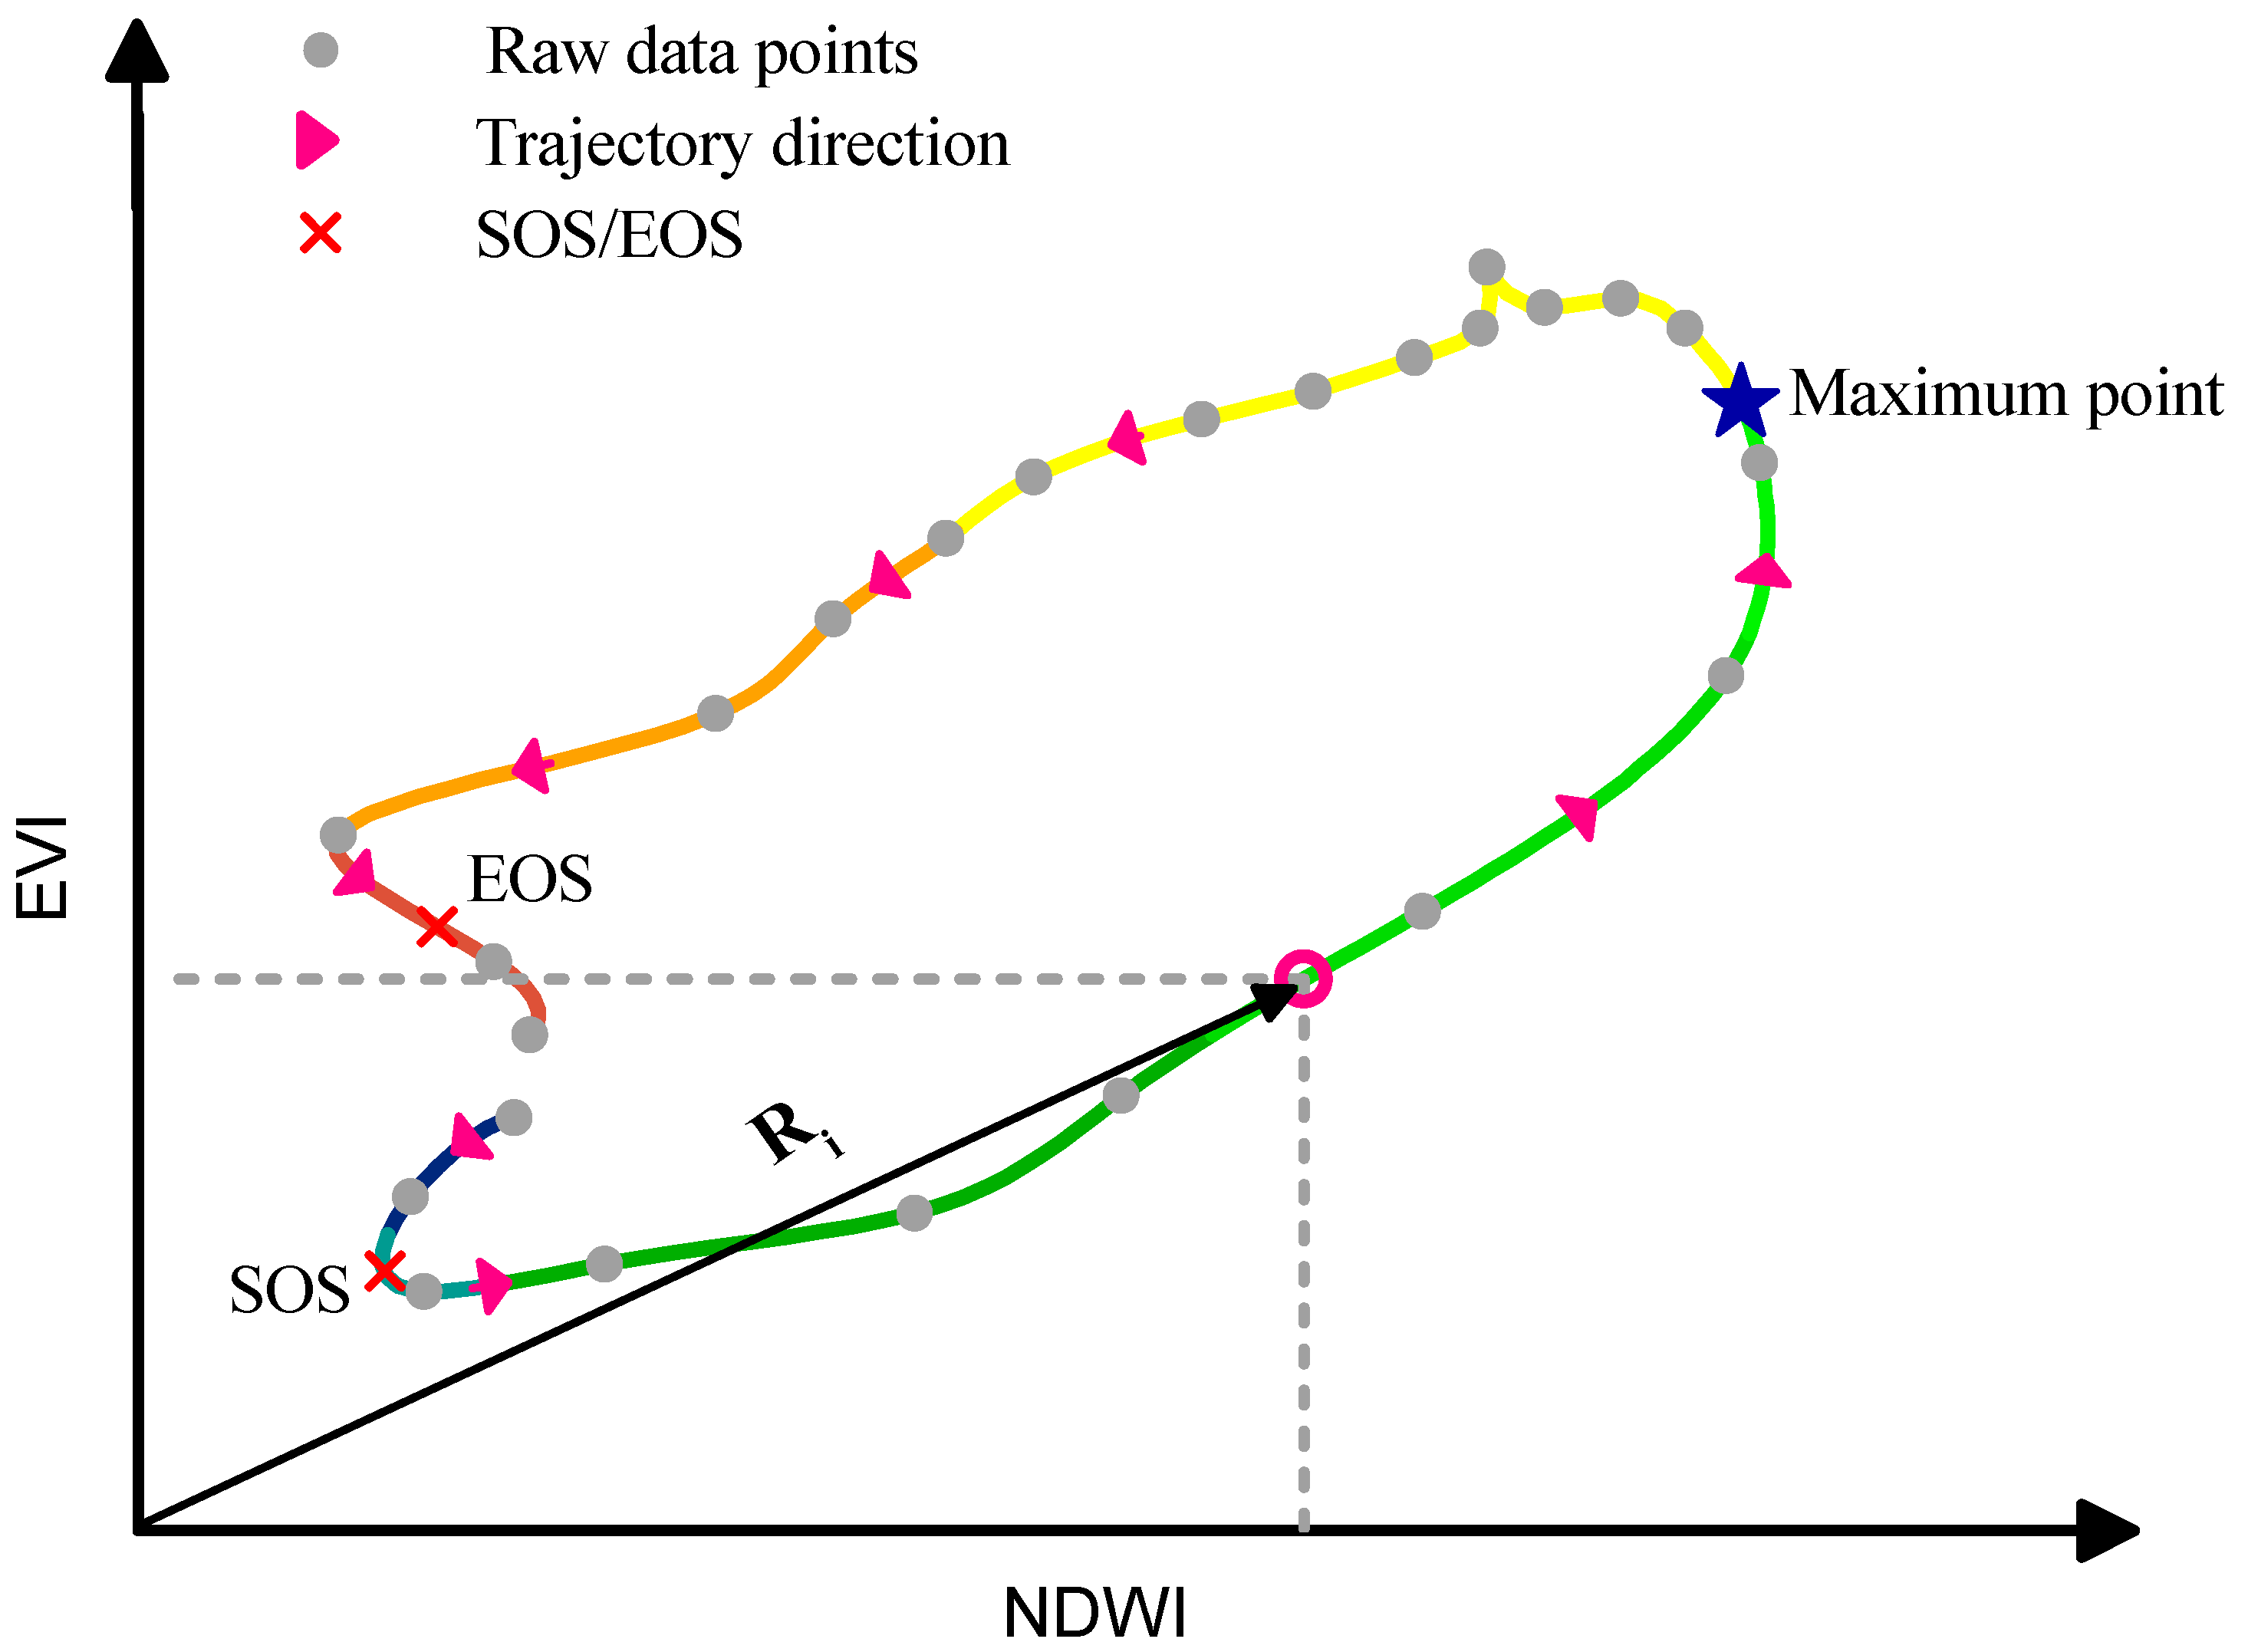
3.3. Construction of EVI-NDWI Phase Space
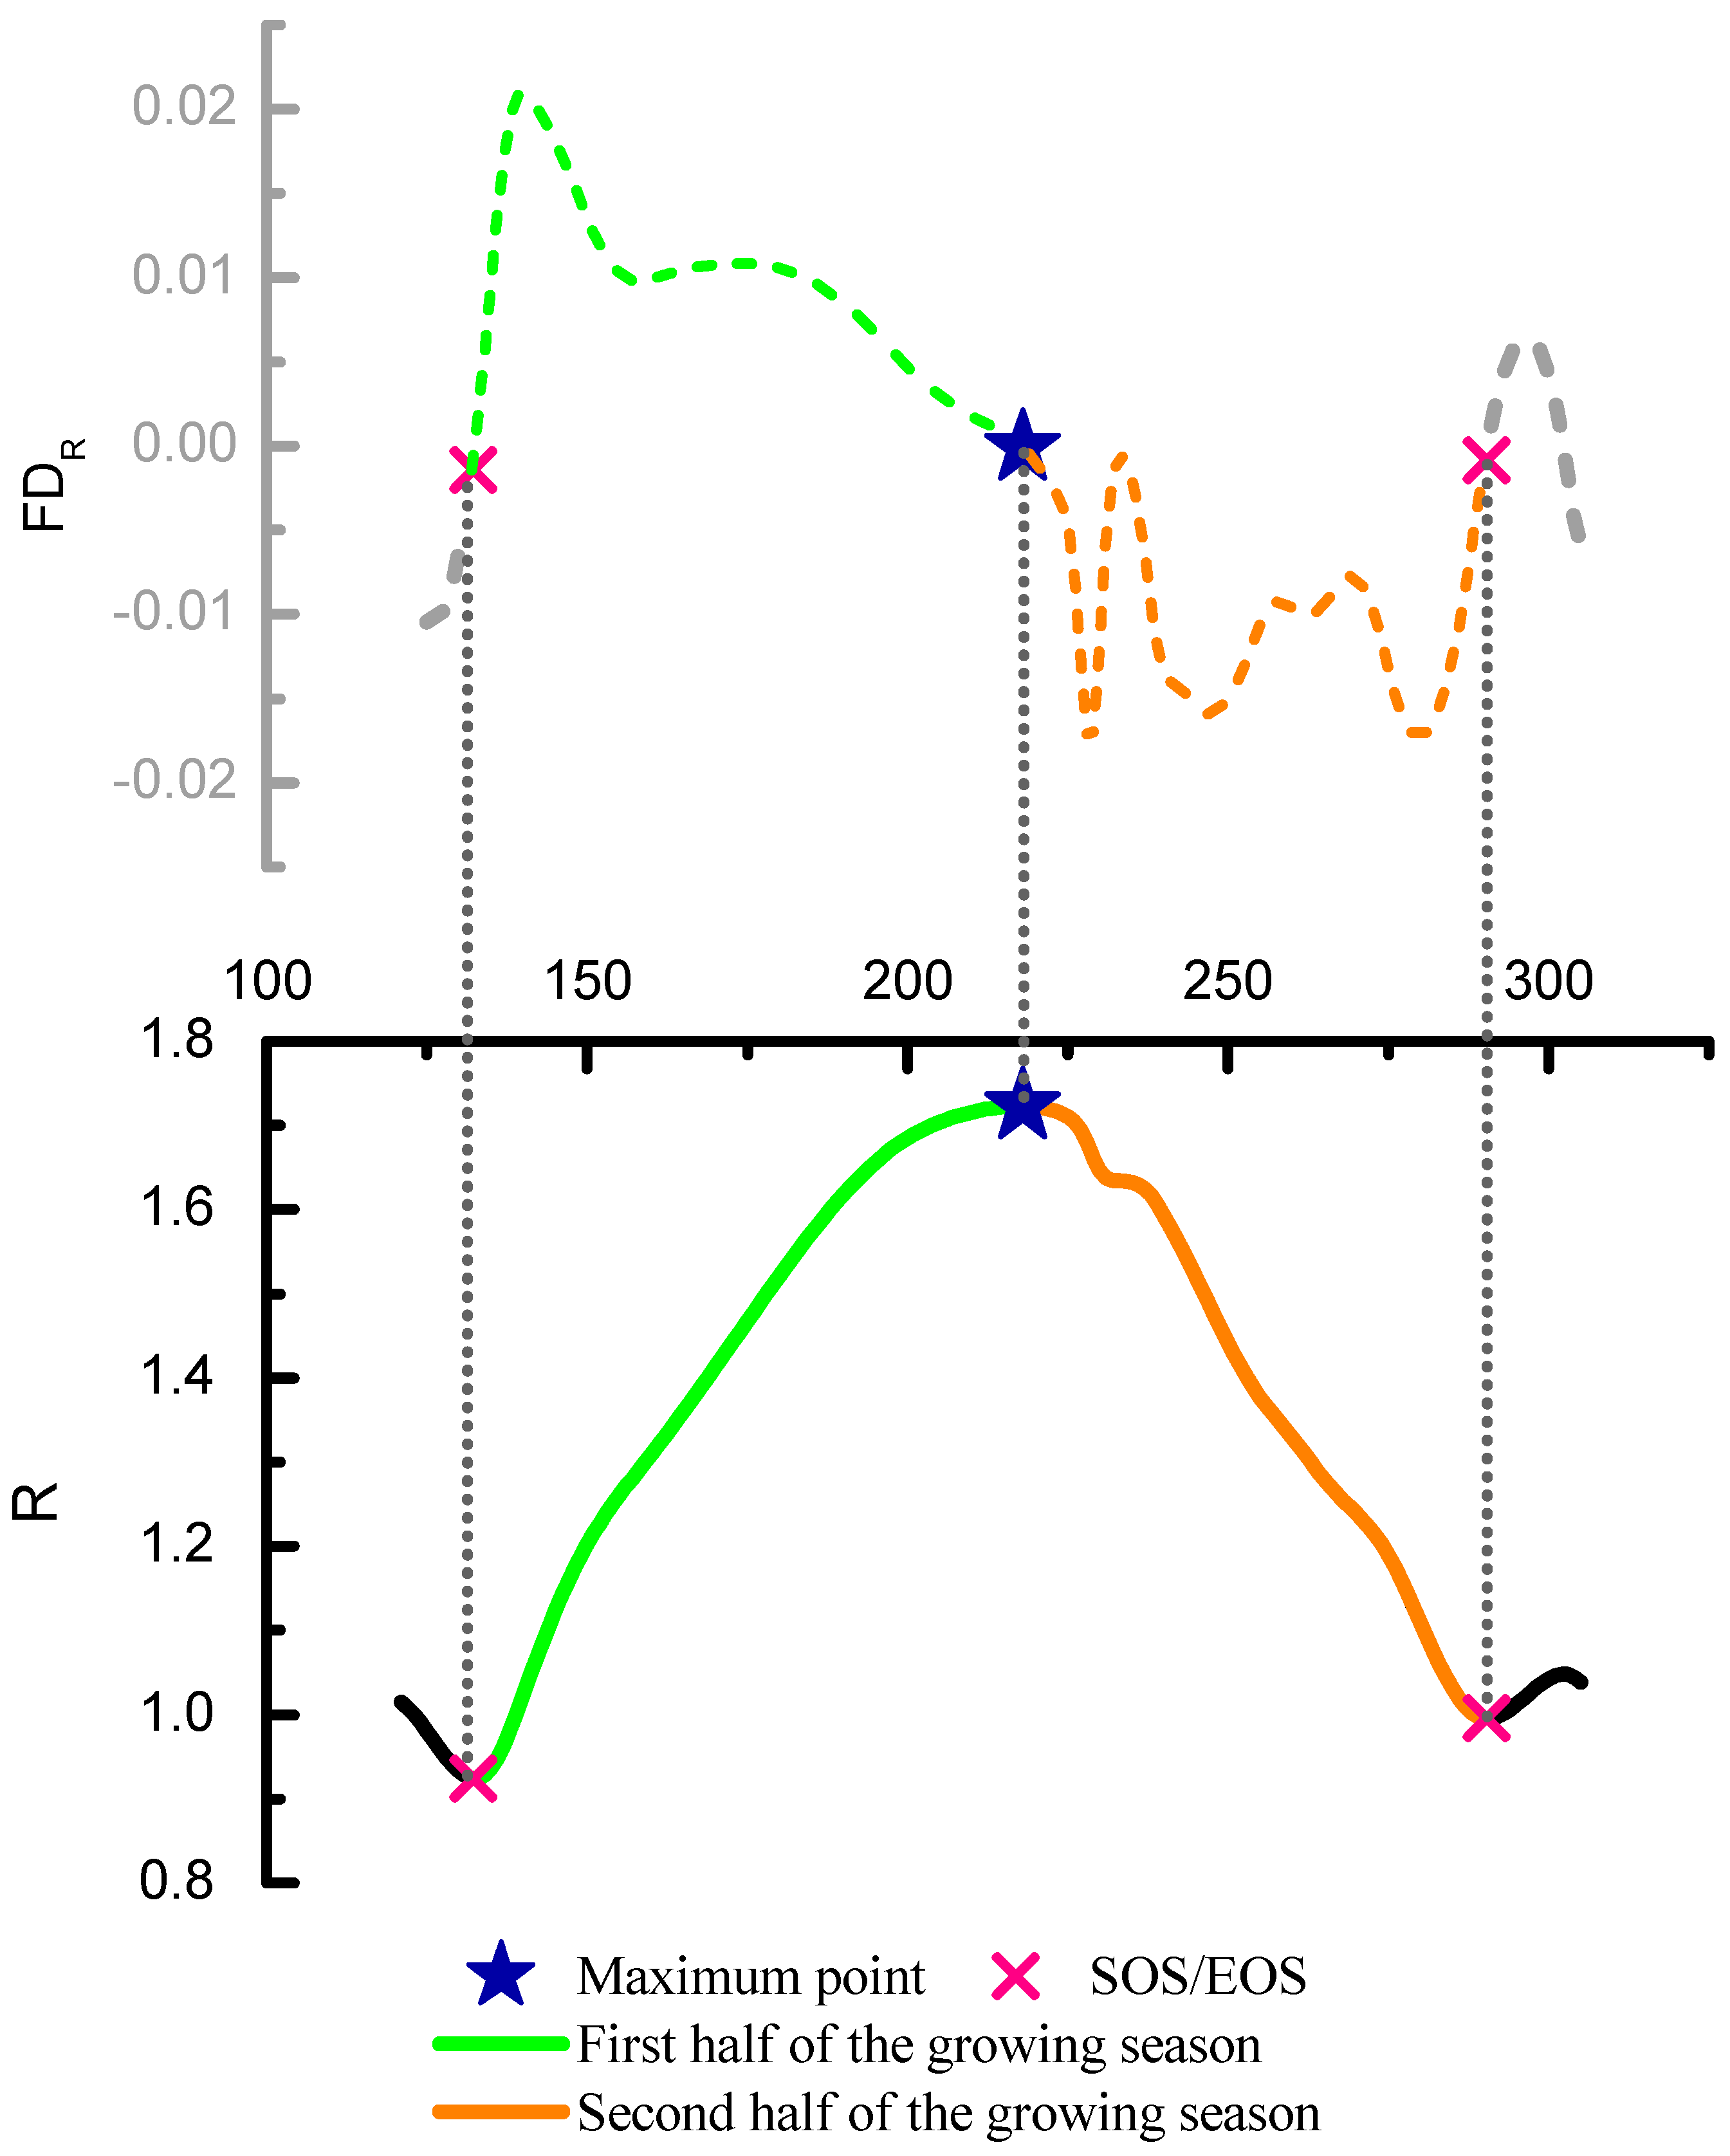
3.4. Construction of Indicators of Phenological Phase Space
4. Results
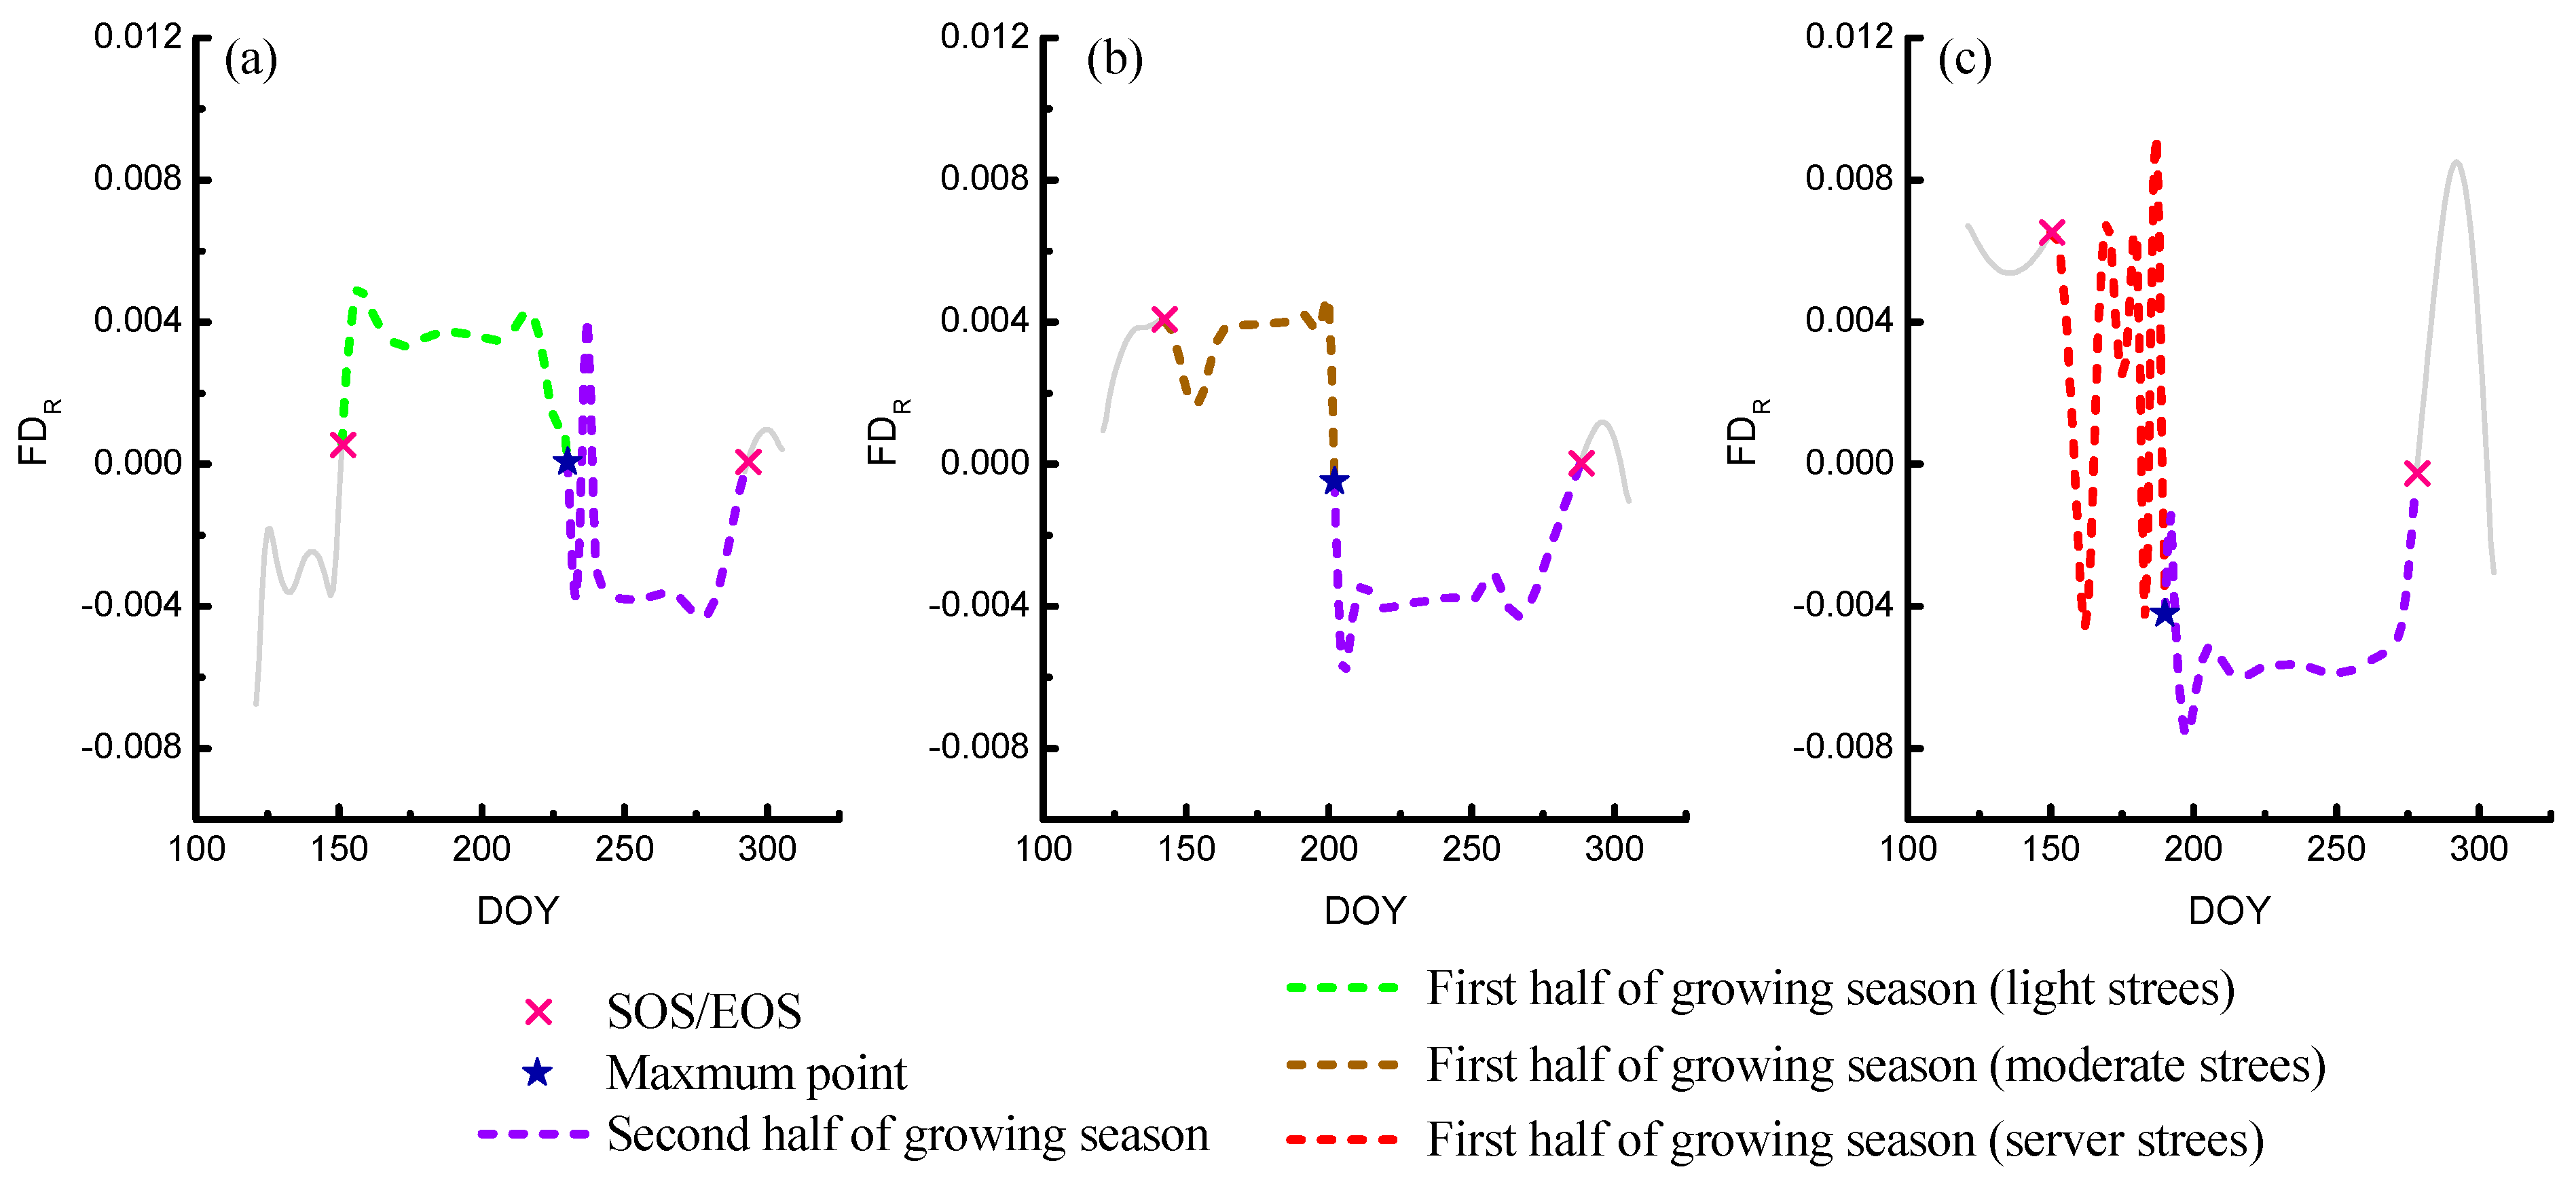
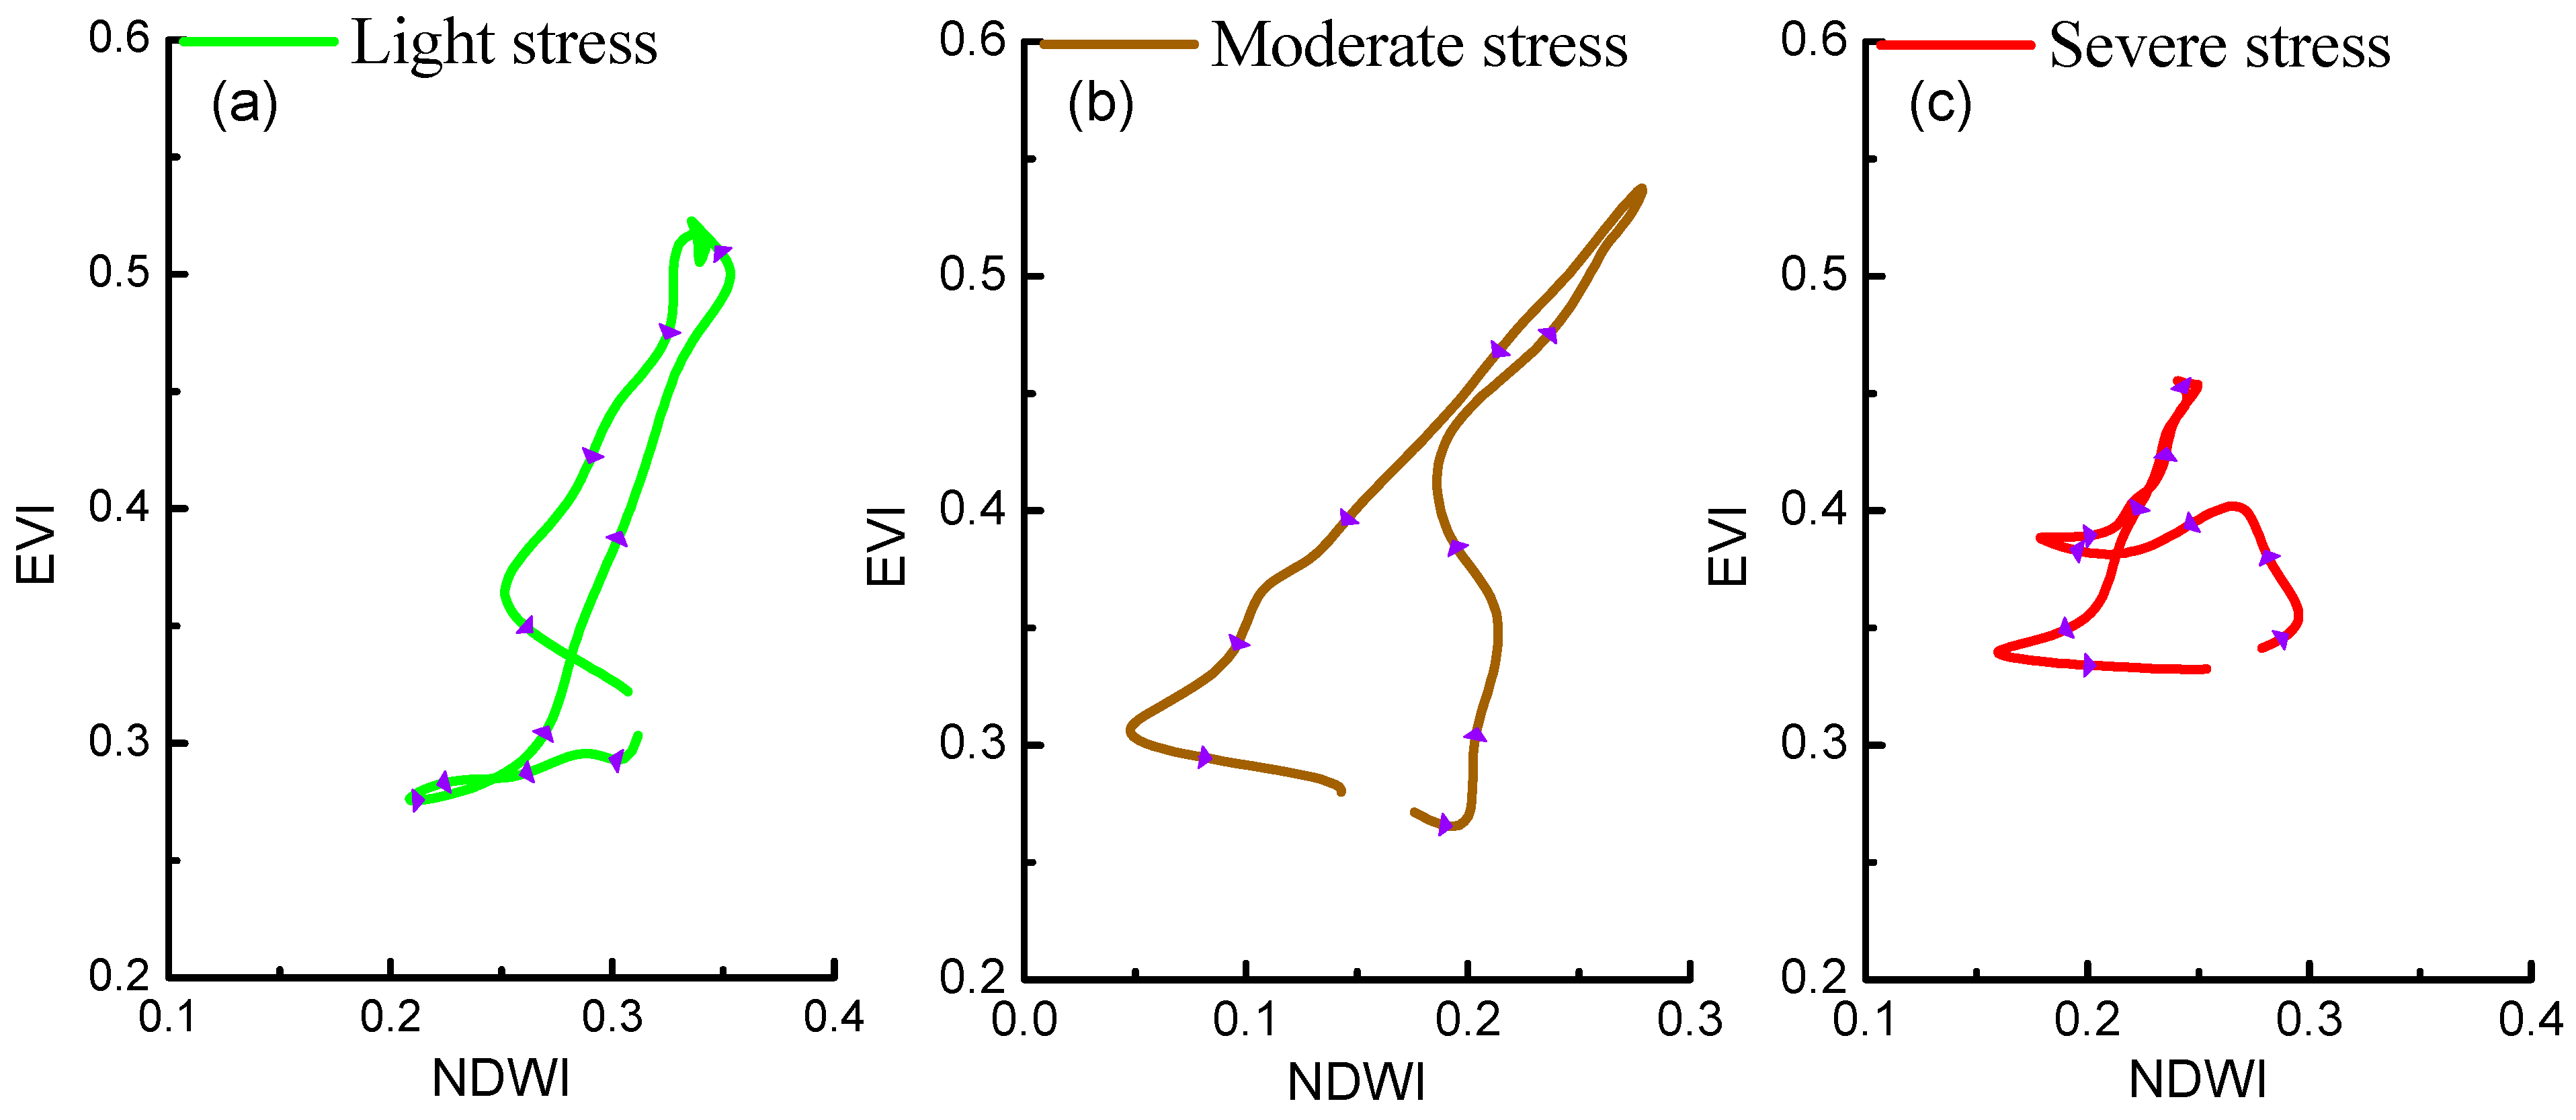
4.1. The Analysis of Rice Growth Trajectories under Different Heavy Metal Stress Levels
4.2. The Comparison of Phase Space Parameters under Different Heavy Metal Stress
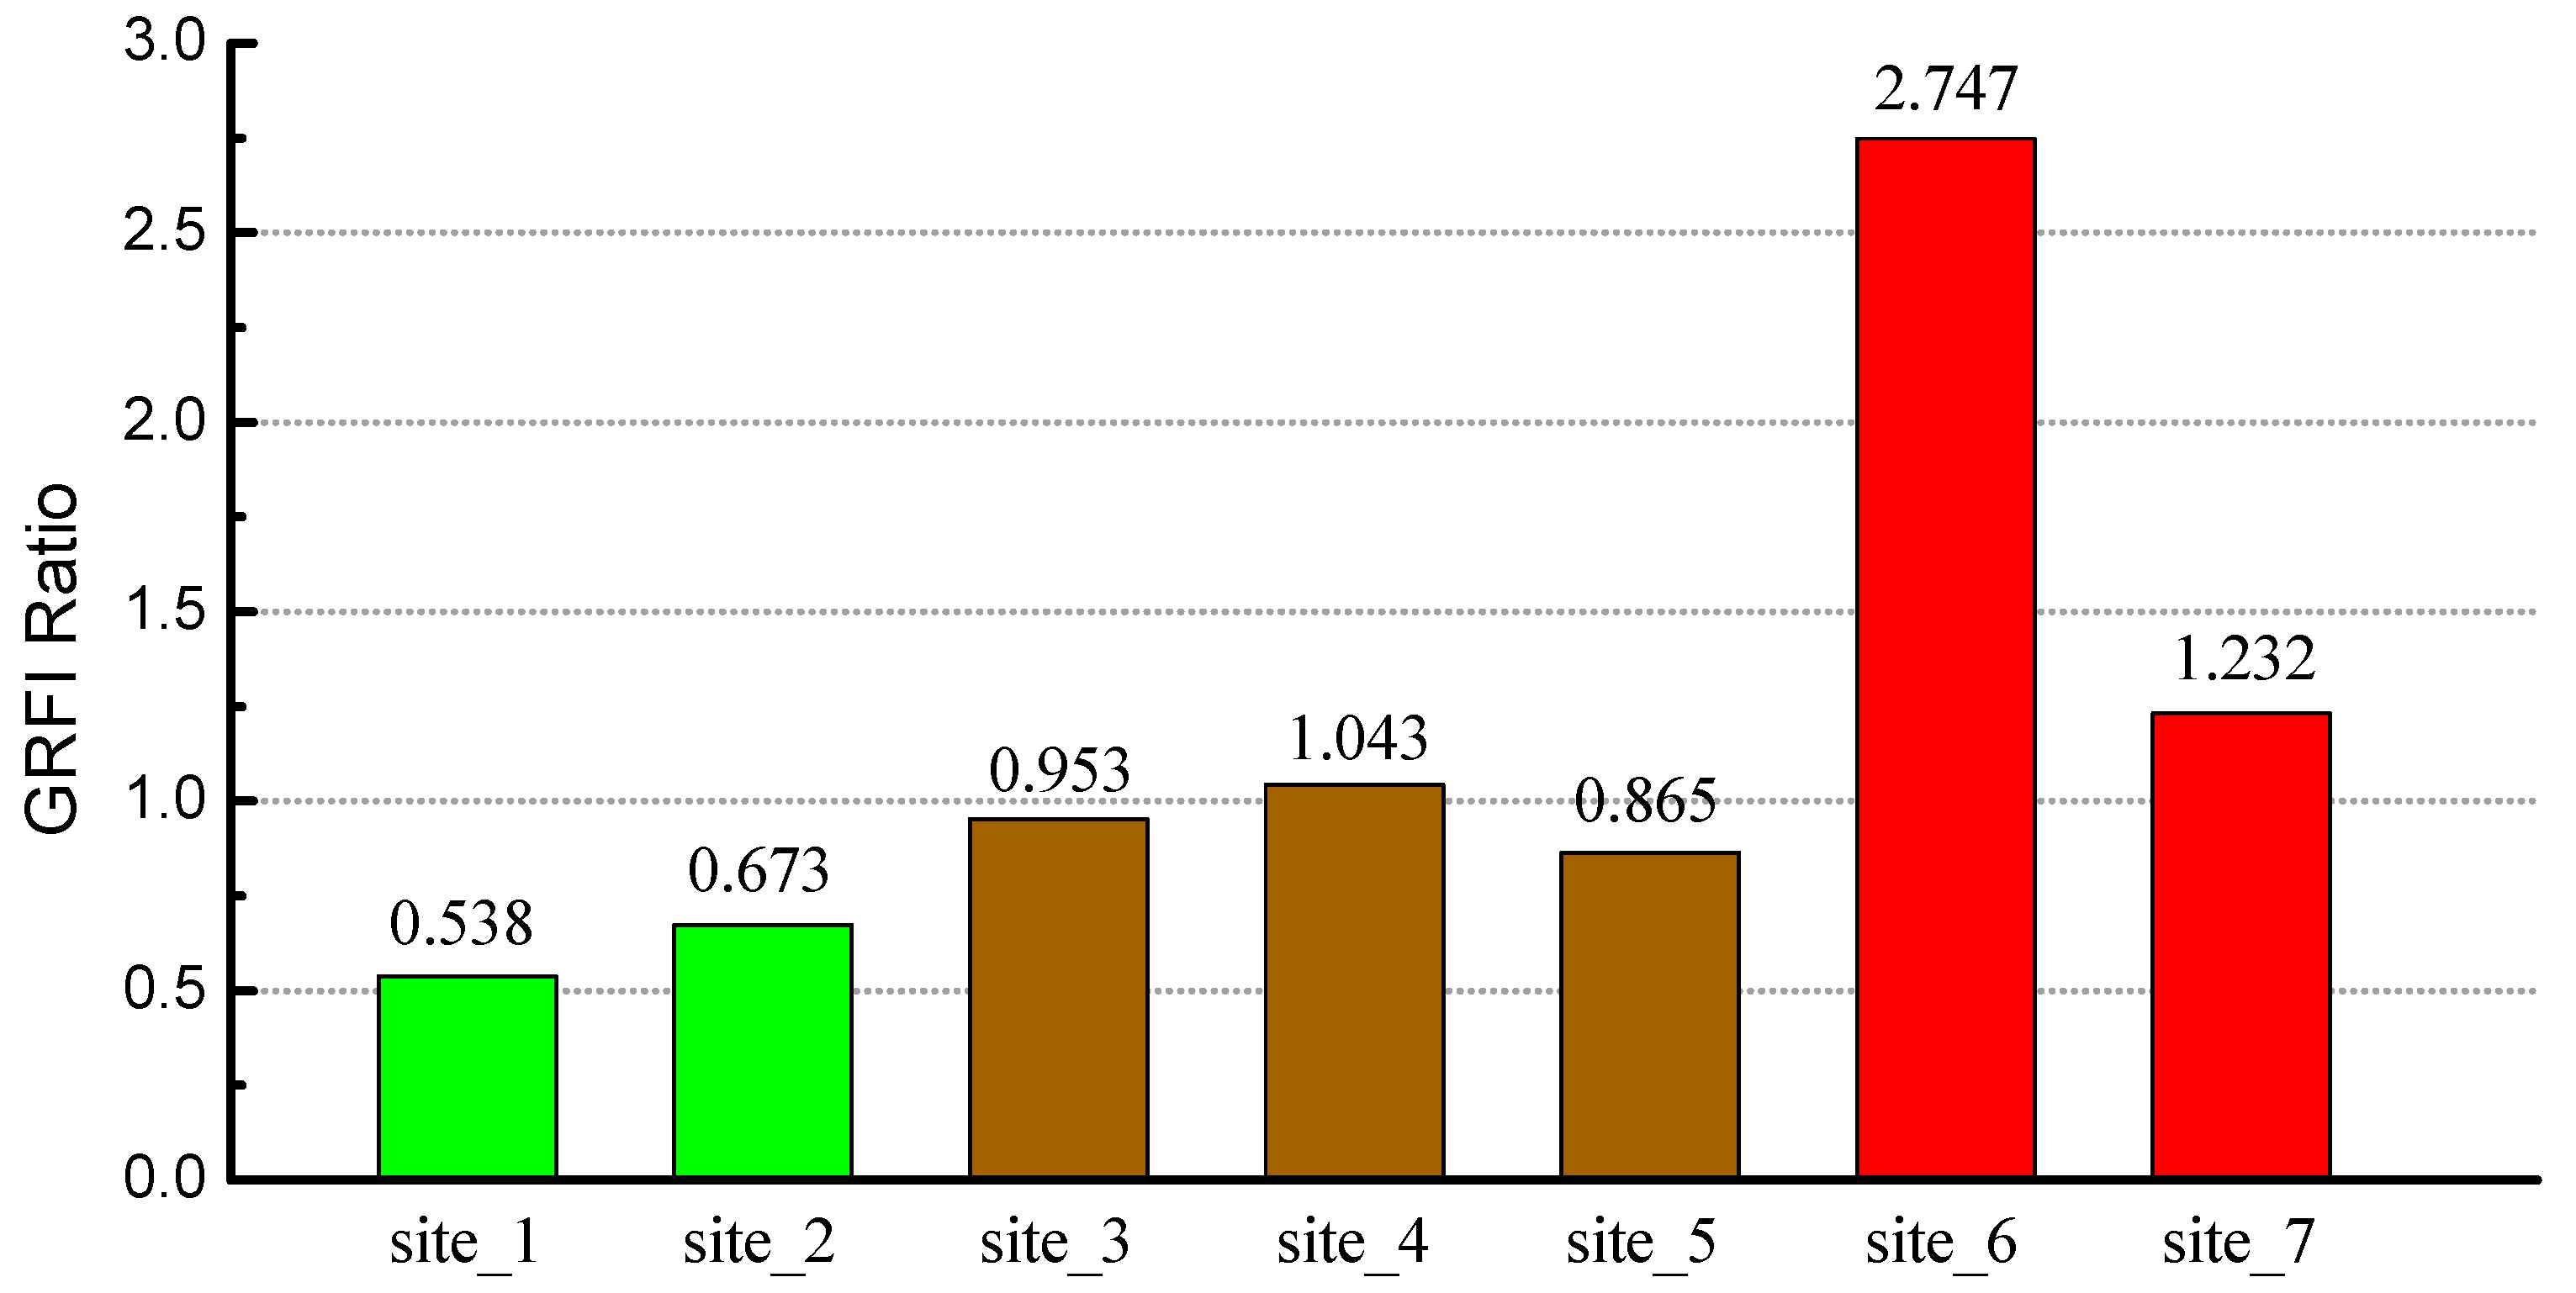
4.3. The Comparison of GRFI Ratio under Different Heavy Metal Stress
5. Discussion
6. Conclusions
- (1)
- The framework of rice heavy metal stress remote sensing monitoring consisting of the generation of synthetic Landsat time-series data and the construction of phenological phase space is feasible.
- (2)
- The phenological phase space and the rice growth profiles can well depict the growth process of rice, and also reflect the effects of different heavy metal stress levels for rice growth.
- (3)
- The GRFI Ratio was the stable and sensitive indicator, which we constructed from phenological phase space for discriminating heavy metal stress for rice. Comparing with other common phenological parameters in the phase space, the GRFI Ratio performed better.
Author Contributions
Funding
Acknowledgments
Conflicts of Interest
References
- Wei, B.; Yang, L. A review of heavy metal contaminations in urban soils, urban road dusts and agricultural soils from China. Microchem. J. 2010, 94, 99–107. [Google Scholar] [CrossRef]
- Shi, T.; Liu, H.; Chen, Y.; Wang, J.; Wu, G. Estimation of arsenic in agricultural soils using hyperspectral vegetation indices of rice. J. Hazard. Mater. 2016, 308, 243. [Google Scholar] [CrossRef] [PubMed]
- Deng-Wei, W.U.; Yun-Zhao, W.U.; Hong-Rui, M.A. Review on Remote Sensing Monitoring on Contaminated Plant. Remote Sens. Technol. Appl. 2009, 24, 238–245. [Google Scholar]
- Ren, H.Y.; Zhuang, D.F.; Pan, J.J.; Shi, X.Z.; Wang, H.J. Hyper-spectral remote sensing to monitor vegetation stress. J. Soils Sediments 2008, 8, 323–326. [Google Scholar] [CrossRef]
- Sridhar, B.B.M.; Han, F.X.; Diehl, S.V.; Monts, D.L.; Su, Y. Spectral reflectance and leaf internal structure changes of barley plants due to phytoextraction of zinc and cadmium. Int. J. Remote Sens. 2007, 28, 1041–1054. [Google Scholar] [CrossRef]
- Nagajyoti, P.C.; Lee, K.D.; Sreekanth, T.V.M. Heavy metals, occurrence and toxicity for plants: A review. Environ. Chem. Lett. 2010, 8, 199–216. [Google Scholar] [CrossRef]
- Wang, Q.E.; Zeng, Y.; Li-Mei, L.I. Advances on the Effect of Cadmium Damage on Physiology and Ecology of Rice. North Rice 2007, 4, 12–16. [Google Scholar]
- Milton, N.M.; Ager, C.M.; Eiswerth, B.A.; Power, M.S. Arsenic- and selenium-induced changes in spectral reflectance and morphology of soybean plants. Remote Sens. Environ. 1990, 30, 263–269. [Google Scholar] [CrossRef]
- Chi, G.Y.; Liu, X.H.; Liu, S.H.; Yang, Z.F. Studies of relationships between Cu pollution and spectral characteristics of TritiZnm aestivum L. Spectrosc. Spectr. Anal. 2006, 26, 1272–1276. [Google Scholar]
- Horler, D.N.H.; Barber, J.; Barringer, A.R. Effects of heavy metals on the absorbance and reflectance spectra of plants. Int. J. Remote Sens. 1980, 1, 121–136. [Google Scholar] [CrossRef]
- Liu, M.; Liu, X.; Ding, W.; Wu, L. Monitoring stress levels on rice with heavy metal pollution from hyperspectral reflectance data using wavelet-fractal analysis. Int. J. Appl. Earth Observ. Geoinf. 2011, 13, 246–255. [Google Scholar] [CrossRef]
- Kooistra, L. Study of heavy metal contamination in river floodplains using the red-edge position in spectroscopic data. Int. J. Remote Sens. 2004, 25, 3883–3895. [Google Scholar]
- Rosso, P.H.; Pushnik, J.C.; Lay, M.; Ustin, S.L. Reflectance properties and physiological responses of Salicornia virginica to heavy metal and petroleum contamination. Environ. Pollut. 2005, 137, 241. [Google Scholar] [CrossRef] [PubMed]
- Liu, M.; Liu, X.; Zhang, B.; Ding, C. Regional heavy metal pollution in crops by integrating physiological function variability with spatio-temporal stability using multi-temporal thermal remote sensing. Int. J. Appl. Earth Observ. Geoinf. 2016, 51, 91–102. [Google Scholar] [CrossRef]
- Beck, P.S.A.; Atzberger, C.; Høgda, K.A.; Johansen, B.; Skidmore, A.K. Improved monitoring of vegetation dynamics at very high latitudes: A new method using MODIS NDVI. Remote Sens. Environ. 2006, 100, 321–334. [Google Scholar] [CrossRef]
- Zhang, B.; Liu, X.; Liu, M.; Wang, D. Thermal infrared imaging of the variability of canopy-air temperature difference distribution for heavy metal stress levels discrimination in rice. J. Appl. Remote Sens. 2017, 11, 026036. [Google Scholar] [CrossRef]
- Jin, M.; Liu, X.; Wu, L.; Liu, M. Distinguishing Heavy-Metal Stress Levels in Rice Using Synthetic Spectral Index Responses to Physiological Function Variations. IEEE J. Sel. Top. Appl. Earth Observ. Remote Sens. 2017, 10, 75–86. [Google Scholar] [CrossRef]
- Wu, L.; Liu, X.; Wang, P.; Zhou, B.; Liu, M.; Li, X. The assimilation of spectral sensing and the WOFOST model for the dynamic simulation of cadmium accumulation in rice tissues. Int. J. Appl. Earth Observ. Geoinf. 2013, 25, 66–75. [Google Scholar] [CrossRef]
- Liu, F.; Liu, X.; Zhao, L.; Ding, C.; Jiang, J.; Wu, L. The Dynamic Assessment Model for Monitoring Cadmium Stress Levels in Rice Based on the Assimilation of Remote Sensing and the WOFOST Model. IEEE J. Sel. Top. Appl. Earth Observ. Remote Sens. 2017, 8, 1330–1338. [Google Scholar] [CrossRef]
- Sakamoto, T.; Yokozawa, M.; Toritani, H.; Shibayama, M.; Ishitsuka, N.; Ohno, H. A crop phenology detection method using time-series MODIS data. Remote Sens. Environ. 2005, 96, 366–374. [Google Scholar] [CrossRef]
- Reed, B.C.; Brown, J.F.; Vanderzee, D.; Loveland, T.R.; Merchant, J.W.; Ohlen, D.O. Measuring phenological variability from satellite imagery. J. Veg. Sci. 1994, 5, 703–714. [Google Scholar] [CrossRef]
- Penuelas, J.; Rutishauser, T.; Fiella, I. Phenology feedbacks on climate change. Science 2009, 324, 887. [Google Scholar] [CrossRef] [PubMed]
- Richardson, A.D.; Keenan, T.F.; Migliavacca, M.; Ryu, Y.; Sonnentag, O.; Toomey, M. Climate change, phenology, and phenological control of vegetation feedbacks to the climate system. Agric. For. Meteorol. 2013, 169, 156–173. [Google Scholar] [CrossRef]
- Tian, L.; Liu, X.; Zhang, B.; Liu, M.; Wu, L. Extraction of Rice Heavy Metal Stress Signal Features Based on Long Time Series Leaf Area Index Data Using Ensemble Empirical Mode Decomposition. Int. J. Environ. Res. Public Health 2017, 14, 1018. [Google Scholar] [CrossRef] [PubMed]
- Liu, S.; Liu, X.; Liu, M.; Wu, L.; Ding, C.; Huang, Z. Extraction of Rice Phenological Differences under Heavy Metal Stress Using EVI Time-Series from HJ-1A/B Data. Sensors 2017, 17, 1243. [Google Scholar] [CrossRef]
- Wu, M. Use of MODIS and Landsat time series data to generate high-resolution temporal synthetic Landsat data using a spatial and temporal reflectance fusion model. J. Appl. Remote Sens. 2012, 6, 063507. [Google Scholar]
- Thompson, J.A.; Paull, D.J.; Lees, B.G. Using phase-spaces to characterize land surface phenology in a seasonally snow-covered landscape. Remote Sens. Environ. 2015, 166, 178–190. [Google Scholar] [CrossRef]
- Hui, L.; Zhang, K.; Chai, L.; Yang, Z.; Yang, W.; Qi, L.; Li, H.; Yi, L. A Comparative Evaluation of Different Sediment Quality Guidelines for Metal and Metalloid Pollution in the Xiangjiang River, Hunan, China. Arch. Environ. Contam. Toxicol. 2017, 73, 593–606. [Google Scholar]
- Zhu, X.; Chen, J.; Gao, F.; Chen, X.; Masek, J.G. An enhanced spatial and temporal adaptive reflectance fusion model for complex heterogeneous regions. Remote Sens. Environ. 2010, 114, 2610–2623. [Google Scholar] [CrossRef]
- Zhu, X.; Helmer, E.H.; Gao, F.; Liu, D.; Chen, J.; Lefsky, M.A. A flexible spatiotemporal method for fusing satellite images with different resolutions. Remote Sens. Environ. 2016, 172, 165–177. [Google Scholar] [CrossRef]
- Melaas, E.K.; Friedl, M.A.; Zhu, Z. Detecting interannual variation in deciduous broadleaf forest phenology using Landsat TM/ETM + data. Remote Sens. Environ. 2013, 132, 176–185. [Google Scholar] [CrossRef]
- Zhang, X.; Friedl, M.A.; Schaaf, C.B.; Strahler, A.H.; Hodges, J.C.F.; Gao, F.; Reed, B.C.; Huete, A. Monitoring vegetation phenology using MODIS. Remote Sens. Environ. 2003, 84, 471–475. [Google Scholar] [CrossRef]
- Gao, B.C. NDWI—A normalized difference water index for remote sensing of vegetation liquid water from space. Remote Sens. Environ. 1996, 58, 257–266. [Google Scholar] [CrossRef]
- Xiao, X.; Boles, S.; Frolking, S.; Li, C.; Babu, J.Y.; Salas, W.; Iii, B.M. Mapping paddy rice agriculture in South and Southeast Asia using multi-temporal MODIS images. Remote Sens. Environ. 2006, 100, 95–113. [Google Scholar] [CrossRef]
- Huete, A.; Didan, K.; Miura, T.; Rodriguez, E.P.; Gao, X.; Ferreira, L.G. Overview of the radiometric and biophysical performance of the MODIS vegetation indices. Remote Sens. Environ. 2002, 83, 195–213. [Google Scholar] [CrossRef]
- Huete, A.R.; Liu, H.Q.; Batchily, K.; Leeuwen, W.V. A comparison of vegetation indices over a global set of TM images for EOS-MODIS. Remote Sens. Environ. 1997, 59, 440–451. [Google Scholar] [CrossRef]
- Chen, J.; Jönsson, P.; Tamura, M.; Gu, Z.; Matsushita, B.; Eklundh, L. A simple method for reconstructing a high-quality NDVI time-series data set based on the Savitzky–Golay filter. Remote Sens. Environ. 2004, 91, 332–344. [Google Scholar] [CrossRef]
- Jönsson, P.; Eklundh, L. TIMESAT—A program for analyzing time-series of satellite sensor data. Comput. Geosci. 2004, 30, 833–845. [Google Scholar] [CrossRef]
- Zhang, Z.J.; Liu, M.L.; Liu, X.N.; Zhou, G.X. A New Vegetation Index Based on Multitemporal Sentinel-2 Images for Discriminating Heavy Metal Stress Levels in Rice. Sensors 2018, 18, 2172. [Google Scholar] [CrossRef]
- Jin, M.; Liu, X.N.; Zhang, B.Y. Evaluating Heavy-Metal Stress Levels in Rice Using a Theoretical Model of Canopy-Air Temperature and Leaf Area Index Based on Remote Sensing. IEEE J. Sel. Top. Appl. Earth Observ. Remote Sens. 2017, 10, 3232–3242. [Google Scholar] [CrossRef]
- Liu, M.; Wang, T.; Skidmore, A.K.; Liu, X. Heavy metal-induced stress in rice crops detected using multi-temporal Sentinel-2 satellite images. Sci. Total Environ. 2018, 637, 18–29. [Google Scholar] [CrossRef] [PubMed]
- Zhang, B.; Liu, X.; Liu, M.; Meng, Y. Detection of Rice Phenological Variations under Heavy Metal Stress by Means of Blended Landsat and MODIS Image Time Series. Remote Sens. 2018, 11, 13. [Google Scholar] [CrossRef]
- Foody, G.M.; Mathur, A. The use of small training sets containing mixed pixels for accurate hard image classification: Training on mixed spectral responses for classification by a SVM. Remote Sens. Environ. 2006, 103, 179–189. [Google Scholar] [CrossRef]
- Ghassemian, H. A review of remote sensing image fusion methods. Inf. Fusion 2016, 32, 75–89. [Google Scholar] [CrossRef]
- Walker, J.J.; de Beurs, K.M.; Wynne, R.H.; Gao, F. Evaluation of Landsat and MODIS data fusion products for analysis of dryland forest phenology. Remote Sens. Environ. 2012, 117, 381–393. [Google Scholar] [CrossRef]
- Zhu, X.; Cai, F.; Tian, J.; Williams, T.K.-A. Spatiotemporal Fusion of Multisource Remote Sensing Data: Literature Survey, Taxonomy, Principles, Applications, and Future Directions. Remote Sens. 2018, 10, 527. [Google Scholar] [CrossRef]
- Liu, M.; Liu, X.; Wu, L.; Zou, X.; Jiang, T.; Zhao, B. A Modified Spatiotemporal Fusion Algorithm Using Phenological Information for Predicting Reflectance of Paddy Rice in Southern China. Remote Sens. 2018, 10, 772. [Google Scholar] [CrossRef]


| Study site | Longitude | Latitude | Cd | Pb | Hg | Pollution Level |
|---|---|---|---|---|---|---|
| Site_1 | 27°47′ N | 113°10′ E | 0.84 | 78.33 | 0.35 | Light stress |
| Site_2 | 27°59′ N | 113°06′ E | 1.38 | 59.45 | 0.35 | Light stress |
| Site_3 | 27°37′ N | 113°14′ E | 2.25 | 89.67 | 0.29 | Moderate stress |
| Site_4 | 27°40′ N | 113°10′ E | 2.31 | 91.05 | 0.24 | Moderate stress |
| Site_5 | 27°41′ N | 113°08′ E | 2.71 | 87.2 | 0.29 | Moderate stress |
| Site_6 | 27°50′ N | 113°02′ E | 3.28 | 120.75 | 0.51 | Severe stress |
| Site_7 | 27°58′ N | 113°02′ E | 3.57 | 130 | 0.503 | Severe stress |
| Background value | 1.43 | 82.78 | 0.2 | |||
| National secondary standard | 0.3–1.0 | 250–350 | 0.3–1.0 |
| Band | MODIS (MOD09A1) | Landsat-8 OLI | Landsat-7 ETM+ | |||
|---|---|---|---|---|---|---|
| Band Number | Wavelength Coverage (μm) | Band Number | Wavelength Coverage (μm) | Band Number | Wavelength Coverage (μm) | |
| Blue | Band 3 | 0.459–0.479 | Band 2 | 0.452–0.512 | Band 1 | 0.450–0.515 |
| Green | Band 4 | 0.545–0.565 | Band 3 | 0.530–0.590 | Band 2 | 0.525–0.605 |
| Red | Band 1 | 0.620–0.670 | Band 4 | 0.636–0.673 | Band 3 | 0.630–0.690 |
| NIR | Band 2 | 0.841–0.876 | Band 5 | 0.851–0.879 | Band 4 | 0.775–0.900 |
| SWIR | Band 6 | 1.628–1.652 | Band 6 | 1.566–1.651 | Band 5 | 1.550–1.750 |
| Site_1 | Site_2 | Site_3 | Site_4 | Site_5 | Site_6 | Site_7 | |
|---|---|---|---|---|---|---|---|
| Cadmium content in soil (mg/kg) | 0.84 | 1.38 | 2.25 | 2.31 | 2.71 | 3.28 | 3.57 |
| Length of growth period | 142 | 127 | 151 | 148 | 146 | 90 | 97 |
| Maximum value of R | 0.621 | 0.691 | 0.741 | 0.675 | 0.605 | 0.635 | 0.518 |
| Amplitude of R | 0.275 | 0.296 | 0.352 | 0.301 | 0.256 | 0.158 | 0.116 |
| Length of rice growth trajectory | 0.552 | 0.762 | 0.815 | 0.673 | 0.605 | 0.380 | 0.279 |
© 2019 by the authors. Licensee MDPI, Basel, Switzerland. This article is an open access article distributed under the terms and conditions of the Creative Commons Attribution (CC BY) license (http://creativecommons.org/licenses/by/4.0/).
Share and Cite
Zou, X.; Liu, X.; Liu, M.; Liu, M.; Zhang, B. A Framework for Rice Heavy Metal Stress Monitoring Based on Phenological Phase Space and Temporal Profile Analysis. Int. J. Environ. Res. Public Health 2019, 16, 350. https://doi.org/10.3390/ijerph16030350
Zou X, Liu X, Liu M, Liu M, Zhang B. A Framework for Rice Heavy Metal Stress Monitoring Based on Phenological Phase Space and Temporal Profile Analysis. International Journal of Environmental Research and Public Health. 2019; 16(3):350. https://doi.org/10.3390/ijerph16030350
Chicago/Turabian StyleZou, Xinyu, Xiangnan Liu, Mengxue Liu, Meiling Liu, and Biyao Zhang. 2019. "A Framework for Rice Heavy Metal Stress Monitoring Based on Phenological Phase Space and Temporal Profile Analysis" International Journal of Environmental Research and Public Health 16, no. 3: 350. https://doi.org/10.3390/ijerph16030350
APA StyleZou, X., Liu, X., Liu, M., Liu, M., & Zhang, B. (2019). A Framework for Rice Heavy Metal Stress Monitoring Based on Phenological Phase Space and Temporal Profile Analysis. International Journal of Environmental Research and Public Health, 16(3), 350. https://doi.org/10.3390/ijerph16030350