


Cerebroplacental versus Umbilicocerebral Ratio—Analyzing the Predictive Value Regarding Adverse Perinatal Outcomes in Low- and High-Risk Fetuses at Term

 , , , ,
Abstract
1. Introduction
2. Materials and Methods
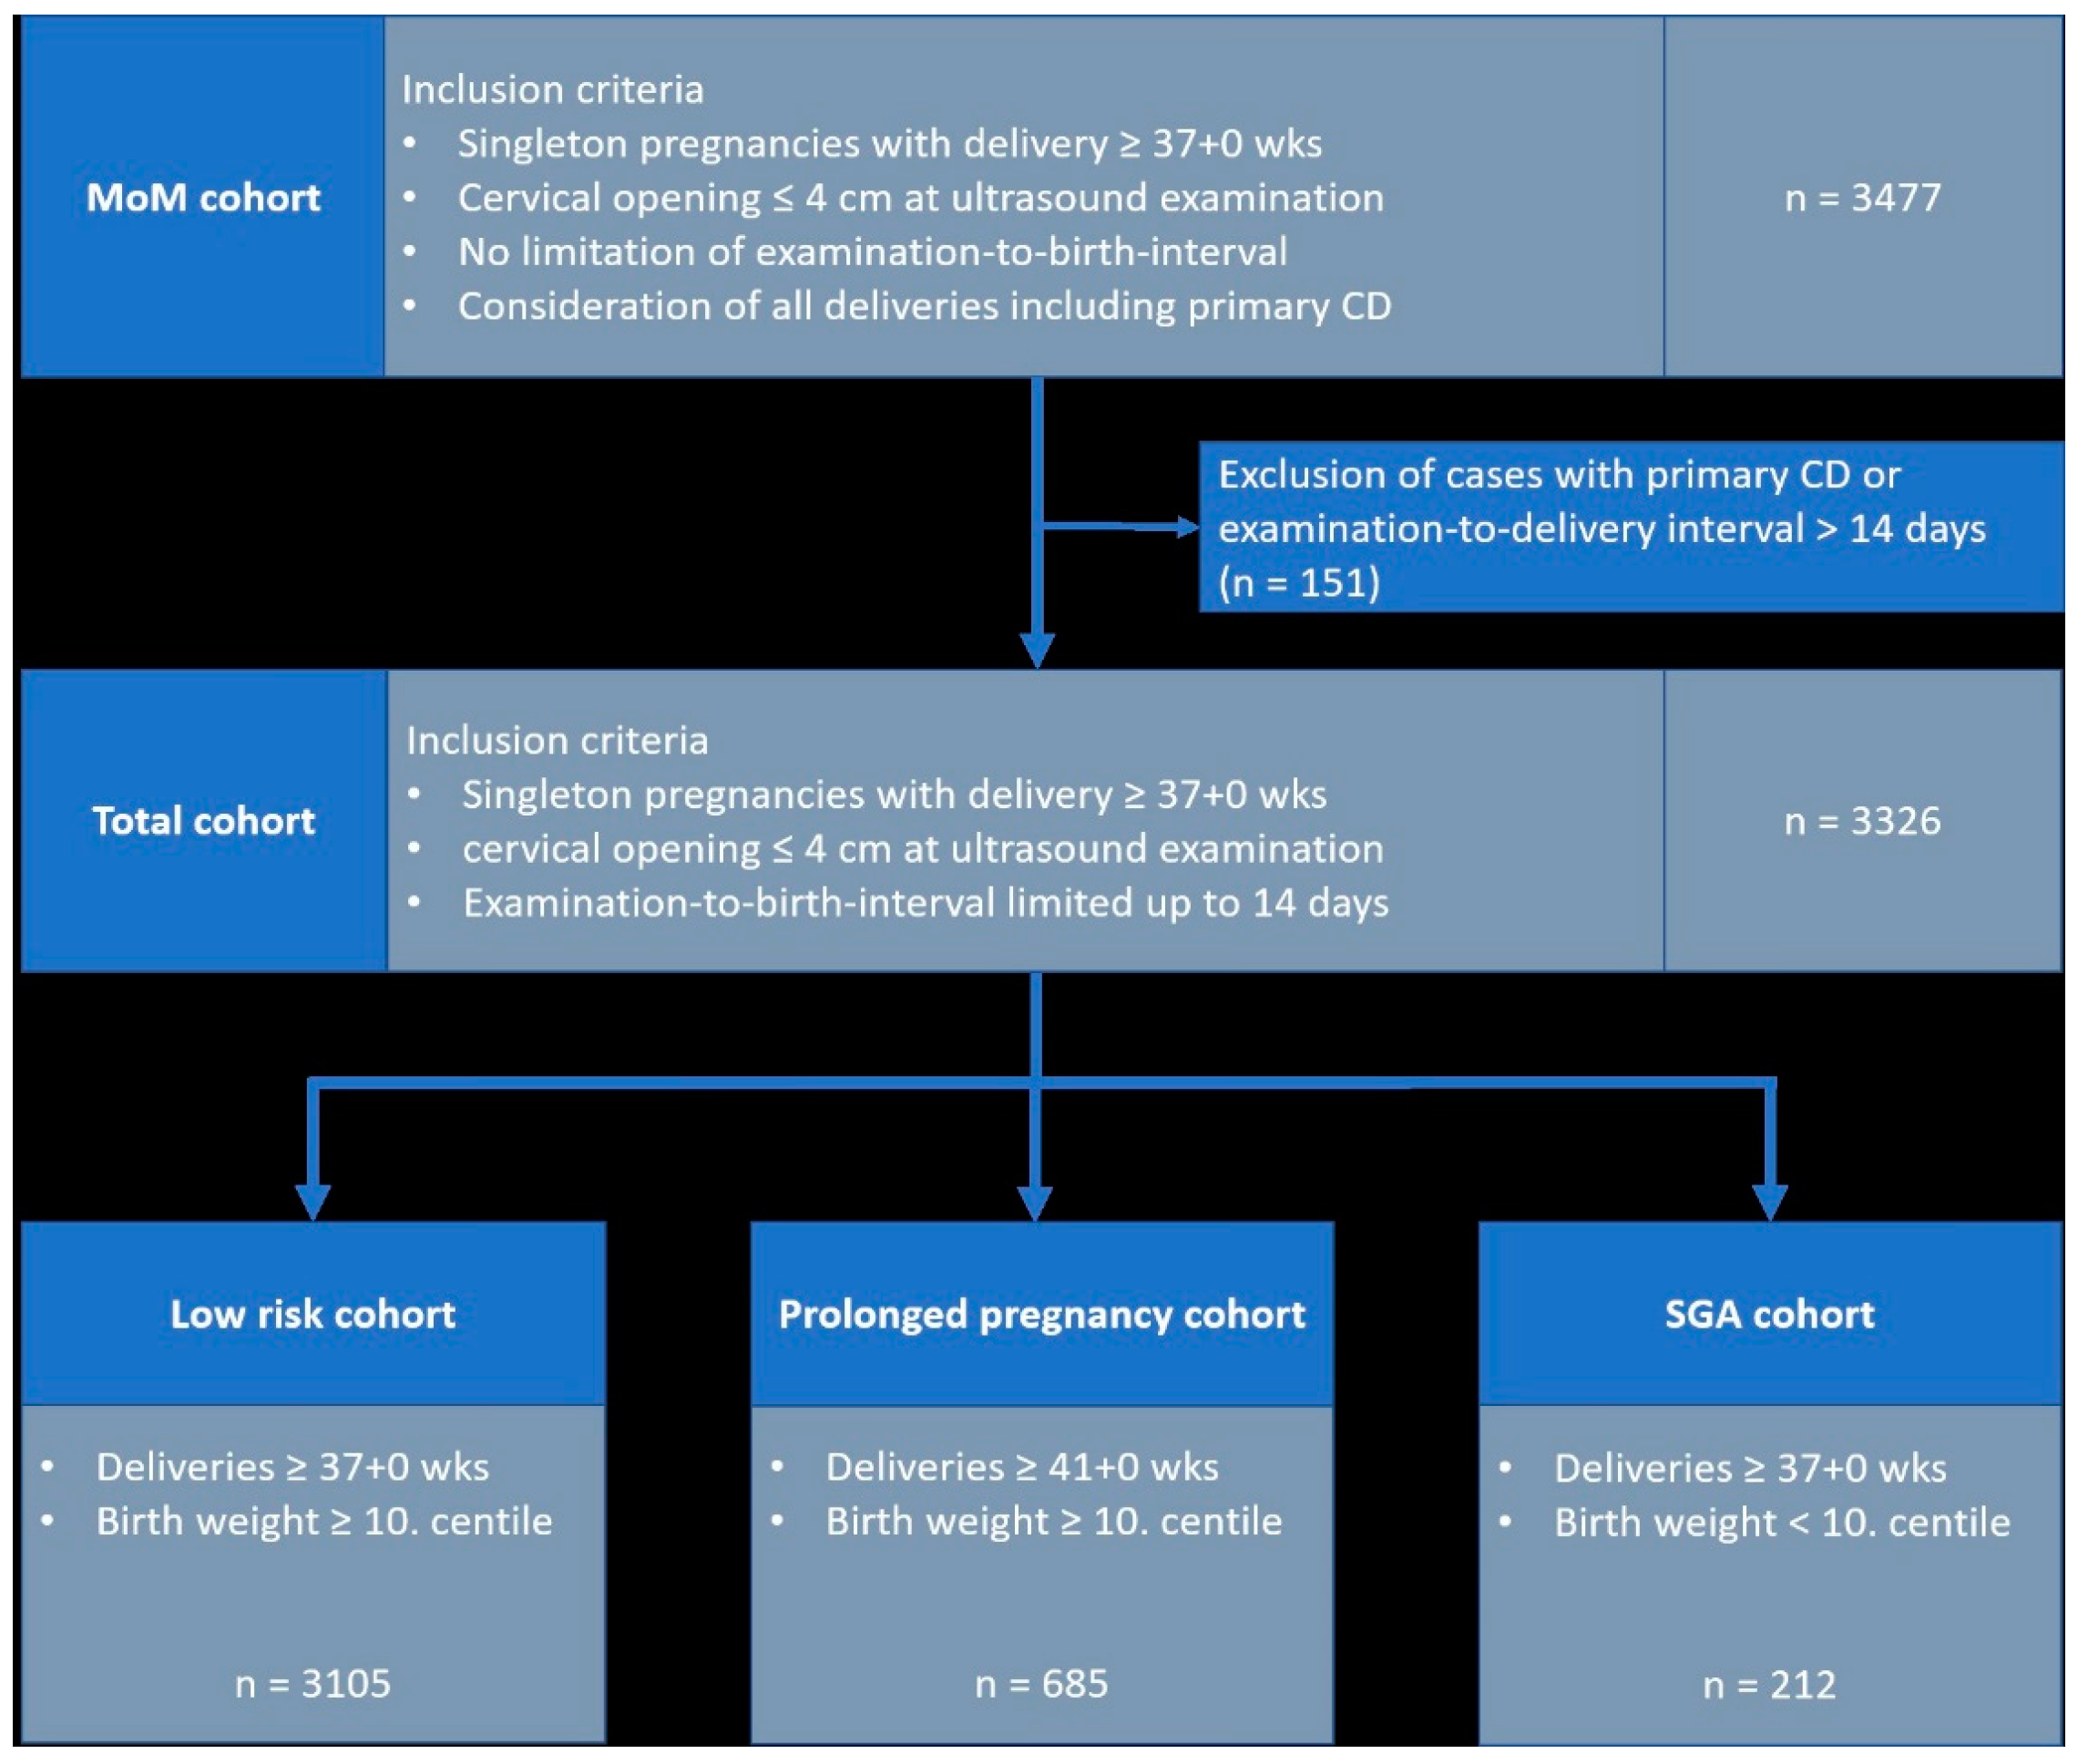
2.1. Study Population
2.2. Doppler Parameters and Ratios
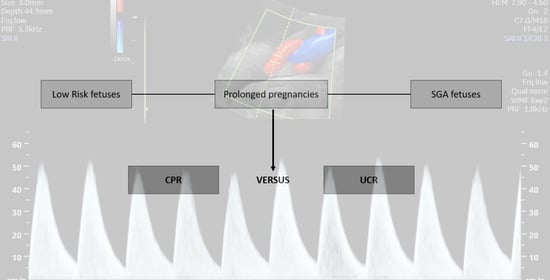
2.3. Study Cohorts
- Low-risk cohort”: all cases with delivery ≥ 37 + 0 weeks gestation, birth weight ≥ 10. centile; n = 3105
- Prolonged pregnancy cohort”: all cases with delivery ≥ 41 + 0 weeks gestation and birth weight ≥ 10. centile; n = 685
- SGA cohort”: all cases with delivery ≥ 37 + 0 SSW and birth weight < 10. centile; n = 212.
2.4. Outcome Definitions
2.5. Statistical Analysis
2.6. Ethical Approval
3. Results
3.1. Emergency Cesarean Delivery
3.2. Operative Intervention
3.3. Operative Intervention Due to Fetal Distress
3.4. Five-Minute Apgar < 7
3.5. NICU Admission
3.6. Combined Adverse Perinatal Outcome
4. Discussion
4.1. Strengths of This Study
4.2. Limitations
5. Conclusions
Author Contributions
Funding
Institutional Review Board Statement
Informed Consent Statement
Data Availability Statement
Conflicts of Interest
Appendix A

| UA | MCA | |||
|---|---|---|---|---|
| AUC | Brier Score | AUC | Brier Score | |
| Emergency cesarean delivery | ||||
| Total cohort | 0.606 | 0.01099 | 0.610 | 0.01097 |
| Low-risk cohort | 0.616 | 0.00956 | 0.599 | 0.00955 |
| Prolonged pregnancy cohort | 0.660 | 0.01150 | 0.662 | 0.01145 |
| SGA cohort | 0.544 | 0.03187 | 0.594 | 0.03179 |
| Operative intervention | ||||
| Total cohort | 0.515 | 0.19021 | 0.500 | 0.19039 |
| Low-risk cohort | 0.513 | 0.18851 | 0.507 | 0.18853 |
| Prolonged pregnancy cohort | 0.511 | 0.20592 | 0.512 | 0.20609 |
| SGA cohort | 0.511 | 0.21155 | 0.580 | 0.20825 |
| Operative intervention CTG | ||||
| Total cohort | 0.550 | 0.08647 | 0.529 | 0.08688 |
| Low-risk cohort | 0.546 | 0.08187 | 0.514 | 0.08203 |
| Prolonged pregnancy cohort | 0.532 | 0.10508 | 0.515 | 0.10536 |
| SGA cohort | 0.514 | 0.14601 | 0.610 | 0.14308 |
| 5-min Apgar < 7 | ||||
| Total cohort | 0.524 | 0.01973 | 0.548 | 0.01972 |
| Low-risk cohort | 0.498 | 0.01864 | 0.559 | 0.01862 |
| Prolonged pregnancy cohort | 0.534 | 0.02834 | 0.562 | 0.02829 |
| SGA cohort | 0.627 | 0.02750 | 0.550 | 0.02750 |
| NICU admission | ||||
| Total cohort | 0.512 | 0.11394 | 0.559 | 0.11367 |
| Low-risk cohort | 0.520 | 0.10467 | 0.544 | 0.10454 |
| Prolonged pregnancy cohort | 0.527 | 0.10416 | 0.561 | 0.10394 |
| SGA cohort | 0.623 | 0.19598 | 0.619 | 0.20040 |
| CAPO | ||||
| Total cohort | 0.516 | 0.12834 | 0.552 | 0.12810 |
| Low-risk cohort | 0.511 | 0.11976 | 0.538 | 0.11958 |
| Prolonged pregnancy cohort | 0.502 | 0.12467 | 0.554 | 0.12425 |
| SGA cohort | 0.612 | 0.20479 | 0.613 | 0.20781 |
| UA PI MoM | MCA PI MoM | |||||||
|---|---|---|---|---|---|---|---|---|
| Outcome | No Outcome | Univariate Analysis: OR (CI) | p-Value | Outcome | No Outcome | Univariate Analysis: OR (CI) | p-Value | |
| Emergency cesarean delivery | ||||||||
| Total cohort | 1.08 | 1.02 | 3.87 (0.88–14.37) | 0.07 | 0.94 | 1.04 | 0.13 (0.02–0.61) | 0.008 |
| Low-risk cohort | 1.09 | 1.01 | 6.00 (1.07–28.35) | 0.04 | 0.95 | 1.04 | 0.16 (0.03–0.87) | 0.03 |
| Prolonged pregancy cohort | 1.12 | 1.01 | 15.91 (0.44–536.27) | 0.13 | 0.88 | 1.03 | 0.03 (0.00–1.01) | 0.05 |
| SGA cohort | 1.07 | 1.14 | 0.30 (0.01–5.88) | 0.47 | 0.88 | 0.96 | 0.11 (0.00–4.94) | 0.28 |
| Operative intervention | ||||||||
| Total cohort | 1.03 | 1.02 | 1.42 (0.96–2.07) | 0.08 | 1.04 | 1.03 | 1.05 (0.75–1.45) | 0.78 |
| Low-risk cohort | 1.02 | 1.01 | 1.27 (0.83–1.93) | 0.27 | 1.05 | 1.04 | 1.17 (0.83–1.63) | 0.37 |
| Prolonged pregancy cohort | 1.02 | 1.01 | 1.44 (0.59–3.48) | 0.42 | 1.02 | 1.03 | 0.90 (0.44–1.81) | 0.76 |
| SGA cohort | 1.16 | 1.12 | 1.72 (0.56–5.32) | 0.34 | 0.91 | 0.98 | 0.21 (0.04–0.91) | 0.04 |
| Operative intervention CTG | ||||||||
| Total cohort | 1.06 | 1.02 | 2.89 (1.68–4.93) | <0.001 | 1.01 | 1.04 | 0.66 (0.40–1.08) | 0.10 |
| Low-risk cohort | 1.04 | 1.01 | 2.30 (1.23–4.24) | 0.009 | 1.03 | 1.04 | 0.83 (0.49–1.39) | 0.49 |
| Prolonged pregancy cohort | 1.04 | 1.01 | 2.23 (0.65–7.51) | 0.20 | 1.02 | 1.03 | 0.84 (0.3–2.23) | 0.72 |
| SGA cohort | 1.17 | 1.13 | 1.94 (0.50–7.01) | 0.33 | 0.89 | 0.97 | 0.12 (0.02–0.78) | 0.03 |
| 5-min Apgar < 7 | ||||||||
| Total cohort | 1.04 | 1.02 | 1.68 (0.51–5.09) | 0.39 | 0.98 | 1.04 | 0.36 (0.11–1.05) | 0.06 |
| Low-risk cohort | 1.01 | 1.01 | 1.02 (0.26–3.77) | 0.98 | 0.98 | 1.04 | 0.33 (0.10–1.02) | 0.06 |
| Prolonged pregancy cohort | 0.99 | 1.01 | 0.57 (0.05–6.14) | 0.65 | 0.97 | 1.03 | 0.31 (0.03–2.25) | 0.26 |
| SGA cohort | 1.18 | 1.13 | 1.97 (0.07–23.53) | 0.65 | 0.95 | 0.96 | 0.87 (0.01–27.19) | 0.95 |
| NICU admission | ||||||||
| Total cohort | 1.04 | 1.02 | 1.67 (1.02–2.70) | 0.04 | 1.00 | 1.04 | 0.47 (0.30–0.73) | 0.001 |
| Low-risk cohort | 1.00 | 1.01 | 0.71 (0.50–1.26) | 0.25 | 1.01 | 1.04 | 0.60 (0.37–0.96) | 0.03 |
| Prolonged pregancy cohort | 1.00 | 1.02 | 0.57 (0.16–1.99) | 0.38 | 0.99 | 1.03 | 0.49 (0.17–1.36) | 0.18 |
| SGA cohort | 1.22 | 1.10 | 6.91 (2.13–24.47) | 0.001 | 0.91 | 0.98 | 0.17 (0.03–0.77) | 0.02 |
| CAPO | ||||||||
| Total cohort | 1.04 | 1.02 | 1.68 (1.06–2.65) | 0.03 | 1.00 | 1.04 | 0.50 (0.33–0.76) | 0.001 |
| Low-risk cohort | 1.01 | 1.01 | 0.84 (0.49–1.42) | 0.51 | 1.02 | 1.04 | 0.62 (0.40–0.96) | 0.03 |
| Prolonged pregancy cohort | 1.01 | 1.01 | 0.98 (0.31–3.05) | 0.98 | 1.00 | 1.03 | 0.50 (0.19–1.26) | 0.14 |
| SGA cohort | 1.21 | 1.10 | 5.85 (1.85–20.08) | 0.002 | 0.91 | 0.98 | 0.18 (0.04–0.76) | 0.02 |
References
- Schlembach, D. Fetal Growth Restriction—Diagnostic Work-up, Management and Delivery. Geburtshilfe Frauenheilkd. 2020, 80, 1016–1025. [Google Scholar] [CrossRef]
- Khalil, A.A.; Morales-Rosello, J.; Elsaddig, M.; Khan, N.; Papageorghiou, A.; Bhide, A.; Thilaganathan, B. The association between fetal Doppler and admission to neonatal unit at term. Am. J. Obstet. Gynecol. 2015, 213, 57.e1–57.e7. [Google Scholar] [CrossRef]
- Khalil, A.A.; Morales-Rosello, J.; Morlando, M.; Hannan, H.; Bhide, A.; Papageorghiou, A.; Thilaganathan, B. Is fetal cerebroplacental ratio an independent predictor of intrapartum fetal compromise and neonatal unit admission? Am. J. Obstet. Gynecol. 2015, 213, 54.e1–54.e10. [Google Scholar] [CrossRef]
- Morales-Roselló, J.; Khalil, A. Fetal cerebral redistribution: A marker of compromise regardless of fetal size. Ultrasound Obstet. Gynecol. 2015, 46, 385–388. [Google Scholar] [CrossRef]
- Flood, K.; Unterscheider, J.; Daly, S.; Geary, M.P.; Kennelly, M.M.; McAuliffe, F.M.; O’Donoghue, K.; Hunter, A.; Morrison, J.J.; Burke, G.; et al. The role of brain sparing in the prediction of adverse outcomes in intrauterine growth restriction: Results of the multicenter PORTO Study. Am. J. Obstet. Gynecol. 2014, 211, 288.e1–288.e5. [Google Scholar] [CrossRef]
- Odibo, A.O.; Riddick, C.; Pare, E.; Stamilio, D.M.; Macones, G.A. Cerebroplacental Doppler ratio and adverse perinatal outcomes in intrauterine growth restriction: Evaluating the impact of using gestational age-specific reference values. J. Ultrasound Med. 2005, 24, 1223–1228. [Google Scholar] [CrossRef]
- Kalafat, E.; Morales-Rosello, J.; Thilaganathan, B.; Tahera, F.; Khalil, A. Risk of operative delivery for intrapartum fetal compromise in small-for-gestational-age fetuses at term: An internally validated prediction model. Am. J. Obstet. Gynecol. 2018, 218, 134.e131–134.e138. [Google Scholar] [CrossRef]
- Stumpfe, F.M.; Faschingbauer, F.; Kehl, S.; Pretscher, J.; Stelzl, P.; Mayr, A.; Schild, R.L.; Schmid, M.; Beckmann, M.W.; Schneider, M.O. Correlation of short-term variation and Doppler parameters with adverse perinatal outcome in small-for-gestational age fetuses at term. Arch. Gynecol. Obstet. 2019, 300, 575–581. [Google Scholar] [CrossRef]
- Stumpfe, F.M.; Kehl, S.; Pretscher, J.; Baier, F.; Bayer, C.M.; Schwenke, E.; Schneider, M.O.; Mayr, A.; Schild, R.L.; Schmid, M.; et al. Correlation of short-term variation and Doppler parameters with adverse perinatal outcome in low-risk fetuses at term. Arch. Gynecol. Obstet. 2019, 299, 411–420. [Google Scholar] [CrossRef]
- Prior, T.; Mullins, E.; Bennett, P.; Kumar, S. Prediction of intrapartum fetal compromise using the cerebroumbilical ratio: A prospective observational study. Am. J. Obstet. Gynecol. 2013, 208, 124.e1–124.e6. [Google Scholar] [CrossRef]
- Vollgraff Heidweiller-Schreurs, C.A.; De Boer, M.A.; Heymans, M.W.; Schoonmade, L.J.; Bossuyt, P.M.M.; Mol, B.W.J.; De Groot, C.J.M.; Bax, C.J. Prognostic accuracy of cerebroplacental ratio and middle cerebral artery Doppler for adverse perinatal outcome: Systematic review and meta-analysis. Ultrasound Obstet. Gynecol. 2018, 51, 313–322. [Google Scholar] [CrossRef]
- Stampalija, T.; Thornton, J.; Marlow, N.; Napolitano, R.; Bhide, A.; Pickles, T.; Bilardo, C.M.; Gordijn, S.J.; Gyselaers, W.; Valensise, H.; et al. Fetal cerebral Doppler changes and outcome in late preterm fetal growth restriction: Prospective cohort study. Ultrasound Obstet. Gynecol. 2020, 56, 173–181. [Google Scholar] [CrossRef]
- Graupner, O.; Kuschel, B.; Axt-Fliedner, R.; Enzensberger, C. New Markers for Placental Dysfunction at Term—Potential for More. Geburtshilfe Frauenheilkd. 2022, 82, 719–726. [Google Scholar] [CrossRef]
- Morales-Rosello, J.; Khalil, A.; Morlando, M.; Papageorghiou, A.; Bhide, A.; Thilaganathan, B. Changes in fetal Doppler indices as a marker of failure to reach growth potential at term. Ultrasound Obstet. Gynecol. 2014, 43, 303–310. [Google Scholar] [CrossRef]
- Villar, J.; Cheikh Ismail, L.; Victora, C.G.; Ohuma, E.O.; Bertino, E.; Altman, D.G.; Lambert, A.; Papageorghiou, A.T.; Carvalho, M.; Jaffer, Y.A.; et al. International standards for newborn weight, length, and head circumference by gestational age and sex: The Newborn Cross-Sectional Study of the INTERGROWTH-21st Project. Lancet 2014, 384, 857–868. [Google Scholar] [CrossRef]
- Mlynarczyk, M.; Chauhan, S.P.; Baydoun, H.A.; Wilkes, C.M.; Earhart, K.R.; Zhao, Y.; Goodier, C.; Chang, E.; Lee Plenty, N.M.; Mize, E.K.; et al. The clinical significance of an estimated fetal weight below the 10th percentile: A comparison of outcomes of <5th vs 5th-9th percentile. Am. J. Obstet. Gynecol. 2017, 217, 198.e1–198.e11. [Google Scholar] [CrossRef]
- Louwen, F.; Wagner, U.; Abou-Dakn, M.; Dotsch, J.; Lawrenz, B.; Ehm, D.; Surbek, D.; Essig, A.; Greening, M.; Schafers, R.; et al. Caesarean Section. Guideline of the DGGG, OEGGG and SGGG (S3-Level, AWMF Registry No. 015/084, June 2020). Geburtshilfe Frauenheilkd. 2021, 81, 896–921. [Google Scholar] [CrossRef]
- Ayres-de-Campos, D.; Spong, C.Y.; Chandraharan, E.; Panel, F.I.F.M.E.C. FIGO consensus guidelines on intrapartum fetal monitoring: Cardiotocography. Int. J. Gynaecol. Obstet. 2015, 131, 13–24. [Google Scholar] [CrossRef]
- Bligh, L.N.; Al Solai, A.; Greer, R.M.; Kumar, S. Diagnostic Performance of Cerebroplacental Ratio Thresholds at Term for Prediction of Low Birthweight and Adverse Intrapartum and Neonatal Outcomes in a Term, Low-Risk Population. Fetal Diagn. Ther. 2017, 43, 191–198. [Google Scholar] [CrossRef]
- Koenker, R. Quantile Regression; Cambridge University Press: Cambridge, UK, 2005. [Google Scholar]
- Coenen, H.; Braun, J.; Koster, H.; Mollers, M.; Schmitz, R.; Steinhard, J.; Oelmeier, K. Role of umbilicocerebral and cerebroplacental ratios in prediction of perinatal outcome in FGR pregnancies. Arch. Gynecol. Obstet. 2021, 305, 1383–1392. [Google Scholar] [CrossRef]
- Leavitt, K.; Odibo, L.; Nwosu, O.; Odibo, A.O. Comparing the cerebro-placental to umbilico-cerebral Doppler ratios for the prediction of adverse neonatal outcomes in pregnancies complicated by fetal growth restriction. J. Matern. Fetal Neonatal Med. 2021, 35, 5904–5908. [Google Scholar] [CrossRef]
- Prior, T.; Paramasivam, G.; Bennett, P.; Kumar, S. Are fetuses that fail to achieve their growth potential at increased risk of intrapartum compromise? Ultrasound Obstet. Gynecol. 2015, 46, 460–464. [Google Scholar] [CrossRef]
- Di Mascio, D.; Rizzo, G.; Buca, D.; D’Amico, A.; Leombroni, M.; Tinari, S.; Giancotti, A.; Muzii, L.; Nappi, L.; Liberati, M.; et al. Comparison between cerebroplacental ratio and umbilicocerebral ratio in predicting adverse perinatal outcome at term. Eur. J. Obstet. Gynecol. Reprod. Biol. 2020, 252, 439–443. [Google Scholar] [CrossRef]
- Ortiz, J.U.; Graupner, O.; Flechsenhar, S.; Karge, A.; Ostermayer, E.; Abel, K.; Kuschel, B.; Lobmaier, S.M. Prognostic Value of Cerebroplacental Ratio in Appropriate-for-Gestational-Age Fetuses Before Induction of Labor in Late-Term Pregnancies. Ultraschall Med. 2021, 44, 50–55. [Google Scholar] [CrossRef]
- Sirico, A.; Diemert, A.; Glosemeyer, P.; Hecher, K. Prediction of adverse perinatal outcome by cerebroplacental ratio adjusted for estimated fetal weight. Ultrasound Obstet. Gynecol. 2018, 51, 381–386. [Google Scholar] [CrossRef]


| All Deliveries | Emergency Cesarean Delivery | Operative Intervention | Operative Intervention Due to Fetal Distress | 5-Min Apgar < 7 | NICU Admission | CAPO | |
|---|---|---|---|---|---|---|---|
| Number | |||||||
| Total cohort | 3326 (100%) | 37 (1.11%) | 851 (25.59%) | 320 (9.92%) | 67 (2.08%) | 437 (13.14%) | 504 (15.15%) |
| Low-risk cohort | 3105 (100%) | 30 (0.97%) | 783 (25.22%) | 280 (9.02%) | 59 (1.9%) | 369 (11.88%) | 432 (13.91%) |
| Prolonged pregnancy cohort | 685 (100%) | 8 (1.17%) | 199 (29.10%) | 82 (11.97%) | 20 (2.92%) | 81 (11.82%) | 100 (14.60%) |
| SGA cohort | 212 (100%) | 7 (3.3%) | 65 (30.66%) | 38 (17.92%) | 6 (2.83%) | 62 (29.25%) | 66 (31.13%) |
| Maternal age (years, median) | |||||||
| Total cohort | 32 (16–47) | 32 (16–47) | 32 (16–47) | 32 (16–47) | 32 (19–42) | 32 (19–46) | 32 (19–47) |
| Low-risk cohort | 32 (16–47) | 32 (16–47) | 32 (16–47) | 32 (16–47) | 32 (19–42) | 32 (19–46) | 32 (19–47) |
| Prolonged pregnancy cohort | 32 (16–47) | 35.5 (29–47) | 33 (16–47) | 32 (19–47) | 34 (22–38) | 32 (19–42) | 32 (19–47) |
| SGA cohort | 31 (18–44) | 32 (26–40) | 31 (20–41) | 31 (25–40) | 32 (20–37) | 31 (20–41) | 31.5 (20–41) |
| Gravida (median, min–max) | |||||||
| Total cohort | 2 (1–12) | 1 (1–9) | 1 (1–12) | 1(1–9) | 1 (1–9) | 2 (1–9) | 2 (1–9) |
| Low-risk cohort | 2 (1–12) | 1 (1–9) | 1 (1–12) | 1 (1–9) | 1 (1–9) | 2 (1–9) | 2 (1–9) |
| Prolonged pregnancy cohort | 2 (1–9) | 1(1–3) | 1 (1–5) | 1 (1–4) | 1.5 (1–3) | 1 (1–9) | 1 (1–9) |
| SGA cohort | 1 (1–9) | 1 (1–3) | 1 (1–5) | 1 (1–5) | 1 (1–2) | 1 (1–6) | 1 (1–6) |
| Para (median, min–max) | |||||||
| Total cohort | 1 (0–9) | 1 (1–6) | 1 (0–6) | 1 (0–6) | 1 (1–6) | 1 (0–9) | 1 (0–9) |
| Low-risk cohort | 1 (0–9) | 1 (1–6) | 1 (0–6) | 1 (0–6) | 1 (1–6) | 1 (1–9) | 1 (1–9) |
| Prolonged pregnancy cohort | 1 (0–9) | 1 (1–2) | 1 (1–3) | 1 (1–3) | 1 (1–3) | 1 (1–9) | 1 (1–9) |
| SGA cohort | 1 (0–6) | 1 (1–6) | 1 (1–3) | 1 (1–3) | 1 (1–2) | 1 (0–3) | 1 (0–3) |
| Maternal BMI (median, min–max) | |||||||
| Total cohort | 28.5 (18.5–60.6) | 29.3 (21.6–47.4) | 29 (19.5–59) | 29.1 (20.5–59) | 28.9 (21.3–52.8) | 28.9 (19–59) | 29 (19–59) |
| Low-risk cohort | 28.6 (18.5–59) | 30.1 (24.6–47.4) | 29.1 (19.5–59) | 29.1 (20.5–59) | 29 (21.3–52.8) | 29.1 (19–59) | 29.1 (19–59) |
| Prolonged pregnancy cohort | 28.4 (20.6–52.8) | 32.1 (26.2–36.3) | 28.9 (23.1–52.8) | 28.8 (23.1–38.8) | 31.2 (21.3–52.8) | 30.8 (21.1–40.9) | 30.7 (21.1–52.8) |
| SGA cohort | 27.8 (20.1–60.6) | 27.8 (21.6–32.4) | 28.2 (21.6–43.8) | 28.4 (21.6–43.8) | 27.4 (21.6–39.7) | 27.7 (21.6–43.8) | 27.7 (21.6–43.7) |
| Ethnicity: number (%) | |||||||
| Europe | |||||||
| Total cohort | 1757 (52.83%) | 19 (51.14%) | 443 (52.06%) | 163 (50.94%) | 30 (44.78%) | 209 (47.83%) | 243 (48.21%) |
| Low-risk cohort | 1648 (53.08%) | 16 (53.33%) | 415 (53%) | 145 (51.79%) | 28 (47.46%) | 178 (48.24%) | 210 (48.61%) |
| Prolonged pregnancy cohort | 389 (56.79%) | 5 (62.5%) | 109 (54.77%) | 49 (59.76%) | 10 (50%) | 39 (48.15%) | 49 (49%) |
| SGA cohort | 106 (50%) | 3 (42.85%) | 28 (43.08%) | 18 (47.37%) | 2 (33.33%) | 29 (46.77%) | 31 (46.97%) |
| Others | |||||||
| Total cohort | 1569 (47.17%) | 18 (48.6%) | 408 (47.94%) | 157 (49.06%) | 37 (55.22%) | 228 (52.17%) | 261 (51.79%) |
| Low-risk cohort | 1457 (46.92%) | 14 (46.67%) | 368 (47%) | 135 (48.21%) | 31 (34.83%) | 191 (51.76%) | 222 (51.39%) |
| Prolonged pregnancy cohort | 296 (43.21%) | 3 (37.5%) | 90 (45.23%) | 33 (40.24%) | 10 (50%) | 42 (51.85%) | 51 (51%) |
| SGA cohort | 106 (50%) | 4 (57.14%) | 37 (56.92%) | 20 (52.63%) | 4 (66.66%) | 33 (53.23) | 35 (53.03%) |
| Gestational diabetes: number (%) | |||||||
| Total cohort | 329 (9.89%) | 7 (18.92%) | 109 (12.81%) | 39 (12.19%) | 11 (16.42%) | 68 (15.56%) | 73 (14.48%) |
| Low-risk cohort | 314 (10.11%) | 6 (20%) | 104 (13.28%) | 35 (12.5%) | 11 (18.64%) | 65 (17.62%) | 40 (16.20%) |
| Prolonged pregnancy cohort | 40 (5.84%) | 0 (0%) | 18 (9.05%) | 5 (6.10%) | 2 (10%) | 7 (8.64%) | 9 (9%) |
| SGA cohort | 15 (7.08%) | 1 (14.29%) | 5 (7.69%) | 4 (10.53%) | 0 (0%) | 3 (4.84%) | 3 (4.55%) |
| Hypertensive pregnancy disorders: number (%) | |||||||
| Total cohort | 88 (2.65%) | 1 (2.70%) | 30 (3.53%) | 10 (3.16%) | 7 (10.45%) | 19 (4.35%) | 22 (4.37%) |
| Low-risk cohort | 76 (2.45%) | 1 (3.33%) | 26 (3.32%) | 9 (3.21%) | 7 (11.86%) | 15 (4.07%) | 18 (4.17%) |
| Prolonged pregnancy cohort | 7 (1.02%) | 1 (12.5%) | 3 (1.51%) | 2 (2.45%) | 2 (10%) | 2 (2.47%) | 3 (3%) |
| SGA cohort | 11 (5.19%) | 0 (0%) | 4 (6.15%) | 1 (2.63%) | 0 (0%) | 4 (6.45%) | 4 (6.06%) |
| Previous cesarean delivery: number (%) | |||||||
| Total cohort | 444 (13.35%) | 8 (21.62%) | 224 (26.32%) | 57 (17.81%) | 12 (17.91%) | 56 (12.81%) | 66 (13.10%) |
| Low-risk cohort | 425 (13.69%) | 7 (23.33%) | 212 (27.08%) | 50 (17.86%) | 9 (15.25%) | 48 (13.01%) | 58 (13.43%) |
| Prolonged pregnancy cohort | 76 (11.09%) | 2 (25%) | 38 (19.1%) | 9 (10.78%) | 3 (15%) | 8 (9.88%) | 12 (12%) |
| SGA cohort | 17 (8.02%) | 1 (14.29%) | 10 (15.38%) | 6 (15.79%) | 1 (16.66%) | 6 (9.68%) | 6 (9.09%) |
| Induction of labor: number (%) | |||||||
| Total cohort | 1434 (43.11%) | 20 (54.05%) | 400 (47%) | 167 (52.19%) | 37 (55.22%) | 230 (52.63%) | 261 (51.79%) |
| Low-risk cohort | 1284 (41.35%) | 16 (53.33%) | 356 (45.47%) | 50 (17.86%) | 33 (55.93%) | 175 (47.43%) | 203 (46.99%) |
| Prolonged pregnancy cohort | 453 (66.13%) | 8 (100%) | 140 (70.35%) | 59 (71.95%) | 17 (85%) | 60 (74.07%) | 72 (72%) |
| SGA cohort | 143 (67.45%) | 4 (57.14%) | 43 (66.15%) | 30 (78.95%) | 4 (66.66%) | 51 (82.26%) | 54 (81.81%) |
| Pathological CTG: number (%) | |||||||
| Total cohort | 681 (20.48%) | 33 (89.19%) | 320 (37.6%) | 320 (100%) | 30 (44.78%) | 137 (31.35%) | 169 (33.53%) |
| Low-risk cohort | 616 (19.84%) | 28 (93.33%) | 280 (35.76%) | 280 (100%) | 27 (45.76%) | 106 (28.73%) | 137 (31.71%) |
| Prolonged pregnancy cohort | 152 (22.19%) | 8 (100%) | 82 (41.21%) | 82 (100%) | 7 (35%) | 25 (30.86%) | 34 (34%) |
| SGA cohort | 63 (29.72%) | 5 (71.43%) | 38 (58.46%) | 38 (100%) | 2 (33.33%) | 29 (46.77%) | 30 (45.45%) |
| GA at scan: weeks, median | |||||||
| Total cohort | 39.9 (35.1–42.7) | 40 (36.7–41.3) | 40 (35–42.3) | 40.1 (35.5–42.1) | 40.1 (35.6–41.4) | 39.7 (35.1–42) | 39.9 (35.1–42) |
| Low-risk cohort | 40 (35.1–42.7) | 40 (36.7–41.3) | 40 (35.1–42.3) | 40.1 (35.6–42.1) | 40.1 (36.7–41.4) | 40 (35.1–42) | 40 (35–42) |
| Prolonged pregnancy cohort | 41 (39.1–42.7) | 41 (40.5–41.3) | 41 (39.1–42.3) | 41 (40–42) | 41 (40.3–41.4) | 41 (39.4–42) | 41 (39.4–42) |
| SGA cohort | 39.2 (37.0–42.1) | 39.3 (37.3–41.3) | 39.3 (37–42.1) | 39.7 (37–42.4) | 39.7 (37.1–41) | 38 (37–41.4) | 38.1 (37–42.4) |
| Interval scan-to-delivery: (days, median) | |||||||
| Total cohort | 1 (0–14) | 2 (0–11) | 1 (0–14) | 1 (0–12) | 1 (0–11) | 1 (0–13) | 1 (0–13) |
| Low-risk cohort | 1 (0–14) | 2 (0–11) | 1 (0–14) | 1 (0–12) | 1 (0–10) | 1 (0–13) | 1 (0–13) |
| Prolonged pregnancy cohort | 2 (0–14) | 2.5 (2–4) | 2 (0–14) | 2 (0–7) | 2 (0–6) | 2 (0–11) | 2 (0–11) |
| SGA cohort | 1 (0–12) | 1 (0–3) | 1 (0–11) | 1 (0–4) | 1 (0–3) | 2 (0–5) | 1 (0–5) |
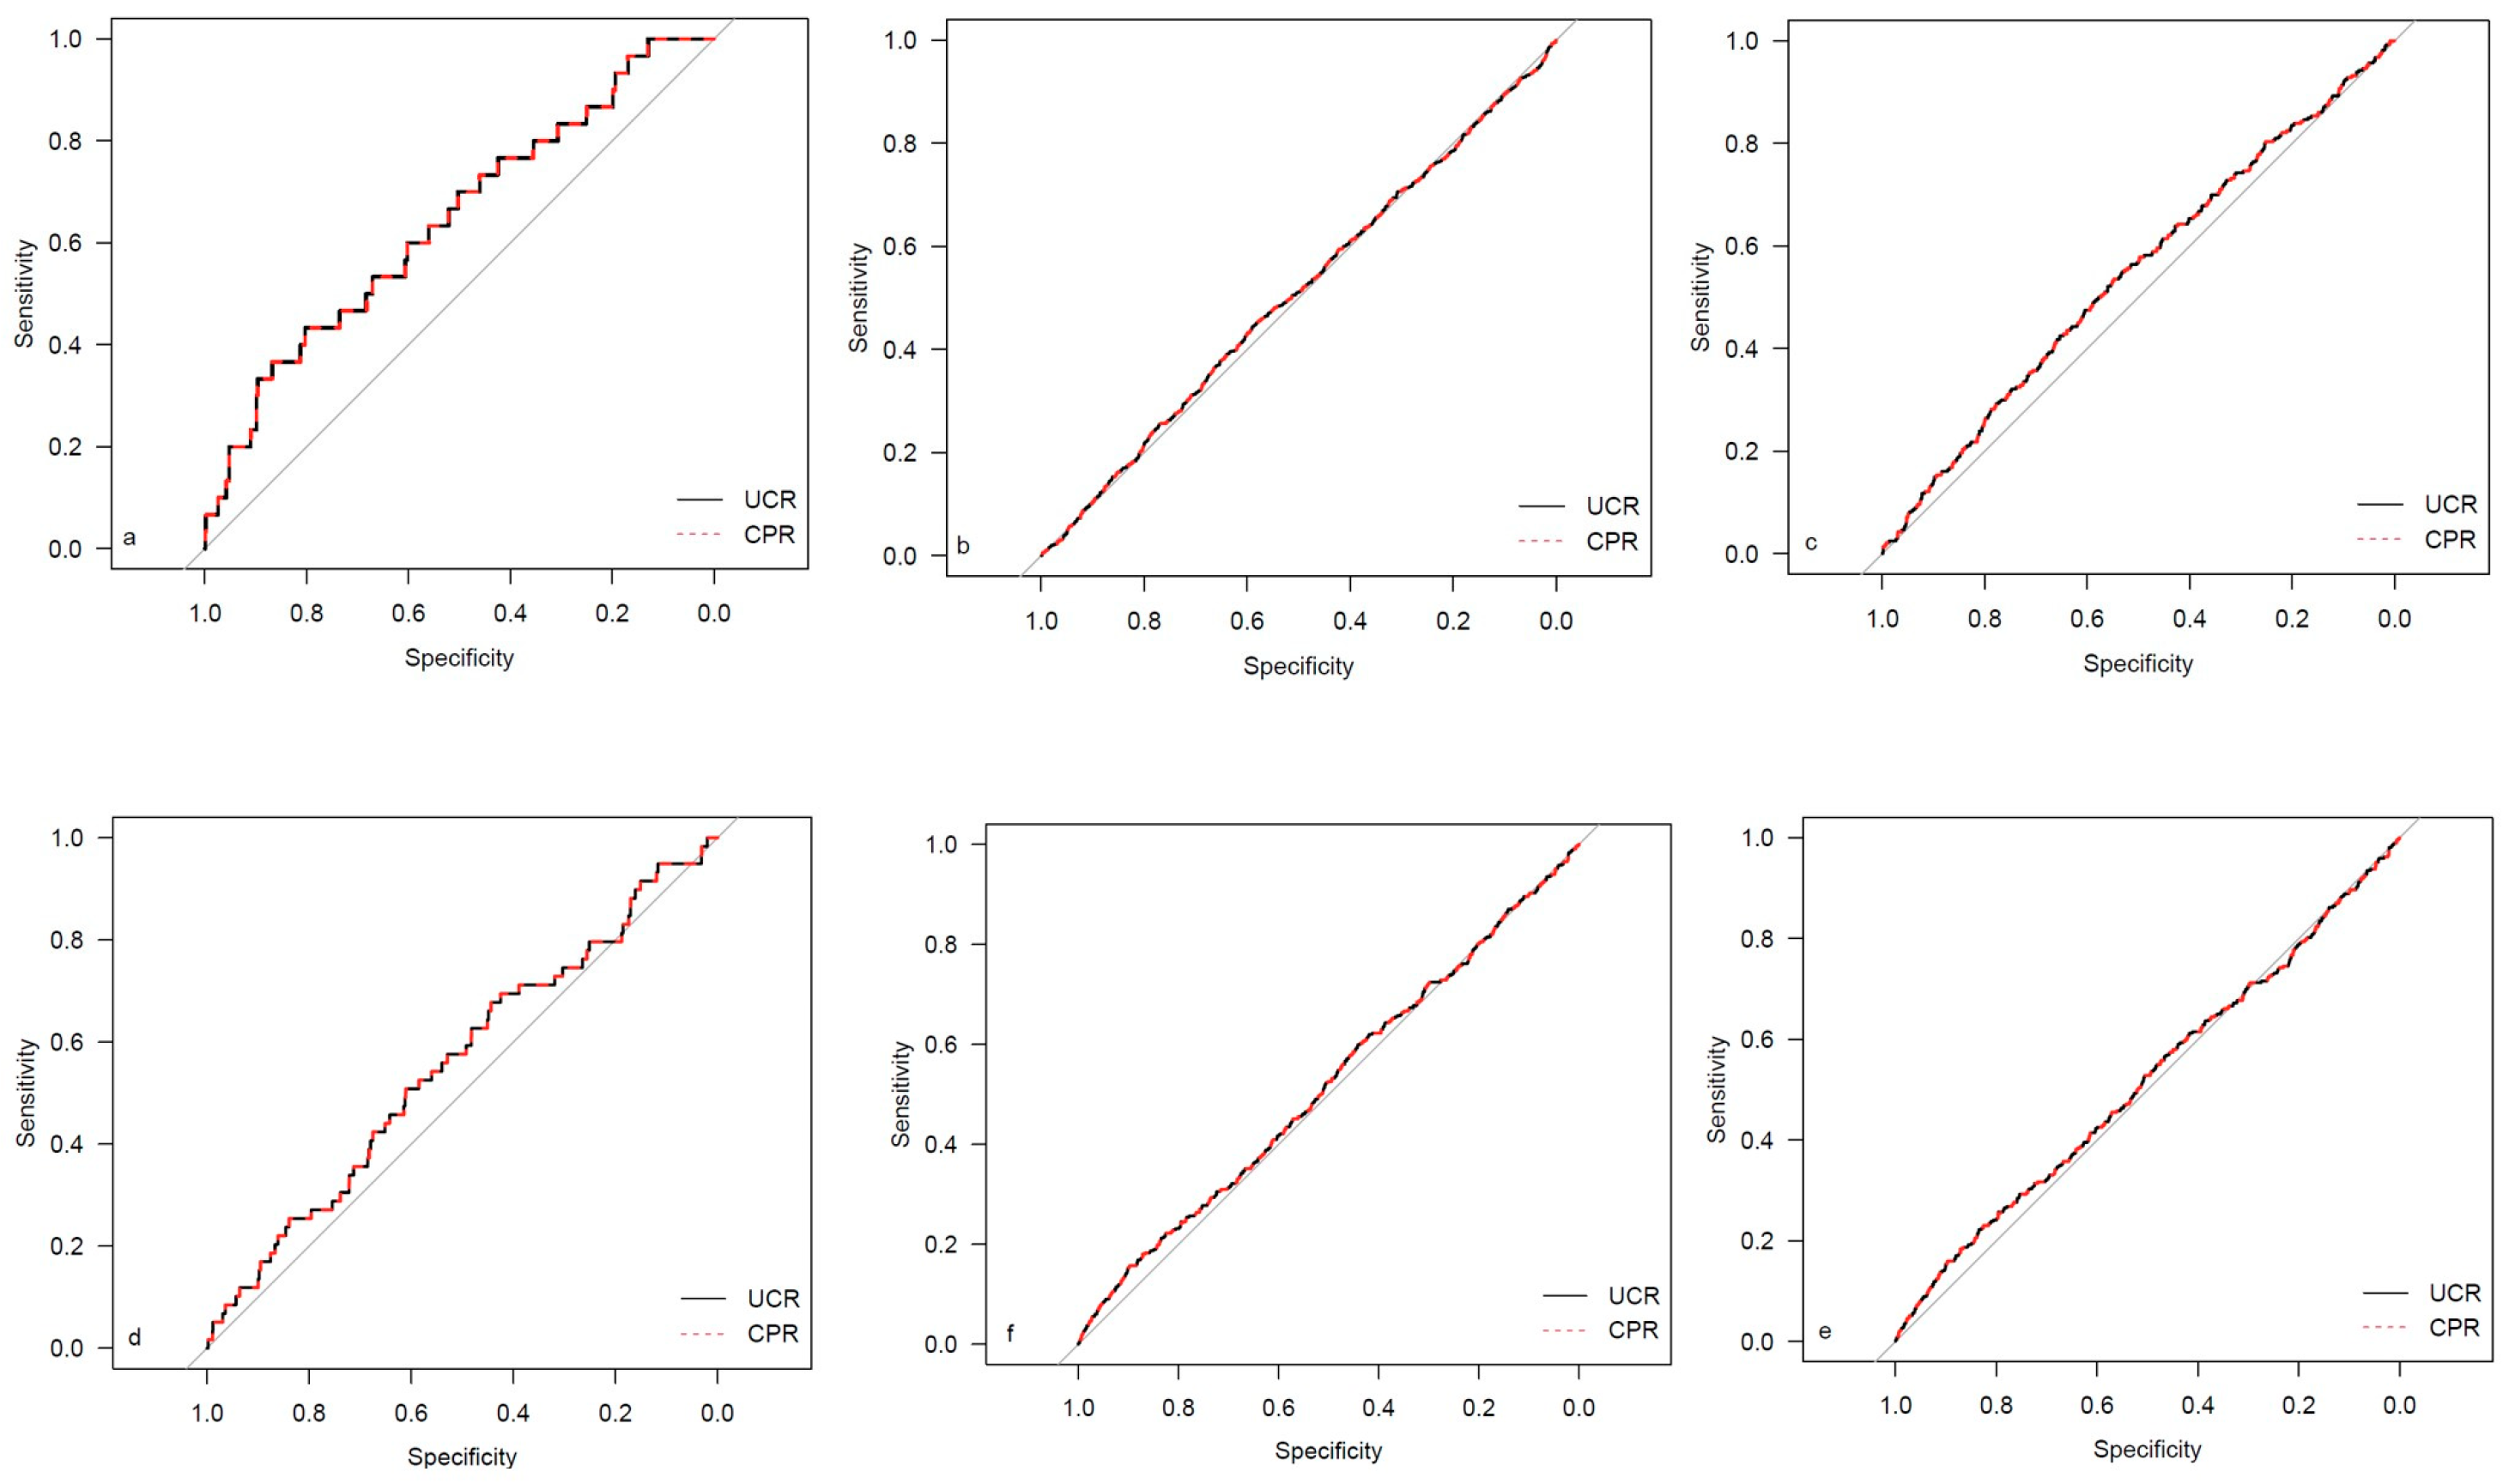
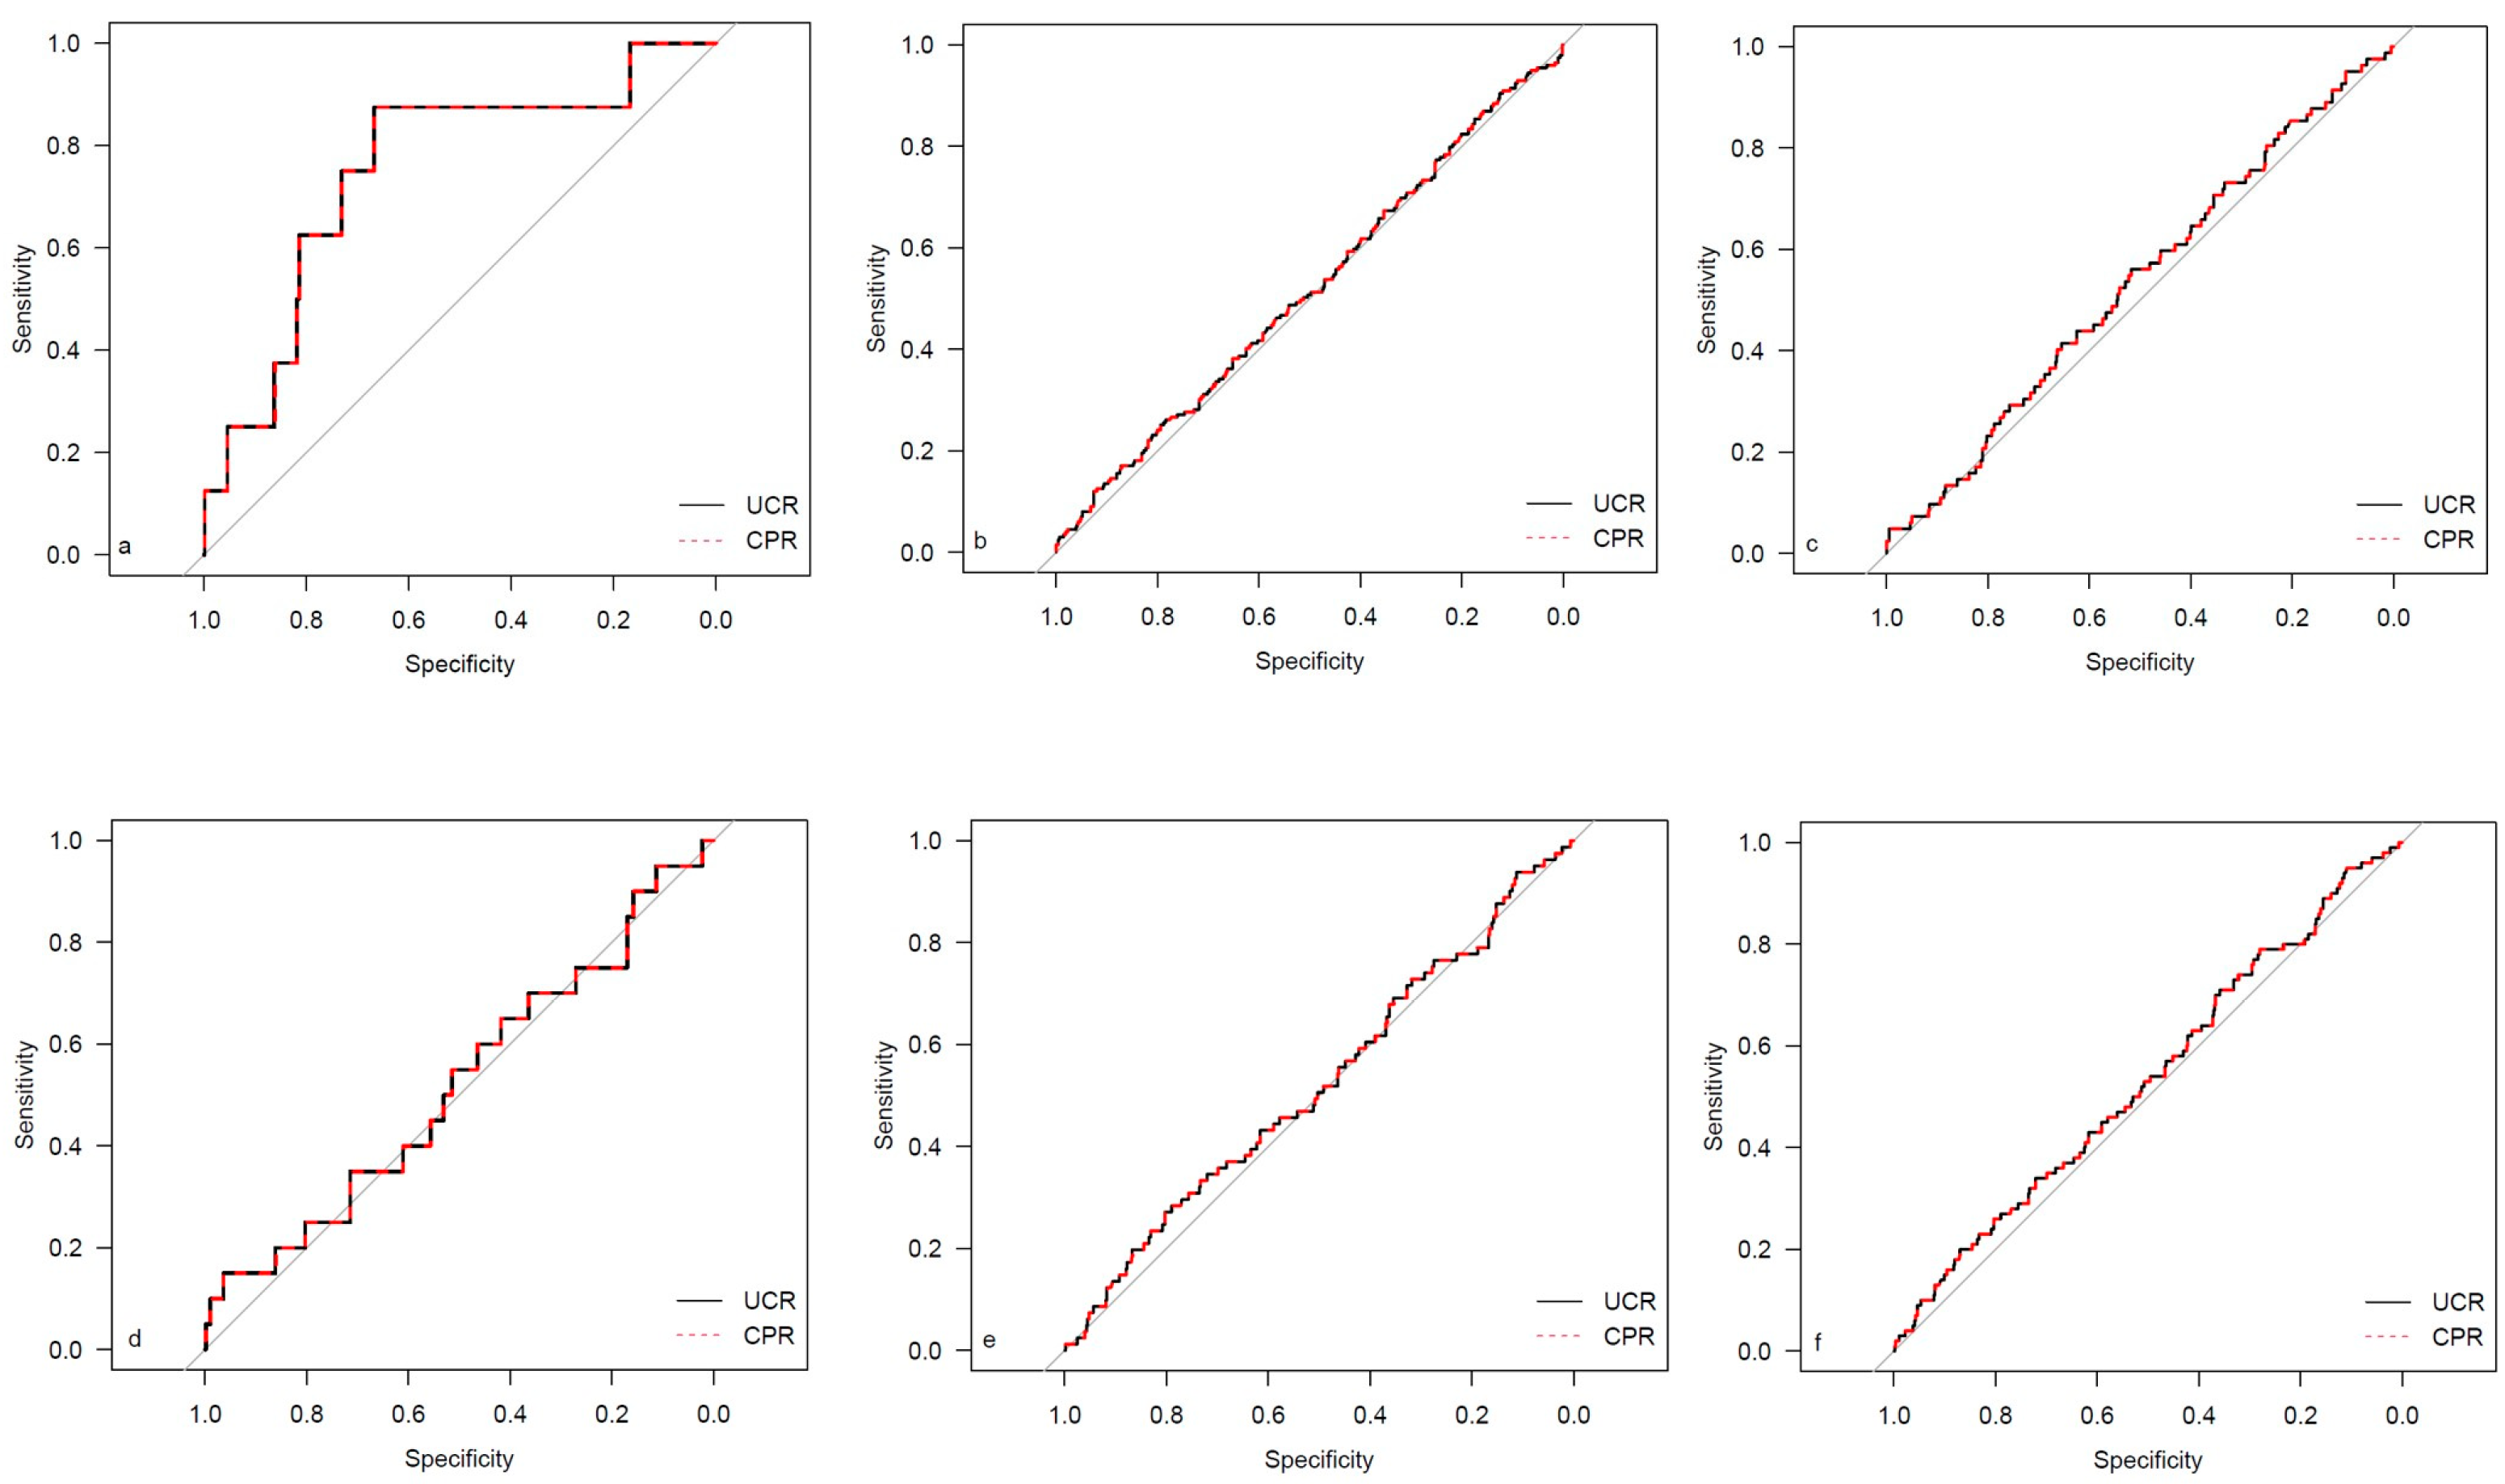
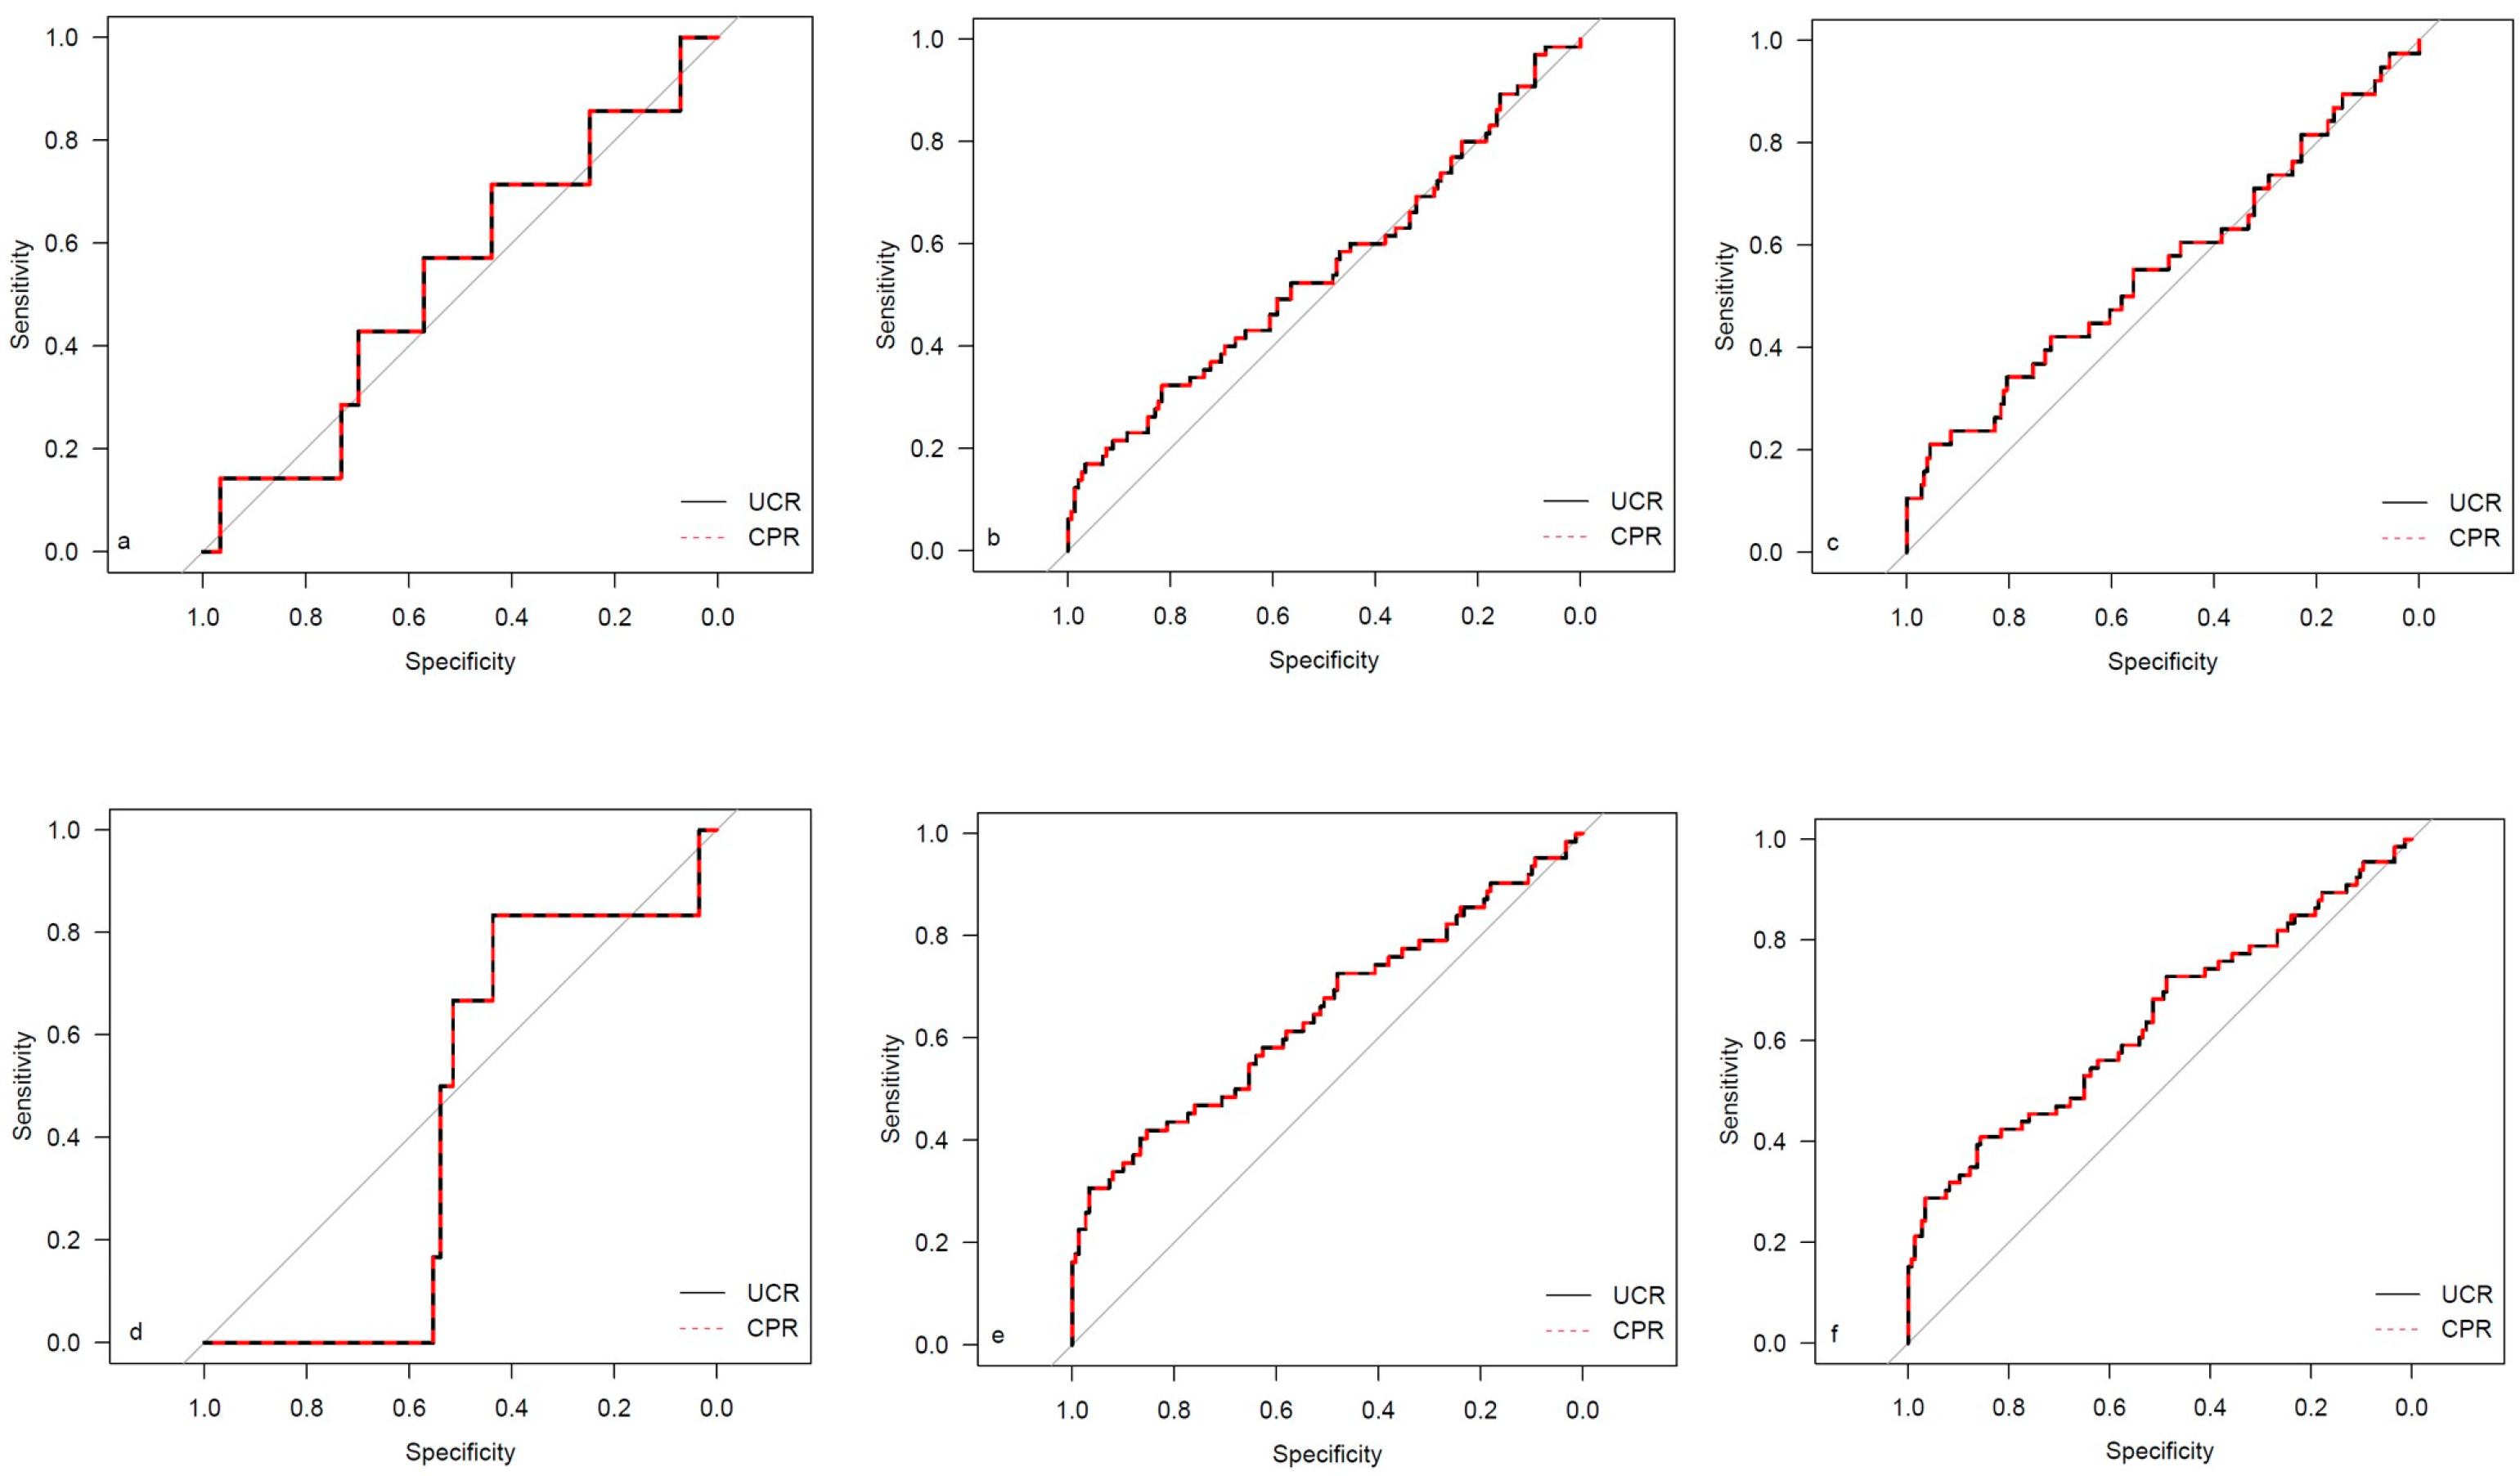
| CPR | UCR | |||
|---|---|---|---|---|
| AUC | Brier Score | AUC | Brier Score | |
| Emergency cesarean delivery | ||||
| Total cohort | 0.642 | 0.01096 | 0.642 | 0.01098 |
| Low-risk cohort | 0.643 | 0.00953 | 0.643 | 0.00952 |
| Prolonged pregnancy cohort | 0.752 | 0.01135 | 0.752 | 0.01119 |
| SGA cohort | 0.532 | 0.03192 | 0.532 | 0.03193 |
| Operative intervention | ||||
| Total cohort | 0.512 | 0.19038 | 0.512 | 0.19022 |
| Low-risk cohort | 0.507 | 0.18858 | 0.507 | 0.18857 |
| Prolonged pregnancy cohort | 0.517 | 0.20600 | 0.517 | 0.20565 |
| SGA cohort | 0.549 | 0.21012 | 0.549 | 0.20526 |
| Operative intervention CTG | ||||
| Total cohort | 0.555 | 0.08663 | 0.555 | 0.08618 |
| Low-risk cohort | 0.544 | 0.08190 | 0.544 | 0.08185 |
| Prolonged pregnancy cohort | 0.532 | 0.10519 | 0.532 | 0.10506 |
| SGA cohort | 0.558 | 0.14547 | 0.558 | 0.13952 |
| 5-Minute Apgar < 7 | ||||
| Total cohort | 0.566 | 0.01971 | 0.566 | 0.01972 |
| Low-risk cohort | 0.556 | 0.01863 | 0.566 | 0.01862 |
| Prolonged pregnancy cohort | 0.520 | 0.02833 | 0.520 | 0.02826 |
| SGA cohort | 0.436 | 0.02747 | 0.436 | 0.02749 |
| NICU admission | ||||
| Total cohort | 0.547 | 0.11373 | 0.547 | 0.11266 |
| Low-risk cohort | 0.516 | 0.10470 | 0.516 | 0.10459 |
| Prolonged pregnancy cohort | 0.522 | 0.10420 | 0.522 | 0.10416 |
| SGA cohort | 0.647 | 0.19191 | 0.647 | 0.18313 |
| CAPO | ||||
| Total cohort | 0.544 | 0.12810 | 0.544 | 0.12708 |
| Low-risk cohort | 0.517 | 0.11973 | 0.517 | 0.11960 |
| Prolonged pregnancy cohort | 0.534 | 0.12438 | 0.534 | 0.12426 |
| SGA cohort | 0.638 | 0.20049 | 0.638 | 0.19244 |
| CPR | UCR | |||||||
|---|---|---|---|---|---|---|---|---|
| Outcome | No Outcome | Univariate Analysis: OR (CI) | p-Value | Outcome | No Outcome | Univariate Analysis: OR (CI) | p-Value | |
| Emergency cesarean delivery | ||||||||
| Total cohort | 0.89 | 1.04 | 0.11 (0.03–0.42) | 0.001 | 1.23 | 1.04 | 3.82 (1.81–7.30) | 0.001 |
| Low-risk cohort | 0.90 | 1.06 | 0.10 (0.02–0.45) | 0.002 | 1.22 | 1.02 | 5.39 (2.10–12.39) | 0.001 |
| Prolonged pregancy cohort | 0.81 | 1.04 | 0.02 (0.00–0.40) | 0.01 | 1.34 | 1.03 | 15.02 (2.24–89.09) | 0.01 |
| SGA cohort | 0.85 | 0.88 | 0.64 (0.03–10.72) | 0.76 | 1.28 | 1.25 | 1.15 (0.16–4.19) | 0.86 |
| Operative intervention | ||||||||
| Total cohort | 1.04 | 1.04 | 0.93 (0.71–1.20) | 0.57 | 1.05 | 1.03 | 1.24 (0.97–1.59) | 0.09 |
| Low-risk cohort | 1.06 | 1.05 | 1.01 (0.77–1.32) | 0.96 | 1.03 | 1.02 | 1.05 (0.79–1.39) | 0.73 |
| Prolonged pregancy cohort | 1.03 | 1.04 | 0.84 (0.46–1.51) | 0.56 | 1.05 | 1.02 | 1.42 (0.79–2.52) | 0.24 |
| SGA cohort | 0.84 | 0.90 | 0.42 (0.13–1.32) | 0.14 | 1.37 | 1.20 | 2.30 (1.21–4.64) | 0.01 |
| Operative intervention CTG | ||||||||
| Total cohort | 0.99 | 1.05 | 0.50 (0.33–0.76) | 0.001 | 1.12 | 1.03 | 2.20 (1.57–3.06) | <0.001 |
| Low-risk cohort | 1.02 | 1.06 | 0.61 (0.39–0.93) | 0.02 | 1.07 | 1.02 | 1.72 (1.14–2.55) | 0.009 |
| Prolonged pregancy cohort | 1.01 | 1.04 | 0.63 (0.26–1.44) | 0.28 | 1.07 | 1.03 | 1.69 (0.76–3.64) | 0.20 |
| SGA cohort | 0.83 | 0.89 | 0.40 (0.09–1.59) | 0.20 | 1.44 | 1.21 | 2.61 (1.29–5.52) | 0.008 |
| 5-min Apgar < 7 | ||||||||
| Total cohort | 0.98 | 1.04 | 0.43 (0.17–1.01) | 0.05 | 1.12 | 1.04 | 2.05 (1.02–3.77) | 0.04 |
| Low-risk cohort | 1.00 | 1.06 | 0.49 (0.19–1.22) | 0.13 | 1.09 | 1.02 | 2.02 (0.88–4.31) | 0.10 |
| Prolonged pregancy cohort | 1.01 | 1.04 | 0.68 (0.12–3.22) | 0.64 | 1.10 | 1.03 | 2.13 (0.46–8.36) | 0.32 |
| SGA cohort | 0.81 | 0.88 | 0.31 (0.001–7.14) | 0.48 | 1.31 | 1.25 | 1.29 (0.17–4.81) | 0.77 |
| NICU admission | ||||||||
| Total cohort | 1.00 | 1.05 | 0.58 (0.41–0.83) | 0.002 | 1.12 | 1.03 | 2.31 (1.71–3.10) | <0.001 |
| Low-risk cohort | 1.04 | 1.06 | 0.88 (0.61–1.26) | 0.49 | 1.05 | 1.02 | 1.39 (0.96–2.00) | 0.08 |
| Prolonged pregancy cohort | 1.02 | 1.04 | 0.76 (0.32–1.73) | 0.52 | 1.06 | 1.03 | 1.39 (0.61–3.04) | 0.42 |
| SGA cohort | 0.78 | 0.92 | 0.10 (0.003–0.37) | <0.001 | 1.48 | 1.16 | 5.58 (2.59–13.20) | <0.001 |
| CAPO | ||||||||
| Total cohort | 1.00 | 1.05 | 0.59 (0.42–0.82) | 0.001 | 1.11 | 1.03 | 2.19 (1.64–2.9) | <0.001 |
| Low-risk cohort | 1.04 | 1.06 | 0.84 (0.59–1.18) | 0.30 | 1.05 | 1.02 | 1.42 (1.00–1.98) | 0.048 |
| Prolonged pregancy cohort | 1.01 | 1.05 | 0.61 (0.27–1.31) | 0.21 | 1.07 | 1.03 | 1.71 (0.82–3.48) | 0.15 |
| SGA cohort | 0.79 | 0.92 | 0.12 (0.03–0.41) | 0.001 | 1.46 | 1.16 | 5.06 (2.39–11.75) | <0.001 |
Disclaimer/Publisher’s Note: The statements, opinions and data contained in all publications are solely those of the individual author(s) and contributor(s) and not of MDPI and/or the editor(s). MDPI and/or the editor(s) disclaim responsibility for any injury to people or property resulting from any ideas, methods, instructions or products referred to in the content. |
© 2023 by the authors. Licensee MDPI, Basel, Switzerland. This article is an open access article distributed under the terms and conditions of the Creative Commons Attribution (CC BY) license (https://creativecommons.org/licenses/by/4.0/).
Share and Cite
Stumpfe, F.M.; Mayr, A.; Schneider, M.O.; Kehl, S.; Stübs, F.; Antoniadis, S.; Titzmann, A.; Pontones, C.A.; Bayer, C.M.; Beckmann, M.W.; et al. Cerebroplacental versus Umbilicocerebral Ratio—Analyzing the Predictive Value Regarding Adverse Perinatal Outcomes in Low- and High-Risk Fetuses at Term. Medicina 2023, 59, 1385. https://doi.org/10.3390/medicina59081385
Stumpfe FM, Mayr A, Schneider MO, Kehl S, Stübs F, Antoniadis S, Titzmann A, Pontones CA, Bayer CM, Beckmann MW, et al. Cerebroplacental versus Umbilicocerebral Ratio—Analyzing the Predictive Value Regarding Adverse Perinatal Outcomes in Low- and High-Risk Fetuses at Term. Medicina. 2023; 59(8):1385. https://doi.org/10.3390/medicina59081385
Chicago/Turabian StyleStumpfe, Florian M., Andreas Mayr, Michael O. Schneider, Sven Kehl, Frederik Stübs, Sophia Antoniadis, Adriana Titzmann, Constanza A. Pontones, Christian M. Bayer, Matthias W. Beckmann, and et al. 2023. "Cerebroplacental versus Umbilicocerebral Ratio—Analyzing the Predictive Value Regarding Adverse Perinatal Outcomes in Low- and High-Risk Fetuses at Term" Medicina 59, no. 8: 1385. https://doi.org/10.3390/medicina59081385
APA StyleStumpfe, F. M., Mayr, A., Schneider, M. O., Kehl, S., Stübs, F., Antoniadis, S., Titzmann, A., Pontones, C. A., Bayer, C. M., Beckmann, M. W., & Faschingbauer, F. (2023). Cerebroplacental versus Umbilicocerebral Ratio—Analyzing the Predictive Value Regarding Adverse Perinatal Outcomes in Low- and High-Risk Fetuses at Term. Medicina, 59(8), 1385. https://doi.org/10.3390/medicina59081385