Article

Hydrogenation of CO2 on Nanostructured Cu/FeOx Catalysts: The Effect of Morphology and Cu Load on Selectivity

1
Department of Nanocatalysis, J. Heyrovský Institute of Physical Chemistry v.v.i., Czech Academy of Sciences, Dolejškova 2155/3, 18223 Prague, Czech Republic
2
Department of Physical Chemistry, Faculty of Science, Palacký University Olomouc, 17. listopadu 12, 77900 Olomouc, Czech Republic
3
Laboratory of Surface Analysis, University of Chemistry and Technology, Technická 3, 16628 Prague, Czech Republic
*
Authors to whom correspondence should be addressed.
Catalysts 2022, 12(5), 516; https://doi.org/10.3390/catal12050516
Submission received: 30 December 2021 / Revised: 28 April 2022 / Accepted: 29 April 2022 / Published: 4 May 2022
(This article belongs to the Special Issue New Trends in Catalysis for Sustainable CO2 Conversion)

Abstract

:
The aim of this work was to study the influence of copper content and particle morphology on the performance of Cu/FeOx catalysts in the gas-phase conversion of CO2 with hydrogen. All four investigated catalysts with a copper content between 0 and 5 wt% were found highly efficient, with CO2 conversion reaching 36.8%, and their selectivity towards C1 versus C2-C4, C2-C4=, and C5+ products was dependent on catalyst composition, morphology, and temperature. The observed range of products is different from those observed for catalysts with similar composition but synthesized using other precursors and chemistries, which yield different morphologies. The findings presented in this paper indicate potential new ways of tuning the morphology and composition of iron-oxide-based particles, ultimately yielding catalyst compositions and morphologies with variable catalytic performances.

1. Introduction

Ever since the industrial revolution, human activity has emitted massive amounts of CO2 into the atmosphere by burning fossil fuels. For the last two decades, the annual emissions of CO2 increased to nearly 37 billion tons. The current global CO2 concentration in the atmosphere exceeded 415 ppm, which is expected to rise to 500 ppm by the end of 2030 [1,2]. In order to mitigate global warming, a 70–80% reduction in CO2 production should be reached by 2050. This, of course, creates a major challenge for modern science due to the fundamental contribution of CO2 to global warming via the greenhouse effect [3]. Hence, one of the research topics of modern science is CO2 capture and/or its conversion to hydrocarbons [4,5], which can be utilized as energy sources or precursors in the chemical industry. In particular, CO2 can be used as a feedstock in many organic reactions, catalytically converting CO2 into alcohols (methanol); hydrocarbons, such as methane, ethane, or benzene; CO or carbonates; and even derivates of hydrocarbons (e.g., carboxylic acids, aldehydes, amides, and esters) [6,7,8,9,10,11]. The topic of CO2 hydrogenation has been researched intensively for the last decades, however, there is still plenty of room to develop new routes toward catalysts with high conversion, durability, and desired selectivity. The synthesis of C1 products by CO2 hydrogenation may follow three different paths, according to the open literature. One is a process known as reverse water gas shift (RWGS), the second is called the formate pathway, and the third pathway is the direct C–O split of CO2 [12]. The highly positive Gibbs free energy change for CO2 conversion to CH4 (i.e., 1135 kJ mol−1) makes the CO2 methanation reaction thermodynamically adverse [13], and the extremely stable and unreactive nature of CO2 molecules, its conversion to value-added fuels, is a challenging problem that requires high energy input [14,15]. Currently, the process in which CO2 and H2 are thermally activated on the catalyst’s surface, resulting in the formation of hydrocarbons, seems to be extremely interesting for industrial implementations. During this process, CO2 and H2 are first transformed into CO and water (RWGS), then CO can enter a reaction with excess H2 to generate hydrocarbons through the Fisher–Tropsch (FT) synthesis process [16]. CO2 hydrogenation usually produces lower molecular weight hydrocarbons [16], and the conversion rate and selectivity to desired products depend on catalyst composition as one of the factors which determine performance. Iron is one of the most studied catalysts for both FT and CO2 hydrogenation, as it can adsorb and activate CO2 [17], which is a prerequisite for the conversion of CO2 to short-chain olefins, thanks to its intrinsic RWGS and FT activity. It is accepted that during CO2 hydrogenation, highly active Fe species (Fe(0) and Fe5C2) are generated, which activate the formed CO to subsequently undergo sequential hydrogenation steps with the generation of CH, CH2, and CH3 reactive intermediates that can polymerize to higher hydrocarbons or are fully hydrogenated to form methane [18,19] Fe catalysts with alkali metal promoters for CO2 conversion to light olefins were reported in several papers; these catalysts typically require operating temperatures over 300 °C and pre-treatment under hydrogen or a CO atmosphere for over 12 h [20,21,22,23,24,25,26,27,28,29]. Bimetallic catalysts, such as Co-Fe [30], were reported with improved activity towards the production of methane in CO2 hydrogenation. Fe catalysts with Cu as promoters have also been reported, possessing low selectivity for light olefins while dominantly producing methane [31,32]. Combinations of Cu and Fe catalysts have already been reported with improved selectivity to olefins [33,34] and copper-based catalysts were investigated for their RWGS performance related to CO2 activation [35]. Numerous Cu-based catalysts have been reported with high selectivity toward methanol formation [36,37,38,39,40,41,42,43,44,45,46], including copper tetramer (Cu4) clusters [47]. Copper nanoparticles have been reported to be able to generate C2-C3 products with high selectivity [48]. In this paper, we focus on the design of efficient catalysts for CO2 hydrogenation based on copper-iron oxide (Cu/FeOx) to leverage both Cu’s and FeOx’s inherent abilities, with Cu serving as the RWGS catalyst and hydrogen activator and FeOx yielding hydrocarbons by FT.

2. Experimental Section

All chemicals, oxalic acid (C2H2O4), N,N-dimethylacetamide (C4H9NO, anhydrous), iron (II) chloride tetrahydrate (FeCl4·4H2O), copper sulfate pentahydrate (CuSO4·5H2O) and hydrazine hydrate (N2H4·H2O) were purchased from Sigma Aldrich; the gases used: CO2 (99.99%), H2 (99.99%) and He (99.99%) were acquired from Airgas. Deionized water (purity 0.05 μS·cm−1, AQUAL 29, Merci) was used for the preparation of the solutions for the synthesis of the catalysts. A Sonicator SONOPULS HD 4400 Ultrasonic homogenizer and an Eppendorf Centrifuge 5702 were used for mixing the solution and for improving the dispersion of FeOx in it during synthesis, and for the separation of the solid products, respectively.

2.1. Preparation of the Catalysts

The FeOx and Cu/FeOx catalysts were fabricated using the wet impregnation method [37]. To prepare FeOx, 1 mmol of oxalic acid was dissolved in 10 mL of N,N-dimethylacetamide. Then, a solution of 1 mmol of iron (II) chloride in 12 mL of deionized water was added at room temperature. The reaction was completed after 5 min, and iron (II) oxalate was separated by centrifugation, washed with deionized water and ethanol, and dried in a vacuum at 60 °C for 2 h. The obtained yellow powder of iron (II) oxalate was spread in a crucible in a thin layer and treated at the temperature of 175 °C in air for 12 h to obtain FeOx [49,50].
Cu/FeOx were prepared as follows. Typically, 1 g of the already prepared FeOx was dispersed in 188 mL of deionized water. Then, a certain volume of 15.7 mmol/L of an aqueous solution of copper sulfate pentahydrate, calculated to the desired final load of Cu (2.55 mL for 1 wt%, 7.65 mL for 3 wt% and 12.75 mL for 5 wt%) was added. After 10 min of sonication, 50 mL of 4.95 mmol/L of the solution of hydrazine hydrate was poured into the reaction mixture and was sonicated for an additional 10 min. The resulting reddish-brown solid was isolated by centrifugation, washed with water and ethanol, and dried in a flow box under an inert nitrogen atmosphere at room temperature for 12 h.
The reference copper-free catalyst (FeOx) was prepared using the same procedure, however, instead of using a copper sulfate solution in the first synthesis step, deionized water was added to the solution. The samples, according to their nominal Cu content of 1%, 3%, and 5%, are named as 1%-Cu/FeOx, 3%-Cu/FeOx, and 5%-Cu/FeOx, respectively; the pure iron oxide sample is named as FeOx thorough the manuscript.

2.2. Characterization of the Catalysts

Transmission electron microscopy (TEM) characterization was conducted with a JEOL TEM-2100 multipurpose electron microscope. For scanning electron microscopy (SEM) analysis, a HITACHI SU6600 scanning electron microscope was used. Scanning transmission spectroscopy with high-angle annular dark-field scanning transmission electron microscopy (STEM/HAADF), equipped with an energy-dispersive X-ray spectroscope (EDX), was used for the elemental mapping and obtaining the STEM/HAADF images of the prepared catalysts.
Powder X-ray diffraction (XRD) analysis was performed in a Malvern Panalytical Empyrean diffractometer and the quantification of the individual Fe components in the fresh and used catalysts was completed by using Rietveld analysis of the obtained XRD data, with the High Score Plus (Malvern Panalytical) software utilizing the PDF-4+ and ICSD databases.
Atomic absorption spectroscopy (AAS) was conducted with an Analytik Jena AG ContrAA 300 spectrometer with flame ionization. The sorption of gas was measured on the surface area analyzer Autosorb iQ-C-MP (Quantachrome Anton Paar), using ASiQWin software at 77 K up to the saturation pressure of N2. For calculating the specific surface area, the Brunauer-Emmett-Teller (BET) model was used. The points for multipoint BET were determined using Roquerol’s method and are within the standard range of p/p0 = 0.05 to 0.3. Before the surface analysis, all catalysts were treated at 130 °C for 12 h under vacuum.
X-ray photoelectron spectroscopy (XPS) was conducted on a PHI 5000 VersaProbe II spectrometer with monochromatic AlKα radiation.
UV-visible spectroscopy was performed using a UV-Vis-NIR spectrometer Perkin-Elmer Lambda 950.

2.3. Catalytic Testing

Tests of the catalysts were performed in a Microactivity Reactor System, (PID Eng&Tech/Micromeritics) coupled to a quartz tube reactor of 320 mm in length and 10 mm inner diameter. A total of 200 mg of a catalyst was placed onto 20 mg of quartz wool in the middle of the reactor and the reactor was conditioned at 250 °C in He with a flow of 30 mL/min for 40 min. No other pre-treatment of the catalysts was performed. The reaction mixture used contained CO2, H2, and He at the ratio of 1:5:4 giving 11% and 49% of CO2 and H2 in He, respectively. A total flow of 25 mL/min was used at a pressure of 1 bar. The reaction products were analyzed on an Agilent 6890 gas chromatograph equipped with TCD (column HP-PLOT/Q) and FID (column Al2O3/KCl) detectors, using an injection after 20 min of reaching the given temperature. In the range of 250 °C to 410 °C, the temperature was raised in steps of 30 °C, at a rate of 5 °C/min (see Figure S1 for the double temperature ramp applied). After reaching the highest temperature in the first ramp, the reactor was cooled down to 250 °C under He. Next, the catalytic test was repeated using an identical heating ramp as the first one.

3. Results and Discussion

SEM micrographs of the as-prepared catalysts are shown in Figure 1, revealing two distinctly different morphologies. FeOx (Figure 1a) and 1%-Cu/FeOx (Figure 1b) show up as rods, with up to about 5 µm in length and thinner (ca. 500 nm) 1%-Cu/FeOx than for FeOx (ca. 1.3 µm), both with a coarse surface structure. The morphology of 3%-Cu/FeOx and 5%-Cu/FeOx (Figure 1c,d, respectively) is very different, reminding us of a structure of sponge or wool. We hypothesize that the observed differences in morphology reflect the differences in the composition of the reaction mixtures used in the synthesis of this set of catalysts. One parameter is the presence of hydrazine, which has reducing and basic properties; the other cause affecting morphology is the variable concentration of SO42, which is introduced to the system by adding CuSO4 solution in increasing amounts with a growing Cu loading. With CuSO4 being acidic, the low pH could impact the level of etching of FeOx, [51] as well as the chemical composition.
SEM images with EDX analysis of the highlighted part are depicted in Figure S2. These images show the elemental composition on the surface of the fresh catalysts. The chemical composition and elemental distribution of FeOx and Cu/FeOx catalysts were characterized by EDX mapping and their EDX spectra. The STEM/HAADF images are depicted for FeOx in Figure S3a, 1%-Cu/FeOx in Figure S4a, 3%-Cu/FeOx in Figure S5a, and 5%-Cu/FeOx in Figure S6a. The images are depicting the same nanorod morphology as shown by the TEM images. As shown, the two dominant elements observed were Fe and O, which were distributed evenly in the catalysts. EDX elemental mapping is shown in Figures S3–S6. Elemental maps, including copper, iron, and carbon, shown in Figures S4–S6, for the copper-containing catalysts, present uniformly dispersed copper in these catalysts. The detected copper particulates appear to be around 2 nm in diameter. In these maps, carbon is shown to be present as the common contamination from exposing the samples to air or detected on the sample grid.
The effect of the composition of the synthesis solution on the composition of the iron component was also confirmed by XRD (Figure S7), with compositions listed for the individual catalysts in Table 1.
It is important to note, that the mean size of coherent domains obtained from XRD data can underestimate the particle size, because it does not take into account the possibly present non-crystalline surface layer, and the mean X-ray coherence length (MLC) in the case of a multiphase system can be less accurate as well. The data are summarized in Table S1. FeOx consists of a coherent domain length of 9 nm for α-Fe2O3, 12 nm for α-FeO(OH), and 11 nm for Fe3O4. Whereas, 1%-Cu/FeOx has 12 nm for α-Fe2O3 and 11 nm for α-FeO(OH) and (not in the table) 56 nm for the copper phase. The 3%-Cu/FeOx catalyst has 19 nm for α-Fe2O3 and 9 nm for α-FeO(OH). The 5%-Cu/FeOx catalyst has 19 nm α-Fe2O3 and 10 nm α-FeO(OH). Diffraction peaks of copper were detected only in 1%-Cu/FeOx, at 50.3°, 58.8°, and 87.9°, due to too small a particle size and/or their amorphicity in the other samples [52]. The chemical composition of iron and copper in the Cu/FeOx samples was determined from the analysis of XPS spectra, as shown in Figures S8–S10, including the deconvoluted spectra and the results from fitting the spectra. The broad Fe 2p3/2 peak indicates the presence of Fe in different valence states. The deconvolution of this peak shows the presence of a mixture of Fe2+ and Fe3+ in the fresh catalysts, where all spectra can be deconvoluted by two main components and one satellite feature. The spectral features above 933.0 eV are related to Cu2+ in copper oxides [53,54]. See also Table S2 for a summary of the XPS analysis.
Adsorption–desorption isotherms (Figure S11) were recorded at 77 K up to the saturation pressure of nitrogen to determine the surface area of the prepared catalysts using the Brunauer–Emmett–Teller (BET) theory. The hysteresis of the two curves shows that the prepared catalysts are porous. The specific surface area of the catalysts was calculated to be 114 m2/g for FeOx, 114 m2/g for 1%-Cu/FeOx, 93 m2/g for 3%-Cu/FeOx, and 92 m2/g for 5%-Cu/FeOx. See Table 1 for the data summary, reflecting on the difference in the morphologies of the catalysts. The UV-vis spectra of the fresh catalysts (Figure S12) show an absorption peak at 275 nm, associated with that of iron oxides [55].

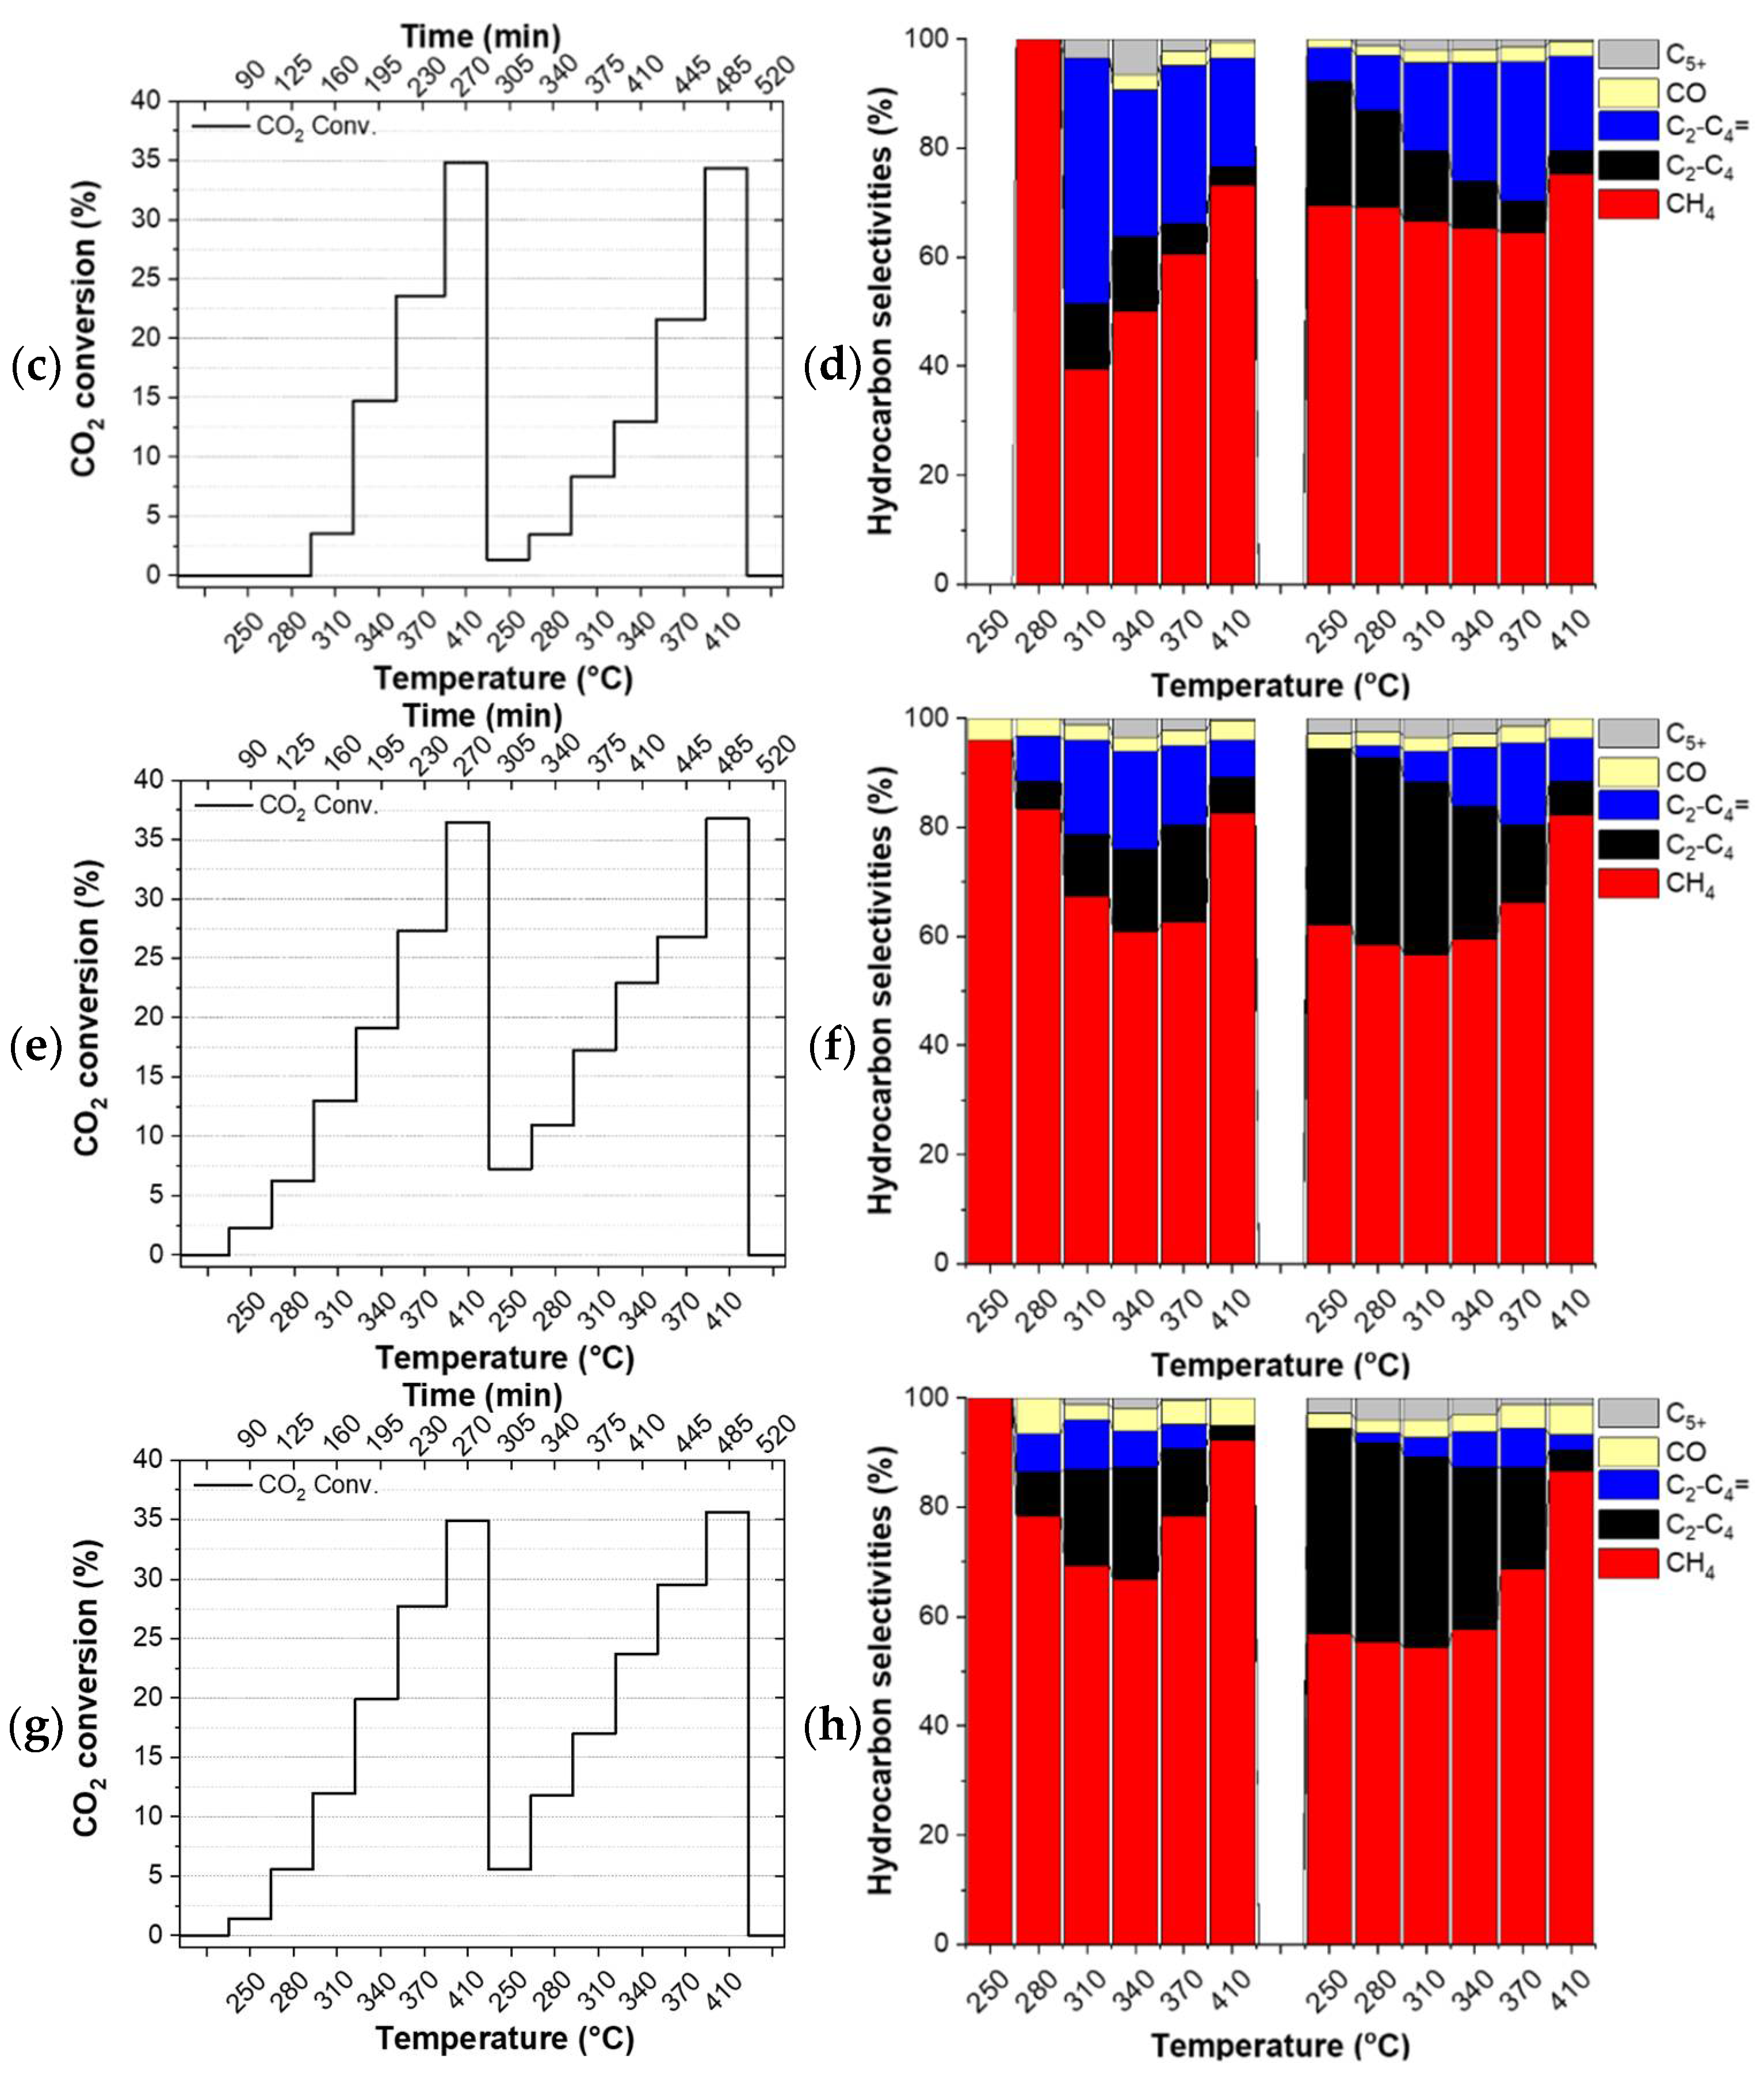
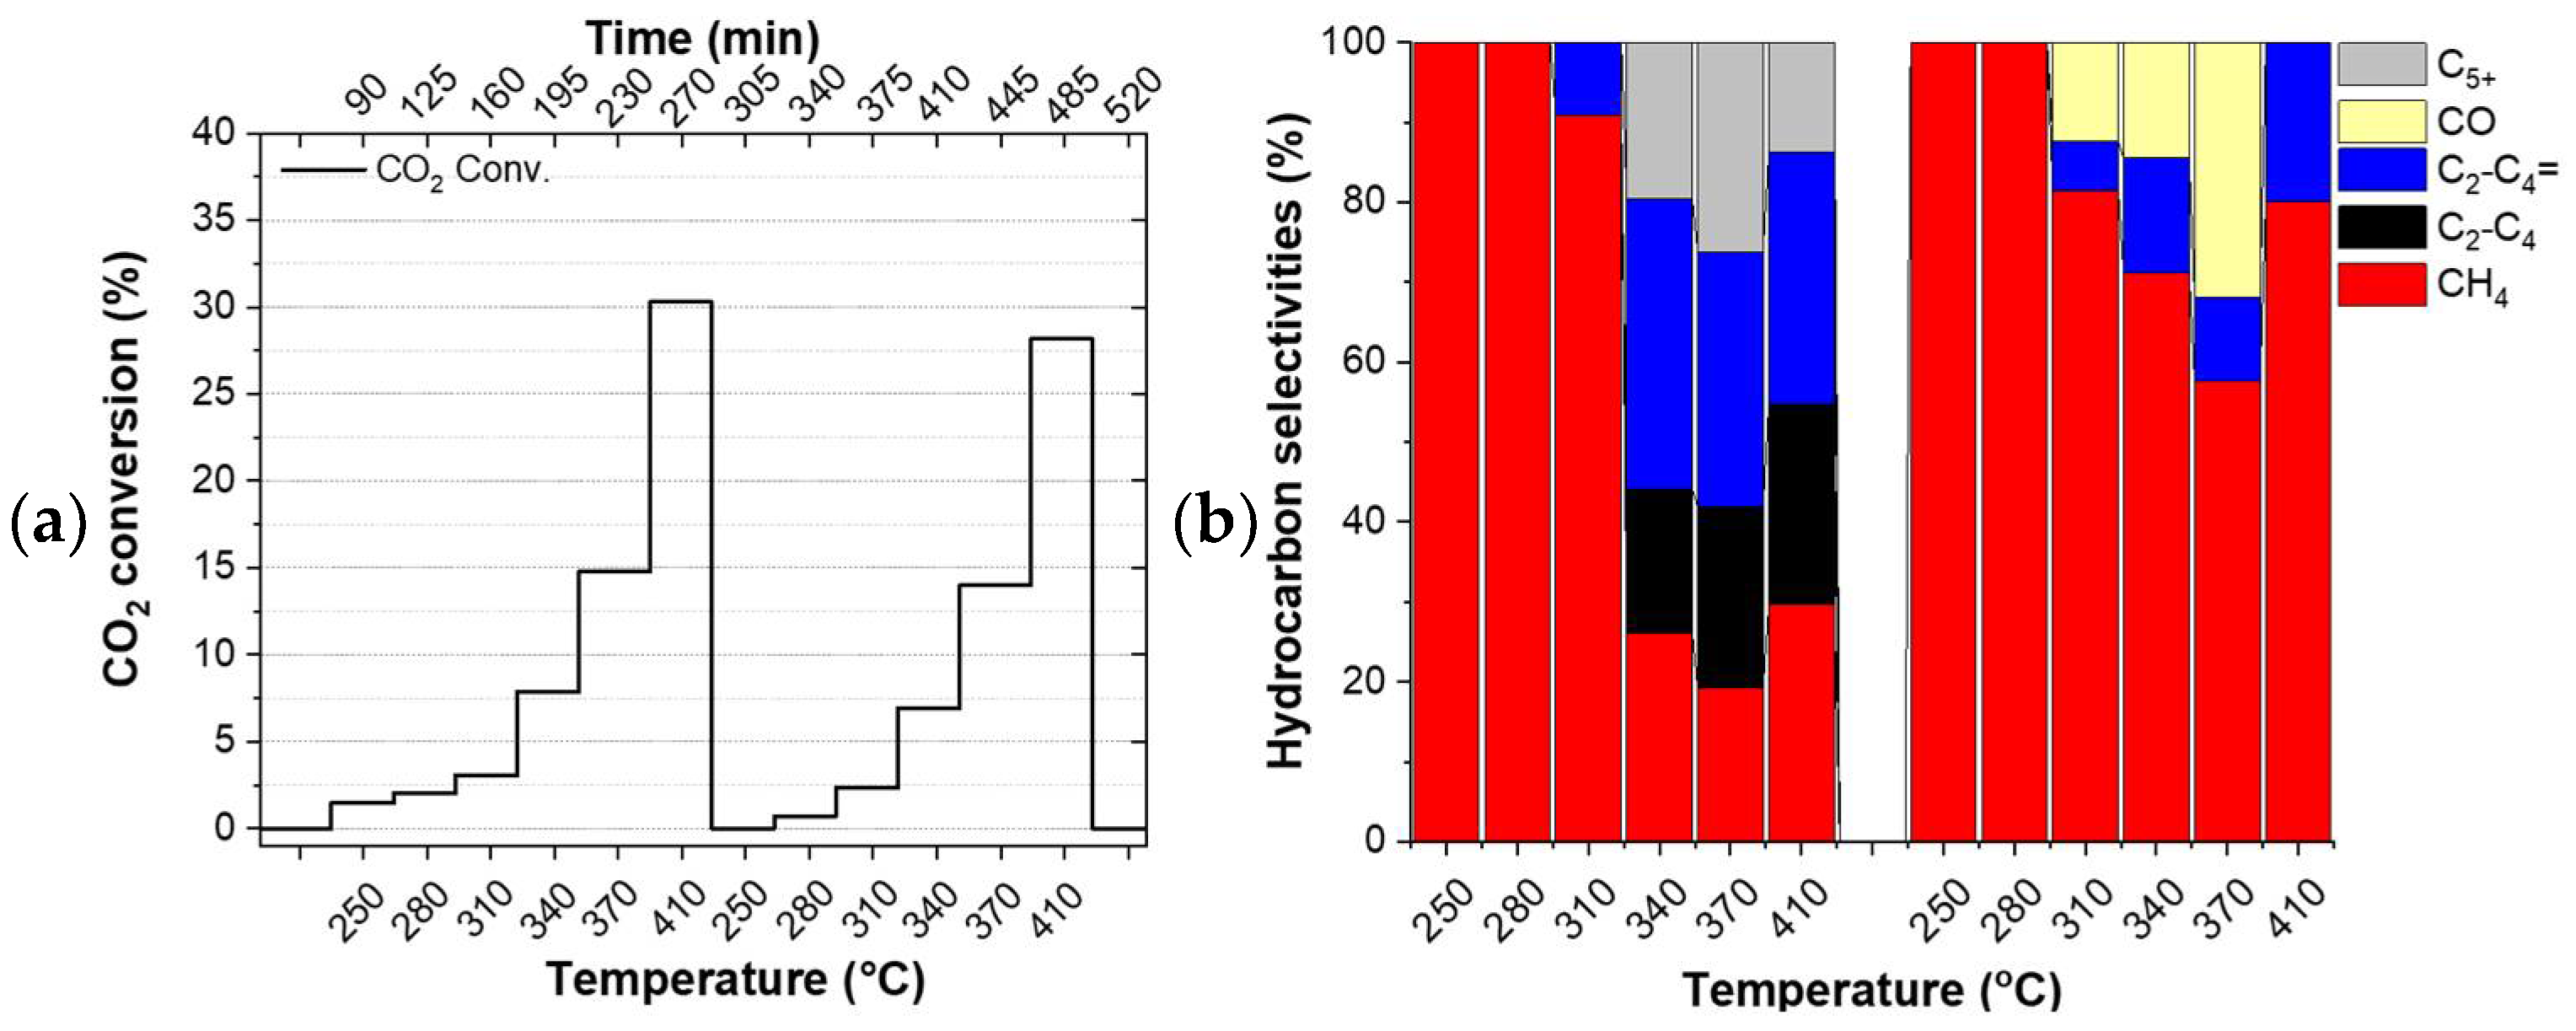
3.1. Catalyst Testing

The catalysts did not undergo any reduction pre-treatment before the tests. Thus, the first temperature ramp can be considered as a pre-treatment step of the catalyst directly under the reactants which have a reducing character due to the excess hydrogen in it. Figure 2 shows the evolution of the CO2 conversion (left column) and the product selectivities (right column) of the studied catalysts during the applied double temperature ramp. The drop in conversion between the individual ramps (Figure 2c) and the constantly evolving selectivity observed for FeOx (see Figure 2b and Table S3) indicate that this particular catalyst did not converge to its final state during the applied double temperature ramp. On the contrary, the identical CO2 conversion observed for the Cu/FeOx catalysts at the highest temperatures of the first and the second temperature ramp, along with the experimental accuracy comparable product selectivities, provide a hint about the completed annealing of 1%-Cu/FeOx, 3%-Cu/FeOx, and 5%-Cu/FeOx during the first temperature ramp.
Since the catalysts evolve during the first temperature ramp, their performance during the first temperature ramp is not discussed here. The comparison of CO2 conversion shows that the addition of copper boosts conversion from around 28% up to about 37%, with respect to the copper-free reference catalyst. While all three interrogated Cu/FeOx catalysts primarily produce methane along with a small amount of carbon monoxide, depending on the temperature and copper content, these catalysts produce up to about a total of 43% of C2-C5 olefins and paraffins. As reported in the literature, copper plays a dual role, activating hydrogen for the reaction with CO2 itself and also for the reduction of iron oxide via hydrogen spillover, increasing the overall activity of iron-based catalysts.
Using the 1%-Cu/FeOx catalyst (Figure 2c,d), a relatively steady fraction of CH4 is produced in the applied temperature range, with methane fraction amounting to around 75% at the highest temperature of 410 °C, and about 66% at lower temperatures. With an increasing temperature, this catalyst exhibits primarily a temperature-dependent switch from paraffins to olefins. In the case of the 3%-Cu/FeOx (Figure 2e,f) and 5%-Cu/FeOx (Figure 2g,h) catalysts, methane formation dominates at 410 °C with a methane selectivity of 82% and 86%, respectively. At lower temperatures in the presence of a small amount of C5+ (in the order of about ~2%) up to 37% and 39% C2-C4 olefins and paraffins are produced in the temperature region of 250–370 °C. The formation of the relative fractions of C2-C4 olefins and paraffins is dependent on the copper contents in Cu/FeOx catalysts. As the concentration of copper increases from 1% to 5%, the selectivity of paraffin hydrocarbons also increases, accompanied by the decrease in the olefins fraction. Significantly fewer olefins are produced on 3%-Cu/FeOx in comparison with 1%-Cu/FeOx, and an even smaller amount is produced on 5%-Cu/FeOx. In terms of selectivity, we hypothesized the central role of the morphology of the catalyst because the catalysts of comparable composition synthesized differently turned out to convert CO2 primarily into methanol or benzene [37], some others produce methanol and small hydrocarbons [56], while the currently presented catalysts solely produce hydrocarbons. The presence of Cu plays an important role in both enhancing CO2 conversion and the selectivity toward higher hydrocarbons. Cu not only acts as an RWGS catalyst but also reduces the iron oxides into metallic iron (Fe2O3 → Fe3O4 → FeO → Fe), which is converted into Fe5C2 due to the carbonation process [18] to the active phase that produces higher hydrocarbons [57]. As the concentration of Cu increases, the fraction of Fe5C2 also increases, as confirmed by the XRD of the used catalysts (Table 2).

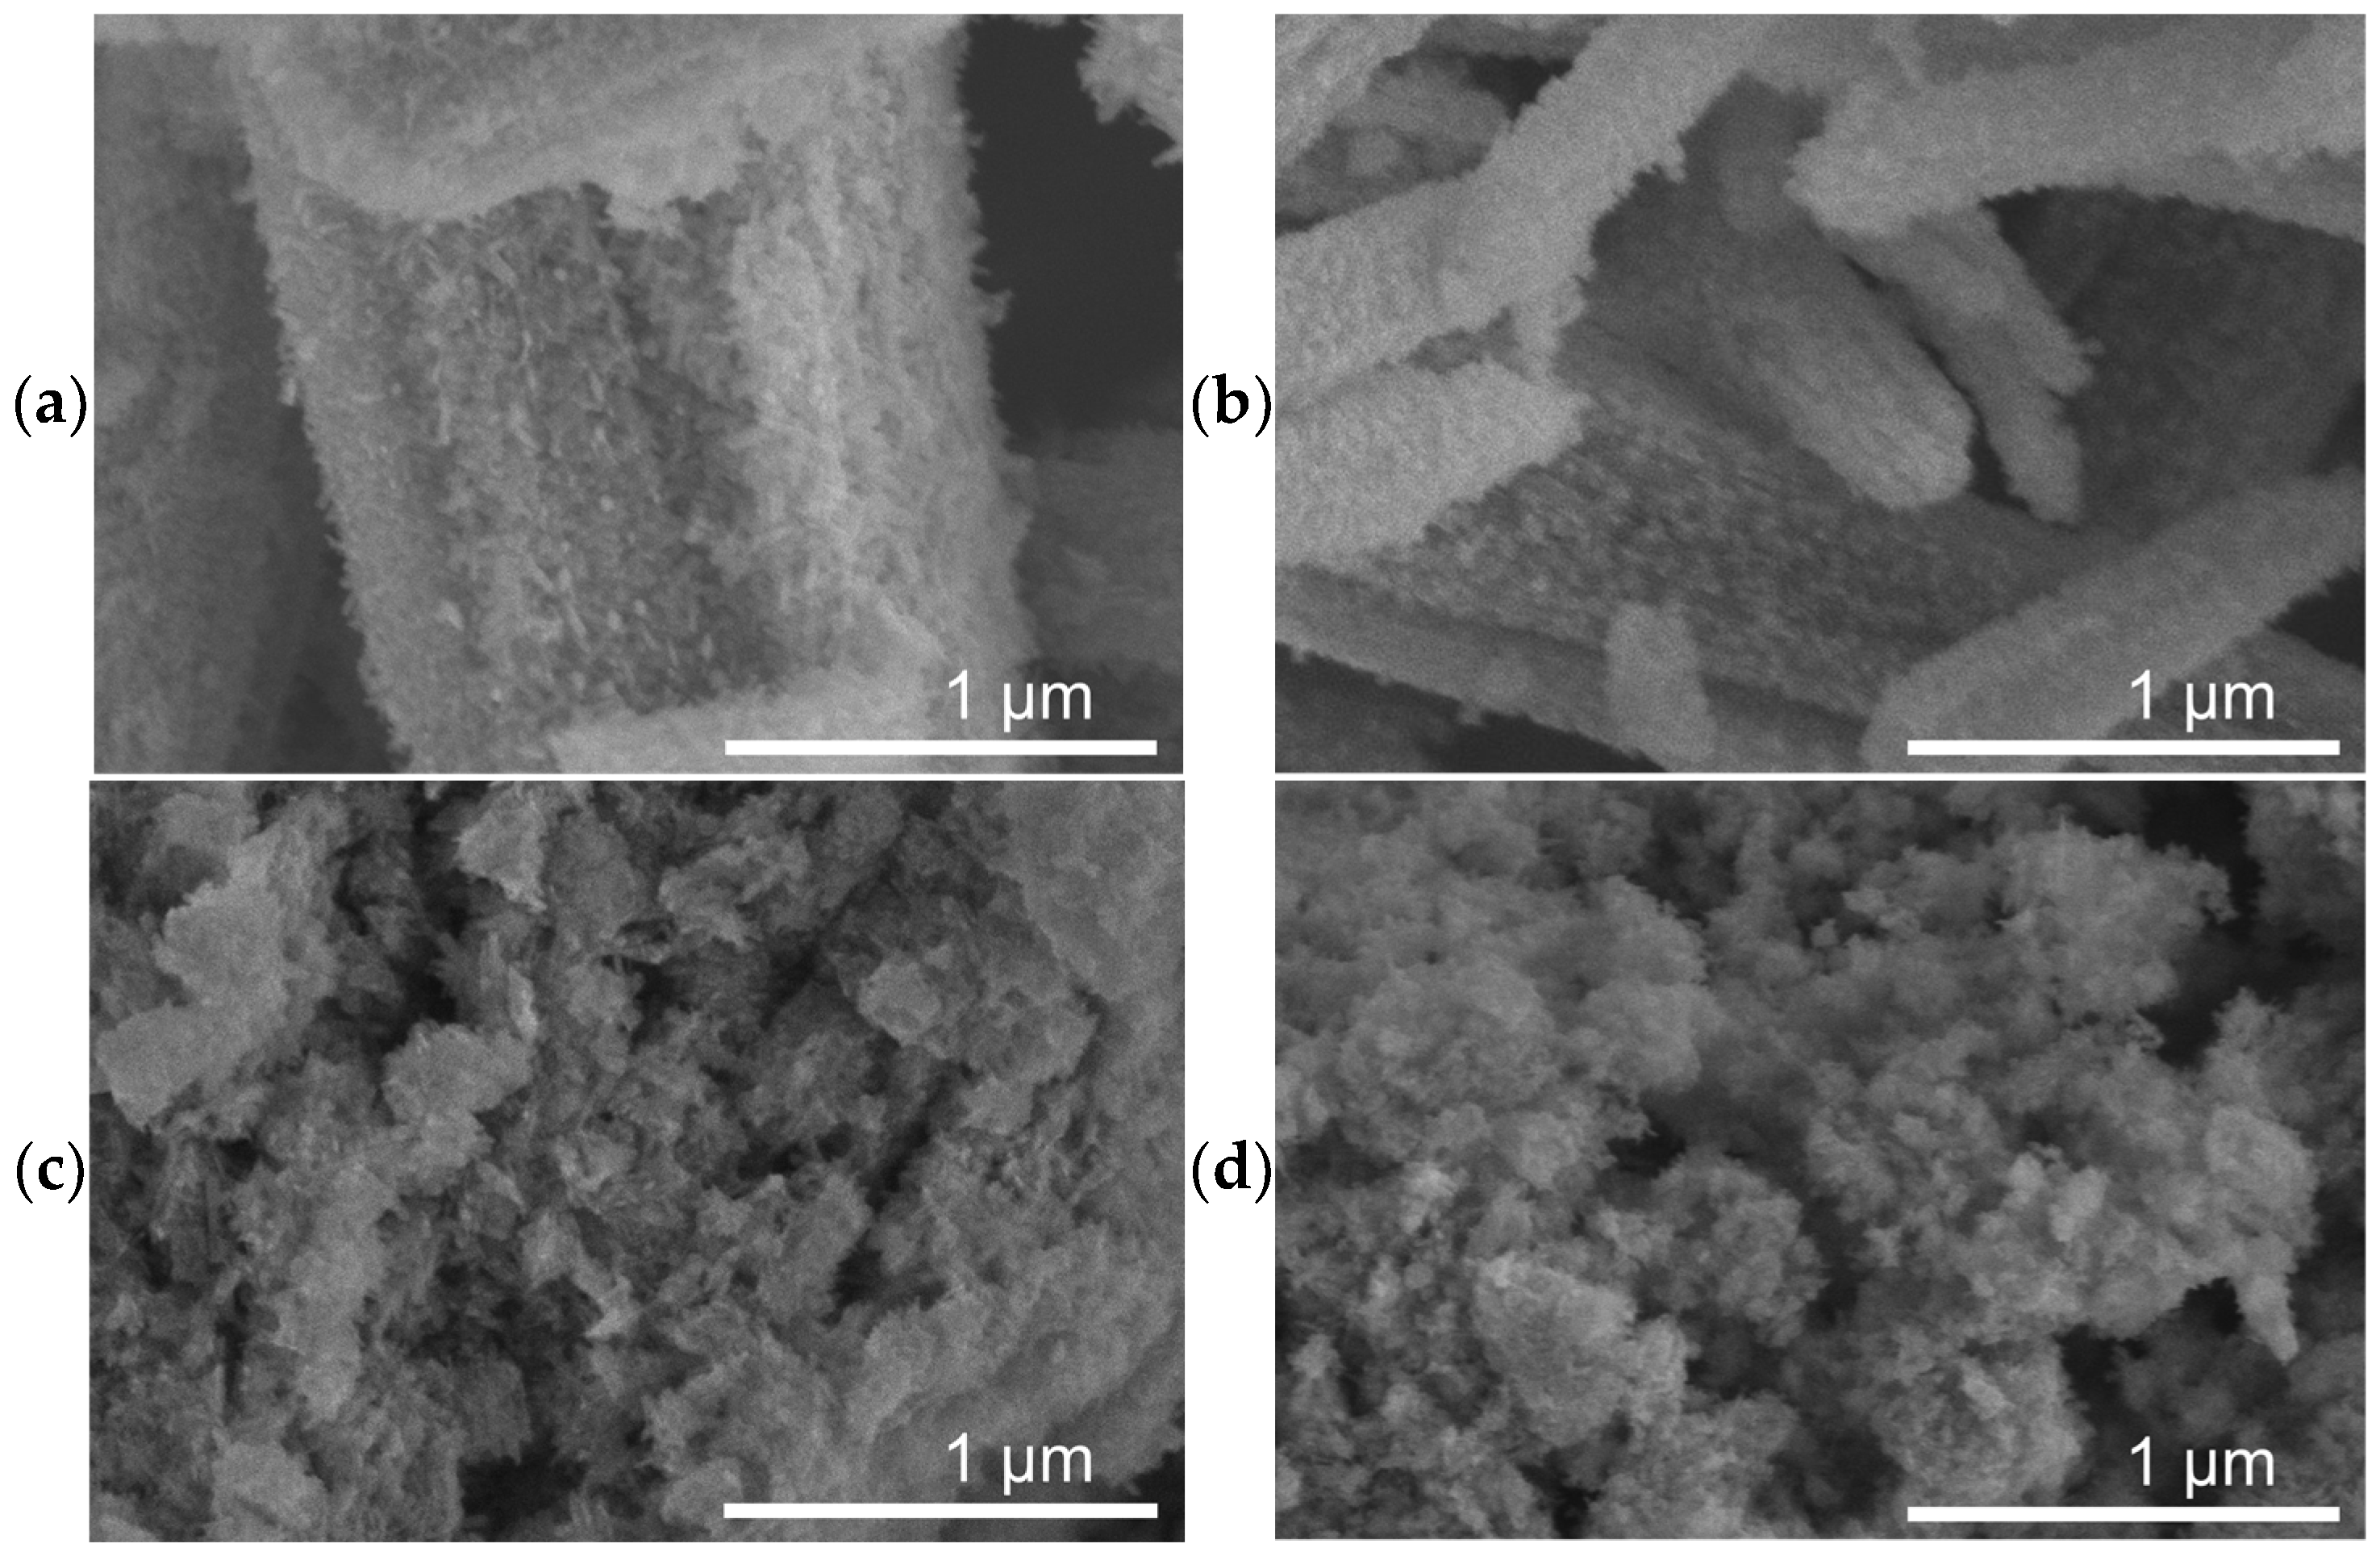
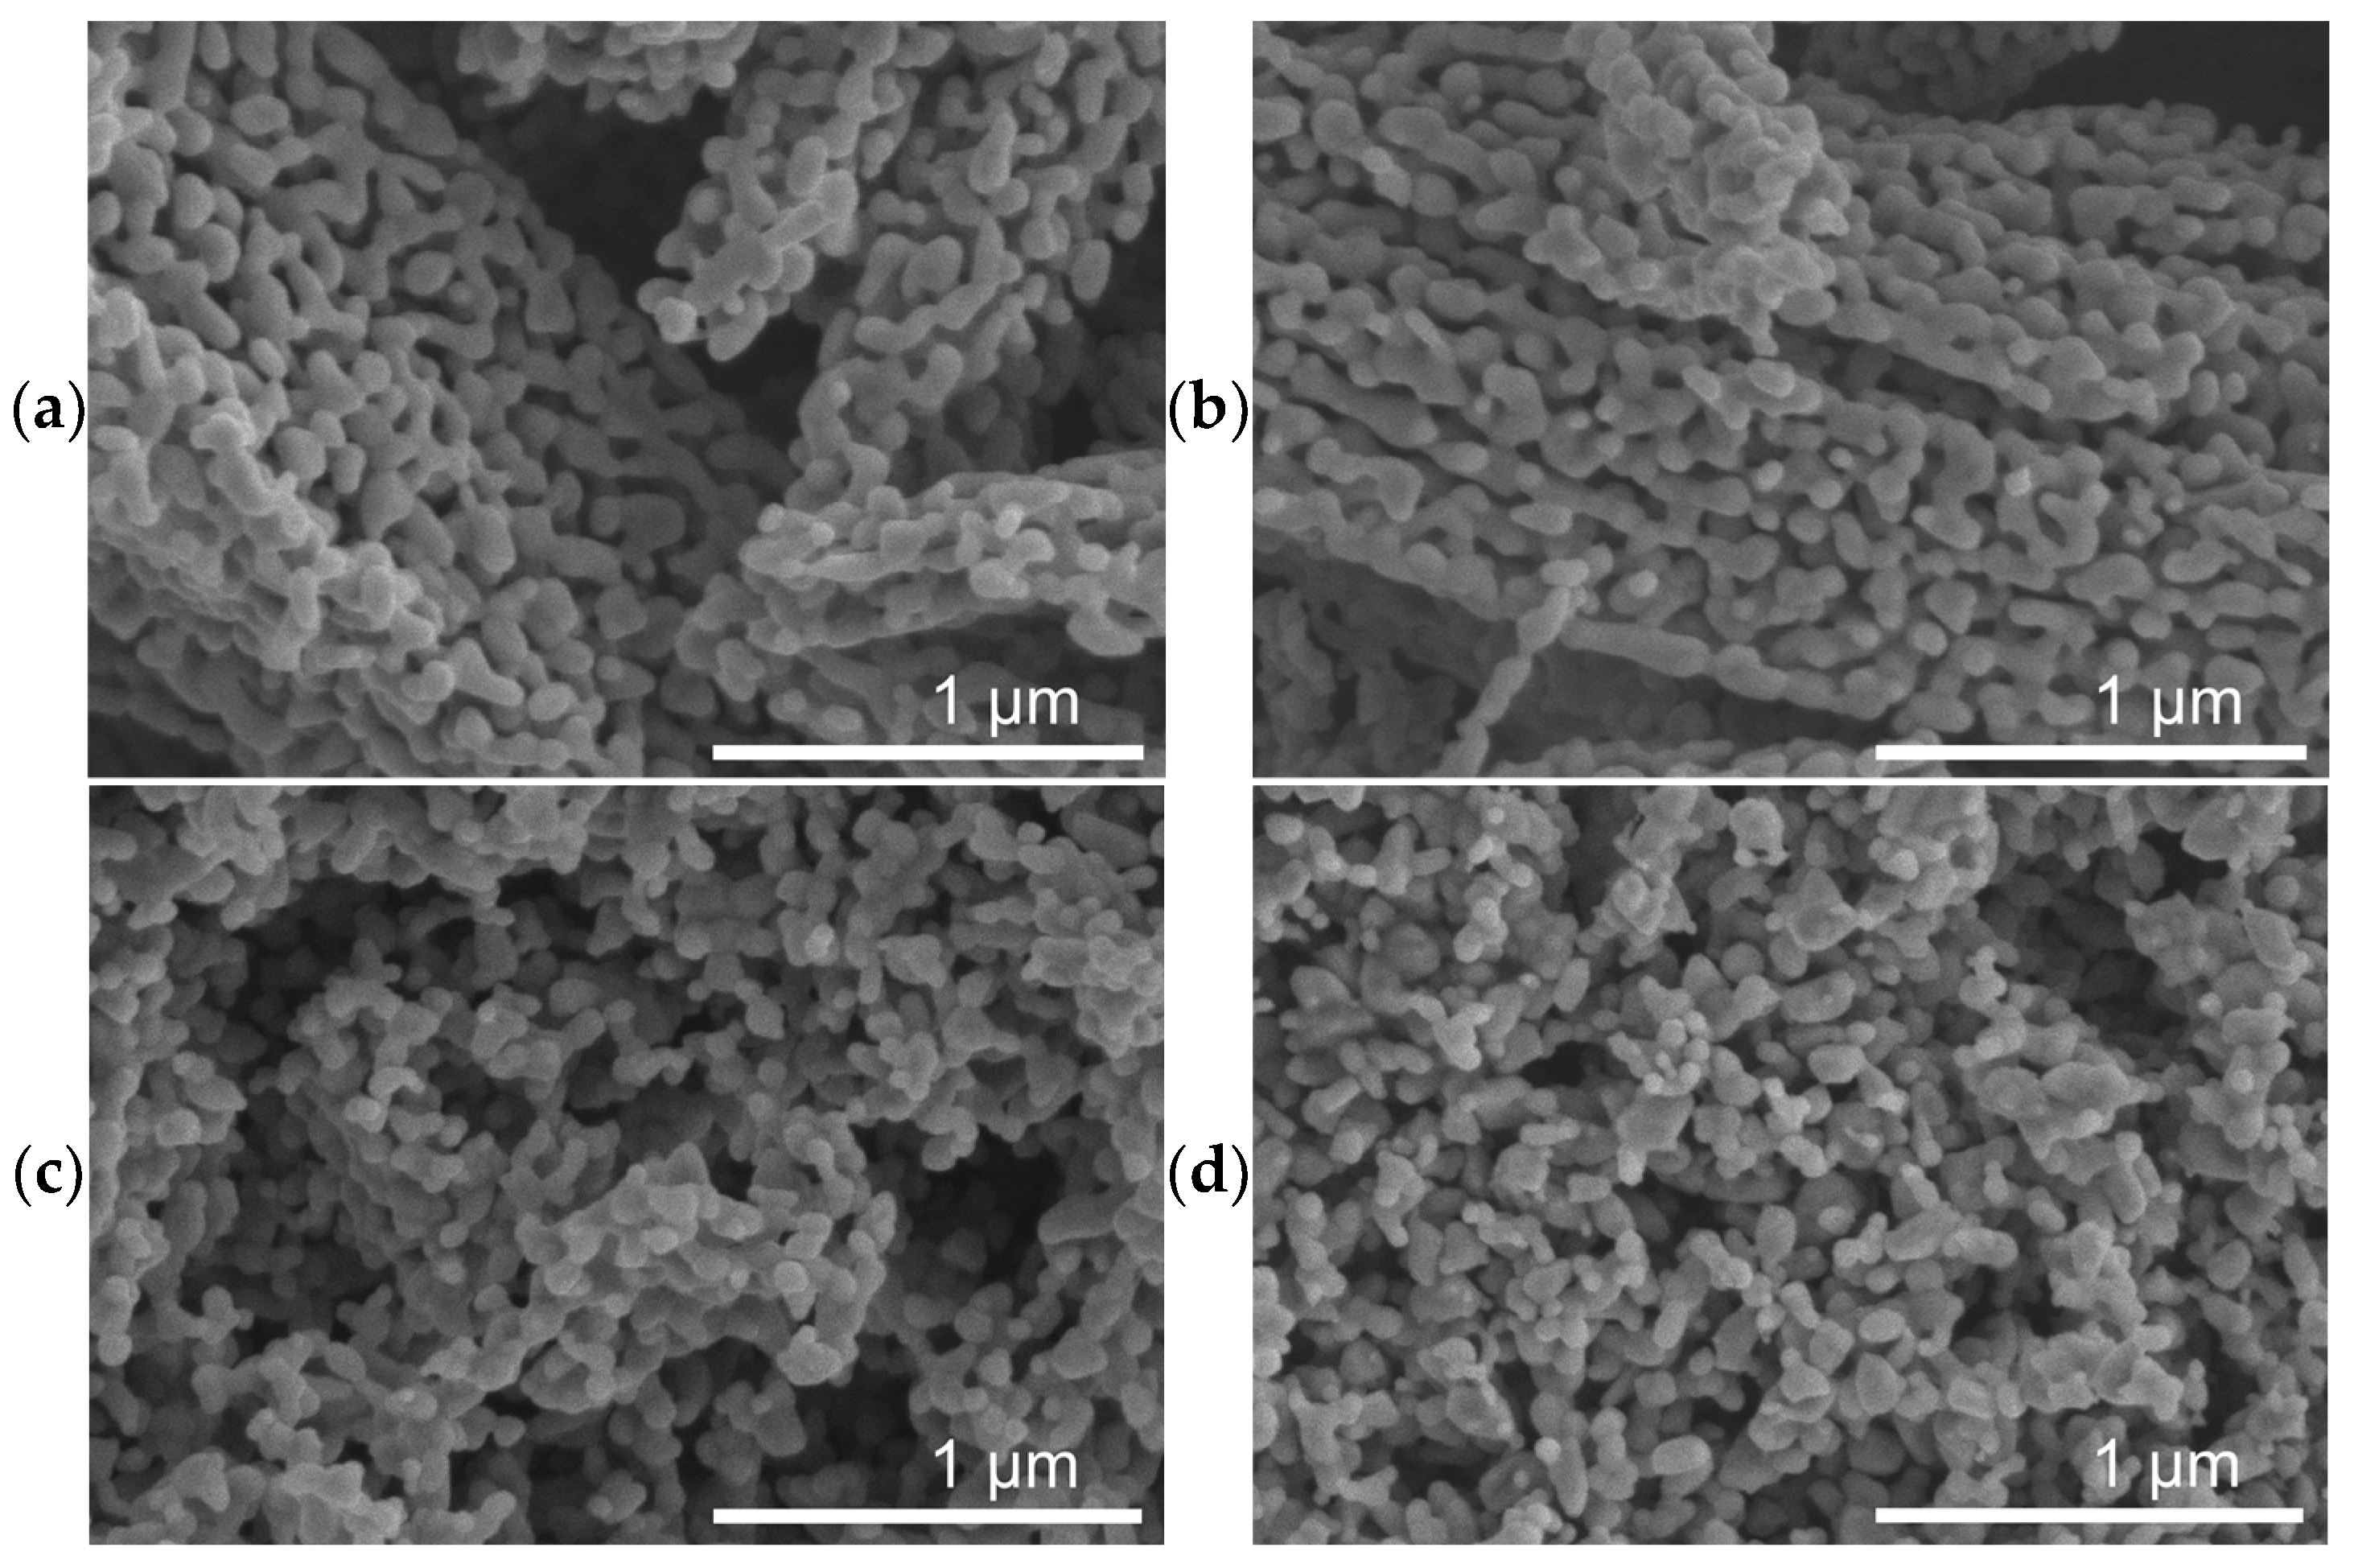
3.2. Characterization of the Catalysts after Catalytic Tests

Spent catalysts were characterized by scanning electron microscopy (SEM), transmission electron microscopy (TEM), high-angle annular dark-field scanning transmission electron microscopy (STEM/HAADF), energy-dispersive X-ray spectroscopy (EDX), X-ray diffraction (XRD), sorption of N2 with the BET model and X-ray photoelectron spectroscopy (XPS).
SEM micrographs of spent catalysts (Figure 3) show a massive restructuring of all the catalysts, featuring intertwined polymorphs which indicate the presence of Fe5C2 or Fe3C [37,58]. Figure 4 shows TEM images of the spent catalysts, which for FeOx, reveal particles with a mean diameter of 68 ± 26 nm, and for the Cu/FeOx catalysts, particle sizes increase with copper content: 1%-Cu/FeOx—61 ± 19 nm, 3%-Cu/FeOx—75 ± 25 nm, and 5%-Cu/FeOx—81 ± 35 nm to 150 nm. Additional TEM images can be found in Figure S13.
SEM images with EDX analysis are depicted in Figure S14. STEM/HAADF imagining of spent catalysts are depicted in Figures S15a, S16a and S17a, and Figure 5a for FeOx, 1%-Cu/FeOx, 3%-Cu/FeOx, and 5%-Cu/FeOx, respectively. These figures show the presence of nanoscale Fe species of about 150 nm in diameter with Cu agglomerates of 10 nm in diameter. From the EDX analysis, Fe and O appear to be dominant elements (Figures S15b, S16b and S17b and Figure 5b), forming the core of the spent FeOx particles. There is a recognizable layer of carbon (13 nm) seen on the surface of the particles, indicating the deposition of carbon during the reaction. This layer is most clearly visible in the spent 5%-Cu/FeOx (Figure 5c), and the least in the reference FeOx catalysts (Figure S15). In addition, as seen in Figures S16c and S17c and Figure 5c, copper became highly dispersed in all copper-containing spent catalysts.
The fractions of different iron oxides and carbides present in the used samples obtained by XRD (Figure S18) are summarized in Table 2. Spent FeOx consists of 100% Fe3O4, spent 1%-Cu/FeOx has 95% Fe3O4 and 5% Fe5C3; the 3%-Cu/FeOx catalyst contains 71.3% Fe3O4 and 28.7% Fe5C3; and 5%-Cu/FeOx has 59.8% Fe3O4, 37.2% Fe5C3 and 3% Fe3C. The XPS of the spent catalysts reveals the presence of metallic Fe along with Fe2+ and Fe3+. The components at the binding energy of around 932.6 eV are related to Cu(0).
The XPS of the spent catalysts similarly shows the presence of metallic Fe along with Fe2+ and Fe3+. The components at the binding energy of around 932.6 eV are related to Cu(0) (see Figure S8). Table S2 summarizes the chemical constituents of the spent catalysts.
With the increasing copper load, an increase can be seen in the iron carbides content, which is consistent with the role of copper in reducing iron oxide. We note that copper was not detected by XRD on the spent catalysts either, which indicates that copper is present in either an amorphous form or the size of the majority of the copper particles is below the detection limit of XRD, as indicated by STEM-HAADF (Figure 5).
XRD further confirmed the formation of iron carbides in the copper-containing catalysts. From the XRD data, we obtained the mean X-ray coherence length (MLC), which is summarized in Table S4. Spent FeOx consists of a coherent domain length of 63 nm for the Fe3O4 phase. Whereas, spent 1%-Cu/FeOx has 63 nm for Fe3O4 and 29 nm for Fe5C2, and spent 3%-Cu/FeOx has 47 nm for Fe3O4 and 40 nm for Fe5C2. Spent 5%-Cu/FeOx has 36 nm for Fe3O4, 35 nm for Fe5C2, and 23 nm for Fe3C.
Adsorption–desorption isotherms of spent catalysts (Figure S19) were obtained at 77 K up to the saturation pressure of nitrogen to determine the surface area of the spent catalysts. As opposed to the fresh catalyst, the adsorption/desorption curves have a course that suggests a smaller surface area, perhaps due to the inaccessibility of pores due to the carbon deposition. The specific surface area of the catalysts was calculated to be 18.6 m2/g for FeOx, 18.6 m2/g for 1%-Cu/FeOx, 18.0 m2/g for 3%-Cu/FeOx, and 17.4 m2/g for 5%-Cu/FeOx. Thus, this is just a mere fraction of the as-made catalyst prior to the catalytic test, with the specific surface areas of the spent catalysts being about 10 times smaller (see Table 2) than that of the fresh catalysts (see Table 1).
For the convenience of the reader, Figure S20 summarizes the CO2 conversion and product selectivity during the second temperature ramp for the investigated catalysts, compared to the individual reaction temperatures. In order to test the stability of the 5%-Cu/FeOx catalysts, four more temperature ramps were performed (Figure S21). After the second temperature ramp, the CO2 conversion decreased with each ramp, accompanied by an increase in CO generation and a decrease in the fraction of CH4 and higher hydrocarbons. After the fourth ramp, the CO2 conversion decreased from the initial 35% to 19%. This change could be caused by the accumulation of carbon on the surface of the catalysts, as confirmed by STEM-HAADF and elemental mapping (Figure 5), where a layer of 13 nm thick of carbon is seen on the surface of the particles (Figure 5c).
A review of the related literature, including this study, is summarized for the convenience of the reader in Table S5 and Figure S22.

4. Conclusions

Cu/FeOx catalysts with a Cu content of 0%, 1%, 3%, and 5% were found to be highly active in CO2 hydrogenation with the conversion reaching 36.8%. The observed selectivity to C1 versus C2-C4, C2-C4 =, and C5+ hydrocarbons is dependent on the catalyst’s composition, morphology, and temperature. The observed range of products is diametrically different from those observed for catalysts with similar compositions but synthesized using other precursors. Depending on their copper content, the as-made particles possess rather distinct morphologies, most likely attributable to the changing ratio of the hydrazine and copper sulfate used during the synthesis of the individual samples, which affects the extent of the etching of the iron-oxide particles, as well as their crystallinity, chemical composition, and morphology at various scales. The findings presented in this paper indicate potential new ways of tuning the morphology and composition of iron-oxide-based particles, for example, by balancing the relative ratio of hydrazine and SO42− ions or by using different precursors in the synthesis, ultimately yielding catalyst compositions and morphologies with variable catalytic performance. We note that, while some alkali (K, Na) doped Fe-based catalysts have a higher CO2 conversion, these require harsh conditions for pre-treatment under hydrogen or a CO atmosphere at temperatures exceeding 350 °C for extended times up to 12 h. Our catalysts have very low selectivity towards carbon monoxide as compared to other reported catalysts.

Supplementary Materials

The following supporting information can be downloaded at: https://www.mdpi.com/article/10.3390/catal12050516/s1. Figure S1: Double temperature ramp applied during catalytic testing; Figure S2: SEM/EDX of fresh catalysts; Figure S3: STEM/HAADF of fresh FeOx; Figure S4: STEM/HAADF of fresh 1%-Cu/FeOx; Figure S5: STEM/HAADF of fresh 3%-Cu/FeOx; Figure S6: STEM-HAADF of fresh 5%-Cu/FeOx; Figure S7: XRD patterns of fresh catalysts; Table S1: The mean X-ray coherence length of fresh catalysts; Figure S8: XPS of fresh and spent catalysts; Figure S9: XPS of FeOx; Figure S10: Wide scan XPS spectra of fresh and spent catalysts; Table S2: Chemical composition of Fe and Cu in catalysts; Figure S11: Adsorption and desorption isotherms of fresh catalysts; Figure S12: UV-vis spectra of fresh catalysts; Table S3: Conversion and selectivities of FeOx and Cu/FeOx catalysts; Figure S13: TEM images of fresh and spent catalysts; Figure S14: SEM/EDX of spent catalysts; Figure S15: STEM/HAADF images of spent FeOx; Figure S16: STEM/HAADF images of spent 1%-Cu/FeOx; Figure S17: STEM/HAADF images of spent 3%-Cu/FeOx; Figure S18: XRD patterns of spent catalysts; Table S4: The mean X-ray coherence length of spent catalysts; Figure S19: Adsorption and desorption isotherms of spent catalysts; Figure S20: Comparison of the performance of the catalysts; Figure S21: CO2 conversion and selectivity over the course of 6 consecutive temperature ramps; Table S5: Literature comparison of CO2 hydrogenation by different iron-based catalysts; Figure S22: Literature comparison of CH4/CO selectivity against CO2 conversion.

Author Contributions

K.S. synthesized the catalysts and performed their tests, analyzed data, and drafted the manuscript; M.I.Q. contributed to the catalyst testing and discussed the results; N.Ž. participated in the catalyst testing, discussed the catalytic results, and contributed to the writing of the manuscript; J.E.O. measured and interpreted the UV-vis spectra; P.S. collected and evaluated the XPS spectra; L.K. contributed to the characterization of the catalysts, the interpretation of the results and correcting the manuscript; Š.V. planned and correlated the effort, discussed and interpreted the results, and wrote and finalized the manuscript. All authors have read and agreed to the published version of the manuscript.

Funding

K.S., M.I.Q., N.Z. and S.V. gratefully acknowledge the support from the European Union’s Horizon 2020 research and innovation program under grant agreement No 810310, which corresponds to the J. Heyrovsky Chair project (“ERA Chair at J. Heyrovský Institute of Physical Chemistry AS CR—The institutional approach towards ERA”). The funders had no role in the preparation of the article. The work of L.K was supported by the ERDF project “Development of pre-applied research in nanotechnology and biotechnology” (No. CZ.02.1.01/0.0/0.0/17_048/0007323) and an internal grant of Palacky University IGA_PrF_2021_032.

Institutional Review Board Statement

Not applicable.

Informed Consent Statement

Not applicable.

Data Availability Statement

The data presented in this study are available on reasonable request from the corresponding authors.

Conflicts of Interest

The authors declare no conflict of interest.

References

  1. Garba, M.D.; Usman, M.; Khan, S.; Shehzad, F.; Galadima, A.; Ehsan, M.F.; Ghanem, A.S.; Humayun, M. CO2 towards fuels: A review of catalytic conversion of carbon dioxide to hydrocarbons. J. Environ. Chem. Eng. 2021, 9, 104756. [Google Scholar] [CrossRef]
  2. Humayun, M.; Ullah, H.; Usman, M.; Habibi-Yangjeh, A.; Tahir, A.A.; Wang, C.; Luo, W. Perovskite-type lanthanum ferrite based photocatalysts: Preparation, properties, and applications. J. Energy Chem. 2022, 66, 314–338. [Google Scholar] [CrossRef]
  3. Anderson, T.R.; Hawkins, E.; Jones, P.D. CO2, the greenhouse effect and global warming: From the pioneering work of Arrhenius and Callendar to today’s Earth System Models. Endeavour 2016, 40, 178–187. [Google Scholar] [CrossRef] [PubMed]
  4. Mac Dowell, N.; Fennell, P.S.; Shah, N.; Maitland, G.C. The role of CO2 capture and utilization in mitigating climate change. Nat. Clim. Chang. 2017, 7, 243–249. [Google Scholar] [CrossRef]
  5. Centi, G.; Perathoner, S. Opportunities and prospects in the chemical recycling of carbon dioxide to fuels. Catal. Today 2009, 148, 191–205. [Google Scholar] [CrossRef]
  6. Dupont , J. Across the Board: Jairton Dupont. ChemSusChem 2015, 8, 586–587. [Google Scholar] [CrossRef] [PubMed]
  7. Peters, M.; Köhler, B.; Kuckshinrichs, W.; Leitner, W.; Markewitz, P.; Müller, T.E. Chemical Technologies for Exploiting and Recycling Carbon Dioxide into the Value Chain. ChemSusChem 2011, 4, 1216–1240. [Google Scholar] [CrossRef]
  8. North, M.; Pasquale, R.; Young, C. Synthesis of cyclic carbonates from epoxides and CO2. Green Chem. 2010, 12, 1514–1539. [Google Scholar] [CrossRef]
  9. De, S.; Dokania, A.; Ramirez, A.; Gascon, J. Advances in the Design of Heterogeneous Catalysts and Thermocatalytic Processes for CO2 Utilization. ACS Catal. 2020, 10, 14147–14185. [Google Scholar] [CrossRef]
  10. Ra, E.C.; Kim, K.Y.; Kim, E.H.; Lee, H.; An, K.; Lee, J.S. Recycling Carbon Dioxide through Catalytic Hydrogenation: Recent Key Developments and Perspectives. ACS Catal. 2020, 10, 11318–11345. [Google Scholar] [CrossRef]
  11. Valenti, G.; Melchionna, M.; Montini, T.; Boni, A.; Nasi, L.; Fonda, E.; Criado, A.; Zitolo, A.; Voci, S.; Bertoni, G.; et al. Water-Mediated ElectroHydrogenation of CO2 at Near-Equilibrium Potential by Carbon Nanotubes/Cerium Dioxide Nanohybrids. ACS Appl. Energy Mater. 2020, 3, 8509–8518. [Google Scholar] [CrossRef]
  12. Roy, S.; Cherevotan, A.; Peter, S.C. Thermochemical CO2 Hydrogenation to Single Carbon Products: Scientific and Technological Challenges. ACS Energy Lett. 2018, 3, 1938–1966. [Google Scholar] [CrossRef]
  13. Zhang, Y.; Xia, B.; Ran, J.; Davey, K.; Qiao, S.Z. Atomic-Level Reactive Sites for Semiconductor-Based Photocatalytic CO2 Reduction. Adv. Energy Mater. 2020, 10, 1903879. [Google Scholar] [CrossRef]
  14. Humayun, M.; Ullah, H.; Shu, L.; Ao, X.; Tahir, A.A.; Wang, C.; Luo, W. Plasmon Assisted Highly Efficient Visible Light Catalytic CO2 Reduction over the Noble Metal Decorated Sr-Incorporated g-C3N4. Nanomicro. Lett. 2021, 13, 209. [Google Scholar] [CrossRef]
  15. Gao, G.; Jiao, Y.; Waclawik, E.R.; Du, A. Single Atom (Pd/Pt) Supported on Graphitic Carbon Nitride as an Efficient Photocatalyst for Visible-Light Reduction of Carbon Dioxide. J. Am. Chem Soc. 2016, 138, 6292–6297. [Google Scholar] [CrossRef] [PubMed]
  16. Choi, Y.H.; Jang, Y.J.; Park, H.; Kim, W.Y.; Lee, Y.H.; Choi, S.H.; Lee, J.S. Carbon dioxide Fischer-Tropsch synthesis: A new path to carbon-neutral fuels. Appl. Catal. B 2017, 202, 605–610. [Google Scholar] [CrossRef]
  17. Riedel, T.; Shulz, H.; Schaub, G.; Jun, K.-W. Fischer–Tropsch on iron with H2/CO and H2/CO2 as synthesis gases: The episodes of formation of the Fischer–Tropsch regime and construction of the catalyst. Top. Catal. 2003, 26, 41–54. [Google Scholar] [CrossRef]
  18. Lopez Luna, M.; Timoshenko, J.; Kordus, D.; Rettenmaier, C.; Chee, S.W.; Hoffman, A.S.; Bare, S.R.; Shaikhutdinov, S.; Roldan Cuenya, B. Role of the Oxide Support on the Structural and Chemical Evolution of Fe Catalysts during the Hydrogenation of CO2. ACS Catal. 2021, 11, 6175–6185. [Google Scholar] [CrossRef]
  19. Qadir, M.I.; Weilhard, A.; Fernandes, J.A.; de Pedro, I.; Vieira, B.J.C.; Waerenborgh, J.C.; Dupont, J. Selective Carbon Dioxide Hydrogenation Driven by Ferromagnetic RuFe Nanoparticles in Ionic Liquids. ACS Catal. 2018, 8, 1621–1627. [Google Scholar] [CrossRef]
  20. Hwang, J.S.; Jun, K.-W.; Lee, K.-W. Deactivation and regeneration of Fe-K/alumina catalyst in CO2 hydrogenation. Appl. Catal A-Gen. 2001, 208, 217–222. [Google Scholar] [CrossRef]
  21. Hong, J.-S.; Hwang, J.S.; Jun, K.-W.; Sur, J.C.; Lee, K.-W. Deactivation study on a coprecipitated Fe-Cu-K-Al catalyst in CO2 hydrogenation. Appl. Catal. A-Gen. 2001, 218, 53–59. [Google Scholar] [CrossRef]
  22. Pérez-Alonso, F.J.; Ojeda, M.; Herranz, T.; Rojas, S.; González-Carballo, J.M.; Terreros, P.; Fierro, J.L.G. Carbon dioxide hydrogenation over Fe–Ce catalysts. Catal. Commun. 2008, 9, 1945–1948. [Google Scholar] [CrossRef]
  23. Rodemerck, U.; Holeňa, M.; Wagner, E.; Smejkal, Q.; Barkschat, A.; Baerns, M. Catalyst Development for CO2 Hydrogenation to Fuels. ChemCatChem 2013, 5, 1948–1955. [Google Scholar] [CrossRef]
  24. Aitbekova, A.; Goodman, E.D.; Wu, L.; Boubnov, A.; Hoffman, A.S.; Genc, A.; Cheng, H.; Casalena, L.; Bare, S.R.; Cargnello, M. Engineering of Ruthenium–Iron Oxide Colloidal Heterostructures: Improved Yields in CO2 Hydrogenation to Hydrocarbons. Angew. Chem. Int. Ed. 2019, 58, 17451–17457. [Google Scholar] [CrossRef] [PubMed]
  25. Al-Dossary, M.; Ismail, A.A.; Fierro, J.L.G.; Bouzid, H.; Al-Sayari, S.A. Effect of Mn loading onto MnFeO nanocomposites for the CO2 hydrogenation reaction. Appl. Catal. B 2015, 165, 651–660. [Google Scholar] [CrossRef]
  26. Liang, B.; Duan, H.; Sun, T.; Ma, J.; Liu, X.; Xu, J.; Su, X.; Huang, Y.; Zhang, T. Effect of Na Promoter on Fe-Based Catalyst for CO2 Hydrogenation to Alkenes. ACS Sustain. Chem. Eng. 2019, 7, 925–932. [Google Scholar] [CrossRef]
  27. Wei, J.; Yao, R.; Ge, Q.; Wen, Z.; Ji, X.; Fang, C.; Zhang, J.; Xu, H.; Sun, J. Catalytic Hydrogenation of CO2 to Isoparaffins over Fe-Based Multifunctional Catalysts. ACS Catal. 2018, 8, 9958–9967. [Google Scholar] [CrossRef]
  28. Choi, Y.H.; Ra, E.C.; Kim, E.H.; Kim, K.Y.; Jang, Y.J.; Kang, K.-N.; Choi, S.H.; Jang, J.-H.; Lee, J.S. Sodium-Containing Spinel Zinc Ferrite as a Catalyst Precursor for the Selective Synthesis of Liquid Hydrocarbon Fuels. ChemSusChem 2017, 10, 4764–4770. [Google Scholar] [CrossRef]
  29. Kim, K.Y.; Lee, H.; Noh, W.Y.; Shin, J.; Han, S.J.; Kim, S.K.; An, K.; Lee, J.S. Cobalt Ferrite Nanoparticles to Form a Catalytic Co–Fe Alloy Carbide Phase for Selective CO2 Hydrogenation to Light Olefins. ACS Catal. 2020, 10, 8660–8671. [Google Scholar] [CrossRef]
  30. Gnanamani, M.K.; Jacobs, G.; Hamdeh, H.H.; Shafer, W.D.; Liu, F.; Hopps, S.D.; Thomas, G.A.; Davis, B.H. Hydrogenation of Carbon Dioxide over Co–Fe Bimetallic Catalysts. ACS Catal. 2016, 6, 913–927. [Google Scholar] [CrossRef]
  31. Ronda-Lloret, M.; Rothenberg, G.; Shiju, N.R. A Critical Look at Direct Catalytic Hydrogenation of Carbon Dioxide to Olefins. ChemSusChem 2019, 12, 3896–3914. [Google Scholar] [CrossRef] [PubMed]
  32. Bradley, M.J.; Ananth, R.; Willauer, H.D.; Baldwin, J.W.; Hardy, D.R.; Williams, F.W. The Effect of Copper Addition on the Activity and Stability of Iron-Based CO2 Hydrogenation Catalysts. Molecules 2017, 22, 1579. [Google Scholar] [CrossRef] [PubMed]
  33. Wang, S.-G.; Liao, X.-Y.; Cao, D.-B.; Huo, C.-F.; Li, Y.-W.; Wang, J.; Jiao, H. Factors Controlling the Interaction of CO2 with Transition Metal Surfaces. J. Phys. Chem. C 2007, 111, 16934–16940. [Google Scholar] [CrossRef]
  34. Wang, W.; Jiang, X.; Wang, X.; Song, C. Fe–Cu Bimetallic Catalysts for Selective CO2 Hydrogenation to Olefin-Rich C2+ Hydrocarbons. Ind. Eng. Chem. Res. 2018, 57, 4535–4542. [Google Scholar] [CrossRef]
  35. Jurković, D.L.; Pohar, A.; Dasireddy, V.D.B.C.; Likozar, B. Effect of Copper-based Catalyst Support on Reverse Water-Gas Shift Reaction (RWGS) Activity for CO2 Reduction. Chem. Eng. Technol. 2017, 40, 973–980. [Google Scholar] [CrossRef]
  36. Previtali, D.; Longhi, M.; Galli, F.; Di Michele, A.; Manenti, F.; Signoretto, M.; Menegazzo, F.; Pirola, C. Low pressure conversion of CO2 to methanol over Cu/Zn/Al catalysts. The effect of Mg, Ca and Sr as basic promoters. Fuel 2020, 274, 117804. [Google Scholar] [CrossRef]
  37. Halder, A.; Kilianová, M.; Yang, B.; Tyo, E.C.; Seifert, S.; Prucek, R.; Panáček, A.; Suchomel, P.; Tomanec, O.; Gosztola, D.J.; et al. Highly efficient Cu-decorated iron oxide nanocatalyst for low pressure CO2 conversion. Appl. Catal. B 2018, 225, 128–138. [Google Scholar] [CrossRef]
  38. Zhang, P.; Araki, Y.; Feng, X.; Li, H.; Fang, Y.; Chen, F.; Shi, L.; Peng, X.; Yoneyama, Y.; Yang, G.; et al. Urea-derived Cu/ZnO catalyst being dried by supercritical CO2 for low-temperature methanol synthesis. Fuel 2020, 268, 117213. [Google Scholar] [CrossRef]
  39. Xiong, S.; Lian, Y.; Xie, H.; Liu, B. Hydrogenation of CO2 to methanol over Cu/ZnCr catalyst. Fuel 2019, 256, 115975. [Google Scholar] [CrossRef]
  40. Dong, X.; Li, F.; Zhao, N.; Xiao, F.; Wang, J.; Tan, Y. CO2 hydrogenation to methanol over Cu/ZnO/ZrO2 catalysts prepared by precipitation-reduction method. Appl. Catal. B 2016, 191, 8–17. [Google Scholar] [CrossRef]
  41. Wang, G.; Mao, D.; Guo, X.; Yu, J. Enhanced performance of the CuO-ZnO-ZrO2 catalyst for CO2 hydrogenation to methanol by WO3 modification. Appl. Surf. Sci. 2018, 456, 403–409. [Google Scholar] [CrossRef]
  42. Li, S.; Wang, Y.; Yang, B.; Guo, L. A highly active and selective mesostructured Cu/AlCeO catalyst for CO2 hydrogenation to methanol. Appl. Catal. A-Gen. 2019, 571, 51–60. [Google Scholar] [CrossRef]
  43. Sedighi, M.; Mohammadi, M. CO2 hydrogenation to light olefins over Cu-CeO2/SAPO-34 catalysts: Product distribution and optimization. J. CO2 Util. 2020, 35, 236–244. [Google Scholar] [CrossRef]
  44. Gao, P.; Xie, R.; Wang, H.; Zhong, L.; Xia, L.; Zhang, Z.; Wei, W.; Sun, Y. Cu/Zn/Al/Zr catalysts via phase-pure hydrotalcite-like compounds for methanol synthesis from carbon dioxide. J. CO2 Util. 2015, 11, 41–48. [Google Scholar] [CrossRef]
  45. Yang, B.; Liu, C.; Halder, A.; Tyo, E.C.; Martinson, A.B.F.; Seifert, S.; Zapol, P.; Curtiss, L.A.; Vajda, S. Copper Cluster Size Effect in Methanol Synthesis from CO2. J. Phys. Chem. C 2017, 121, 10406–10412. [Google Scholar] [CrossRef]
  46. Dasireddy, V.D.B.C.; Likozar, B. The role of copper oxidation state in Cu/ZnO/Al2O3 catalysts in CO2 hydrogenation and methanol productivity. Renew. Energy 2019, 140, 452–460. [Google Scholar] [CrossRef]
  47. Liu, C.; Yang, B.; Tyo, E.; Seifert, S.; DeBartolo, J.; von Issendorff, B.; Zapol, P.; Vajda, S.; Curtiss, L.A. Carbon Dioxide Conversion to Methanol over Size-Selected Cu4 Clusters at Low Pressures. J. Am. Chem Soc. 2015, 137, 8676–8679. [Google Scholar] [CrossRef]
  48. Khdary, N.H.; Alayyar, A.S.; Alsarhan, L.M.; Alshihri, S.; Mokhtar, M. Metal Oxides as Catalyst/Supporter for CO2 Capture and Conversion, Review. Catalysts 2022, 12, 300. [Google Scholar] [CrossRef]
  49. Zboril, R.; Machala, L.; Mashlan, M.; Hermanek, M.; Miglierini, M.; Fojtik, A. Structural, magnetic and size transformations induced by isothermal treatment of ferrous oxalate dihydrate in static air conditions. Phys. Status Solidi C 2004, 1, 3583–3588. [Google Scholar] [CrossRef]
  50. Datta, K.J.; Gawande, M.B.; Datta, K.K.R.; Ranc, V.; Pechousek, J.; Krizek, M.; Tucek, J.; Kale, R.; Pospisil, P.; Varma, R.S.; et al. Micro–mesoporous iron oxides with record efficiency for the decomposition of hydrogen peroxide: Morphology driven catalysis for the degradation of organic contaminants. J. Mater. Chem. A 2016, 4, 596–604. [Google Scholar] [CrossRef]
  51. Kim, E.; Kim, H.; Park, B.J.; Han, Y.H.; Park, J.H.; Cho, J.; Lee, S.S.; Son, J.G. Etching-Assisted Crumpled Graphene Wrapped Spiky Iron Oxide Particles for High-Performance Li-Ion Hybrid Supercapacitor. Small 2018, 14, e1704209. [Google Scholar] [CrossRef] [PubMed]
  52. Zhu, D.; Wang, L.; Yu, W.; Xie, H. Intriguingly high thermal conductivity increment for CuO nanowires contained nanofluids with low viscosity. Sci. Rep. 2018, 8, 5282. [Google Scholar] [CrossRef] [PubMed]
  53. Halder, A.; Lenardi, C.; Timoshenko, J.; Mravak, A.; Yang, B.; Kolipaka, L.K.; Piazzoni, C.; Seifert, S.; Bonačić-Koutecký, V.; Frenkel, A.I.; et al. CO2 Methanation on Cu-Cluster Decorated Zirconia Supports with Different Morphology: A Combined Experimental In Situ GIXANES/GISAXS, Ex Situ XPS and Theoretical DFT Study. ACS Catal. 2021, 11, 6210–6224. [Google Scholar] [CrossRef]
  54. Pauly, N.; Tougaard, S.; Yubero, F. Determination of the Cu 2p primary excitation spectra for Cu, Cu2O and CuO. Surf. Sci 2014, 620, 17–22. [Google Scholar] [CrossRef]
  55. Bouafia, A.; Laouini, S.E.; Khelef, A.; Tedjani, M.L.; Guemari, F. Effect of Ferric Chloride Concentration on the Type of Magnetite (Fe3O4) Nanoparticles Biosynthesized by Aqueous Leaves Extract of Artemisia and Assessment of Their Antioxidant Activities. J. Clust. Sci. 2020, 32, 1033–1041. [Google Scholar] [CrossRef]
  56. Yang, B.; Yu, X.; Halder, A.; Zhang, X.; Zhou, X.; Mannie, G.J.A.; Tyo, E.; Pellin, M.J.; Seifert, S.; Su, D.; et al. Dynamic Interplay between Copper Tetramers and Iron Oxide Boosting CO2 Conversion to Methanol and Hydrocarbons under Mild Conditions. ACS Sustain. Chem. Eng. 2019, 7, 14435–14442. [Google Scholar] [CrossRef]
  57. Yao, B.; Xiao, T.; Makgae, O.A.; Jie, X.; Gonzalez-Cortes, S.; Guan, S.; Kirkland, A.I.; Dilworth, J.R.; Al-Megren, H.A.; Alshihri, S.M.; et al. Transforming carbon dioxide into jet fuel using an organic combustion-synthesized Fe-Mn-K catalyst. Nat. Commun. 2020, 11, 6395. [Google Scholar] [CrossRef]
  58. Sayed, F.N.; Polshettiwar, V. Facile and sustainable synthesis of shaped iron oxide nanoparticles: Effect of iron precursor salts on the shapes of iron oxides. Sci. Rep. 2015, 5, 9733. [Google Scholar] [CrossRef]
Figure 1. SEM images of fresh (a) FeOx, (b) 1%-Cu/FeOx, and (c) 3%-Cu/FeOx, (d) 5%-Cu/FeOx. For additional images, see Figure S9.
Catalysts 12 00516 g001
Figure 2. Hydrogenation of CO2. CO2 conversion and selectivities by (a,b) FeOx, (c,d) 1%-Cu/FeOx, (e,f) 3%-Cu/FeOx, (g,h) 5%-Cu/FeOx. A total of 200 mg of catalyst and CO2/H2/He (1:5:4, total flow 25 mL/min).
Catalysts 12 00516 g002aCatalysts 12 00516 g002b
Figure 3. SEM images of (a) spent FeOx, (b) spent 1%-Cu/FeOx, (c) spent 3%-Cu/FeOx, and (d) spent 5%-Cu/FeOx showing major restructuring at the micrometer and sub-micrometer scale. Additional images are shown in Figure S10.
Catalysts 12 00516 g003
Figure 4. TEM images of spent catalysts after CO2 hydrogenation of (a) FeOx, (b) 1% Cu/FeOx, (c) 3% Cu/FeOx, and (d) 5% Cu/FeOx showing the transformation of the rod-like particles of the fresh catalysts into roughly spherical particles.
Catalysts 12 00516 g004
Figure 5. (a) STEM-HAADF of spent 5%-Cu/FeOx, and (bd) EDX elemental mapping of Fe, O, C and Cu.
Catalysts 12 00516 g005
Table 1. Fractions of various forms of iron oxide components in the fresh catalysts, obtained from XRD data using Rietveld refinement of analysis and specific surface area of fresh catalysts, as determined from adsorption/desorption of nitrogen on the surface of the fresh catalysts. Multipoint BET was assessed using Roquerol’s method.
CatalystIron Oxide Composition aSpecific Surface AreaActual Cu load b
α-Fe2O3 [%]α-FeO(OH) [%]Fe3O4 [%][m2/g][%]
FeOx43.554.42.11140
1%-Cu/FeOx81.216.8 1140.7
3%-Cu/FeOx43.656.4 932.7
5%-Cu/FeOx48.351.7 925.3
a Obtained from XRD. b Obtained from atomic absorption spectroscopy.
Table 2. Fractions of various forms of iron oxide and iron carbide components in the spent catalysts, obtained from XRD data using Rietveld refinement of analysis and specific surface area of spent catalysts, as determined from adsorption/desorption of nitrogen on the surface of the spent catalysts. Multipoint BET was assessed using Roquerol’s method.
CatalystIron Oxide/Carbide CompositionSpecific Surface Area
Fe3O4 [%]Fe5C2 [%]Fe3C [%][m2/g]
FeOx100.0 18.6
1%-Cu/FeOx95.05.0 18.6
3%-Cu/FeOx71.328.7 18.0
5%-Cu/FeOx59.837.23.017.4
Publisher’s Note: MDPI stays neutral with regard to jurisdictional claims in published maps and institutional affiliations.

