
Estimation of Circular Arc Crack Depths and Locations in Rotary Drilling Pipes Subjected to Free Vibrations


Abstract
:1. Introduction
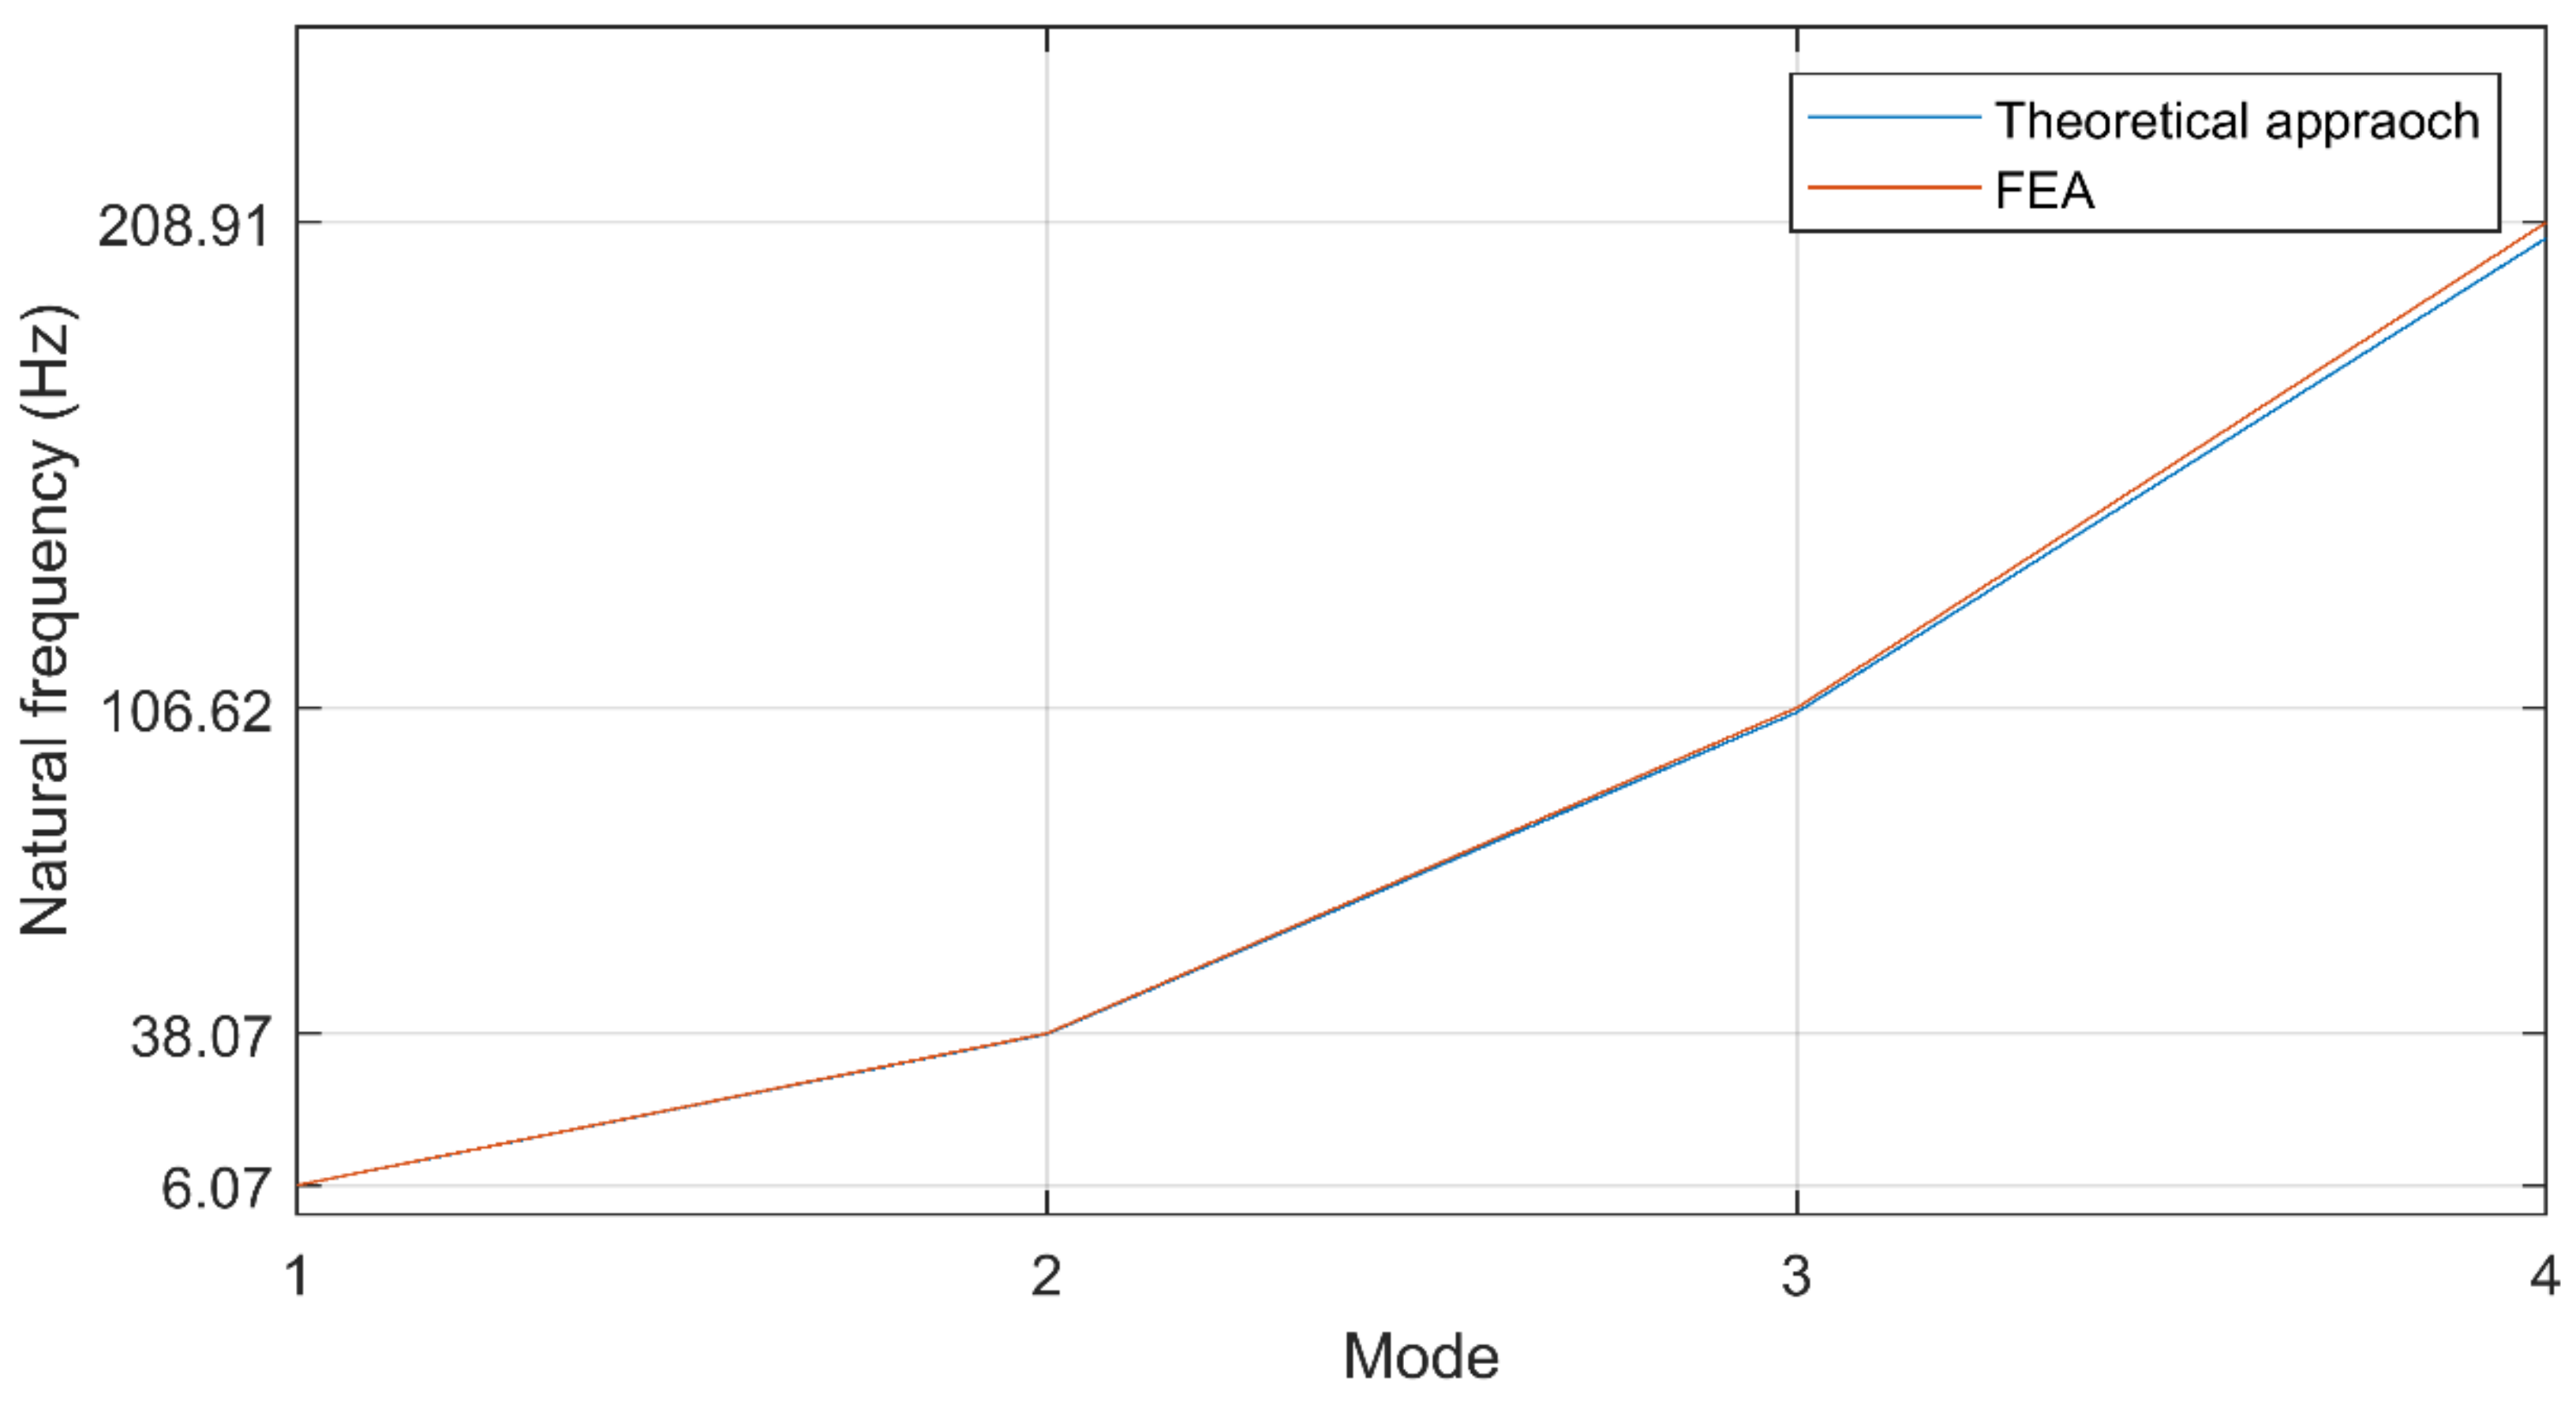
2. Theoretical Approach
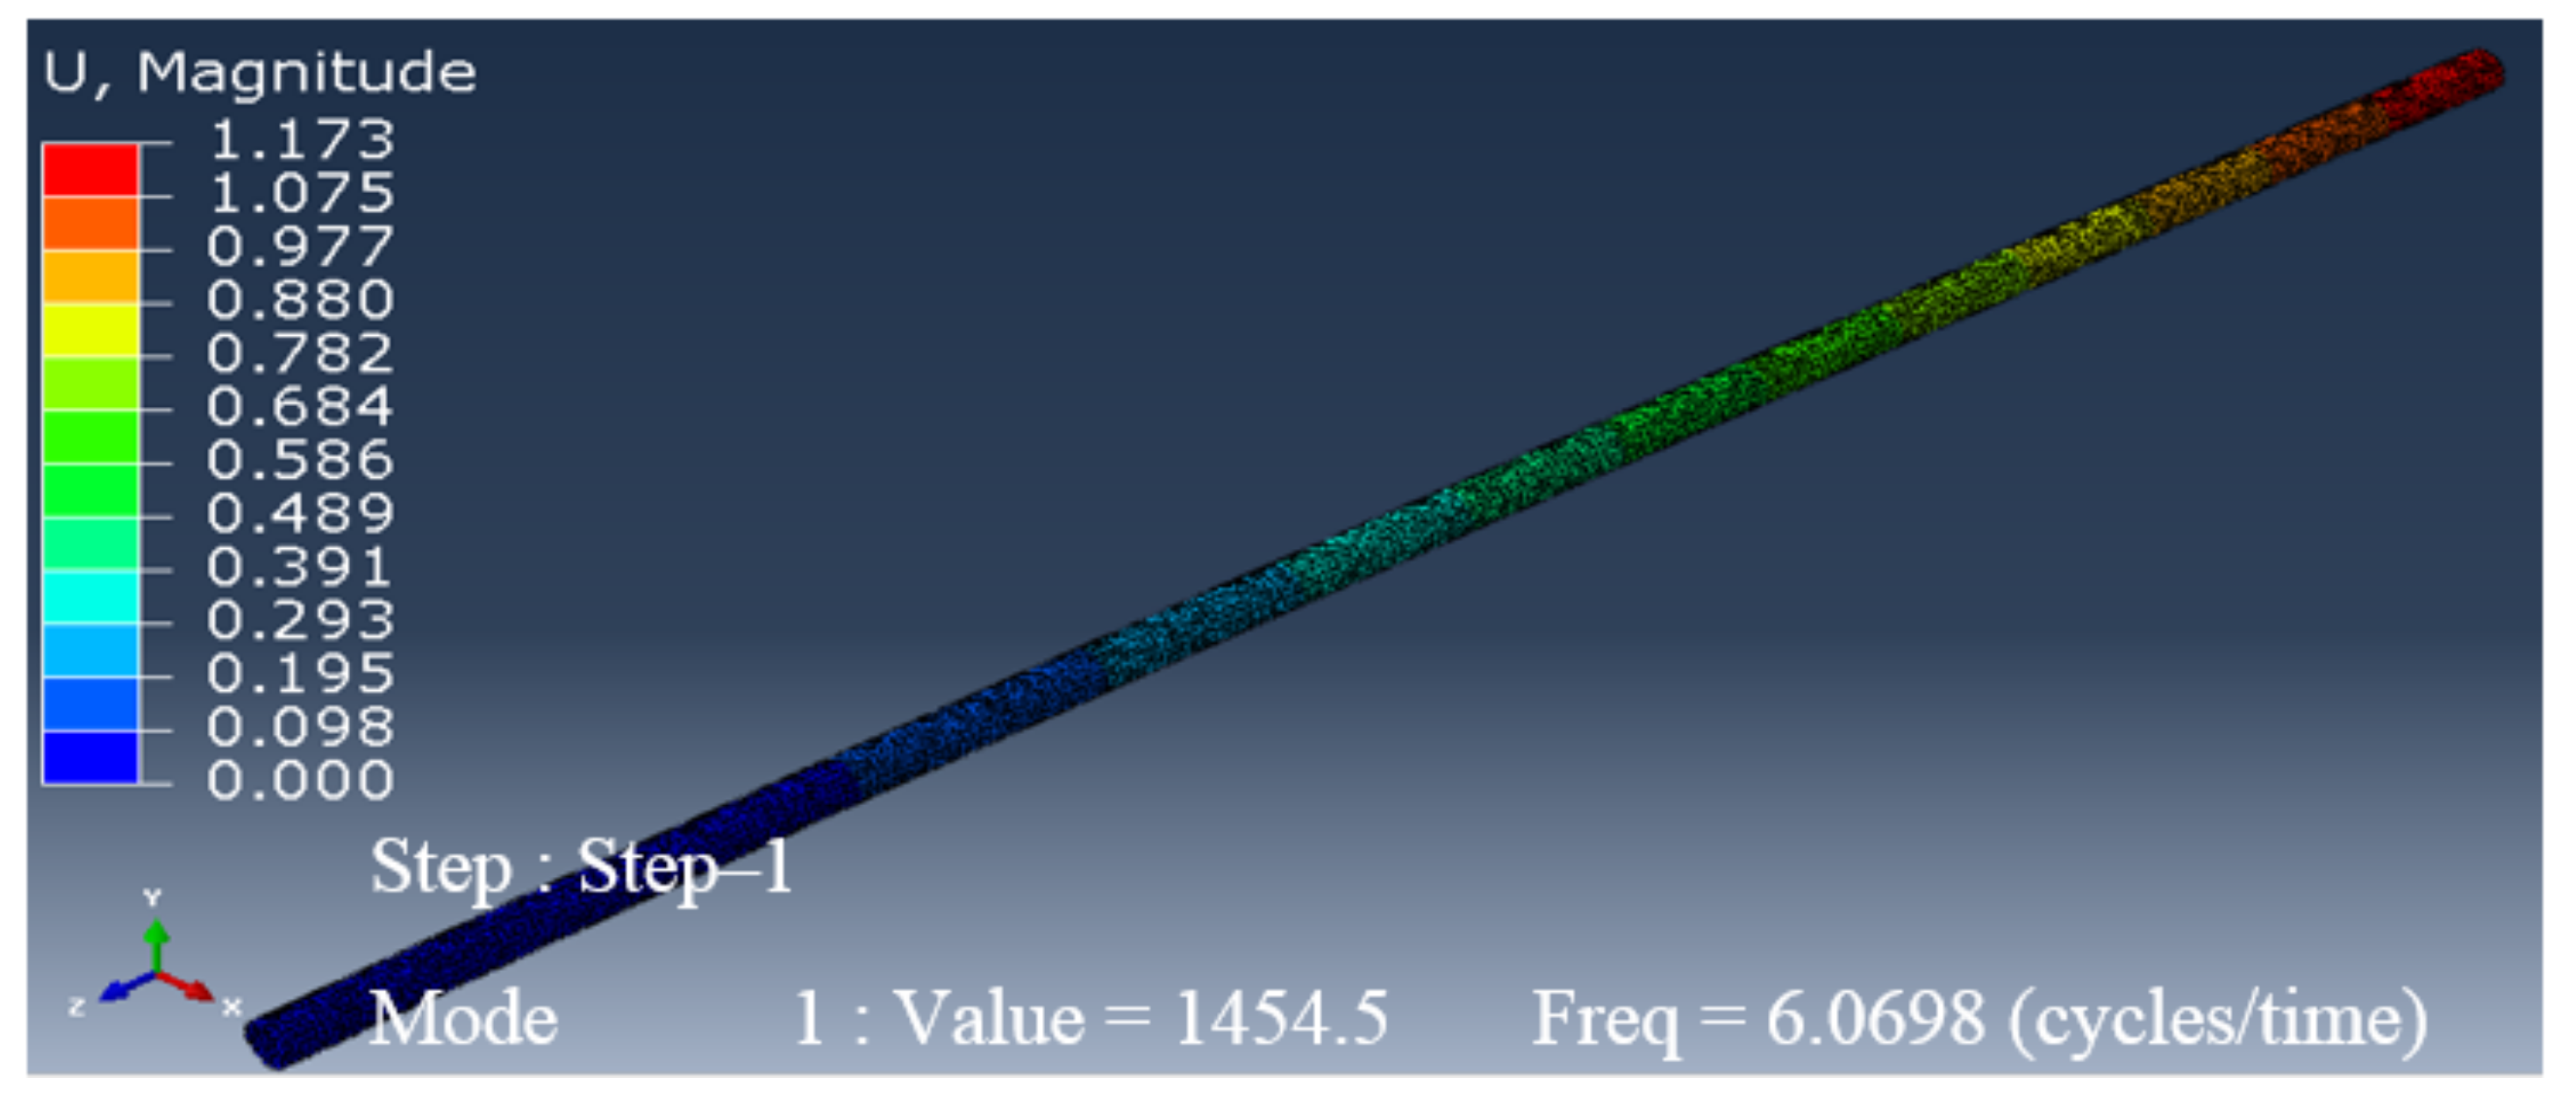
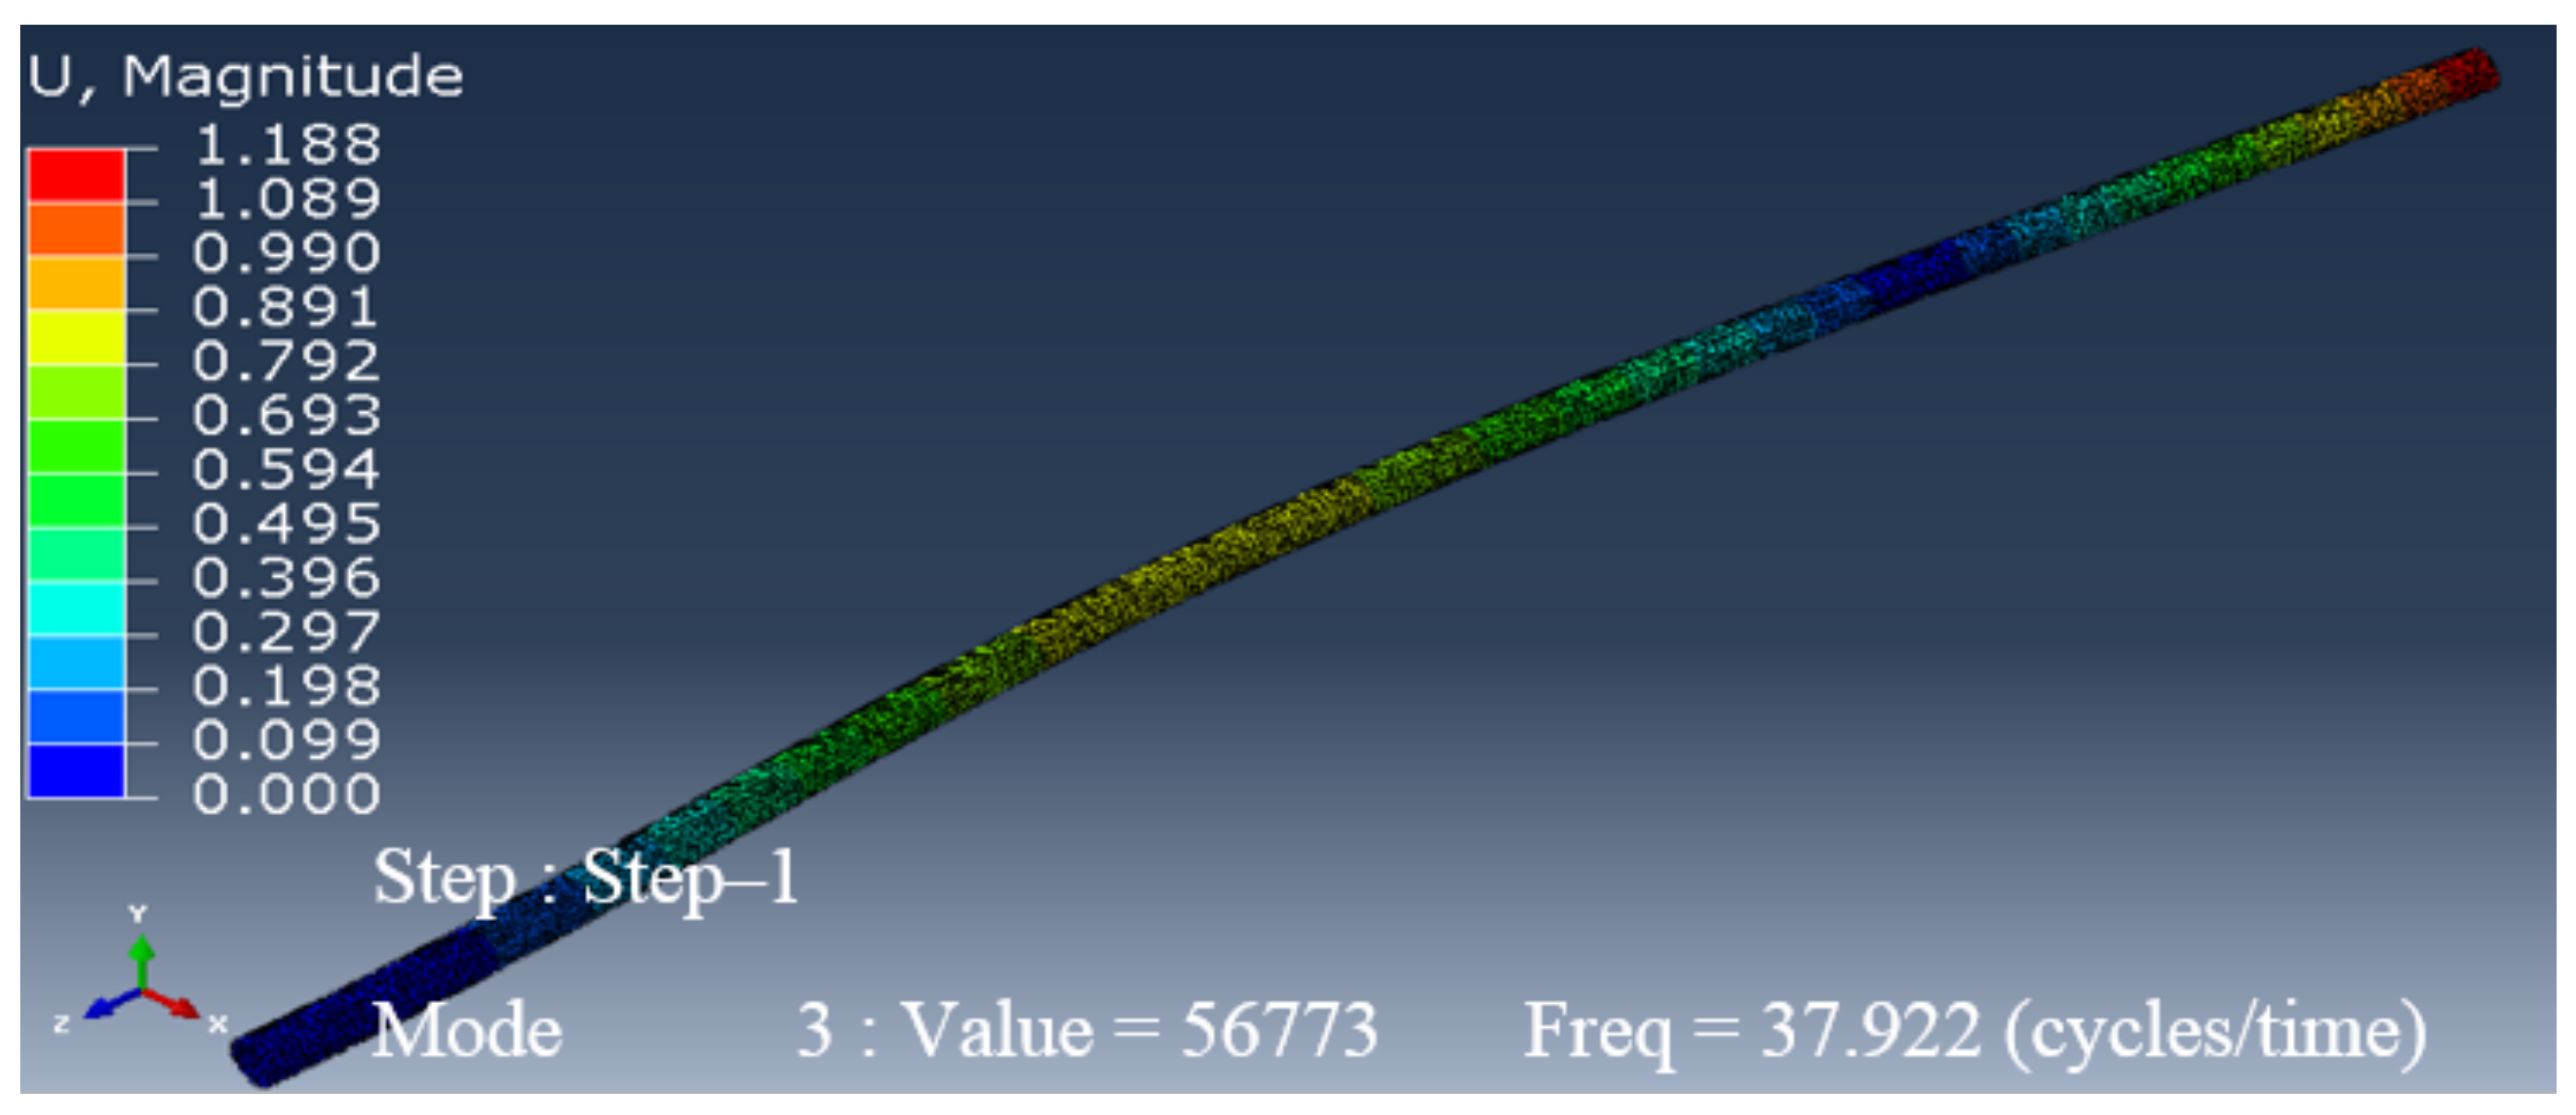
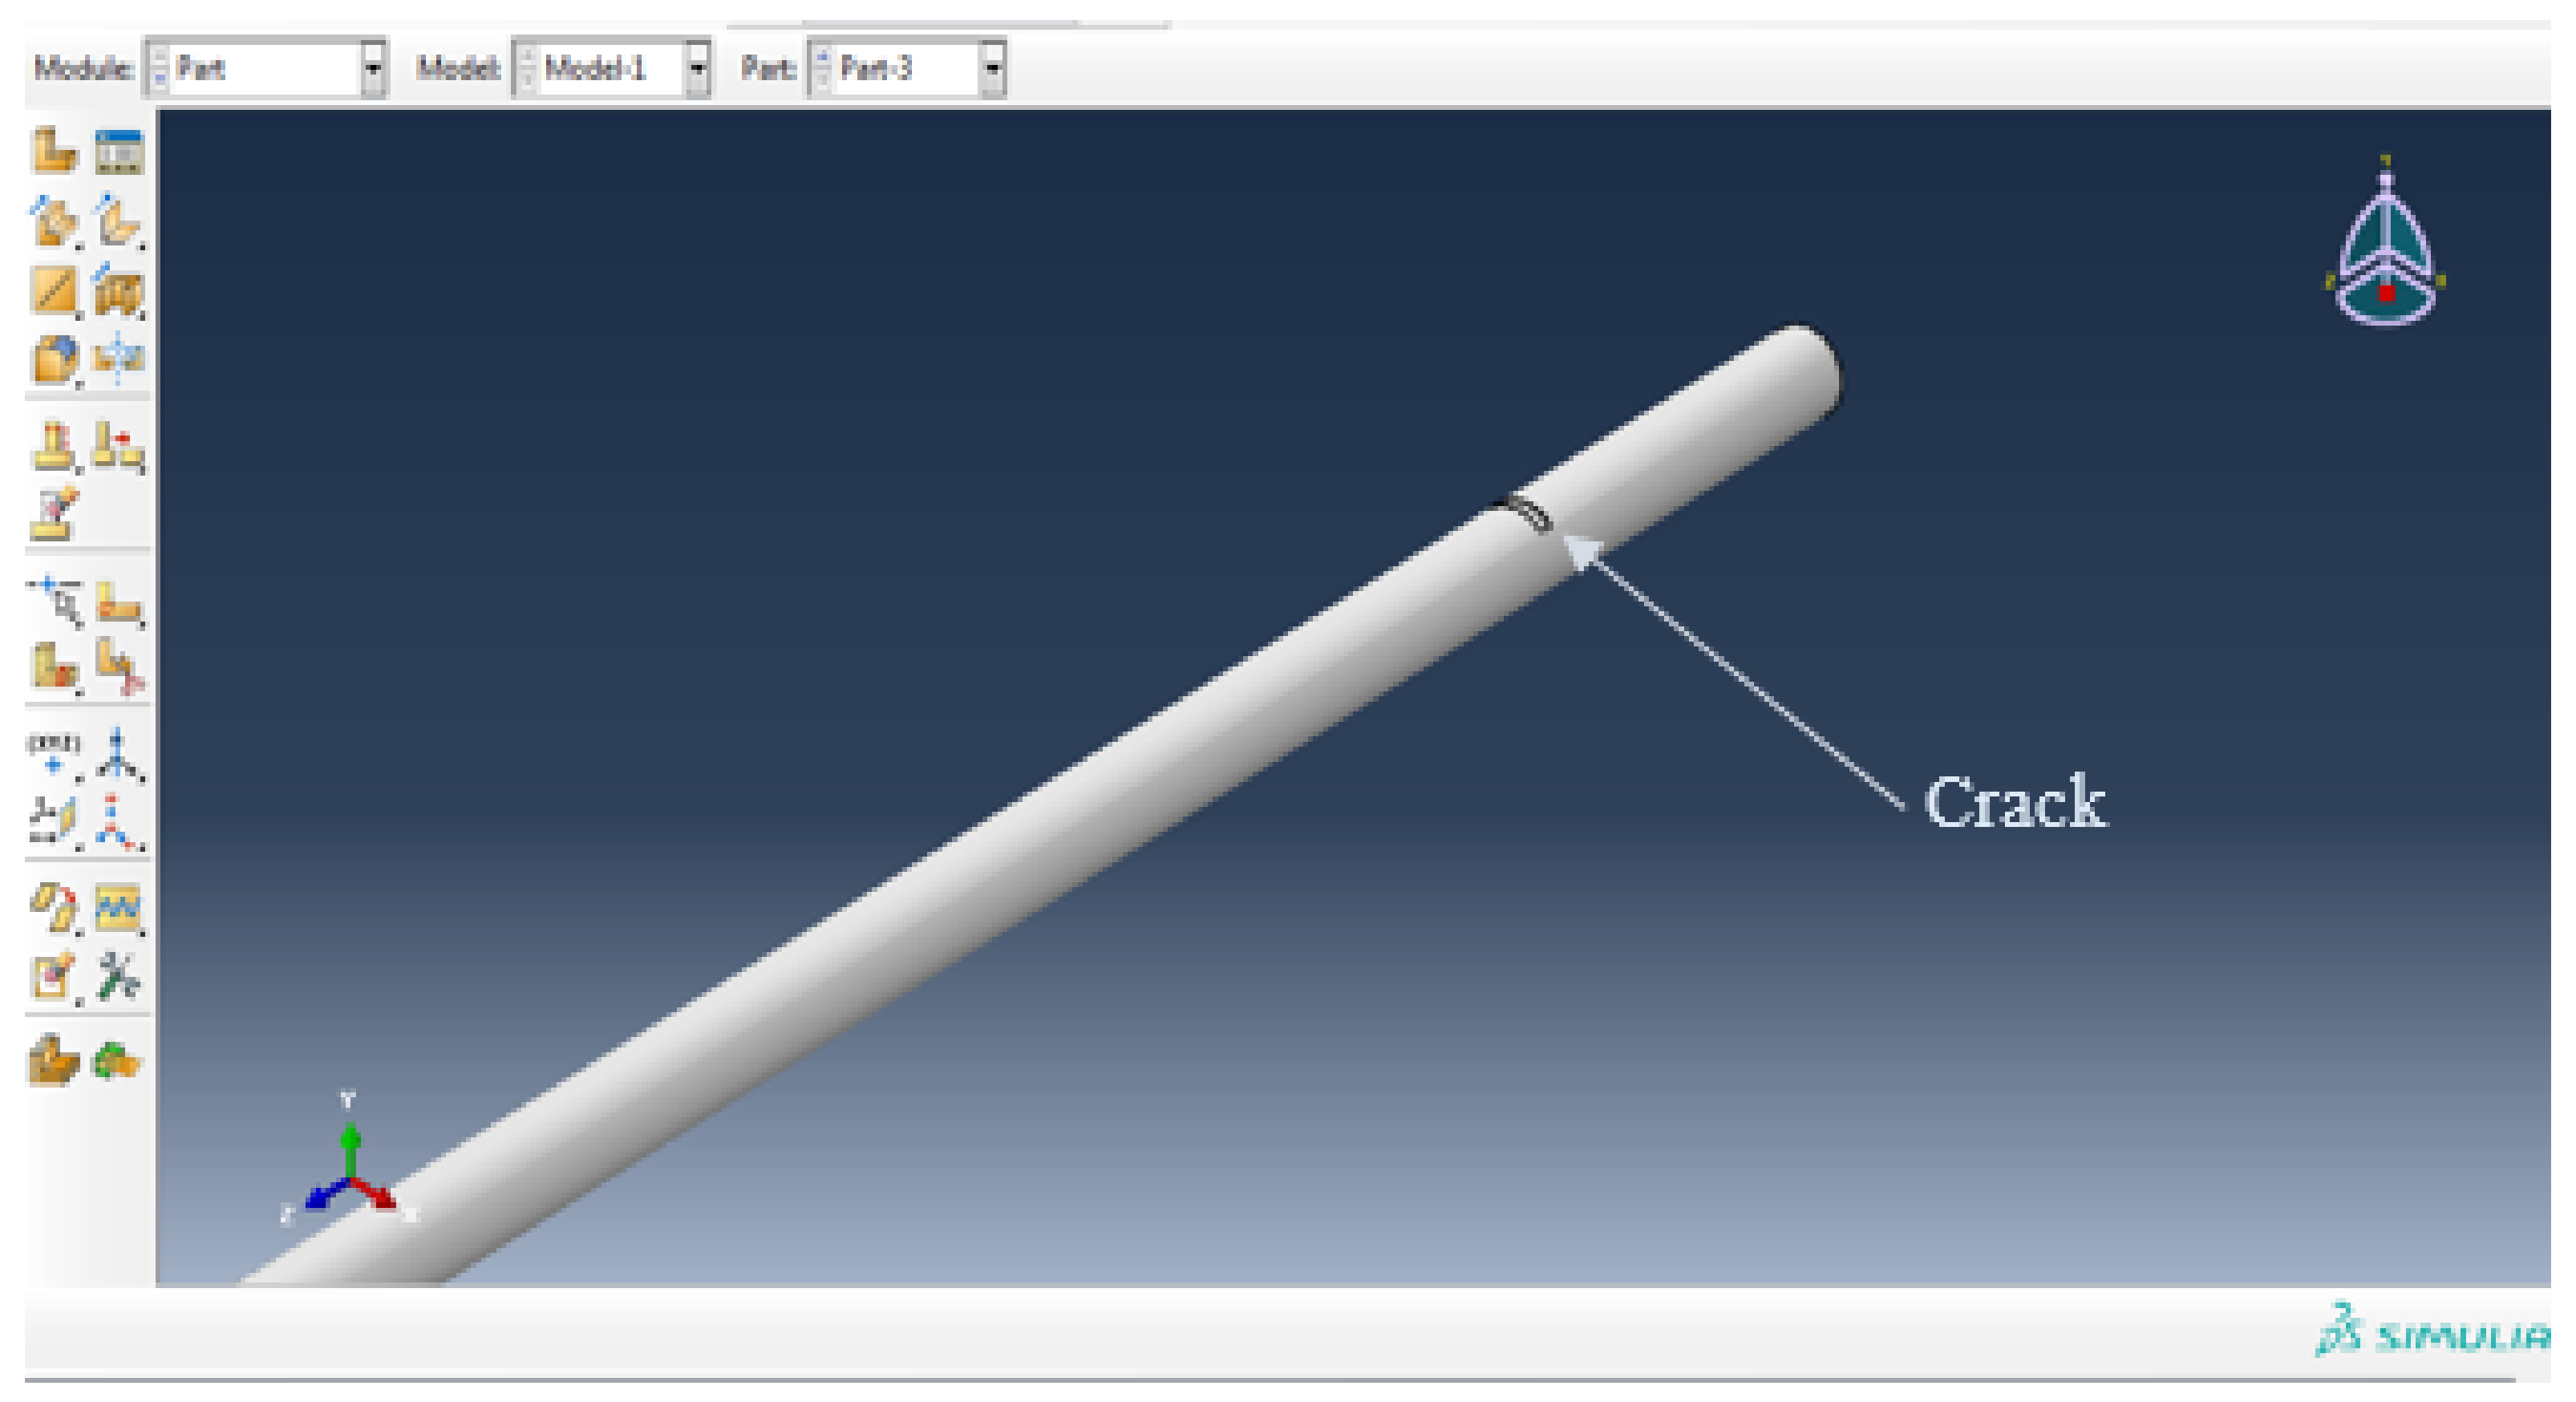
3. Finite Element Analysis
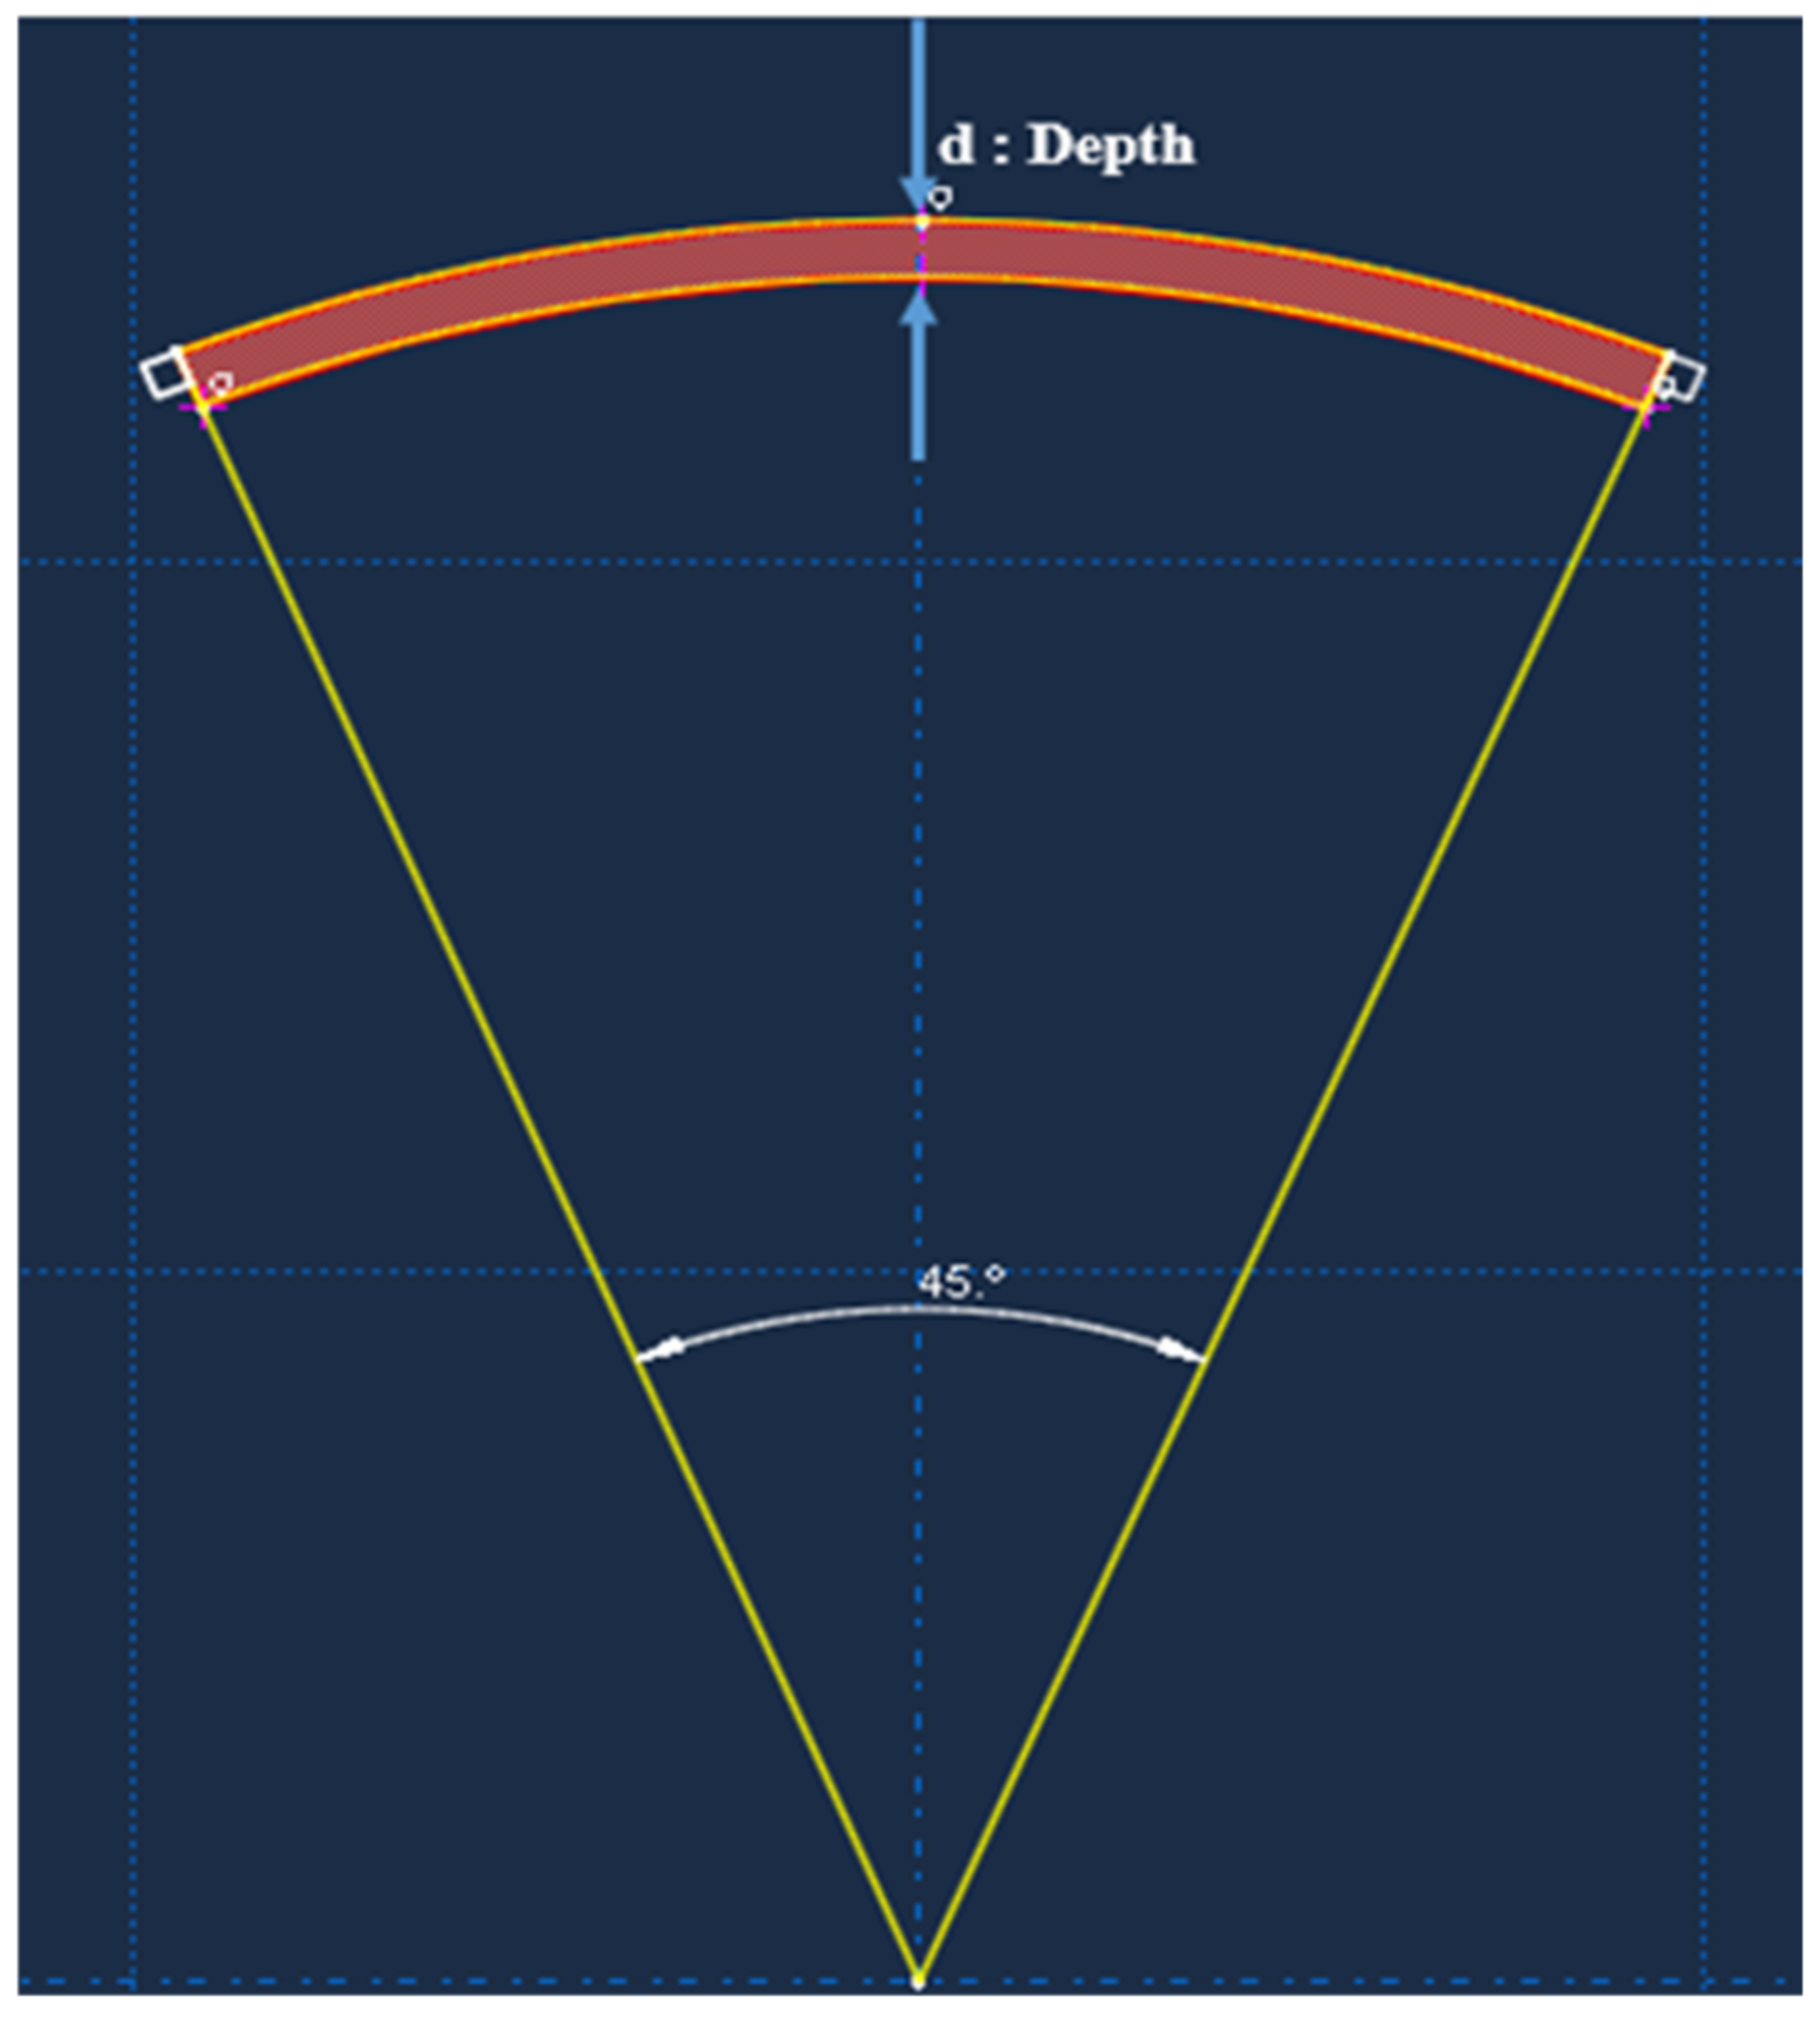
4. Crack Attribution
Effects of Cracks on Natural Frequencies
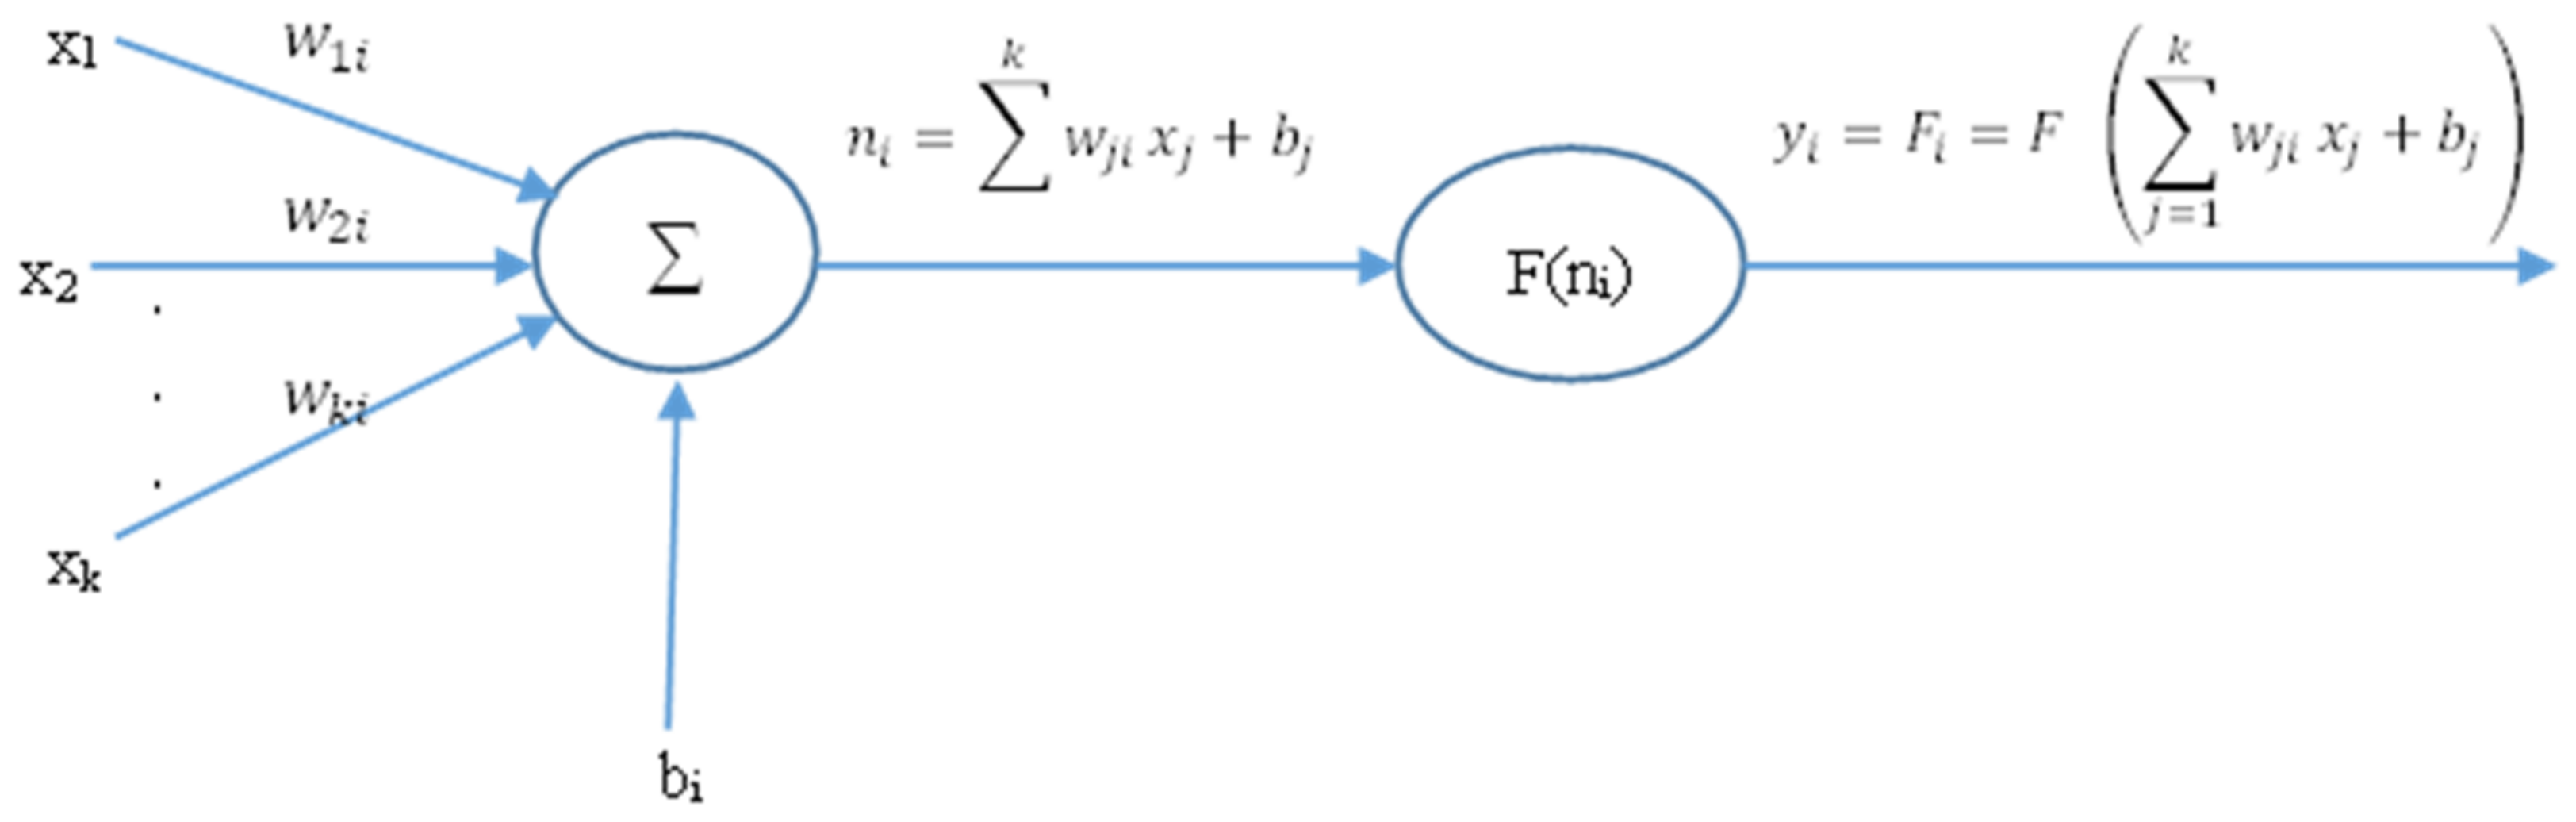
5. Artificial Neural Network
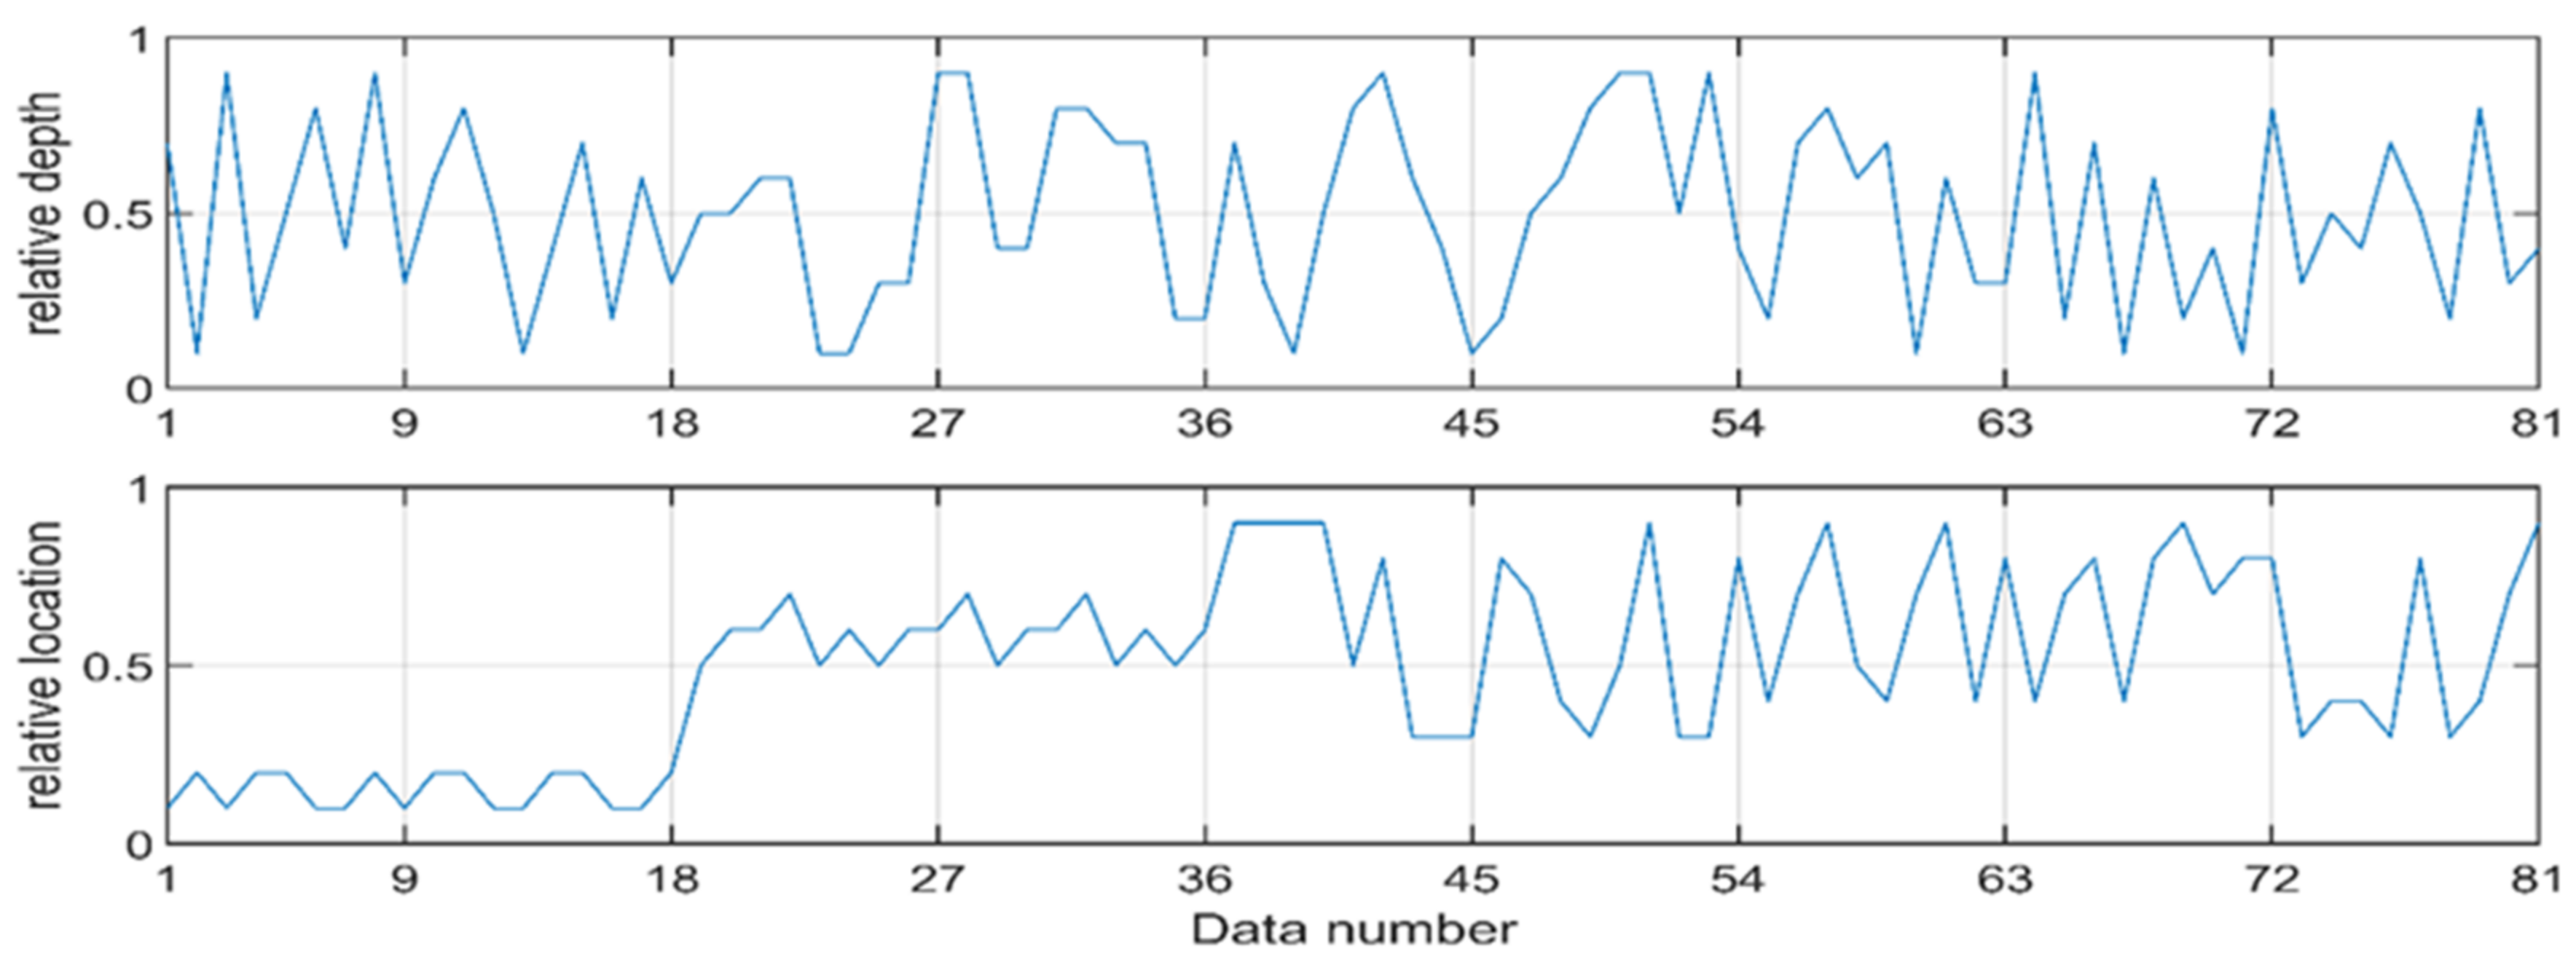
5.1. Data Splitting for ANN Training
5.2. Input and Output Data
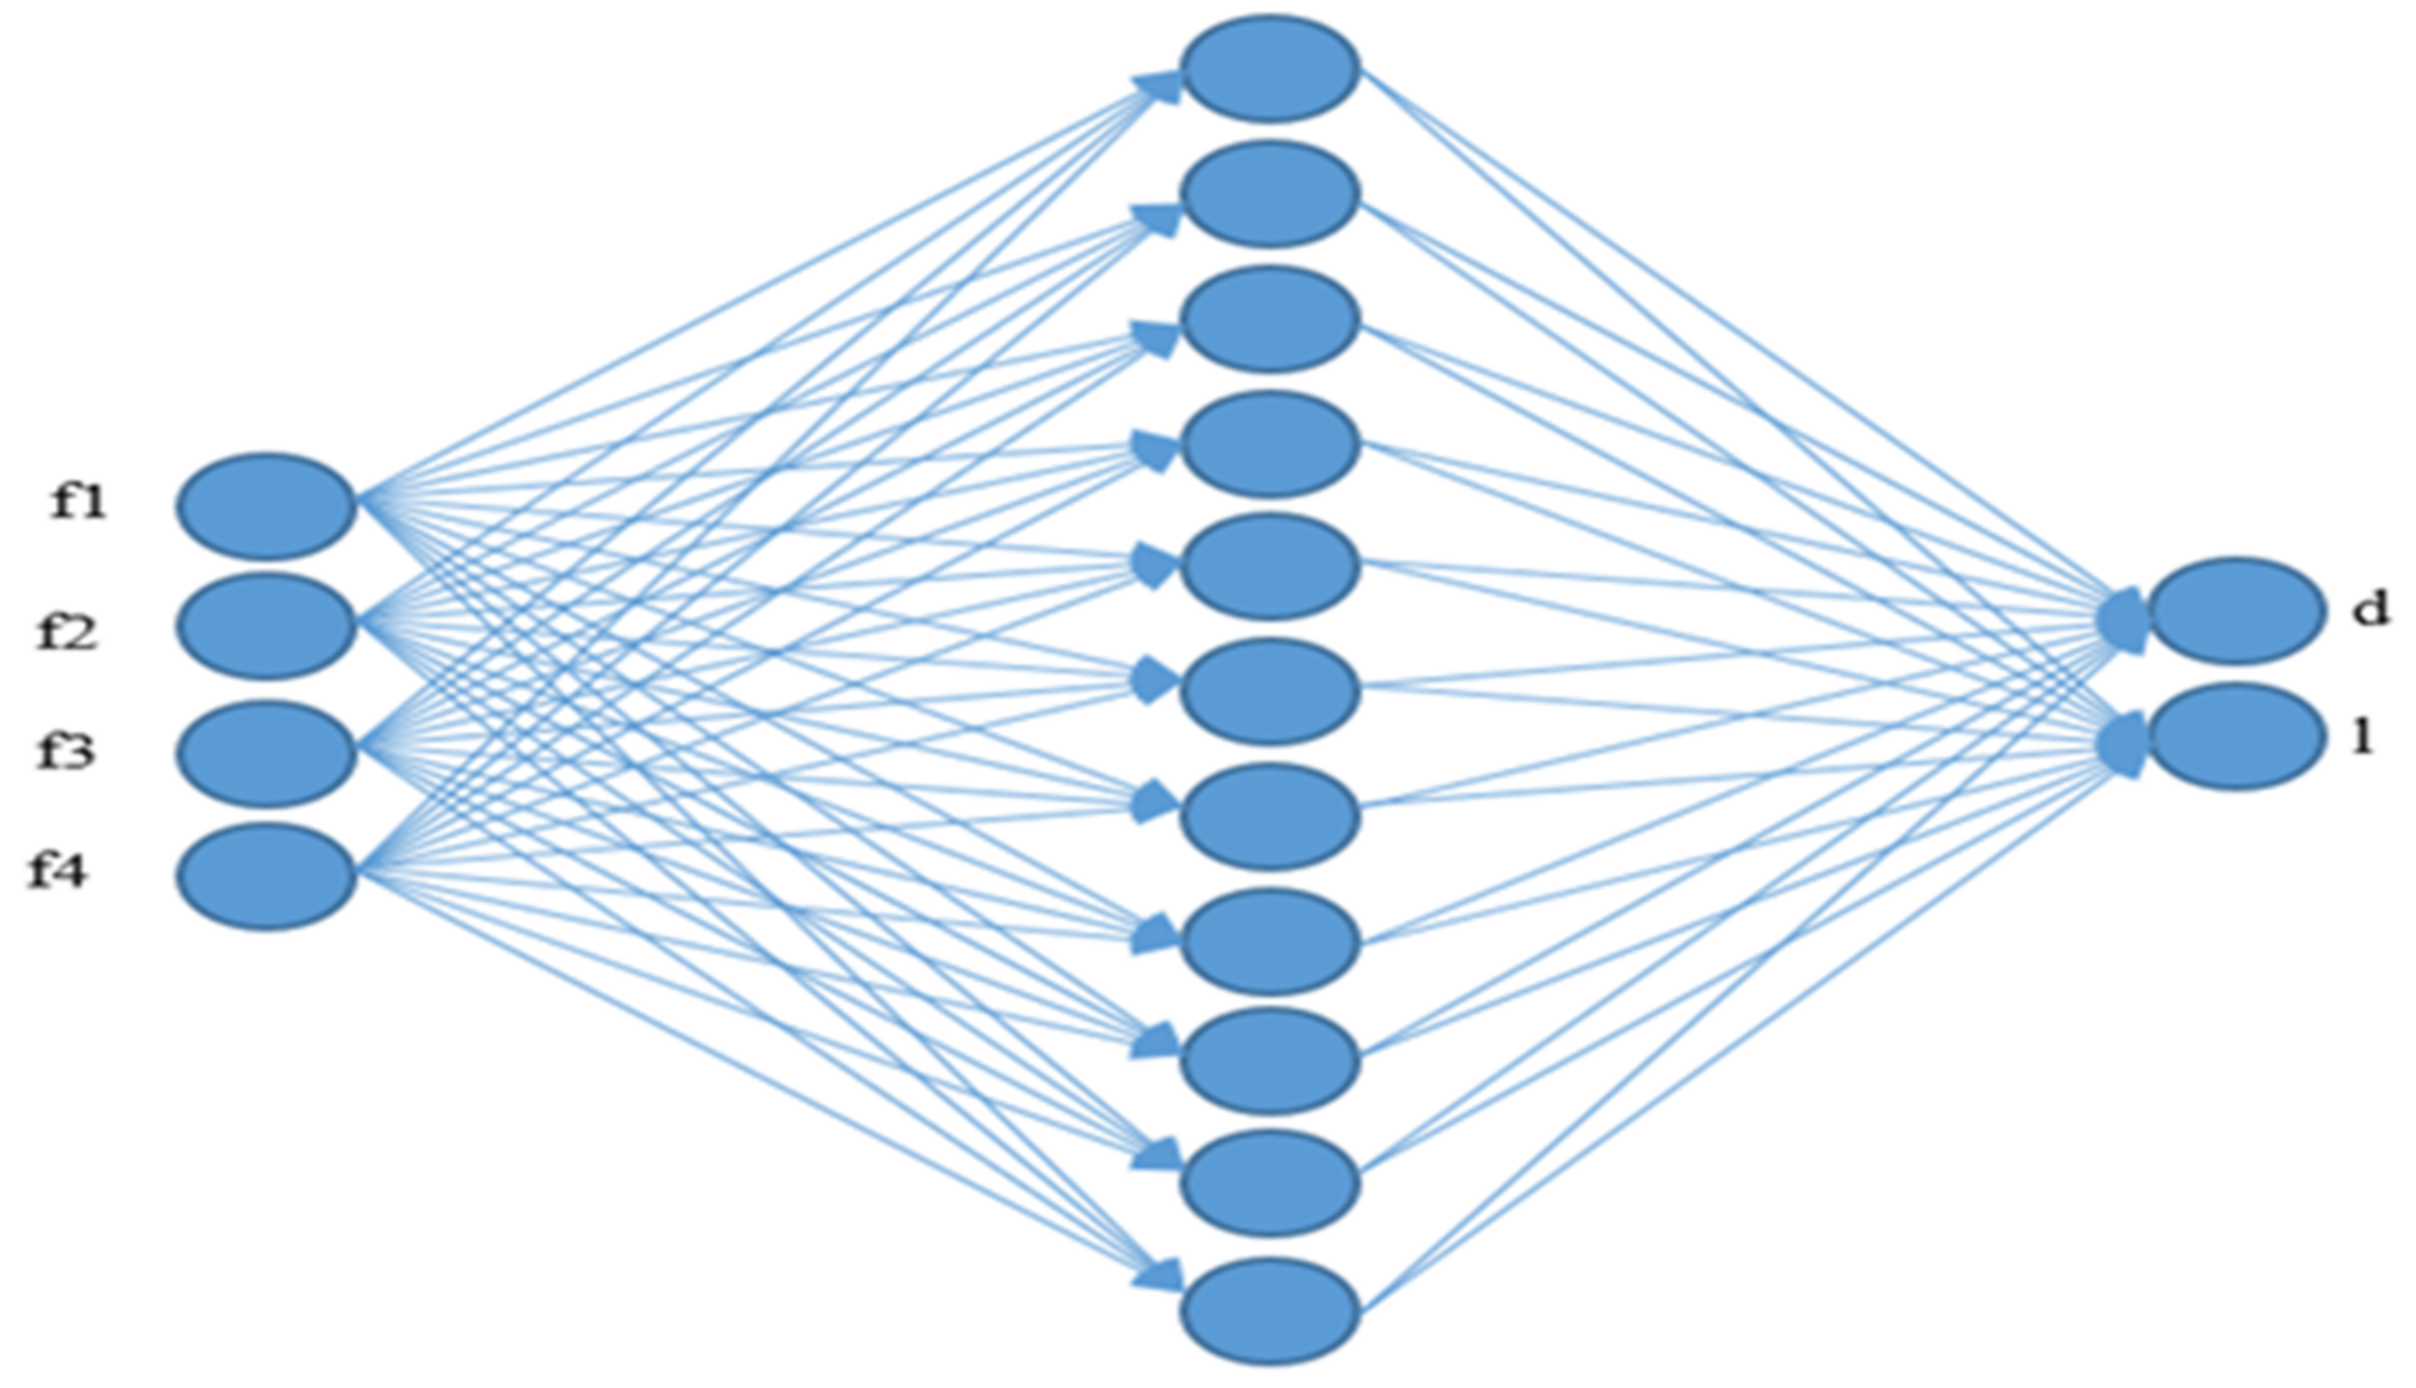
5.3. ANN Architecture
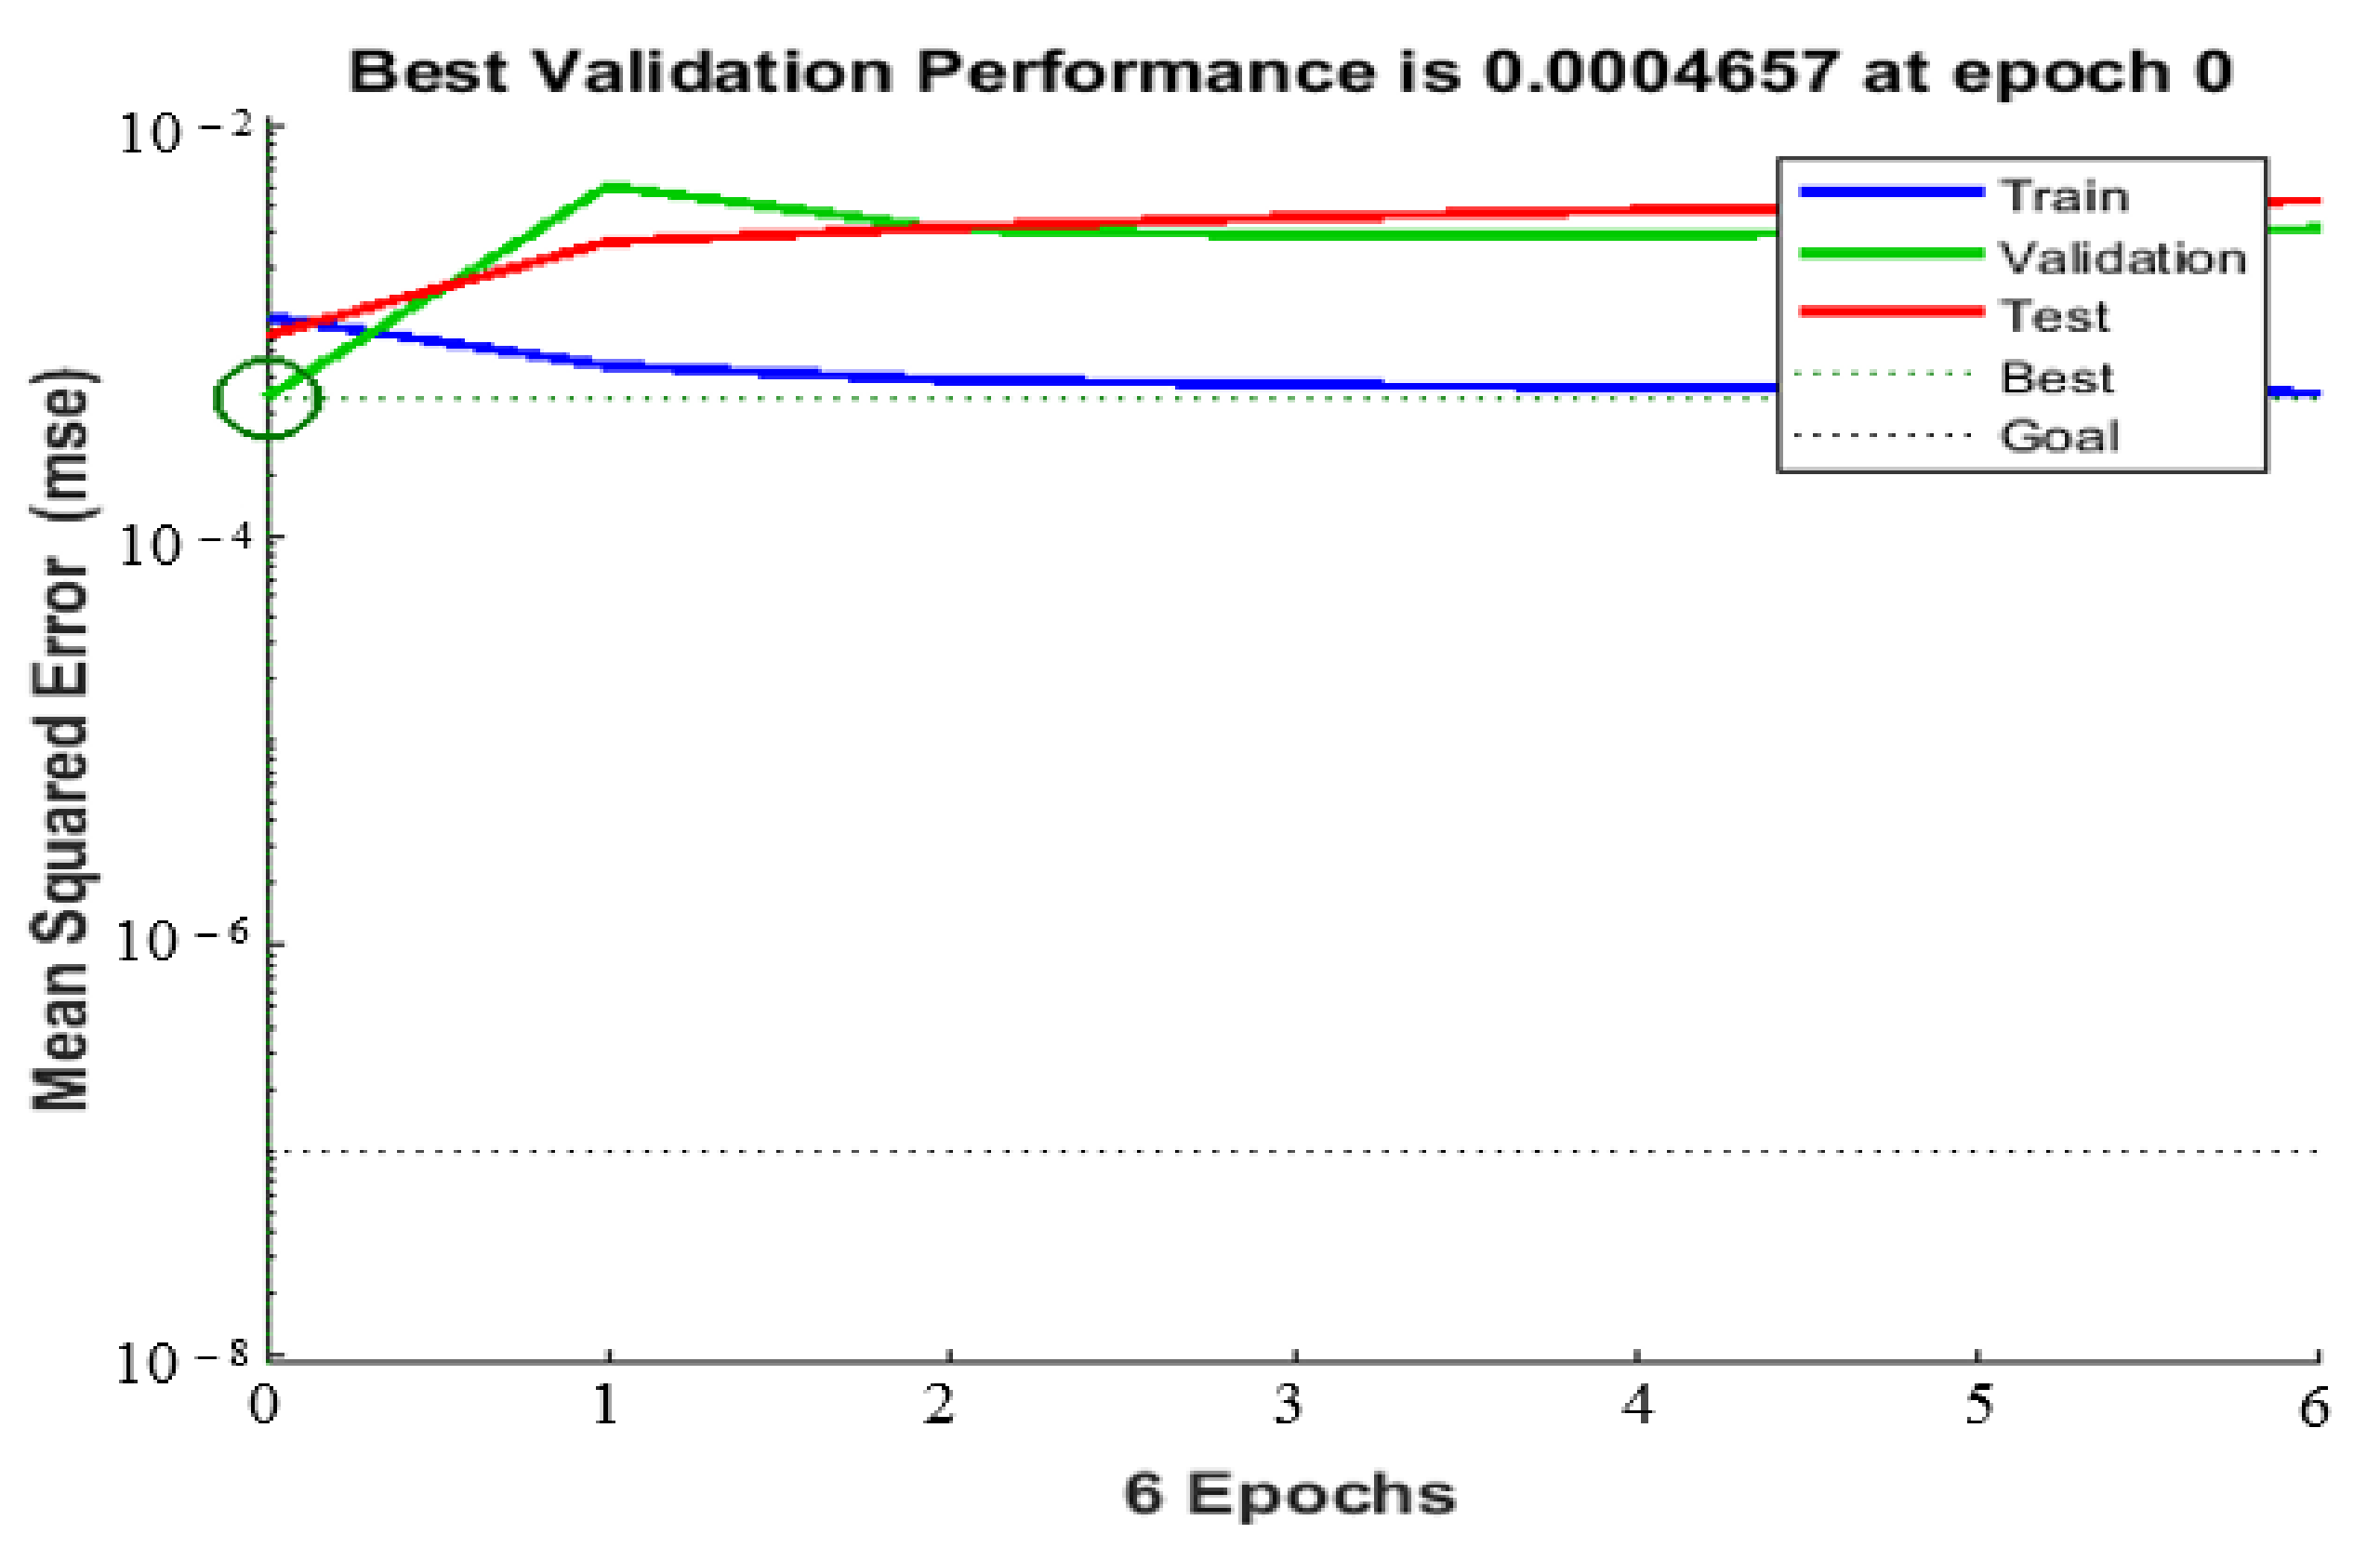
5.4. ANN Validation
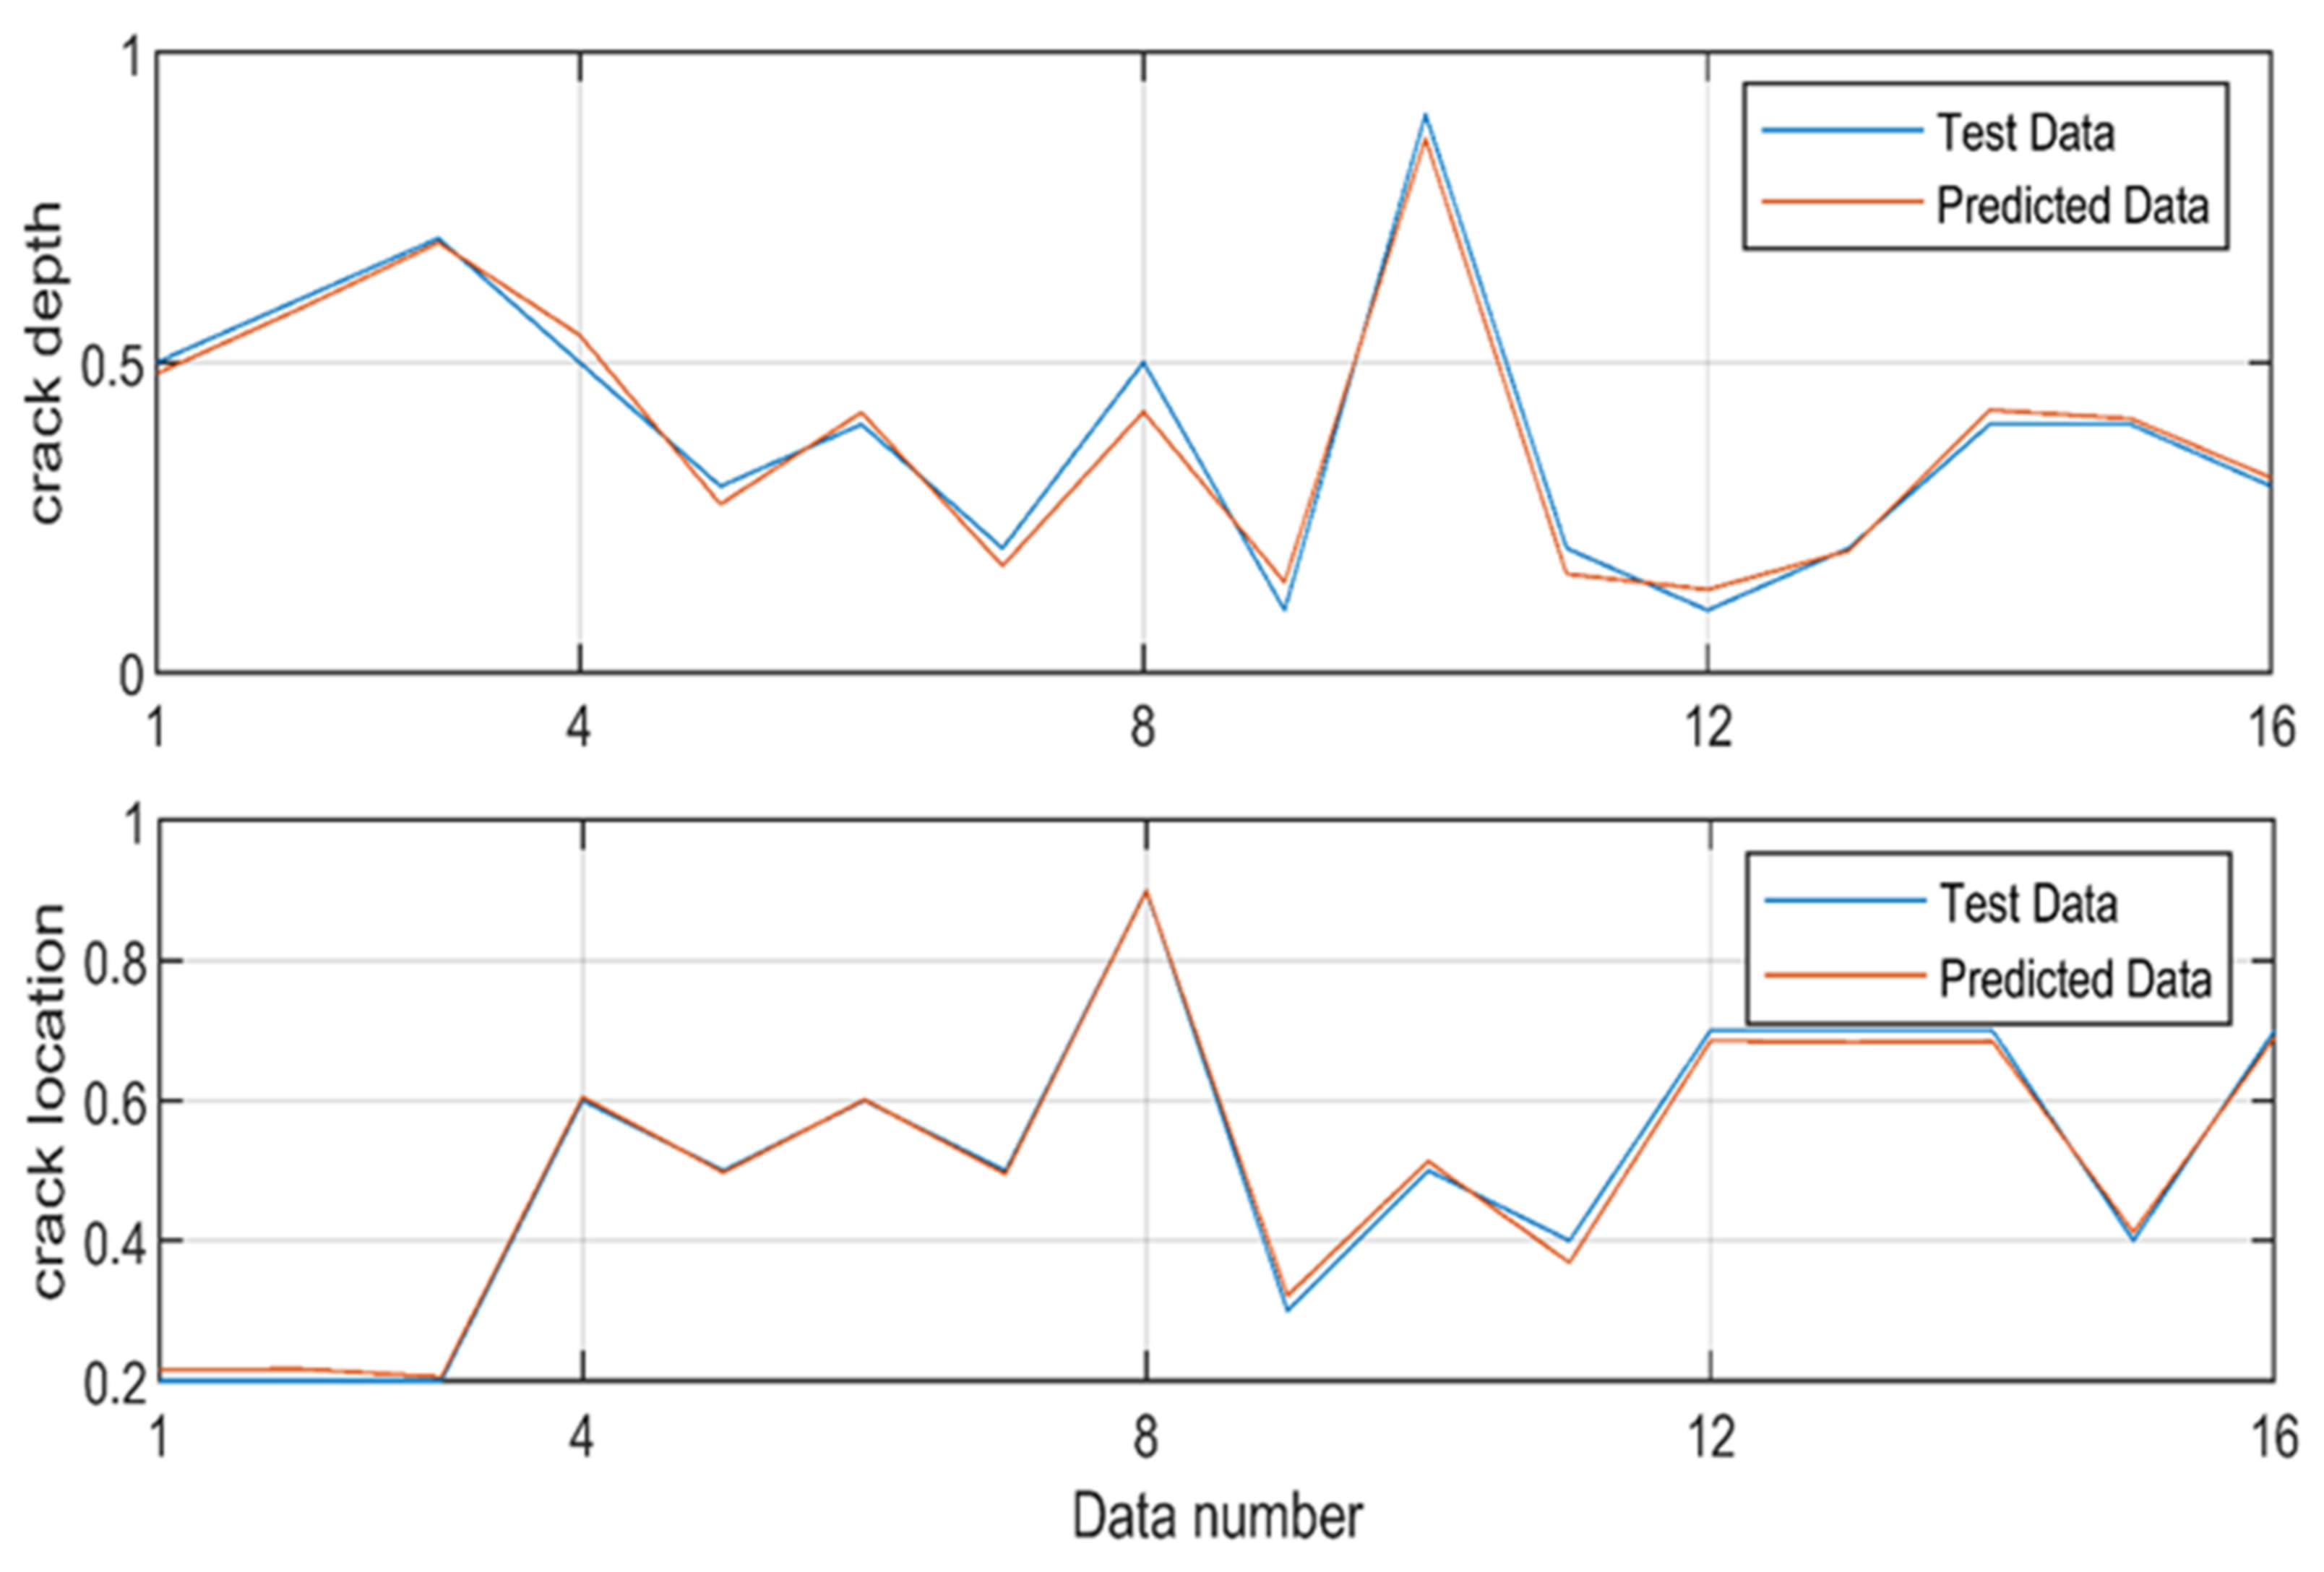
5.5. ANN Testing
6. Discussion
7. Conclusions
Author Contributions
Funding
Institutional Review Board Statement
Informed Consent Statement
Acknowledgments
Conflicts of Interest
Nomenclature
| Variable/Parameter | Variable/Parameter name | Value/Dimension |
| E | Elasticity modulus | 200 GPa |
| I | Moment of the cross-sectional area | 4.15 × 10⁻⁷ m4 |
| ρ | density | 7500 kg/m3 |
| A | Cross-sectional area | 1.16 × 10⁻³ m2 |
| w(x,t) | Displacement at x location | m |
| t | Time | sec |
| P | External force | N |
| l | Length | 3 m |
| ω | Natural frequency | Hz |
| OD | Outer diameter | 0.06 m |
| ID | Inner diameter | 0.046 m |
| dr | Relative crack depth | - |
| lr | Relative crack location | - |
| xi | Input vector | - |
| Wji | Weight matrix | - |
| bi | Bias vector | - |
| F | Activation function | - |
| R2 | Coefficient of determination | - |
| Residual sum of squares | - | |
| Total sum of squares | - |
References
- Ma, T.; Chen, P.; Zhao, J. Overview on vertical and directional drilling technologies for the exploration and exploitation of deep petroleum resources. Geomech. Geophys. Geo-Energy Geo-Resour. 2016, 2, 365–395. [Google Scholar] [CrossRef] [Green Version]
- Mendil, C.; Kidouche, M.; Doghmane, M.Z. A Study of the Parametric Variations Influences on Stick-Slip Vibrations in Smart Rotary Drilling Systems. In Artificial Intelligence and Renewables Towards an Energy Transition; Lecture Notes in Networks and Systems; Hatti, M., Ed.; Springer: Cham, Switzerland, 2021; Volume 174, pp. 707–715. [Google Scholar]
- Ghasemloonia, A.; Rideout, G.; Butt, S. The effect of weight on bit on the contact behavior of drillstring and wellbore. In Proceedings of the 2010 Spring Simulation Multiconference, Orlando, FL, USA, 11–15 April 2010; pp. 1–7. [Google Scholar]
- Doghmane, M.Z.; Bacetti, A.; Kidouche, M. Stick-Slip Vibrations Control Strategy Design for Smart Rotary Drilling Systems. In Artificial Intelligence and Renewables Towards an Energy Transition; Lecture Notes in Networks and Systems; Hatti, M., Ed.; Springer: Cham, Switzerland, 2021; Volume 174, pp. 197–209. [Google Scholar]
- Mendil, C.; Kidouche, M.; Doghmane, M.Z. Modeling of Hydrocarbons Rotary Drilling Systems under Torsional Vibrations: A Survey. In Artificial Intelligence and Renewables Towards an Energy Transition; Lecture Notes in Networks and Systems; Hatti, M., Ed.; Springer: Cham, Switzerland, 2021; Volume 174, pp. 243–251. [Google Scholar]
- Doghmane, M.Z.; Kidouche, M.; Ahriche, A. Decentralized Overlapping Control Design with Application to Rotary Drilling System. IETE J. Res. 2021, 1–10. [Google Scholar] [CrossRef]
- Zamani, S.M.; Hassanzadeh-Tabrizi, S.A.; Sharifi, H. Failure analysis of drill pipe: A review. Eng. Fail. Anal. 2016, 59, 605–623. [Google Scholar] [CrossRef]
- Kessai, I.; Benammar, S.; Doghmane, M. Dynamic failure analysis and lifetime estimation of Tool-string in rotary drilling system under Torsional-Axial coupled vibrations. Eng. Fail. Anal. 2022, 134, 106037. [Google Scholar] [CrossRef]
- Rahman, M.K.; Hossain, M.M.; Rahman, S.S. Survival assessment of die-marked drill pipes: Integrated static and fatigue analysis. Eng. Fail. Anal. 1999, 6, 277–299. [Google Scholar] [CrossRef]
- Macdonald, K.; Bjune, J. Failure analysis of drillstrings. Eng. Fail. Anal. 2007, 14, 1641–1666. [Google Scholar] [CrossRef]
- Albdiry, M.T.; Almensory, M.F. Failure analysis of drillstring in petroleum industry: A review. Eng. Fail. Anal. 2016, 65, 74–85. [Google Scholar] [CrossRef]
- Kessai, I.; Benammar, S.; Doghmane, M.Z.; Tee, K.F. Drill Bit Deformations in Rotary Drilling Systems under Large-Amplitude Stick-Slip Vibrations. Appl. Sci. 2020, 10, 6523. [Google Scholar] [CrossRef]
- Skalle, P.; Aamodt, A.; Swahn, I. Detection of Failures and Interpretation of Causes during Drilling Operations. In Proceedings of the Abu Dhabi International Petroleum Exhibition & Conference, Abu Dhabi, United Arab Emirates, 7–10 November 2016. [Google Scholar] [CrossRef]
- Yonggang, L.; Fangpo, L.; Xin, X.; Biyu, Y.; Caihong, L. Simulation Technology in Failure Analysis of Drill Pipe. Procedia Eng. 2011, 12, 236–241. [Google Scholar] [CrossRef] [Green Version]
- Lin, Y.; Qi, X.; Zhu, D.; Zeng, D.; Zhu, H.; Deng, K.; Shi, T. Failure analysis and appropriate design of drill pipe upset transition area. Eng. Fail. Anal. 2013, 31, 255–267. [Google Scholar] [CrossRef]
- Benammar, S.; Khellaf, A.; Mohammedi, K. Solar Tower Power Plants Performance and Reliability Analysis; Solar Power; Bailey, S., Ed.; Nova Science Publishers, Inc.: Hauppauge, NY, USA, 2014. [Google Scholar]
- Benammar, S.; Khellaf, A.; Mohammedi, K. Solar Tower Power Plant Reliability Analysis using FORM method. In Proceedings of the 3ème Conférence Internationale de Mécanique (ICM’2017), Annaba, Algeria, 26–27 April 2017; pp. 26–27. [Google Scholar]
- Benammar, S.; Tee, K.F. Structural reliability analysis of a heliostat under wind load for concentrating solar power. Sol. Energy 2019, 181, 43–52. [Google Scholar] [CrossRef]
- Benammar, S.; Tee, K.F. Failure probability analysis of heliostat systems. Int. J. Crit. Infrastruct. 2020, 16, 342–366. [Google Scholar] [CrossRef]
- Ellyin, F. Fatigue Damage, Crack Growth and Life Prediction; Springer Science & Business Media: Berlin, Germany, 1996. [Google Scholar]
- Ellis, B.A.; Byron, A. Condition based maintenance. Jethro Proj. 2008, 10, 1–5. [Google Scholar]
- Venkatasubramanian, V.; Rengaswamy, R.; Kavuri, S.N. A review of process fault detection and diagnosis: Part II: Qualitative models and search strategies. Comput. Chem. Eng. 2003, 27, 313–326. [Google Scholar] [CrossRef]
- Cawley, P. Non-destructive testing—Current capabilities and future directions. Proc. Inst. Mech. Eng. Part L J. Mater. Des. Appl. 2001, 215, 213–223. [Google Scholar]
- Loya, J.; Aranda-Ruiz, J.; Zaera, R. Natural frequencies of vibration in cracked Timoshenko beams within an elastic medium. Theor. Appl. Fract. Mech. 2022, 118, 103257. [Google Scholar] [CrossRef]
- Tee, K.F. Substructural Identification with Incomplete Measurement for Structural Damage Assessment. Ph.D. Thesis, National University of Singapore, Singapore, 2004. [Google Scholar]
- Poojary, J.; Roy, S.K. In Plane Radial Vibration of Uncracked and Cracked Circular Curved Beams Subjected to Moving Loads. Int. J. Struct. Stab. Dyn. 2021, 21, 2150146. [Google Scholar] [CrossRef]
- Zarabimanesh, Y.; Roodgar Saffari, P.; Roudgar Saffari, P.; Refahati, N. Hygro-thermo-mechanical vibration of two vertically aligned single-walled boron nitride nanotubes conveying fluid. J. Vib. Control 2021, 10775463211006512. [Google Scholar] [CrossRef]
- Wang, T.; Zhang, L.; Tee, K.F. Extraction of real modes and physical matrices from modal testing. Earthq. Eng. Eng. Vib. 2011, 10, 219–227. [Google Scholar] [CrossRef]
- Chen, H.-P.; Tee, K.F.; Ni, Y.-Q. Mode shape expansion with consideration of analytical modelling errors and modal measurement uncertainty. Smart Struct. Syst. 2012, 10, 485–499. [Google Scholar] [CrossRef]
- Thongchom, C.; Jearsiripongkul, T.; Refahati, N.; Saffari, P.R.; Saffari, P.R.; Sirimontree, S.; Keawsawasvong, S. Sound Transmission Loss of a Honeycomb Sandwich Cylindrical Shell with Functionally Graded Porous Layers. Buildings 2022, 12, 151. [Google Scholar] [CrossRef]
- Arefi, M.; Karroubi, R.; Irani-Rahaghi, M. Free vibration analysis of functionally graded laminated sandwich cylindrical shells integrated with piezoelectric layer. Appl. Math. Mech. 2016, 37, 821–834. [Google Scholar] [CrossRef]
- Wang, X.; Li, S. Free vibration analysis of functionally graded material beams based on Levinson beam theory. Appl. Math. Mech. 2016, 37, 861–878. [Google Scholar] [CrossRef]
- Koh, C.G.; Tee, K.F.; Quek, S.T. Condensed Model Identification and Recovery for Structural Damage Assessment. J. Struct. Eng. 2006, 132, 2018–2026. [Google Scholar] [CrossRef]
- Koh, C.G.; Quek, S.T.; Tee, K.F. Damage Identification of Structural Dynamic System. In Proceedings of the 2nd International Conference on Structural Stability and Dynamics, Singapore, 16–18 December 2002; pp. 780–785. [Google Scholar]
- Tamrakar, R.; Mittal, N.D. Crack detection in an overhung rotor system using external harmonic excitation. In Advances in Rotor Dynamics, Control, and Structural Health Monitoring; Springer: Singapore, 2020; pp. 159–169. [Google Scholar]
- Tee, K.F. Time Series Analysis for Vibration-based Structural Health Monitoring: A Review. Struct. Durab. Health Monit. 2018, 12, 129–147. [Google Scholar]
- Haidarpour, A.; Tee, K.F. Finite Element Model Updating for Structural Health Monitoring. Struct. Durab. Health Monit. 2020, 14, 1–17. [Google Scholar] [CrossRef]
- Murigendrappa, S.; Maiti, S.; Srirangarajan, H. Experimental and theoretical study on crack detection in pipes filled with fluid. J. Sound Vib. 2004, 270, 1013–1032. [Google Scholar] [CrossRef]
- Husain, M.A.; Al-Shammari, M.A. Analytical Solution of Free Vibration Characteristics of Partially Circumferential Cracked Cylindrical Shell. J. Mech. Eng. Res. Dev. 2020, 43, 442–454. [Google Scholar]
- Mia, M.S.; Islam, M.S.; Ghosh, U. Modal analysis of cracked cantilever beam by finite element simulation. Procedia Eng. 2017, 194, 509–516. [Google Scholar] [CrossRef]
- Lohar, S.; Mohanty, P.K. Damage Analysis of an Inclined Cracked Curved Beam Using ANFIS. In Advances in Engineering Design; Springer: Singapore, 2021; pp. 611–621. [Google Scholar]
- Jagdale, P.M.; Chakrabarti, M.A. Free vibration analysis of cracked beam. Int. J. Eng. Res. Appl. 2013, 3, 1172–1176. [Google Scholar]
- Tufisi, C.; Gillich, G.-R.; Aman, A.T. The effect of a crack near the fixed end on the natural frequencies of a cantilever beam. Vibroeng. Procedia 2019, 23, 37–42. [Google Scholar]
- Tamrakar, R.; Das Mittal, N.; Singh, R.K. Crack Depth Estimation in Shaft for an Overhung Rotating Shaft System: An Experimental Investigation. J. Fail. Anal. Prev. 2021, 21, 1–13. [Google Scholar] [CrossRef]
- Maurya, M.; Sadarang, J.; Panigrahi, I. Detection of crack in structure using dynamic analysis and artificial neural network. Eng. Solid Mech. 2020, 8, 285–300. [Google Scholar] [CrossRef]
- Thatoi, D.; Guru, P.; Jena, P.K.; Choudhury, S.; Das, H.C. Comparison of CFBP, FFBP, and RBF Networks in the Field of Crack Detection. Model. Simul. Eng. 2014, 2014, 1–13. [Google Scholar] [CrossRef] [Green Version]
- Haeri, H.; Sarfarazi, V.; Zhu, Z. Analysis of Crack Coalescence in Concrete Using Neural Networks. Strength Mater. 2016, 48, 850–861. [Google Scholar] [CrossRef]
- Leissa, A.W.; Qatu, M.S. Vibrations of Continuous Systems; McGraw-Hill Education: New York, NY, USA, 2011. [Google Scholar]
- Benazzouz, D.; Benammar, S.; Adjerid, S. Fault Detection and Isolation Based on Neural Networks Case Study: Steam Turbine. Energy Power Eng. 2011, 3, 513–516. [Google Scholar] [CrossRef] [Green Version]
- Benammar, S.; Mohammedi, K.; Khellaf, A. Prediction of the Central Cavity Receiver’s Performance Using Artificial Neural Network. In Proceedings of the 1st International Conference on Applied Automation and Industrial Diagnostics (ICAADI’ 2015), Djelfa, Algeria, 29–30 March 2015. [Google Scholar]
- Benammar, S.; Benazzouz, D. Fault Detection and Isolation using Levenberg-Marquardt algorithm. In Proceedings of the 6th International Symposium on Hydrocarbons & Chemistry, Boumerdes, Algeria, 13–15 October 2012. [Google Scholar]
- Benammar, S.; Tee, K.F. Criticality Analysis and Maintenance of Solar Tower Power Plants by Integrating the Artificial In-telligence Approach. Energies 2021, 14, 5861. [Google Scholar] [CrossRef]


| Roots (β) | Natural Frequency (rad/s) | Natural Frequency (Hz) | |
|---|---|---|---|
| 1 | 1.8751 | 38.1580 | 6.07 |
| 2 | 4.6941 | 239.1341 | 38.07 |
| 3 | 7.8548 | 669.5872 | 106.62 |
| 4 | 10.995 | 1312 | 208.91 |
| Architecture | Rd2 | Rl2 | R2 |
|---|---|---|---|
| 04-07-02 | 0.993158998 | 0.768087558 | 0.76283307 |
| 04-08-02 | 0.995198236 | 0.90896708 | 0.90460243 |
| 04-09-02 | 0.994833462 | 0.928949733 | 0.92415028 |
| 04-10-02 | 0.996508366 | 0.905812309 | 0.90264954 |
| 04-11-02 | 0.996184314 | 0.932259346 | 0.92870214 |
| 04-12-02 | 0.996479051 | 0.894854435 | 0.8917037 |
| 04-13-02 | 0.99619899 | 0.8310624 | 0.82790352 |
| 04-14-02 | 0.991685358 | 0.834745853 | 0.82780524 |
| 04-15-02 | 0.99365155 | 0.766611206 | 0.76174441 |
| 04-16-02 | 0.991773432 | 0.544142244 | 0.53966582 |
| 04-17-02 | 0.994229828 | 0.75515334 | 0.75079597 |
| 04-18-02 | 0.996177626 | 0.839429186 | 0.83622057 |
| 04-19-02 | 0.997607446 | 0.927806007 | 0.92558618 |
| 04-20-02 | 0.995752093 | 0.77221468 | 0.76893438 |
Publisher’s Note: MDPI stays neutral with regard to jurisdictional claims in published maps and institutional affiliations. |
© 2022 by the authors. Licensee MDPI, Basel, Switzerland. This article is an open access article distributed under the terms and conditions of the Creative Commons Attribution (CC BY) license (https://creativecommons.org/licenses/by/4.0/).
Share and Cite
Kessai, I.; Benammar, S.; Doghmane, M.Z.; Tee, K.F. Estimation of Circular Arc Crack Depths and Locations in Rotary Drilling Pipes Subjected to Free Vibrations. Vibration 2022, 5, 165-182. https://doi.org/10.3390/vibration5010011
Kessai I, Benammar S, Doghmane MZ, Tee KF. Estimation of Circular Arc Crack Depths and Locations in Rotary Drilling Pipes Subjected to Free Vibrations. Vibration. 2022; 5(1):165-182. https://doi.org/10.3390/vibration5010011
Chicago/Turabian StyleKessai, Idir, Samir Benammar, Mohamed Zinelabidine Doghmane, and Kong Fah Tee. 2022. "Estimation of Circular Arc Crack Depths and Locations in Rotary Drilling Pipes Subjected to Free Vibrations" Vibration 5, no. 1: 165-182. https://doi.org/10.3390/vibration5010011
APA StyleKessai, I., Benammar, S., Doghmane, M. Z., & Tee, K. F. (2022). Estimation of Circular Arc Crack Depths and Locations in Rotary Drilling Pipes Subjected to Free Vibrations. Vibration, 5(1), 165-182. https://doi.org/10.3390/vibration5010011