Abstract
Relative Energy Deficiency in sport is experiencing remarkable popularity of late, particularly among female athletes. This condition is underpinned by low energy availability, which is a byproduct of high energy expenditure, inadequate energy intake, or a combination of the two. Several contributing factors exist that may predispose an athlete to low energy availability, and therefore a holistic and comprehensive assessment may be required to identify the root causes. The focus of the current narrative review is to discuss the primary contributing factors as well as known risk factors for low energy availability among female athletes to help practitioners increase awareness on the topic and identify future areas of focus.
1. Introduction
Increased awareness, in combination with improved athlete monitoring capabilities, has resulted in a growing focus on Relative Energy Deficiency in Sport (RED-s) within the sport nutrition literature. The International Olympic Committee published a consensus statement in 2014 [], with subsequent updates in 2018 [], highlighting the importance of bringing awareness to RED-s, prevalence, and directions for future research. RED-s is defined as a state of impaired physiological functioning caused by (chronic) relative energy deficiency, and includes, but is not limited to, impairments of metabolic rate, menstrual function, bone health, immune function, protein synthesis, cardiovascular health, and various indices of physical performance [,]. A common metric used in the identification of risk factors, or diagnosis of RED-s, is the assessment of low energy availability (LEA), which is a metric used to quantify the residual energy available to support the body’s physiological functions after accounting for the energy expenditure from activity [,]. Historically, the Female Athlete Triad has also been an area of focus with significant overlap between RED-s [], both of which are centered on the common themes of energy deficiency and disordered eating patterns. Since insufficient energy supply required to support athletic participation and training is a primary contributor for both RED-s and the Female Athlete Triad, LEA is viewed as a common metric of interest for both conditions. By definition, LEA is a byproduct of inadequate energy intake, high energy expenditure from high training demands, or a combination of the two. However, several underlying risk factors may be present beyond insufficient energy intake or excessive energy expenditure that predispose an athlete to LEA.
The physiological effects, as well as the performance and health implications of RED-s, have been well-studied [,,,]. However, the overlapping nature of underlying contributing factors has yet to be explored completely. While a mismatch between energy intake and energy expenditure is the root cause, it is unclear why certain athletes appear to be more likely to under-fuel and ultimately predispose themselves to LEA and RED-s. Athletes may consciously or unconsciously lower their energy intake, either of which can increase the risk for LEA, particularly if this pattern continues over time. Currently, no explanations are clearly established that detail why some athletes restrict energy intake at times; whereas a number of underlying issues, risk factors, barriers, and complex etiologies are likely present that may predispose one to having LEA, RED-s, or meeting the criteria for the Female Athlete Triad. Such etiological factors may include exercise dependence, body image, disordered eating, or clinical eating disorders. Furthermore, participation in certain sports such as weight-sensitive, weight class, aesthetic, or any sport where it may be presumed that a lower body mass results in improved performance, or all of these factors, which may also exist on a spectrum and are likely to be connected through multiple constructs [,,,,,]. Further, certain barriers such as financial resources, access to nutritional support, and lack of time may also contribute to an athlete’s overall risk for LEA. Due to the diverse and complex nature of the etiologies that underpin the development and risks for LEA and RED-s, it is necessary to provide a multifaceted and holistic view of how these conditions can develop. Figure 1 provides an illustration of a theoretical framework outlining the potential risk factors and contributors to LEA, which will later be discussed in this review.
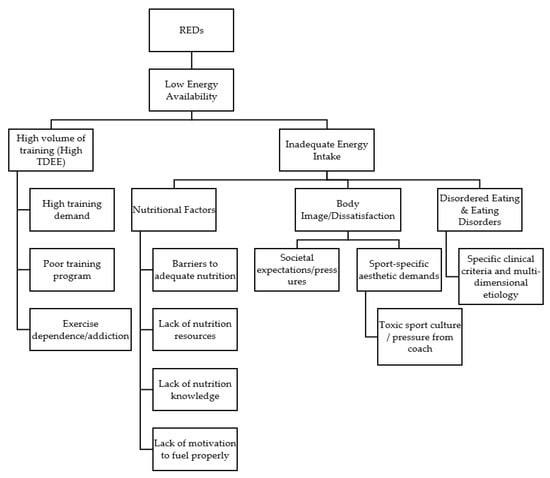
Figure 1.
A theoretical framework outlining potential risk factors and contributors to LEA and RED-s.
It is important to also consider a comprehensive view of these constructs and the spectrum of underlying risk factors that exist in order to more appropriately prevent, screen, and identify those at risk, while also being able to provide treatment when needed. It is important to note, that part of the rationale behind the development of RED-s was to better highlight the possibility that these challenges can also be experienced by males, and they are not solely exclusive to females. Indeed, studies have highlighted the presence of LEA in some male athlete populations, but there appears to be a higher prevalence among female athletes []. This may be partly attributed to underlying body image issues, the culture of their respective sports [], and societal pressure to attain a certain body type or aesthetic appearance [,]. As such, the purpose of this narrative review was to identify known risk factors and to further discuss their contributions to LEA in an effort to recognize areas of overlap and identify directions for future research and interventions specific to female athletes. While it may be difficult to examine the relationships between all risk factors in isolation, in addition to prevalence rates, and the potential for primary causality or predictive odds of having LEA, several areas of focus can be explored and used to establish screening tools and discussion points for future educational programs. For the purpose of the current review, the following six categories will be addressed: prevalence of LEA, nutritional factors impacting dietary behaviors, training demands and energy expenditure, body image, disordered eating, and practical recommendations and future directions.
2. Prevalence of Low Energy Availability
A growing body of research highlights the prevalence of LEA across female athletes, participating in a wide range of sport types and levels of competition []. While multiple strategies exist to quantify LEA, all of them require the assessment of energy intake, body composition, and activity energy expenditure (AEE) []. Energy availability is calculated by subtracting AEE from daily energy intake, which is then expressed per unit of fat-free mass in kilograms [], with <30 kcal·kg FFM−1·day−1 often used as the threshold to categorize energy availability as ‘low’ []. Other strategies may include the use of screening tools such as the low energy availability in females questionnaire (LEAF-Q), which is designed to identify those who may be at increased risk based upon history of symptoms []. While certain sports may pose a higher risk of LEA, recent evidence indicates that LEA can be an issue for athletes competing in any sport [,]. However, athletes participating in sports that require a high volume of training (i.e., endurance and ultra-distance sports), which subsequently results in a high total daily energy expenditure (TDEE), are likely at a greater risk for LEA, as it may be challenging to consume an adequate amount of energy to offset the high energy expenditure from training [,]. Prevalence of LEA among certain National Collegiate Athletic Association (NCAA) Division I athletes has ranged from 41% in cross country runners [] to 51% in track and field athletes []. Further, athletes competing in team field sports with a high aerobic component (i.e., soccer), tend to also be at a higher risk, likely due to the high activity energy expenditures [,] associated with the sport, with prevalence of LEA ranging from 11% [] to 67% [], depending upon the time point throughout the season (i.e., off-season vs. pre-season vs. in-season).
Certain sports, commonly referred to as weight-sensitive sports, in which a low body fat percent, or lower body weight are often desirable, may also pose a higher risk of LEA, as athletes may intentionally restrict food intake to promote weight loss [,,]. Such sports include dance, ballet, figure skating, gymnastics, synchronized swimming, as well as weight-class, and physique sports (i.e., wrestling, mixed martial arts, bodybuilding, and figure competitions). During a 7-day monitoring period Torres-McGehee et al. [] reported that 96.2% of ballet dancers (25/26) were classified has having LEA based upon assessment of energy intake and activity energy expenditure. Additionally, Schaal et al., in 2017 [] found that 100% of the synchronized swimmers assessed, displayed LEA, while Costa et al. [] later in 2018 reported that 52% of synchronized swimmers displayed LEA. Moreover, in the study by Costa et al., the mean resting metabolic rate (RMR) ratio (measured RMR/predicted RMR) ranged from 0.85–0.91, which has been proposed as a risk factor for energy deficiency if the ratio is <0.90 [].
A summary of studies examining the prevalence of LEA among female athletes is provided in Table 1. Readers are also directed to previous reviews on the topic for a more comprehensive summary of LEA [,,]. While temporary energy restriction for the promotion of weight loss is common practice among weight class sports, it is currently unknown how detrimental this practice is in regard to the acute, but cyclical, time spent with LEA for these athletes. More research is needed to determine how much time spent in a LEA state is required, before it begins to elicit health perturbations and decrements in performance. It is worth noting, that a limitation of dichotomously categorizing athletes as those with or without LEA, is that it may not be applicable to all populations and sport types as individual differences may influence the magnitude of health perturbations for those with and without LEA. Moreover, a dichotomous categorization downplays the potential that there is a likely a dose-dependent relationship [], or more of a spectrum, in regards to LEA, and the subsequent impact on health and performance. Further, time spent in a LEA state is also likely to influence the magnitude of health perturbations. Another limitation is the current discordance in the literature regarding the threshold of energy availability at which health perturbations begin to arise. As evidenced, early work by Loucks et al. [,] observed disruptions in luteinizing hormone pulsatility and low triiodothyronine-3 (T3) levels [] at a threshold of energy availability, whereas Reed et al. [] recently observed that energy availability was not associated with menstrual status across the entire spectrum of menstrual disturbances, only appearing to discriminate at clinical extremes—only to be later refuted by Loucks et al. in 2019 []. Lastly, recent evidence [] indicates that low carbohydrate availability may have just as much, if not a greater, influence on health issues compared to LEA alone. Therefore, more work is warranted to elucidate these varying circumstances and confounding variables surrounding the health implications across a spectrum of energy availability values.

Table 1.
Prevalence of low energy availability (LEA) in female athletes.
3. Nutritional Factors Impacting Dietary Behaviors
Inadequate, and potentially inadvertent, energy intake, is known to be a primary contributor to LEA among athletes [] and can be characterized as a component of disordered eating. A key consideration for the determination of energy availability stems from the widespread underestimation of dietary intake that is known to occur in human populations, [,] including athletes [,]. Thus, researchers in this area must take prudent measures to optimize the accuracy of the dietary assessment being completed, so as to not overestimate the prevalence of LEA. In addition, athletes often underestimate the energy demands of their sport, which causes further problems with EA assessment, as well as increasing the likelihood of inadequate energy intake [,]. One potential explanation for this misunderstanding, may stem from confusion in regard to understanding the distinction between dietary strategies for weight loss versus dietary strategies for performance. Oftentimes, healthy eating strategies portrayed in mainstream media have an underlying theme of calorie restriction (directed towards weight loss); therefore, athletes may not understand the distinction between eating for weight loss and eating for performance. As a result, athletes may restrict energy intake under the assumption that restricting certain foods or food groups (i.e., carbohydrates) or following eating patterns, such as time-restricted eating, is considered healthy. While the importance of healthier food options cannot be understated, this can become problematic for athletes who require 2500–4000 kcal·day−1 to maintain energy balance. Collectively, these issues highlight a common finding that athletes have a poor level of sport nutrition knowledge. Previous research has consistently reported poor, insufficient, or inadequate levels of sport nutrition knowledge among a variety of athlete populations from varying levels of competition [,,,,]. However, there has been a large discrepancy in nutrition knowledge scores, most likely resulting from a multitude of factors including education, level of competition, survey tool employed, and available resources (Table 2) [,,]. A summary of studies that have assessed the sport nutrition knowledge of athletes can be found in Table 2. Common themes include a lack of knowledge relative to vitamins and minerals, appropriate fluid and recovery strategies, weight management, and supplement use [,,,,,]. Athletes generally scored higher on sections addressing the consequences of hydration/dehydration, and dietary sources of nutrients [,]. Additionally, previous research has indicated college athletes significantly underestimate their energy and carbohydrate requirements, based upon their level of activity [,]. This underestimation is likely to contribute to a higher risk of LEA, and low carbohydrate availability, as athletes may not appreciate the high energy and carbohydrate intakes recommended for their sport.
Table 2.
Summary of sport nutrition knowledge of female athletes.
Depending upon the age of the athlete, living situation, level of competition, and available resources, several potential barriers exist that may prove challenging for athletes when attempting to adhere to sport-specific nutritional recommendations []. Aside from knowledge, Jagim et al. [] reported the top barriers among a cohort of NCAA Division III athletes were financial restrictions (36%), lack of time (12%), and poor access to food options (12%). In addition, food cost is a well-recognized concern for athletes living away from home with limited income [,]. Such athletes are balancing sport demands (i.e., training schedule, game schedule, travel schedule) with other stressors including school, work, social obligations, and family responsibilities, which may inhibit meal and snack preparation []. In turn, busy schedules may limit accessibility to healthier food options and subsequently increase the likelihood of choosing convenient and affordable options such as ‘fast food’. Moreover, collegiate athletes living on campus may not have sufficient cooking spaces or appliances, further reducing options in regard to preparing food. Furthermore, athletes, coaches, and dietitians have reported limited access to nutrient-dense foods when traveling, as well as in dining halls, dormitories, and sporting facilities [].
Previous work has indicated that access to a sports dietitian can positively influence nutritional behaviors [,]. Hull et al. [] reported that when a sports dietitian was indicated as the athlete’s primary nutrition source, athletes appeared to have a greater understanding of nutrient periodization, consumed less fast food, were more likely to have school-provided boxed meals while on team trips, and were more likely to prepare their own meals [,]. Therefore, accessibility to a sports dietitian may result in improved nutrition knowledge and dietary habits. Unfortunately, not all athletic departments and institutions may have the necessary financial resources to employ these valuable personnel. In summary, these barriers suggest athletes may benefit from sport-specific nutrition education, financial and time management strategies, and food accessibility options.
4. Training Demands and Energy Expenditure
Total daily energy expenditure (TDEE) is the total amount of energy expended in one day, and is the sum of basal metabolic rate (BMR; representing 60–80% of TDEE), activity energy expenditure (15–30% of TDEE), and the thermic effect of food (10% of TDEE) []. The TDEE fluctuates as a result of sport training, sport season, and level of performance [,]. The achievement of energy balance, which occurs when intake is equal to TDEE, is important to maximize sport performance while minimizing the loss of fat free mass [], injury risk [], infection [], and risk of developing LEA []. Similarly, to maintain an adequate level of energy availability (>40 kcal·kg FFM·day−1), a higher energy intake is needed as activity energy expenditure increases to compensate for the increased energy output and ensure adequate energy is available to support the body’s physiological requirements. Table 3 provides a summary of studies examining TDEE and activity energy expenditure of female athletes competing in various sports. These studies highlight that TDEE of athletes varies across sports and can range from 2300–3500 kcal·day−1, or 30–50 kcal·kg·day−1 when normalized to body mass, which is higher than a typical sedentary adult (1800–2200 kcal·day−1) []. The majority of those competing in team sports (e.g., soccer, basketball, lacrosse) appear to expend approximately 2500–3000 kcal·day−1 which can depend upon the type of training or competition [], and phase of the season [,,]. If resting metabolic rate is known, either through direct assessment or use of prediction equations, physical activity levels (PAL) can be calculated by dividing TDEE by the resting metabolic rate. This is a way to assess the energy demands of training and daily activities, relative to baseline metabolic requirements and also serves as a practical way to estimate daily energy requirements for athletes. As seen in Table 3, PAL values can range from 1.5 to 2.2 depending on the sport and phase of the season, with ultra-distance sports or periods of high training volume potentially elevating PAL values up to ~3. While not able to independently identify athletes at risk for LEA as energy intake is not accounted for, high (>1.7) PAL values would signify a high TDEE value, relative to the individual, and therefore would warrant focused efforts to increase energy intake. It is important to also add that fluctuations in TDEE, and subsequently PAL values, are likely to occur throughout different phases of a season [,], and across different types of training days []. Therefore, PAL values could be used in combination with other metrics to potentially screen those at risk of LEA throughout various training phases of a calendar year.
Table 3.
Summary of activity and total daily energy expenditures of female athletes.
For most, matching TDEE with increased energy intakes should be attainable with a conscious effort to increase food consumption throughout the day. However, ultradistance athletes or multi-stage endurance competitions (i.e., Tour de France) may be the exception, as TDEE values have been reported to exceed 10,000 [] and 6000 kcal·day−1 [], respectively, which may prove challenging for athletes to consume a sufficient energy intake to maintain energy balance during such rigorous competitions. Regardless, a failure to increase energy intake in response to elevated activity levels is likely the primary issue for most athletes, rather than excessive TDEE values, in terms of contributors to LEA. Additionally, it is worth noting that the frequency of days spent in a negative energy balance or with LEA is likely a key component of how detrimental energy deficiencies may be on performance and health parameters; however, more research is warranted to fully elucidate these associations to support this hypothesis. It is important to realize the amount of energy expended during training and throughout the entirety of a day to facilitate the adoption of effective nutritional strategies. Sufficient fueling and nutritional periodization strategies during periods of high energy expenditure are essential for avoiding low energy states, optimizing performance, and maintaining health.
Another area of concern regarding high TDDE values for athletes is the concept of exercise dependence. Exercise dependence, also commonly referred to as exercise addiction or compulsive exercise, represents a behavioral pattern in which individuals feel constantly pressured to exercise, even at what would be considered excessive levels of activity, regardless of the potential harmful effects [,]. While not always the intent, exercise dependance is likely to be associated with negative energy balance and weight loss []. Further, exercise dependence has also been previously associated with eating disorder behaviors, which are factored in to the diagnostic criteria [], and further highlights the need for behavioral modification therapy for those suffering from these overlapping and problematic behaviors []. While it may be intentional at times, exercise dependence can also contribute to increased energy expenditure and further predispose an athlete to LEA and RED-s as has been observed in males []; however, mixed findings have been reported in regards to a similar relationship being present in females [,], warranting further work in this area to explore the role of exercise dependence as a risk factor for RED-s. Similarly, athletes may also increase exercise activities, in addition to or outside of regular sport activities, in a conscious effort to increase energy expenditure with the intent to lose weight. This is a common practice among wrestlers trying to make weight for competition []. Again, while intentional at times, this may still represent an area of concern for athletes if they are exercising at levels considered to be excessive and beyond the regular demands of their sport. This behavior may in turn increase their risk for overtraining or compromise recovery, both of which may be further exacerbated if energy is being simultaneously restricted []. Together, these strategies are common weight cutting strategies employed by wrestlers [] and other combat sport athletes [] that warrant careful oversight.
5. Body Image
Historically, the term body image refers to the internalization of how one views oneself regarding their body and outward physical appearance, which can subsequently influence cognitive, emotional, and behavioral aspects [,]. Body image is largely influenced by society and mass media, and more recently, social media platforms [,]. A framework centered around body image and eating disturbances, known as the tripartite model of influence, hypothesizes that societal influences such as media, peers, and parents have a strong influence on the internalization of a ‘thin ideal’ body type for young females []. This framework has been associated with eating disturbances, body dissatisfaction, and low self-esteem, with a drive for thinness commonly associated with aforementioned disordered eating and body dissatisfaction that frequently co-exist in young females []. Body dissatisfaction occurs when individuals feel that their internal view of self-body image does not align with what they perceive as an ‘ideal body’ and is frequently associated with a drive for thinness. Therefore, body dissatisfaction is seen as a risk factor for disordered eating patterns [,], and is common among athletes who present with disordered eating patterns. Body dissatisfaction can often lead to an intentional restriction of food intake or excessive exercising in an effort to alter body appearance [,].
Despite athletes often being leaner than non-athlete populations, research has found that some athletes may compartmentalize their ‘sporting’ body and their ‘social’ body, in which they understand their body type might be more favorable when compared to non-athlete populations. However, previous work has indicated that athletes may have stricter expectations for their ‘sporting’ body and may still feel a level of dissatisfaction [,]. Further, influences from society and social media may leave athletes feeling pressured to conform to a certain body type standard or aesthetic appearance, regardless of the impact upon sport performance, are more increasingly present [,]. While body image and dissatisfaction may be an issue for both male and female athletes, previous research has primarily focused upon female athletes []. Further, there are several sports in which there is pressure and unwritten expectations to look a certain way or have a certain body type. Often, these expectations are centered around being small statured, petite, lean, or ‘light’ (in the context of body weight), with the belief that it may improve physical performance or appease judges if subjective assessments are integral to the sport (e.g., gymnastics, figure skating, synchronized swimming) []. This may partially explain why athletes who compete in leanness-focused sports tend to have higher rates of disordered eating compared to sports that do not have weight class, body shape, or body weight expectations and degrees of subjectivity []. Importantly, not all such cases of distorted body image are in these types of sports as a previous study completed in female rugby athletes (a strength and power, collision sports, with an emphasis on lean body mass) also reported athletes who struggle with body image [].
Body dissatisfaction can lead athletes to believe they are overweight and need to lose weight, regardless of their weight status or body fat percentage. Previous work has identified a higher percentage of lean women, compared to men, self-report a perception of being overweight and acknowledge multiple weight loss attempts, despite already having a normal or low body mass index []. In a sample of NCAA DI women equestrian athletes, the athletes perceived size of their body was significantly larger than their actual body size, which was also accompanied by the desire to wear smaller clothing and uniform sizes []. Similarly, Jagim et al. [] noted that 35% of the collegiate women athletes assessed, reported a desire to lose weight, despite having a collective mean body fat percentage of 24% and a mean body mass index of 23.3 kg·m2, which places them in the ‘fair/poor’ body composition range and ‘normal weight’ categories for women. In support of previous work [,], Reed et al., 2013 [] reported a higher level of body dissatisfaction in collegiate soccer athletes with LEA, indicating that body dissatisfaction may represent a potential causative factor in regard to LEA and RED-s. Additionally, when examining the team as a whole, Reed et al., 2013 [] reported that a negative relationship existed between energy availability, body dissatisfaction, and a drive for thinness [].
The overlapping nature of body dissatisfaction and restrictive eating habits may predispose those dissatisfied with their body image or with a high drive for thinness to employ restrictive eating behaviors in order to achieve their desired body image []. The importance of screening such athletes for disordered eating cannot be overemphasized and plays an important role in the prevention and treatment of athletes with RED-s.
6. Disordered Eating
To determine the appropriate course of action or necessary treatment, a distinction should be made between disordered eating and a clinical eating disorder. As seen in Figure 2, within the field of sports nutrition, disordered eating operates on a spectrum of severity, which may be signified by: (A) mismatches between energy intake and energy expenditure; (B) poor dietary habits (e.g., infrequent eating frequency, skipping meals, eating excessive amounts of fast food or ‘junk’ food); (C) poor nutrient density in the diet; (D) concerns of body weight (often leading to use of binge eating, laxatives, diuretics, diet pills and other extreme weight loss measures); or (E) any other abnormal dietary pattern [,].
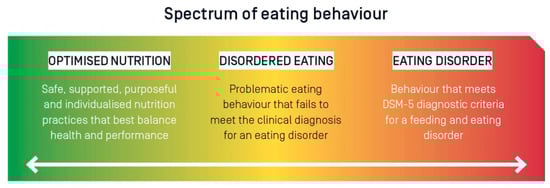
Figure 2.
The spectrum of eating behaviour in the high performance athlete from optimised nutrition to disordered eating to eating disorders. DSM-5, Diagnostic and Statistical Manual of Mental Disorders, Fifth Edition. Figure originally published by: Wells, K.R., et al. The Australian Institute of Sport (AIS) and National Eating Disorders Collaboration position statement on disordered eating in high performance sport. Br. J. Sports Med. 2020 Nov; 54(21): 1247–1258.
Conversely, a clinical eating disorder is a diagnosable condition that meets the criteria established by the Diagnostic and Statistical Manual of Mental Disorders (DSM) published by the American Psychiatric Association and is an example of a more problematic pattern of eating behavior []. A recent consensus statement from the International Olympic Committee outlined important characteristics and traits to distinguish between the two []. In both scenarios, treatment often requires a multidisciplinary approach from behavioral health experts, registered dieticians, and sports medicine practitioners. Moreover, in both conditions, athletes rarely self-report symptoms, typically hiding the behaviors until they become problematic, which oftentimes leads to more severe health outcomes []. Further, LEA and RED-s can occur with or without a clinically diagnosed eating disorder []; therefore, any athlete with a disordered eating pattern should be considered at risk for RED-s.
Estimates indicate that the overall prevalence of disordered eating and/or eating disorders among athletes ranges from 0 to 19% in men and 6 to 45% in women [], both of which are higher than non-athletes, which is estimated to be 0.7–2.2% and 2.2–8.4% for adult men and women, respectively []. Previous literature identified ~25% of NCAA DI collegiate athletes from a variety of sports including gymnastics, softball, synchronized swimming, tennis, basketball, lacrosse, soccer, cross country, cheerleading, diving, field hockey, swimming, and track and field to exhibit disordered eating behaviors []. Further, several studies have examined the relationship between disordered eating and sport type, specifically the differences between lean sports, where an emphasis is placed upon low body weight and physique, versus non-lean or ball sports [,,,,,]. Underlying risk factors that were identified with the onset of eating disorders include participation in weight-sensitive sports with a pressure to maintain a lower body weight or leaner physique []. Previous literature has also reported wrestlers and gymnasts have a greater drive for thinness as well as a higher incidence of food restriction and purging behaviors compared to other sports []. However, athletes of any body size and composition can exhibit disordered eating patterns. Arthur-Cameselle and Quatromoni [] identified internal factors such as Negative Mood States, Low Self Esteem, Perfectionism/Drive for Achievement, and Desire for Control and external factors including Negative Influences on Self-Esteem, Hurtful Relationships, Hurtful Role Models, and Sport Performance to be associated with eating disorders in women collegiate athletes. Ravi et al. [] identified that a prior history of eating disorders was associated with menstrual dysfunction and injury rate, which are known health issues associated with RED-s. While there are several known risk factors associated with the development of both disordered eating patterns and clinically diagnosed eating disorders, there continues to be a need for more work in this area, particularly among athlete populations to develop more efficient screening tools and educational interventions in an effort to reduce the severity and associated health consequences when these issues are not addressed. Figure 3 provides an illustration of an etiological model demonstrating the potential interplay between eight risk or causal risk constructs considered as factors in the development of disordered eating in athletes.
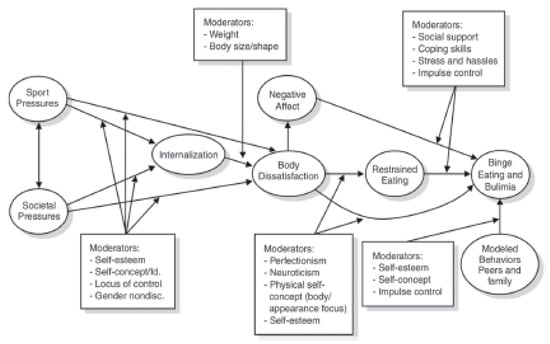
Figure 3.
Etiological model showing the interplay of eight risk or causal risk constructs (shown in circles) considered as factors in the development of disordered eating in athletes (Petrie & Greenleaf, 2012). Used with permission from license # 5232220735165, granted on 18 January 2022. Cited within Stoyel, H., Slee, A., Meyer, C., Serpell, L. Systematic review of risk factors for eating psychopathology in athletes: A critique of an etiological model. Eur. Eat Disord. Rev. 2020 Jan; 28(1): 3–25.
Another common behavioral pattern that may play a role with disordered eating in athletes is orthorexia nervosa, which is described as a pathological fixation on healthy eating []. This condition may predispose athletes to feel pressured to eat healthy foods, which may lead to a compulsive pattern of eating and lead to restrictive eating, malnourishment, nutrient deficiencies, in addition to isolation and anxiety regarding the more social aspects of eating. While more commonly reported in fitness enthusiast and gym attendees, previous work has identified athletes and sport participation to be risk factors for orthorexia nervosa []. While recognized as a problematic behavioral eating pattern, orthorexia nervosa does not currently meet the DSM criteria for a clinical eating disorder. However, it is still important for practitioners to be aware of the warning signs and provide support to athletes who exhibit the problematic eating patterns associated with this condition.
Athletes with access to a registered dietitian tend to display better eating behaviors than those without access. Further, athletes without access to a registered dietitian are more likely to seek nutrition information from a coach, [] which could be problematic depending upon the coach’s level of sport nutrition knowledge []. For example, when coaches lack proper nutrition knowledge and an understanding of the risks associated with LEA, they may inappropriately instruct athletes to lose weight or follow feeding approaches that do not adequately deliver the energy and nutrients for optimal health and performance. Moreover, an established culture of emphasizing and creating pressure to lose weight can create an unhealthy, toxic culture that has been reported to elicit disordered eating behaviors, body dissatisfaction, and result in eating disorders [,,]. Therefore, it is recommended that athletes have access to a sports dietitian, but if not feasible, then the design and implementation of sports nutrition education programs for coaches and athletes is suggested.
7. Practical Recommendations and Future Directions
In conclusion, there are areas in need of further research to address LEA and RED-s in female athletes. The underlying cause of LEA is likely multifactorial as several of the potential risk factors have been discussed in the current review. Recognizing the signs of disordered eating and clinical eating disorders is imperative for identification of those at risk of RED-s. However, it is worth noting that even in the absence of LEA, inadequate energy intake or a misalignment of dietary habits with sport-specific nutritional recommendations may also result in performance or health decrements. Additionally, the aforementioned psycho-social behaviors should also be monitored to ensure a healthy body image and subsequent relationship with food. Further, examining the root cause of any disordered eating patterns using a holistic screening process may help to improve the issue and reduce the likelihood of future problems. While LEA is one of the more common metrics used to identify those at risk for energy deficiency, other factors such as poor nutrition knowledge, high TDEEs, disordered eating behavior patterns, and body dissatisfaction can also be used to identify those at risk as they are also likely to increase the likelihood of LEA, both independently and concomitantly, ultimately predisposing athletes to RED-s. Further, a limitation of only using LEA, particularly when using as a dichotomous categorical-based metric, is that it may overlook other contextual factors and problematic behaviors that may also warrant attention. Therefore, as mentioned earlier, completing a comprehensive screening of an athlete to consider a multitude of potential risk factors is necessary. A summary of commonly used screening tools for LEA, eating disorders, body dissatisfaction, and female athlete triad is provided in Table 4.
Table 4.
A summary of validated screening tools used to identify those at risk for low energy availability, eating disorders, female athlete triad, or body dissatisfaction.
While the obvious strategy for correcting LEA is to focus on increasing energy intake or reducing activity energy expenditure [], as discussed in the current review, underlying issues such as disordered eating tendencies or body image concerns may contribute to the issue of LEA and therefore warrant attention. As such, early educational interventions will likely be instrumental in helping improve any behavioral tendencies (e.g., energy restriction, exercise dependance, etc.) that predispose athletes to LEA. Fortunately, several of the health perturbations associated with RED-s, such as menstrual dysfunction or bone health (i.e., reductions in bone mineral density or history of stress fractures), can be improved upon over time, if proper corrective actions are taken [,]. Practitioners should refer to the RED-s Risk Assessment Model and the Triad return to play model in making an informed decision regarding sport participation and return-to-play for diagnosed athletes [,,,]. Additionally, Figure 4 provides an illustration of a working model for a disordered eating management protocol for outpatient settings that outlines action items, potential interventions, and key personnel required to address this issue in athletes.
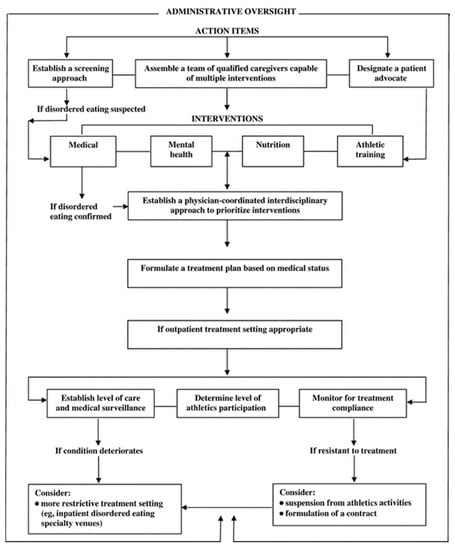
Figure 4.
Disordered-eating management protocol: outpatient setting. Figure originally published by: Bonci, C.M., Bonci, L.J., Granger, L.R., Johnson, C.L., Malina, R.M., Milne, L.W., Ryan, R.R., Vanderbunt, E.M. National Athletic Trainers’ Association Position Statement: Preventing, Detecting, and Managing Disordered Eating in Athletes. J. Athl. Train 2008 Jan–Feb; 43(1): 80–108.
While difficult to ascertain in research settings, it cannot be overlooked that some athletes may underestimate the value of optimal sport nutrition practices and, therefore, may not prioritize optimal fueling strategies. Anecdotally, several athletes may simply choose not to adhere to recommended dietary strategies and skip meals or peri-workout feeding opportunities as they choose not to prioritize these strategies or do not understand their importance. These issues are likely exacerbated when athletes do not have adequate nutritional support services or access to sport dieticians or other knowledgeable professionals who can provide sound guidance [,]. It is recommended future research focus on the development and employment of educational interventions to help athletes understand the specific nutritional requirements of their sport and the detrimental health and performance outcomes of under-fueling. Embracing the requirement of a high energy intake and having a physique or bodyweight that enables optimal performance and health should be a primary goal for every athlete regardless of societal expectations.
While energy deficiency continues to be a focus of sport nutrition-related research, it is clear that more work is needed in this area. Below is a list of potential areas needing to be further explored in this area:
- The development of more efficient screening tools to identify those at risk of RED-s and the female (and male) athlete triad, particularly those encompassing the multi-factorial nature of underlying risk factors.
- Develop a better understanding of the specific health and performance implications of energy deficiencies across a spectrum of energy availability ranges:
- Metabolic dysfunction;
- Hormonal disturbances;
- Menstrual dysfunction;
- Bone health;
- Immune function;
- Performance implications.
- Evaluate time-dependent effects of varying ranges of energy availability values to examine how long of a state of energy deficiency can be maintained prior to the onset of health and performance decrements.
- Assess the efficacy of refeeding strategies for athletes competing in weight-class or aesthetic based sports where a state of energy deficiency is often required to lose weight or reduce body fat.
- Evaluate the efficacy of various educational-based interventions to educate athletes on the importance of fueling strategies to support their performance and health.
Author Contributions
Conceptualization, A.R.J. and J.F.; methodology, A.R.J. and J.F.; formal analysis, A.R.J. and J.F.; data curation, A.R.J. and J.F.; writing—original draft preparation, A.R.J., J.F., M.K.M. and M.T.J.; writing—review and editing, A.R.J., J.F., M.K.M., M.T.J. and C.M.K.; project administration, A.R.J. All authors have read and agreed to the published version of the manuscript.
Funding
No funding was provided to support this article.
Institutional Review Board Statement
Not applicable.
Informed Consent Statement
Not applicable.
Data Availability Statement
Data sharing not applicable: No new data were created or analyzed in this study.
Conflicts of Interest
The authors of this manuscript received no financial remuneration for preparing and reviewing this paper from outside sources. C.M.K. and A.R.J. have consulted with and received external funding from companies who sell certain dietary ingredients and have received remuneration from companies for delivering scientific presentations at conferences. C.M.K. and A.R.J. also write for online and other media outlets on topics related to exercise and nutrition. C.M.K. also reports serving on advisory boards and being paid in advisory capacities from companies that manufacture various dietary ingredients including protein. None of these entities had any role in the design of the paper, collection, analyses, or interpretation of data; in the writing of the manuscript, or in the decision to publish this paper.
References
- Mountjoy, M.; Sundgot-Borgen, J.; Burke, L.; Carter, S.; Constantini, N.; Lebrun, C.; Meyer, N.; Sherman, R.; Steffen, K.; Budgett, R.; et al. The IOC consensus statement: Beyond the Female Athlete Triad—Relative Energy Deficiency in Sport (RED-S). Br. J. Sports Med. 2014, 48, 491–497. [Google Scholar] [CrossRef]
- Mountjoy, M.; Sundgot-Borgen, J.K.; Burke, L.M.; Ackerman, K.E.; Blauwet, C.; Constantini, N.; Lebrun, C.; Lundy, B.; Melin, A.K.; Meyer, N.L.; et al. IOC consensus statement on relative energy deficiency in sport (RED-S): 2018 update. Br. J. Sports Med. 2018, 52, 687–697. [Google Scholar] [CrossRef] [Green Version]
- Logue, D.M.; Madigan, S.M.; Melin, A.; Delahunt, E.; Heinen, M.; Donnell, S.M.; Corish, C.A. Low Energy Availability in Athletes 2020: An Updated Narrative Review of Prevalence, Risk, Within-Day Energy Balance, Knowledge, and Impact on Sports Performance. Nutrients 2020, 12, 835. [Google Scholar] [CrossRef] [Green Version]
- Williams, N.I.; Koltun, K.J.; Strock, N.C.A.; De Souza, M.J. Female Athlete Triad and Relative Energy Deficiency in Sport: A Focus on Scientific Rigor. Exerc. Sport Sci. Rev. 2019, 47, 197–205. [Google Scholar] [CrossRef]
- Melin, A.K.; Heikura, I.A.; Tenforde, A.; Mountjoy, M. Energy Availability in Athletics: Health, Performance, and Physique. Int. J. Sport Nutr. Exerc. Metab. 2019, 29, 152–164. [Google Scholar] [CrossRef]
- Loucks, A.B.; Kiens, B.; Wright, H.H. Energy availability in athletes. J. Sports Sci. 2011, 29, 15–24. [Google Scholar] [CrossRef]
- Kong, P.; Harris, L.M. The sporting body: Body image and eating disorder symptomatology among female athletes from leanness focused and nonleanness focused sports. J. Psychol. 2015, 149, 141–160. [Google Scholar] [CrossRef]
- Byrne, S.; McLean, N. Elite athletes: Effects of the pressure to be thin. J. Sci. Med. Sport 2002, 5, 80–94. [Google Scholar] [CrossRef]
- Kantanista, A.; Glapa, A.; Banio, A.; Firek, W.; Ingarden, A.; Malchrowicz-Mosko, E.; Markiewicz, P.; Ploszaj, K.; Ingarden, M.; Mackowiak, Z. Body Image of Highly Trained Female Athletes Engaged in Different Types of Sport. BioMed Res. Int. 2018, 2018, 6835751. [Google Scholar] [CrossRef]
- Bell, H.S.; Donovan, C.L.; Ramme, R. Is athletic really ideal? An examination of the mediating role of body dissatisfaction in predicting disordered eating and compulsive exercise. Eat. Behav. 2016, 21, 24–29. [Google Scholar] [CrossRef]
- Burke, L.M.; Lundy, B.; Fahrenholtz, I.L.; Melin, A.K. Pitfalls of Conducting and Interpreting Estimates of Energy Availability in Free-Living Athletes. Int. J. Sport Nutr. Exerc. Metab. 2018, 28, 350–363. [Google Scholar] [CrossRef]
- Melin, A.; Tornberg, A.B.; Skouby, S.; Faber, J.; Ritz, C.; Sjodin, A.; Sundgot-Borgen, J. The LEAF questionnaire: A screening tool for the identification of female athletes at risk for the female athlete triad. Br. J. Sports Med. 2014, 48, 540–545. [Google Scholar] [CrossRef]
- Logue, D.; Madigan, S.M.; Delahunt, E.; Heinen, M.; Mc Donnell, S.J.; Corish, C.A. Low Energy Availability in Athletes: A Review of Prevalence, Dietary Patterns, Physiological Health, and Sports Performance. Sports Med. 2018, 48, 73–96. [Google Scholar] [CrossRef]
- Loucks, A.B. Low energy availability in the marathon and other endurance sports. Sports Med. 2007, 37, 348–352. [Google Scholar] [CrossRef]
- Melin, A.; Tornberg, A.B.; Skouby, S.; Moller, S.S.; Sundgot-Borgen, J.; Faber, J.; Sidelmann, J.J.; Aziz, M.; Sjodin, A. Energy availability and the female athlete triad in elite endurance athletes. Scand. J. Med. Sci. Sports 2015, 25, 610–622. [Google Scholar] [CrossRef]
- Beermann, B.L.; Lee, D.G.; Almstedt, H.C.; McCormack, W.P. Nutritional Intake and Energy Availability of Collegiate Distance Runners. J. Am. Coll. Nutr. 2020, 39, 747–755. [Google Scholar] [CrossRef]
- Day, J.; Wengreen, H.; Heath, E.; Brown, K. Prevalence of low energy availabiilty in collegiate female runners and implementation of nutrition education intervention. Sports Nutr. Ther. 2015, 1, 101. [Google Scholar] [CrossRef] [Green Version]
- Magee, M.K.; Lockard, B.L.; Zabriskie, H.A.; Schaefer, A.Q.; Luedke, J.A.; Erickson, J.L.; Jones, M.T.; Jagim, A.R. Prevalence of Low Energy Availability in Collegiate Women Soccer Athletes. J. Funct. Morphol. Kinesiol. 2020, 5, 96. [Google Scholar] [CrossRef]
- Reed, J.L.; De Souza, M.J.; Williams, N.I. Changes in energy availability across the season in Division I female soccer players. J. Sports Sci. 2013, 31, 314–324. [Google Scholar] [CrossRef]
- Torres-McGehee, T.M.; Emerson, D.M.; Pritchett, K.; Moore, E.M.; Smith, A.B.; Uriegas, N.A. Energy Availability with or without Eating Disorder Risk in Collegiate Female Athletes and Performing Artists. J. Athl. Train. 2020, 56, 993–1002. [Google Scholar] [CrossRef]
- Schaal, K.; Tiollier, E.; Le Meur, Y.; Casazza, G.; Hausswirth, C. Elite synchronized swimmers display decreased energy availability during intensified training. Scand. J. Med. Sci. Sports 2017, 27, 925–934. [Google Scholar] [CrossRef] [PubMed]
- Costa, P.B.; Richmond, S.R.; Smith, C.R.; Currier, B.; Stecker, R.A.; Gieske, B.T.; Kemp, K.; Witherbee, K.E.; Kerksick, C.M. Physiologic, Metabolic, and Nutritional Attributes of Collegiate Synchronized Swimmers. Int. J. Sports Physiol. Perform. 2019, 14, 658–664. [Google Scholar] [CrossRef]
- Staal, S.; Sjodin, A.; Fahrenholtz, I.; Bonnesen, K.; Melin, A.K. Low RMRratio as a Surrogate Marker for Energy Deficiency, the Choice of Predictive Equation Vital for Correctly Identifying Male and Female Ballet Dancers at Risk. Int. J. Sport Nutr. Exerc. Metab. 2018, 28, 412–418. [Google Scholar] [CrossRef]
- Ihle, R.; Loucks, A.B. Dose-response relationships between energy availability and bone turnover in young exercising women. J. Bone Min. Res. 2004, 19, 1231–1240. [Google Scholar] [CrossRef] [PubMed]
- Loucks, A.B.; Thuma, J.R. Luteinizing hormone pulsatility is disrupted at a threshold of energy availability in regularly menstruating women. J. Clin. Endocrinol. Metab. 2003, 88, 297–311. [Google Scholar] [CrossRef] [PubMed] [Green Version]
- Loucks, A.B.; Verdun, M.; Heath, E.M. Low energy availability, not stress of exercise, alters LH pulsatility in exercising women. J. Appl. Physiol. 1998, 84, 37–46. [Google Scholar] [CrossRef]
- Loucks, A.B.; Heath, E.M. Induction of low-T3 syndrome in exercising women occurs at a threshold of energy availability. Am. J. Physiol. 1994, 266, R817–R823. [Google Scholar] [CrossRef]
- Reed, J.L.; De Souza, M.J.; Mallinson, R.J.; Scheid, J.L.; Williams, N.I. Energy availability discriminates clinical menstrual status in exercising women. J. Int. Soc. Sports Nutr. 2015, 12, 11. [Google Scholar] [CrossRef] [Green Version]
- Loucks, A.B. No Evidence of Absence of an Energy Availability Threshold for Menstrual Disturbances. Med. Sci. Sports Exerc. 2019, 51, 1790. [Google Scholar] [CrossRef]
- McKay, A.K.A.; Peeling, P.; Pyne, D.B.; Tee, N.; Whitfield, J.; Sharma, A.P.; Heikura, I.A.; Burke, L.M. Six Days of Low Carbohydrate, Not Energy Availability, Alters the Iron and Immune Response to Exercise in Elite Athletes. Med. Sci. Sports Exerc. 2021, 54, 377–387. [Google Scholar] [CrossRef]
- Morehen, J.; Rosimus, C.; Cavanagh, B.P.; Hambly, C.; Speakman, J.R.; Elliot-Sale, K.J.; Hannon, M.P.; Morton, J.P. Energy Expenditure of Female International Standard Soccer Players: A Doubly Labelled Water Investigation. Med. Sci. Sports Exerc. 2021; Published ahead of Print. [Google Scholar] [CrossRef]
- Cherian, K.S.; Sainoji, A.; Nagalla, B.; Yagnambhatt, V.R. Energy Balance Coexists with Disproportionate Macronutrient Consumption across Pretraining, During Training, and Posttraining Among Indian Junior Soccer Players. Pediatr. Exerc. Sci. 2018, 30, 506–515. [Google Scholar] [CrossRef] [PubMed]
- Moss, S.L.; Randell, R.K.; Burgess, D.; Ridley, S.; Ócairealláin, C.; Allison, R.; Rollo, I. Assessment of energy availability and associated risk factors in professional female soccer players. Eur. J. Sport Sci. 2021, 21, 861–870. [Google Scholar] [CrossRef] [PubMed]
- Heikura, I.A.; Uusitalo, A.L.T.; Stellingwerff, T.; Bergland, D.; Mero, A.A.; Burke, L.M. Low Energy Availability Is Difficult to Assess but Outcomes Have Large Impact on Bone Injury Rates in Elite Distance Athletes. Int. J. Sport Nutr. Exerc. Metab. 2018, 28, 403–411. [Google Scholar] [CrossRef] [Green Version]
- Melin, A.; Tornberg, A.B.; Skouby, S.; Moller, S.S.; Faber, J.; Sundgot-Borgen, J.; Sjodin, A. Low-energy density and high fiber intake are dietary concerns in female endurance athletes. Scand. J. Med. Sci. Sports 2016, 26, 1060–1071. [Google Scholar] [CrossRef] [PubMed]
- Schaal, K.; VanLoan, M.D.; Hausswirth, C.; Casazza, G.A. Decreased energy availability during training overload is associated with non-functional overreaching and suppressed ovarian function in female runners. Appl. Physiol. Nutr. Metab. 2021, 46, 1179–1188. [Google Scholar] [CrossRef]
- Viner, R.T.; Harris, M.; Berning, J.R.; Meyer, N.L. Energy Availability and Dietary Patterns of Adult Male and Female Competitive Cyclists With Lower Than Expected Bone Mineral Density. Int. J. Sport Nutr. Exerc. Metab. 2015, 25, 594–602. [Google Scholar] [CrossRef] [PubMed]
- Zabriskie, H.A.; Currier, B.S.; Harty, P.S.; Stecker, R.A.; Jagim, A.R.; Kerksick, C.M. Energy Status and Body Composition Across a Collegiate Women’s Lacrosse Season. Nutrients 2019, 11, 470. [Google Scholar] [CrossRef] [Green Version]
- Zanders, B.R.; Currier, B.S.; Harty, P.S.; Zabriskie, H.A.; Smith, C.R.; Stecker, R.A.; Richmond, S.R.; Jagim, A.R.; Kerksick, C.M. Changes in Energy Expenditure, Dietary Intake, and Energy Availability Across an Entire Collegiate Women’s Basketball Season. J. Strength Cond. Res. 2021, 35, 804–810. [Google Scholar] [CrossRef]
- Braun, H.; von Andrian-Werburg, J.; Schanzer, W.; Thevis, M. Nutrition Status of Young Elite Female German Football Players. Pediatr. Exerc. Sci. 2018, 30, 157–167. [Google Scholar] [CrossRef]
- Woodruff, S.J.; Meloche, R.D. Energy availability of female varsity volleyball players. Int. J. Sport Nutr. Exerc. Metab. 2013, 23, 24–30. [Google Scholar] [CrossRef]
- Civil, R.; Lamb, A.; Loosmore, D.; Ross, L.; Livingstone, K.; Strachan, F.; Dick, J.R.; Stevenson, E.J.; Brown, M.A.; Witard, O.C. Assessment of Dietary Intake, Energy Status, and Factors Associated With RED-S in Vocational Female Ballet Students. Front. Nutr. 2018, 5, 136. [Google Scholar] [CrossRef] [PubMed]
- Stubbs, R.J.; O’Reilly, L.M.; Whybrow, S.; Fuller, Z.; Johnstone, A.M.; Livingstone, M.B.; Ritz, P.; Horgan, G.W. Measuring the difference between actual and reported food intakes in the context of energy balance under laboratory conditions. Br. J. Nutr. 2014, 111, 2032–2043. [Google Scholar] [CrossRef] [PubMed] [Green Version]
- Scagliusi, F.B.; Ferriolli, E.; Pfrimer, K.; Laureano, C.; Cunha, C.S.; Gualano, B.; Lourenco, B.H.; Lancha, A.H., Jr. Underreporting of energy intake in Brazilian women varies according to dietary assessment: A cross-sectional study using doubly labeled water. J. Am. Diet. Assoc. 2008, 108, 2031–2040. [Google Scholar] [CrossRef] [PubMed]
- Ferraris, C.; Guglielmetti, M.; Trentani, C.; Tagliabue, A. Assessment of Dietary Under-Reporting in Italian College Team Sport Athletes. Nutrients 2019, 11, 1391. [Google Scholar] [CrossRef] [PubMed] [Green Version]
- Jenner, S.L.; Buckley, G.L.; Belski, R.; Devlin, B.L.; Forsyth, A.K. Dietary Intakes of Professional and Semi-Professional Team Sport Athletes Do Not Meet Sport Nutrition Recommendations—A Systematic Literature Review. Nutrients 2019, 11, 1160. [Google Scholar] [CrossRef] [Green Version]
- Jagim, A.R.; Zabriskie, H.; Currier, B.; Harty, P.S.; Stecker, R.; Kerksick, C.M. Nutrient Status and perceptions of energy and macronutrient intake in a Group of Collegiate Female Lacrosse Athletes. J. Int. Soc. Sports Nutr. 2019, 16, 43. [Google Scholar] [CrossRef] [Green Version]
- Jagim, A.R.; Fields, J.B.; Magee, M.; Kerksick, C.; Luedke, J.; Erickson, J.; Jones, M.T. The Influence of Sport Nutrition Knowledge on Body Composition and Perceptions of Dietary Requirements in Collegiate Athletes. Nutrients 2021, 13, 2239. [Google Scholar] [CrossRef]
- Heaney, S.; O’Connor, H.; Michael, S.; Gifford, J.; Naughton, G. Nutrition knowledge in athletes: A systematic review. Int. J. Sport Nutr. Exerc. Metab. 2011, 21, 248–261. [Google Scholar] [CrossRef] [Green Version]
- Hoogenboom, B.J.; Morris, J.; Morris, C.; Schaefer, K. Nutritional knowledge and eating behaviors of female, collegiate swimmers. N. Am. J. Sports Phys. Ther. NAJSPT 2009, 4, 139–148. [Google Scholar]
- Manore, M.M.; Patton-Lopez, M.M.; Meng, Y.; Wong, S.S. Sport Nutrition Knowledge, Behaviors and Beliefs of High School Soccer Players. Nutrients 2017, 9, 350. [Google Scholar] [CrossRef] [Green Version]
- Trakman, G.L.; Forsyth, A.; Devlin, B.L.; Belski, R. A Systematic Review of Athletes’ and Coaches’ Nutrition Knowledge and Reflections on the Quality of Current Nutrition Knowledge Measures. Nutrients 2016, 8, 570. [Google Scholar] [CrossRef] [PubMed] [Green Version]
- Werner, E.N.; Guadagni, A.J.; Pivarnik, J.M. Assessment of nutrition knowledge in division I college athletes. J. Am. Coll. Health 2020, 70, 1–8. [Google Scholar] [CrossRef] [PubMed]
- Condo, D.; Lohman, R.; Kelly, M.; Carr, A. Nutritional Intake, Sports Nutrition Knowledge and Energy Availability in Female Australian Rules Football Players. Nutrients 2019, 11, 971. [Google Scholar] [CrossRef] [PubMed] [Green Version]
- Jessri, M.; Jessri, M.; RashidKhani, B.; Zinn, C. Evaluation of Iranian college athletes’ sport nutrition knowledge. Int. J. Sport Nutr. Exerc. Metab. 2010, 20, 257–263. [Google Scholar] [CrossRef] [Green Version]
- Rash, C.; Malinauskas, B.M.; Duffrin, M.W.; Barber-Heidal, K.; Overton, R.F. Nutrition-related knowledge, attitude, and dietary intake of colelge track athletes. Sport J. 2008, 11, 48–55. [Google Scholar]
- Rosenbloom, C.A.; Jonnalagadda, S.S.; Skinner, R. Nutrition knowledge of collegiate athletes in a Division I National Collegiate Athletic Association institution. J. Am. Diet. Assoc. 2002, 102, 418–420. [Google Scholar] [CrossRef]
- Spronk, I.; Heaney, S.E.; Prvan, T.; O’Connor, H.T. Relationship Between General Nutrition Knowledge and Dietary Quality in Elite Athletes. Int. J. Sport Nutr. Exerc. Metab. 2015, 25, 243–251. [Google Scholar] [CrossRef]
- Torres-McGehee, T.M.; Pritchett, K.L.; Zippel, D.; Minton, D.M.; Cellamare, A.; Sibilia, M. Sports nutrition knowledge among collegiate athletes, coaches, athletic trainers, and strength and conditioning specialists. J. Athl. Train. 2012, 47, 205–211. [Google Scholar] [CrossRef] [Green Version]
- Abood, D.A.; Black, D.R.; Birnbaum, R.D. Nutrition education intervention for college female athletes. J. Nutr. Educ. Behav. 2004, 36, 135–137. [Google Scholar] [CrossRef]
- Andrews, A.; Wojcik, J.R.; Boyd, J.M.; Bowers, C.J. Sports Nutrition Knowledge among Mid-Major Division I University Student-Athletes. J. Nutr. Metab. 2016, 2016, 3172460. [Google Scholar] [CrossRef] [Green Version]
- Cupisti, A.; D’Alessandro, C.; Castrogiovanni, S.; Barale, A.; Morelli, E. Nutrition knowledge and dietary composition in Italian adolescent female athletes and non-athletes. Int. J. Sport Nutr. Exerc. Metab. 2002, 12, 207–219. [Google Scholar] [CrossRef]
- Dunn, D.; Turner, L.W.; Denny, G. Nutrition Knowledge and Attitudes of College Athletes. Sport J. 2007, 10, 45–52. [Google Scholar]
- Hornstrom, G.R.; Friesen, C.A.; Ellery, J.E.; Pike, K. Nutrition Knowledge, Practices, Attitudes, and Information Sources of Mid-American Conference College Softball Players. Food Nutr. Sci. 2011, 2, 4528. [Google Scholar] [CrossRef] [Green Version]
- Trakman, G.L.; Forsyth, A.; Hoye, R.; Belski, R. Development and validation of a brief general and sports nutrition knowledge questionnaire and assessment of athletes’ nutrition knowledge. J. Int. Soc. Sports Nutr. 2018, 15, 17. [Google Scholar] [CrossRef] [Green Version]
- Zinn, C.; Schofield, G.; Wall, C. Development of a psychometrically valid and reliable sports nutrition knowledge questionnaire. J. Sci. Med. Sport 2005, 8, 346–351. [Google Scholar] [CrossRef]
- Nikolaidis, P.T.; Theodoropoulou, E. Relationship between Nutrition Knowledge and Physical Fitness in Semiprofessional Soccer Players. Scientifica 2014, 2014, 180353. [Google Scholar] [CrossRef] [Green Version]
- Sedek, R.; Mohamad, M.; Kasim, Z.M. Knowledge, Attitudes and Practices on Hydration and Fluid Replacement among Endurance Sports Athletes in National University of Malaysia (UKM). Pak. J. Nutr. 2015, 14, 658–665. [Google Scholar] [CrossRef] [Green Version]
- Shifflett, B.; Timm, C.; Kahanov, L. Understanding of athletes’ nutritional needs among athletes, coaches, and athletic trainers. Res. Q. Exerc. Sport 2002, 73, 357–362. [Google Scholar] [CrossRef]
- Heaney, S.; O’Connor, H.; Naughton, G.; Gifford, J. Towards an understanding of the barriers to good nutrition for elite athletes. Int. J. Sports Sci. Coach. 2008, 3, 391–401. [Google Scholar] [CrossRef]
- Thurecht, R.; Pelly, F. Key Factors Influencing the Food Choices of Athletes at two Distinct Major International Competitions. Nutrients 2020, 12, 924. [Google Scholar] [CrossRef] [Green Version]
- Hull, M.V.; Jagim, A.R.; Oliver, J.M.; Greenwood, M.; Busteed, D.R.; Jones, M.T. Gender differences and access to a sports dietitian influence dietary habits of collegiate athletes. J. Int. Soc. Sports Nutr. 2016, 13, 38. [Google Scholar] [CrossRef] [PubMed] [Green Version]
- Hull, M.V.; Neddo, J.; Jagim, A.R.; Oliver, J.M.; Greenwood, M.; Jones, M.T. Availability of a sports dietitian may lead to improved performance and recovery of NCAA division I baseball athletes. J. Int. Soc. Sports Nutr. 2017, 14, 29. [Google Scholar] [CrossRef] [PubMed]
- Westerterp, K.R. Physical activity and physical activity induced energy expenditure in humans: Measurement, determinants, and effects. Front. Physiol. 2013, 4, 90. [Google Scholar] [CrossRef] [Green Version]
- Pikosky, M.A.; Smith, T.J.; Grediagin, A.; Castaneda-Sceppa, C.; Byerley, L.; Glickman, E.L.; Young, A.J. Increased protein maintains nitrogen balance during exercise-induced energy deficit. Med. Sci. Sports Exerc. 2008, 40, 505–512. [Google Scholar] [CrossRef]
- Joy, E.A.; Campbell, D. Stress fractures in the female athlete. Curr. Sports Med. Rep. 2005, 4, 323–328. [Google Scholar] [CrossRef] [PubMed]
- Novas, A.; Rowbottom, D.; Jenkins, D. Total daily energy expenditure and incidence of upper respiratory tract infection symptoms in young females. Int. J. Sports Med. 2002, 23, 465–470. [Google Scholar] [CrossRef]
- Sinha, S.; Kurpad, A.V.; Kuriyan, R. Total energy expenditure (TEE) of young adults from urban South India: Revisiting their daily energy requirement. Eur. J. Clin. Nutr. 2021, 75, 845–851. [Google Scholar] [CrossRef]
- Moon, J.M.; Zabriskie, H.A.; Harty, P.S.; Currier, B.S.; Blumkaitis, J.C.; Stecker, R.A.; Jagim, A.; Kerksick, C.M. Comparison of Energy Expenditure Observed between Scheduled Activities in Collegiate Team-Sport Female Athletes. Sports 2021, 9, 50. [Google Scholar] [CrossRef]
- Mara, J.K.; Thompson, K.G.; Pumpa, K.L. Assessing the Energy Expenditure of Elite Female Soccer Players: A Preliminary Study. J. Strength Cond. Res. 2021, 29, 2780–2786. [Google Scholar] [CrossRef]
- Edwards, J.E.; Lindeman, A.K.; Mikesky, A.E.; Stager, J.M. Energy balance in highly trained female endurance runners. Med. Sci. Sports Exerc. 1993, 25, 1398–1404. [Google Scholar] [CrossRef]
- Loftin, M.; Sothern, M.; Koss, C.; Tuuri, G.; Vanvrancken, C.; Kontos, A.; Bonis, M. Energy expenditure and influence of physiologic factors during marathon running. J. Strength Cond. Res. 2007, 21, 1188–1191. [Google Scholar] [CrossRef]
- Schulz, L.O.; Alger, S.; Harper, I.; Wilmore, J.H.; Ravussin, E. Energy expenditure of elite female runners measured by respiratory chamber and doubly labeled water. J. Appl. Physiol. 1992, 72, 23–28. [Google Scholar] [CrossRef]
- Trappe, T.A.; Gastaldelli, A.; Jozsi, A.C.; Troup, J.P.; Wolfe, R.R. Energy expenditure of swimmers during high volume training. Med. Sci. Sports Exerc. 1997, 29, 950–954. [Google Scholar] [CrossRef]
- Costa, R.J.; Gill, S.K.; Hankey, J.; Wright, A.; Marczak, S. Perturbed energy balance and hydration status in ultra-endurance runners during a 24 h ultra-marathon. Br. J. Nutr. 2014, 112, 428–437. [Google Scholar] [CrossRef] [PubMed] [Green Version]
- Kumahara, H.; Ohta, C.; Nabeshima, E.; Nakayama, A.; Mine, S.; Yamato, T. Dietary Intake and Energy Expenditure During Two Different Phases of Athletic Training in Female Collegiate Lacrosse Players. J. Strength Cond. Res. 2020, 34, 1547–1554. [Google Scholar] [CrossRef] [PubMed]
- Silva, A.M.; Matias, C.N.; Santos, D.A.; Thomas, D.; Bosy-Westphal, A.; Muller, M.J.; Heymsfield, S.B.; Sardinha, L.B. Energy Balance over One Athletic Season. Med. Sci. Sports Exerc. 2017, 49, 1724–1733. [Google Scholar] [CrossRef] [PubMed]
- Silva, A.M.; Santos, D.A.; Matias, C.N.; Minderico, C.S.; Schoeller, D.A.; Sardinha, L.B. Total energy expenditure assessment in elite junior basketball players: A validation study using doubly labeled water. J. Strength Cond. Res. 2013, 27, 1920–1927. [Google Scholar] [CrossRef] [PubMed]
- Fraczek, B.; Grzelak, A.; Klimek, A.T. Analysis of Daily Energy Expenditure of Elite Athletes in Relation to their Sport, the Measurement Method and Energy Requirement Norms. J. Hum. Kinet. 2019, 70, 81–92. [Google Scholar] [CrossRef] [PubMed] [Green Version]
- Hill, R.J.; Davies, P.S. Energy intake and energy expenditure in elite lightweight female rowers. Med. Sci. Sports Exerc. 2002, 34, 1823–1829. [Google Scholar] [CrossRef] [PubMed]
- Hoeg, T.B.; Olson, E.M.; Skaggs, K.; Sainani, K.; Fredericson, M.; Roche, M.; Kraus, E. Prevalence of Female and Male Athlete Triad Risk Factors in Ultramarathon Runners. Clin. J. Sport Med. 2021. [Google Scholar] [CrossRef]
- Lichtenstein, M.B.; Hinze, C.J.; Emborg, B.; Thomsen, F.; Hemmingsen, S.D. Compulsive exercise: Links, risks and challenges faced. Psychol. Res. Behav. Manag. 2017, 10, 85–95. [Google Scholar] [CrossRef] [PubMed] [Green Version]
- Torstveit, M.K.; Fahrenholtz, I.L.; Lichtenstein, M.B.; Stenqvist, T.B.; Melin, A.K. Exercise dependence, eating disorder symptoms and biomarkers of Relative Energy Deficiency in Sports (RED-S) among male endurance athletes. BMJ Open Sport Exerc. Med. 2019, 5, e000439. [Google Scholar] [CrossRef] [Green Version]
- Bamber, D.J.; Cockerill, I.M.; Rodgers, S.; Carroll, D. Diagnostic criteria for exercise dependence in women. Br. J. Sports Med. 2003, 37, 393–400. [Google Scholar] [CrossRef] [PubMed] [Green Version]
- Kuikman, M.A.; Mountjoy, M.; Burr, J.F. Examining the Relationship between Exercise Dependence, Disordered Eating, and Low Energy Availability. Nutrients 2021, 13, 2601. [Google Scholar] [CrossRef] [PubMed]
- Meulemans, S.; Pribis, P.; Grajales, T.; Krivak, G. Gender differences in exercise dependence and eating disorders in young adults: A path analysis of a conceptual model. Nutrients 2014, 6, 4895–4905. [Google Scholar] [CrossRef]
- Oppliger, R.A.; Steen, S.A.; Scott, J.R. Weight loss practices of college wrestlers. Int. J. Sport Nutr. Exerc. Metab. 2003, 13, 29–46. [Google Scholar] [CrossRef] [Green Version]
- Stellingwerff, T.; Heikura, I.A.; Meeusen, R.; Bermon, S.; Seiler, S.; Mountjoy, M.L.; Burke, L.M. Overtraining Syndrome (OTS) and Relative Energy Deficiency in Sport (RED-S): Shared Pathways, Symptoms and Complexities. Sports Med. 2021, 51, 2251–2280. [Google Scholar] [CrossRef]
- Reale, R.; Slater, G.; Burke, L.M. Acute-Weight-Loss Strategies for Combat Sports and Applications to Olympic Success. Int. J. Sports Physiol. Perform. 2017, 12, 142–151. [Google Scholar] [CrossRef]
- de Bruin, A.P.; Oudejans, R.R.; Bakker, F.C.; Woertman, L. Contextual body image and athletes’ disordered eating: The contribution of athletic body image to disordered eating in high performance women athletes. Eur. Eat. Disord. Rev. 2011, 19, 201–215. [Google Scholar] [CrossRef] [Green Version]
- Tiggemann, M. Body image across the adult life span: Stability and change. Body Image 2004, 1, 29–41. [Google Scholar] [CrossRef] [Green Version]
- Levine, M.P.; Murnen, S.K. “Everybody knows that mass media are/are not a cause of eating disorders”: A critical review of evidence for a causal link between media, negative body image, and disordered eating in females. J. Soc. Clin. Psychol. 2009, 28, 9–42. [Google Scholar] [CrossRef]
- Nerini, A. Media influence and body dissatisfaction in preadolescent ballet dancers and non-physically active girls. Psychol. Sport Exerc. 2015, 20, 76–83. [Google Scholar] [CrossRef]
- Kelley, C.C.; Neufeld, J.M.; Musher-Eizenman, D.R. Drive for thinness and drive for muscularity: Opposite ends of the continuum or separate constructs? Body Image 2010, 7, 74–77. [Google Scholar] [CrossRef] [PubMed]
- Shroff, H.; Thompson, J.K. The tripartite influence model of body image and eating disturbance: A replication with adolescent girls. Body Image 2006, 3, 17–23. [Google Scholar] [CrossRef]
- Goldschmidt, A.B.; Wall, M.; Loth, K.A.; Le Grange, D.; Neumark-Sztainer, D. Which dieters are at risk for the onset of binge eating? A prospective study of adolescents and young adults. J. Adolesc. Health 2012, 51, 86–92. [Google Scholar] [CrossRef] [Green Version]
- Wells, K.R.; Jeacocke, N.A.; Appaneal, R.; Smith, H.D.; Vlahovich, N.; Burke, L.M.; Hughes, D. The Australian Institute of Sport (AIS) and National Eating Disorders Collaboration (NEDC) position statement on disordered eating in high performance sport. Br. J. Sports Med. 2020, 54, 1247–1258. [Google Scholar] [CrossRef]
- Wasserfurth, P.; Palmowski, J.; Hahn, A.; Kruger, K. Reasons for and Consequences of Low Energy Availability in Female and Male Athletes: Social Environment, Adaptations, and Prevention. Sports Med.-Open 2020, 6, 44. [Google Scholar] [CrossRef]
- Gibson, C.; Hindle, C.; McLay-Cooke, R.; Slater, J.; Brown, R.; Smith, B.; Baker, D.; Healey, P.; Black, K. Body Image Among Elite Rugby Union Players. J. Strength Cond. Res. 2019, 33, 2217–2222. [Google Scholar] [CrossRef]
- Wardle, J.; Haase, A.M.; Steptoe, A. Body image and weight control in young adults: International comparisons in university students from 22 countries. Int. J. Obes. 2006, 30, 644–651. [Google Scholar] [CrossRef] [Green Version]
- Torres-McGehee, T.M.; Monsma, E.V.; Gay, J.L.; Minton, D.M.; Mady-Foster, A.N. Prevalence of eating disorder risk and body image distortion among National Collegiate Athletic Association Division I varsity equestrian athletes. J. Athl. Train. 2011, 46, 431–437. [Google Scholar] [CrossRef] [Green Version]
- Bonci, C.M.; Bonci, L.J.; Granger, L.R.; Johnson, C.L.; Malina, R.M.; Milne, L.W.; Ryan, R.R.; Vanderbunt, E.M. National athletic trainers’ association position statement: Preventing, detecting, and managing disordered eating in athletes. J. Athl. Train. 2008, 43, 80–108. [Google Scholar] [CrossRef] [PubMed] [Green Version]
- Reardon, C.L.; Hainline, B.; Aron, C.M.; Baron, D.; Baum, A.L.; Bindra, A.; Budgett, R.; Campriani, N.; Castaldelli-Maia, J.M.; Currie, A.; et al. Mental health in elite athletes: International Olympic Committee consensus statement (2019). Br. J. Sports Med. 2019, 53, 667–699. [Google Scholar] [CrossRef] [PubMed] [Green Version]
- Gibbs, J.C.; Williams, N.I.; De Souza, M.J. Prevalence of individual and combined components of the female athlete triad. Med. Sci. Sports Exerc. 2013, 45, 985–996. [Google Scholar] [CrossRef] [Green Version]
- Galmiche, M.; Dechelotte, P.; Lambert, G.; Tavolacci, M.P. Prevalence of eating disorders over the 2000–2018 period: A systematic literature review. Am. J. Clin. Nutr. 2019, 109, 1402–1413. [Google Scholar] [CrossRef] [PubMed]
- Greenleaf, C.; Petrie, T.A.; Carter, J.; Reel, J.J. Female collegiate athletes: Prevalence of eating disorders and disordered eating behaviors. J. Am. Coll. Health 2009, 57, 489–495. [Google Scholar] [CrossRef]
- Rosendahl, J.; Bormann, B.; Aschenbrenner, K.; Aschenbrenner, F.; Strauss, B. Dieting and disordered eating in German high school athletes and non-athletes. Scand. J. Med. Sci. Sports 2009, 19, 731–739. [Google Scholar] [CrossRef]
- Vardar, E.; Vardar, S.A.; Kurt, C. Anxiety of young female athletes with disordered eating behaviors. Eat. Behav. 2007, 8, 143–147. [Google Scholar] [CrossRef]
- Wells, E.K.; Chin, A.D.; Tacke, J.A.; Bunn, J.A. Risk of Disordered Eating Among Division I Female College Athletes. Int. J. Exerc. Sci. 2015, 8, 256–264. [Google Scholar]
- Rousselet, M.; Guerineau, B.; Paruit, M.C.; Guinot, M.; Lise, S.; Destrube, B.; Ruffio-Thery, S.; Dominguez, N.; Brisseau-Gimenez, S.; Dubois, V.; et al. Disordered eating in French high-level athletes: Association with type of sport, doping behavior, and psychological features. Eat. Weight Disord. 2017, 22, 61–68. [Google Scholar] [CrossRef]
- Torstveit, M.K.; Rosenvinge, J.H.; Sundgot-Borgen, J. Prevalence of eating disorders and the predictive power of risk models in female elite athletes: A controlled study. Scand. J. Med. Sci. Sports 2008, 18, 108–118. [Google Scholar] [CrossRef]
- Mancine, R.P.; Gusfa, D.W.; Moshrefi, A.; Kennedy, S.F. Prevalence of disordered eating in athletes categorized by emphasis on leanness and activity type—A systematic review. J. Eat. Disord. 2020, 8, 47. [Google Scholar] [CrossRef]
- Engel, S.G.; Johnson, C.; Powers, P.S.; Crosby, R.D.; Wonderlich, S.A.; Wittrock, D.A.; Mitchell, J.E. Predictors of disordered eating in a sample of elite Division I college athletes. Eat. Behav. 2003, 4, 333–343. [Google Scholar] [CrossRef]
- Arthur-Cameselle, J.; Quatromoni, P. Factors Related to the Onset of Eating Disorders Reported by Female Collegiate Athletes. Sport Psychol. 2010, 25, 1–17. [Google Scholar] [CrossRef] [Green Version]
- Ravi, S.; Ihalainen, J.K.; Taipale-Mikkonen, R.S.; Kujala, U.M.; Waller, B.; Mierlahti, L.; Lehto, J.; Valtonen, M. Self-Reported Restrictive Eating, Eating Disorders, Menstrual Dysfunction, and Injuries in Athletes Competing at Different Levels and Sports. Nutrients 2021, 13, 3275. [Google Scholar] [CrossRef] [PubMed]
- Surala, O.; Malczewska-Lenczowska, J.; Sadowska, D.; Grabowska, I.; Bialecka-Debek, A. Traits of Orthorexia Nervosa and the Determinants of These Behaviors in Elite Athletes. Nutrients 2020, 12, 2683. [Google Scholar] [CrossRef] [PubMed]
- Segura-Garcia, C.; Papaianni, M.C.; Caglioti, F.; Procopio, L.; Nistico, C.G.; Bombardiere, L.; Ammendolia, A.; Rizza, P.; De Fazio, P.; Capranica, L. Orthorexia nervosa: A frequent eating disordered behavior in athletes. Eat. Weight Disord. 2012, 17, e226–e233. [Google Scholar] [CrossRef] [PubMed]
- Sundgot-Borgen, J. Risk and trigger factors for the development of eating disorders in female elite athletes. Med. Sci. Sports Exerc. 1994, 26, 414–419. [Google Scholar] [CrossRef]
- Ackerman, K.E.; Stellingwerff, T.; Elliott-Sale, K.J.; Baltzell, A.; Cain, M.; Goucher, K.; Fleshman, L.; Mountjoy, M.L. #REDS (Relative Energy Deficiency in Sport): Time for a revolution in sports culture and systems to improve athlete health and performance. Br. J. Sports Med. 2020, 54, 369–370. [Google Scholar] [CrossRef]
- Slater, J.; McLay-Cooke, R.; Brown, R.; Black, K. Female Recreational Exercisers at Risk for Low Energy Availability. Int. J. Sport Nutr. Exerc. Metab. 2016, 26, 421–427. [Google Scholar] [CrossRef]
- Heikura, I.A.; Stellingwerff, T.; Areta, J.L. Low energy availability in female athletes: From the lab to the field. Eur. J. Sport Sci. 2021, 1–11. [Google Scholar] [CrossRef]
- Black, D.R.; Larkin, L.J.; Coster, D.C.; Leverenz, L.J.; Abood, D.A. Physiologic Screening Test for Eating Disorders/Disordered Eating Among Female Collegiate Athletes. J. Athl. Train. 2003, 38, 286–297. [Google Scholar] [PubMed]
- Garner, D.M.; Olmsted, M.P.; Bohr, Y.; Garfinkel, P.E. The eating attitudes test: Psychometric features and clinical correlates. Psychol. Med. 1982, 12, 871–878. [Google Scholar] [CrossRef] [PubMed]
- Berg, K.C.; Peterson, C.B.; Frazier, P.; Crow, S.J. Psychometric evaluation of the eating disorder examination and eating disorder examination-questionnaire: A systematic review of the literature. Int. J. Eat. Disord. 2012, 45, 428–438. [Google Scholar] [CrossRef] [PubMed] [Green Version]
- Garner, D.M. EDI-3—Eating Disorder Inventory: Professional Manual; Psychological Assessment Resources. Inc.: Lutz, FL, USA, 2004. [Google Scholar]
- Kennedy, S.F.; Kovan, J.; Werner, E.; Mancine, R.; Gusfa, D.; Kleiman, H. Initial validation of a screening tool for disordered eating in adolescent athletes. J. Eat. Disord. 2021, 9, 21. [Google Scholar] [CrossRef]
- Martinsen, M.; Holme, I.; Pensgaard, A.M.; Torstveit, M.K.; Sundgot-Borgen, J. The development of the brief eating disorder in athletes questionnaire. Med. Sci. Sports Exerc. 2014, 46, 1666–1675. [Google Scholar] [CrossRef]
- McNulty, K.Y.; Adams, C.H.; Anderson, J.M.; Affenito, S.G. Development and validation of a screening tool to identify eating disorders in female athletes. J. Am. Diet. Assoc. 2001, 101, 886–892. [Google Scholar] [CrossRef]
- Nagel, D.L.; Black, D.R.; Leverenz, L.J.; Coster, D.C. Evaluation of a screening test for female college athletes with eating disorders and disordered eating. J. Athl. Train. 2000, 35, 431–440. [Google Scholar]
- Stice, E.; Fisher, M.; Martinez, E. Eating disorder diagnostic scale: Additional evidence of reliability and validity. Psychol. Assess. 2004, 16, 60–71. [Google Scholar] [CrossRef] [Green Version]
- Otis, C.L.; Drinkwater, B.; Johnson, M.; Loucks, A.; Wilmore, J. American College of Sports Medicine position stand. The Female Athlete Triad. Med. Sci. Sports Exerc. 1997, 29, i–ix. [Google Scholar] [CrossRef]
- Lewiecki, E.M.; Gordon, C.M.; Baim, S.; Leonard, M.B.; Bishop, N.J.; Bianchi, M.L.; Kalkwarf, H.J.; Langman, C.B.; Plotkin, H.; Rauch, F.; et al. International Society for Clinical Densitometry 2007 Adult and Pediatric Official Positions. Bone 2008, 43, 1115–1121. [Google Scholar] [CrossRef]
- Orbach, I.; Mikulincer, M. The Body Investment Scale: Construction and Validation of a Body Experience Scale. Psychol. Assess. 1998, 10, 415–425. [Google Scholar] [CrossRef]
- Sandoz, E.; Wilson, K.G.; Merwin, R.M.; Kellum, K.K. Assessment of body image flexibility: The Body Image-Acceptance and Action Questionnaire. J. Contextual Behav. Sci. 2013, 2, 39–48. [Google Scholar] [CrossRef]
- Lucena-Santos, P.; Carvalho, S.A.; Oliveira, M.D.S.; Pinto-Gouveia, J. Body-Image Acceptance and Action Questionnaire: Its deleterious influence on binge eating and psychometric validation. Int. J. Clin. Health Psychol. 2017, 17, 151–160. [Google Scholar] [CrossRef]
- Cash, T.; Szymanski, M.L. The development and validation of the body-image ideals questionnaire. J. Personal. Assess. 1995, 64, 466–477. [Google Scholar] [CrossRef] [PubMed]
- Cash, T.; Phillips, K.A.; Santos, M.T.; Hrabosky, J.I. Measuring “negative body image”: Validation of the Body Image Disturbance Questionnaire in a nonclinical population. Body Image 2004, 1, 363–372. [Google Scholar] [CrossRef]
- Cooper, P.; Taylor, M.J.; Cooper, Z.; Fairbum, C.G. The development and validation of the body shape questionnaire. Int. J. Eat. Disord. 1987, 6, 485–494. [Google Scholar] [CrossRef]
- Goltz, F.R.; Stenzel, L.M.; Schneider, C.D. Disordered eating behaviors and body image in male athletes. Braz. J. Psychiatry 2013, 35, 237–242. [Google Scholar] [CrossRef] [PubMed] [Green Version]
- Kuikman, M.A.; Mountjoy, M.; Stellingwerff, T.; Burr, J.F. A Review of Nonpharmacological Strategies in the Treatment of Relative Energy Deficiency in Sport. Int. J. Sport Nutr. Exerc. Metab. 2021, 31, 268–275. [Google Scholar] [CrossRef]
- Fredericson, M.; Kussman, A.; Misra, M.; Barrack, M.T.; De Souza, M.J.; Kraus, E.; Koltun, K.J.; Williams, N.I.; Joy, E.; Nattiv, A. The Male Athlete Triad—A Consensus Statement From the Female and Male Athlete Triad Coalition Part II: Diagnosis, Treatment, and Return-To-Play. Clin. J. Sport Med. 2021, 31, 349–366. [Google Scholar] [CrossRef]
- Joy, E.; De Souza, M.J.; Nattiv, A.; Misra, M.; Williams, N.I.; Mallinson, R.J.; Gibbs, J.C.; Olmsted, M.; Goolsby, M.; Matheson, G.; et al. 2014 female athlete triad coalition consensus statement on treatment and return to play of the female athlete triad. Curr. Sports Med. Rep. 2014, 13, 219–232. [Google Scholar] [CrossRef]
Publisher’s Note: MDPI stays neutral with regard to jurisdictional claims in published maps and institutional affiliations. |
© 2022 by the authors. Licensee MDPI, Basel, Switzerland. This article is an open access article distributed under the terms and conditions of the Creative Commons Attribution (CC BY) license (https://creativecommons.org/licenses/by/4.0/).