
Evaluation Schoolyard Wind Comfort Changes Due to Rapid Developments: Case Study of Nanjing, China


_Sun.png)
Abstract
:1. Introduction
2. Methods
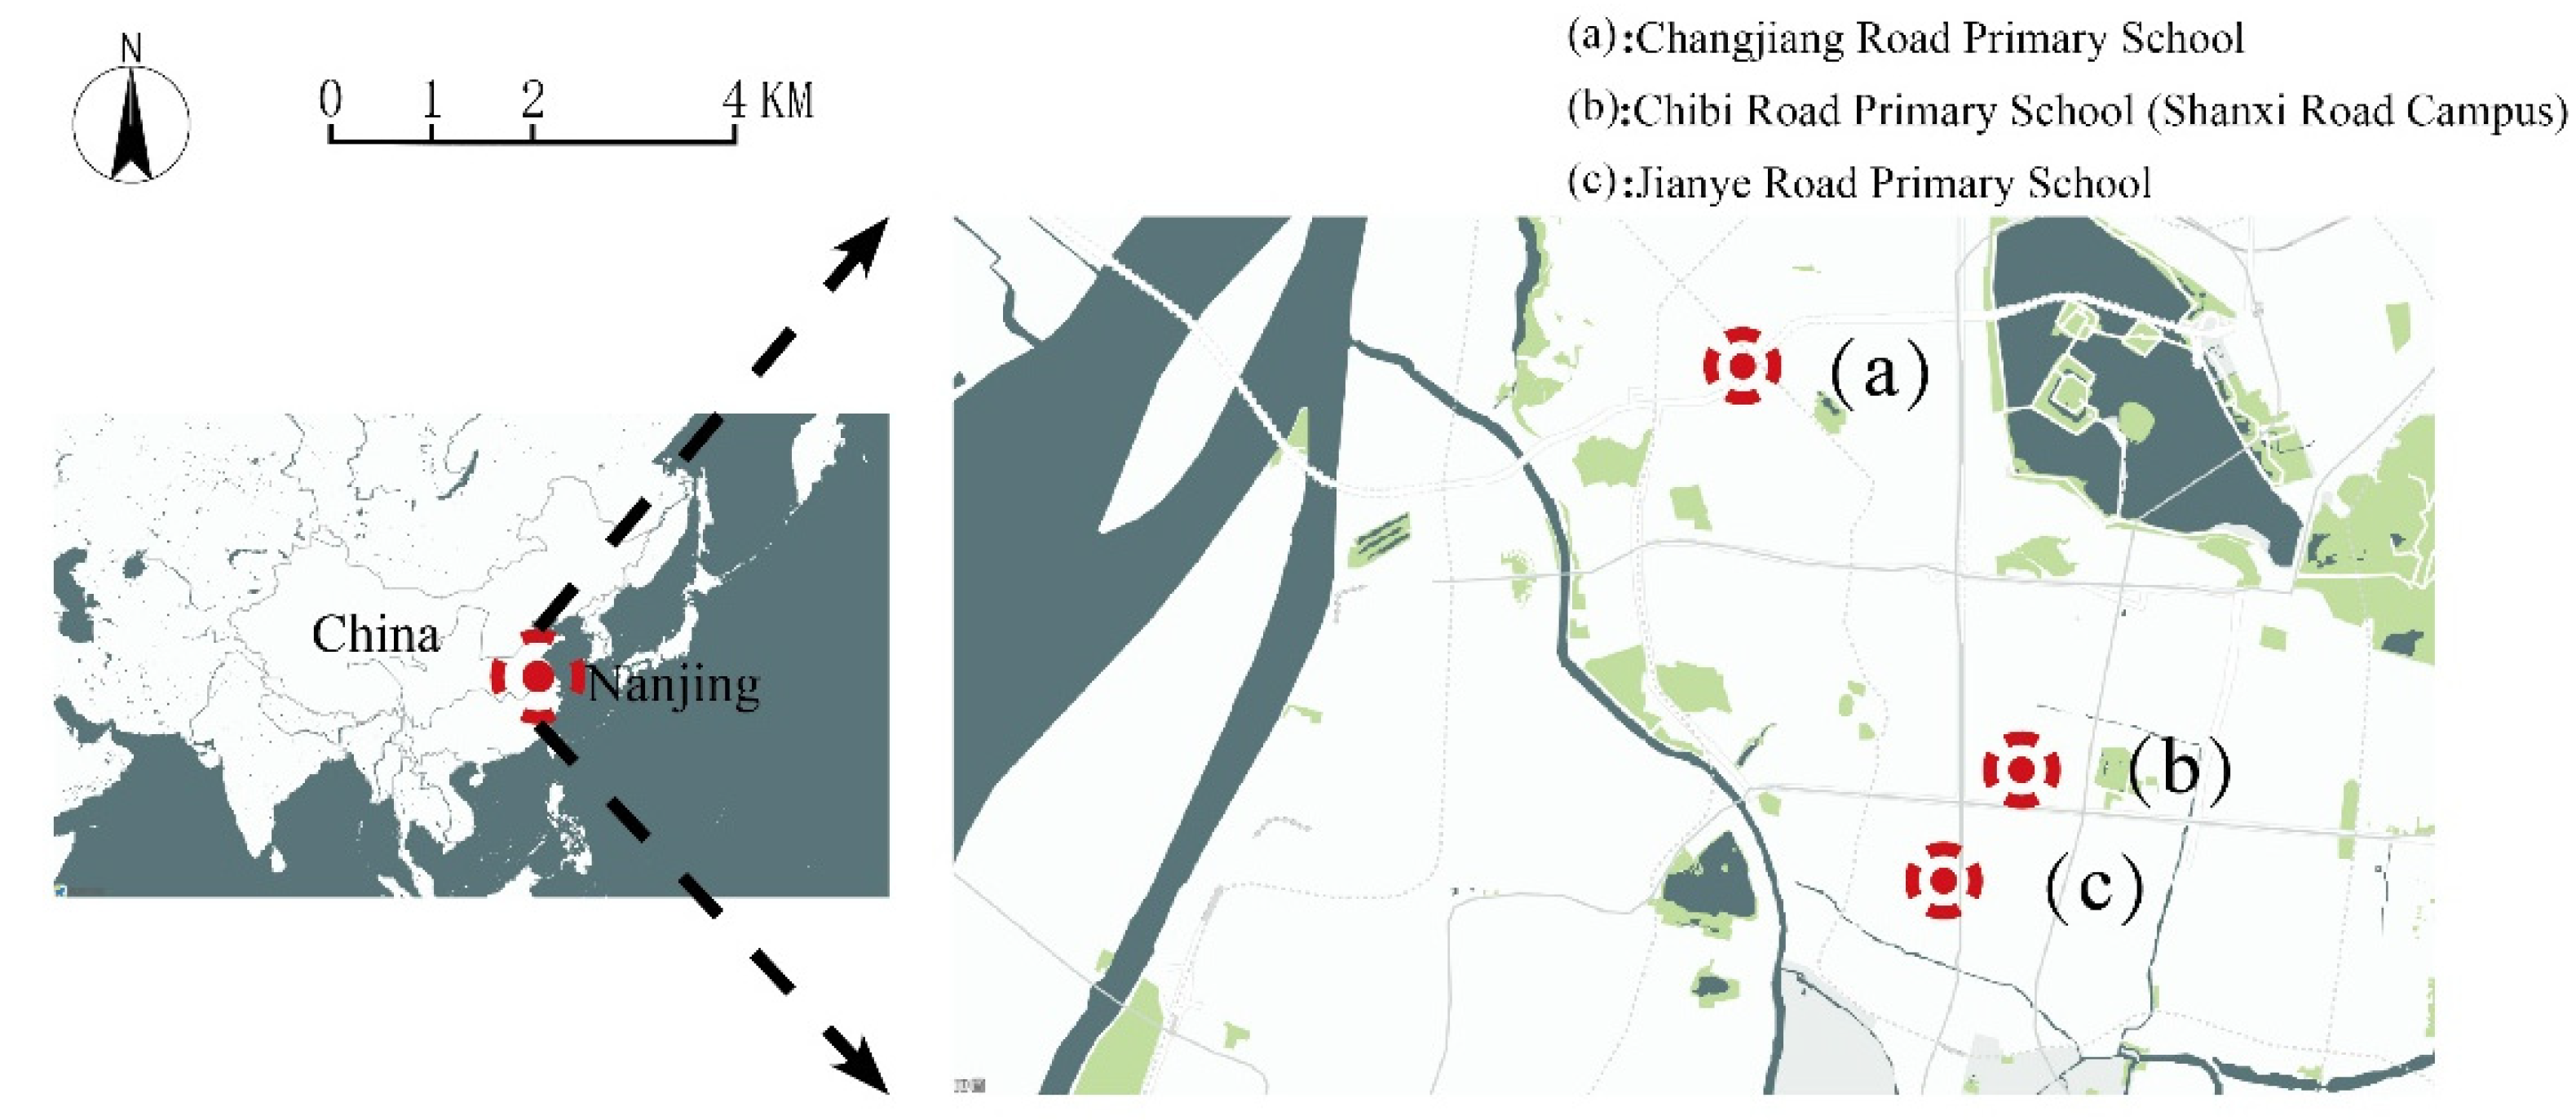
2.1. Study Area
2.2. Historical Data of Schoolyards and Their Surrounding Areas
2.3. CFD Modeling
2.4. Identification of Pedestrian-Level Wind Comfort
3. Results and Discussion
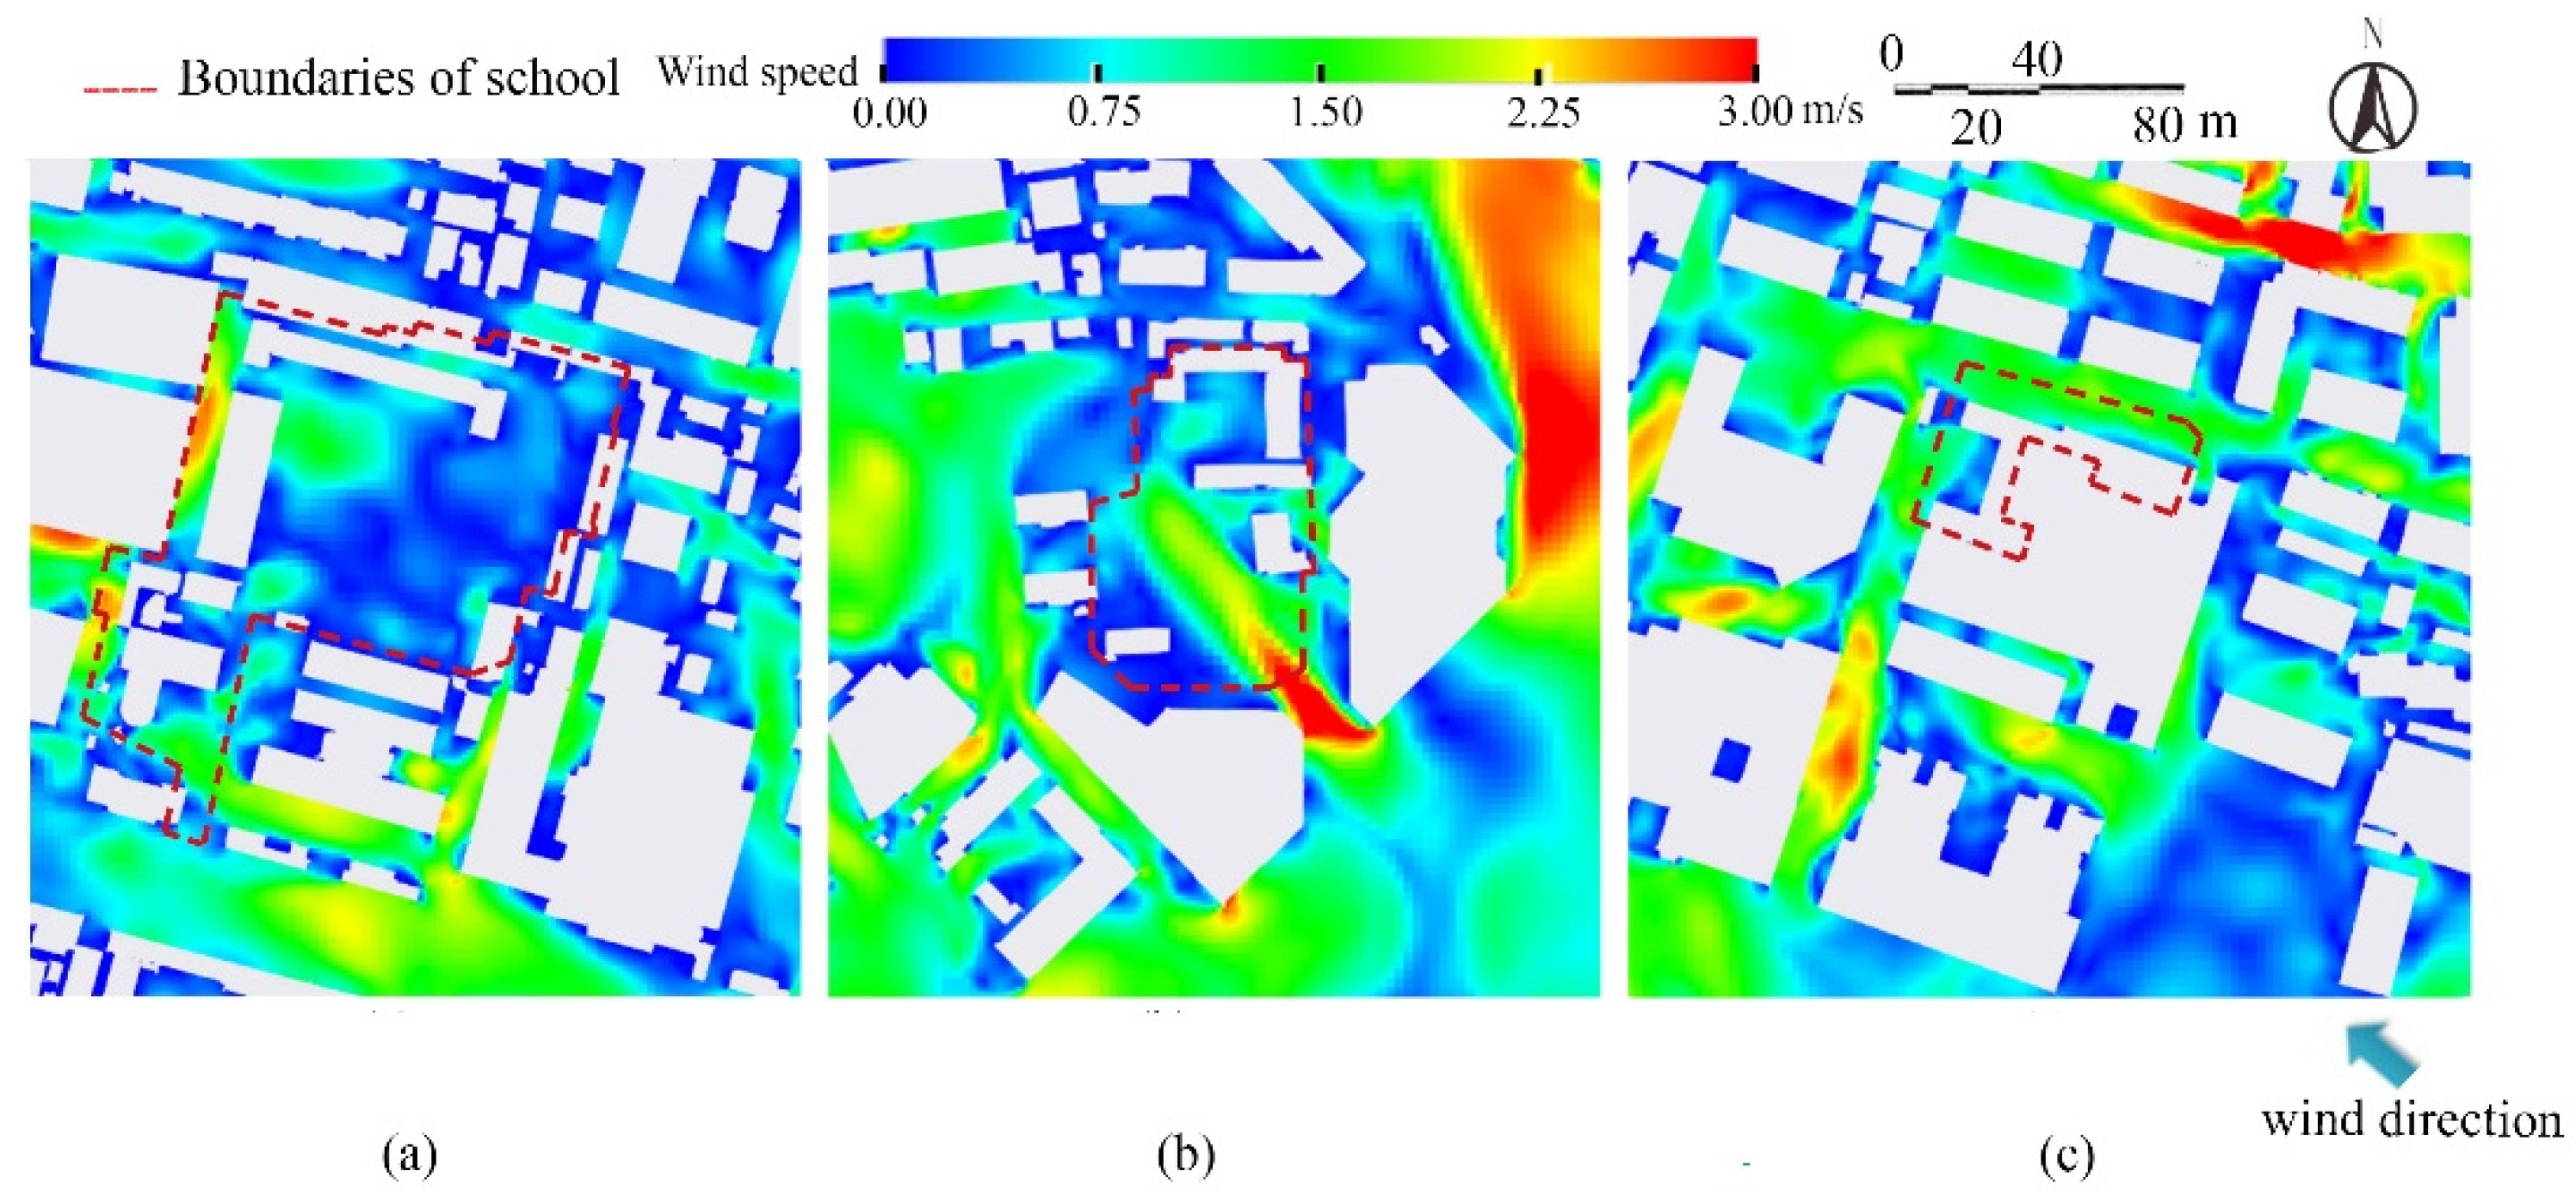
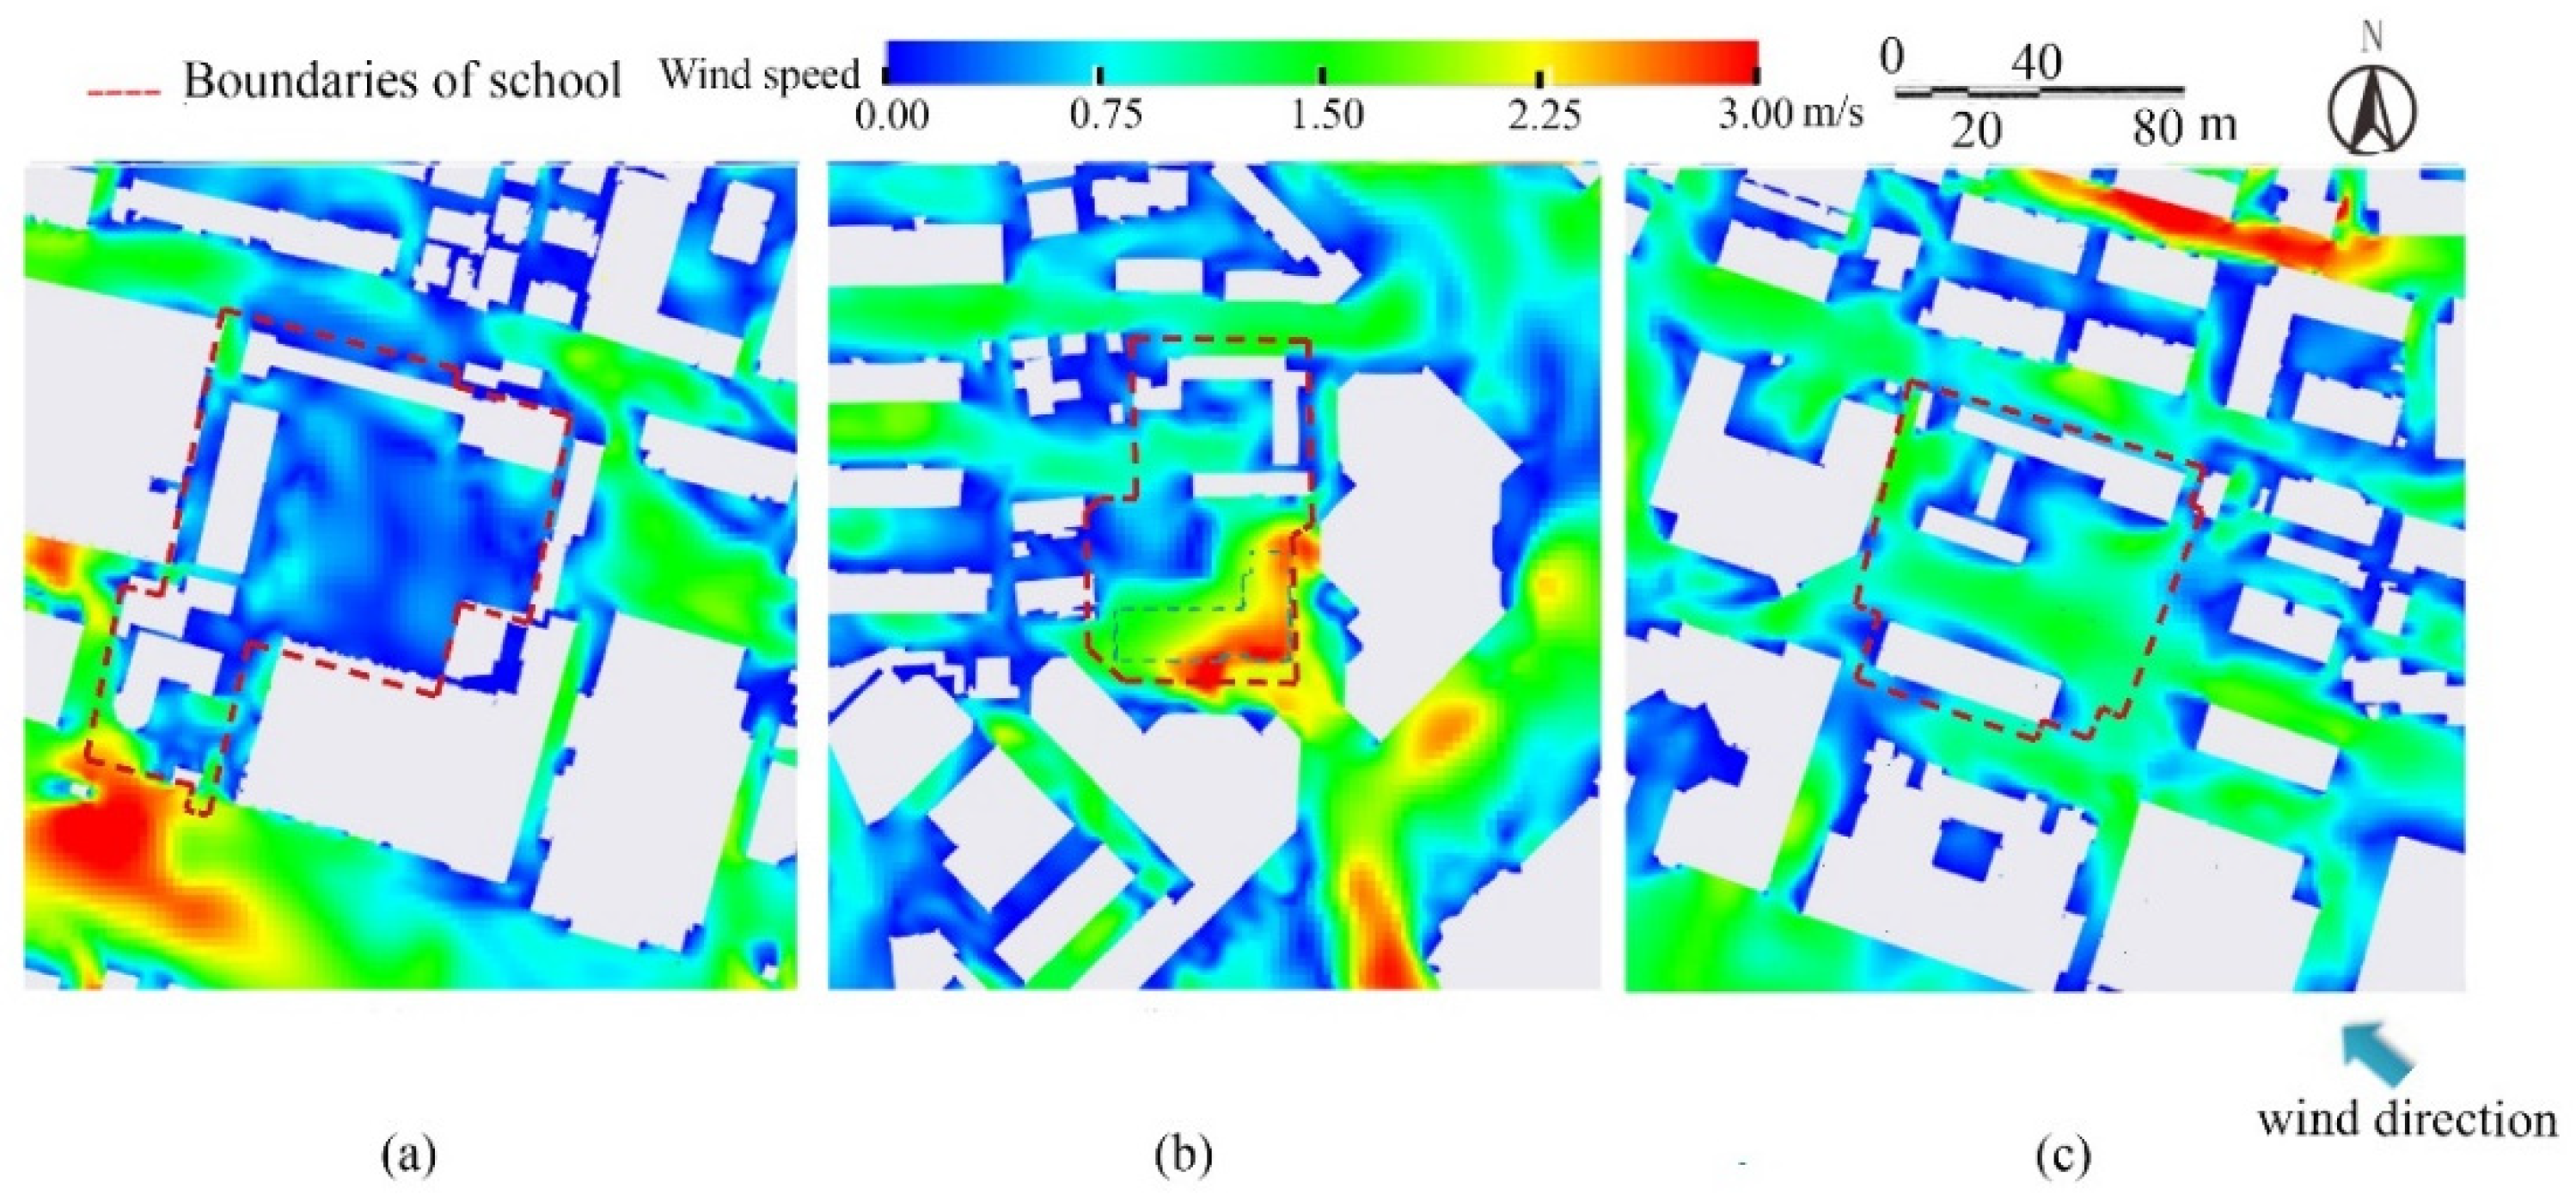
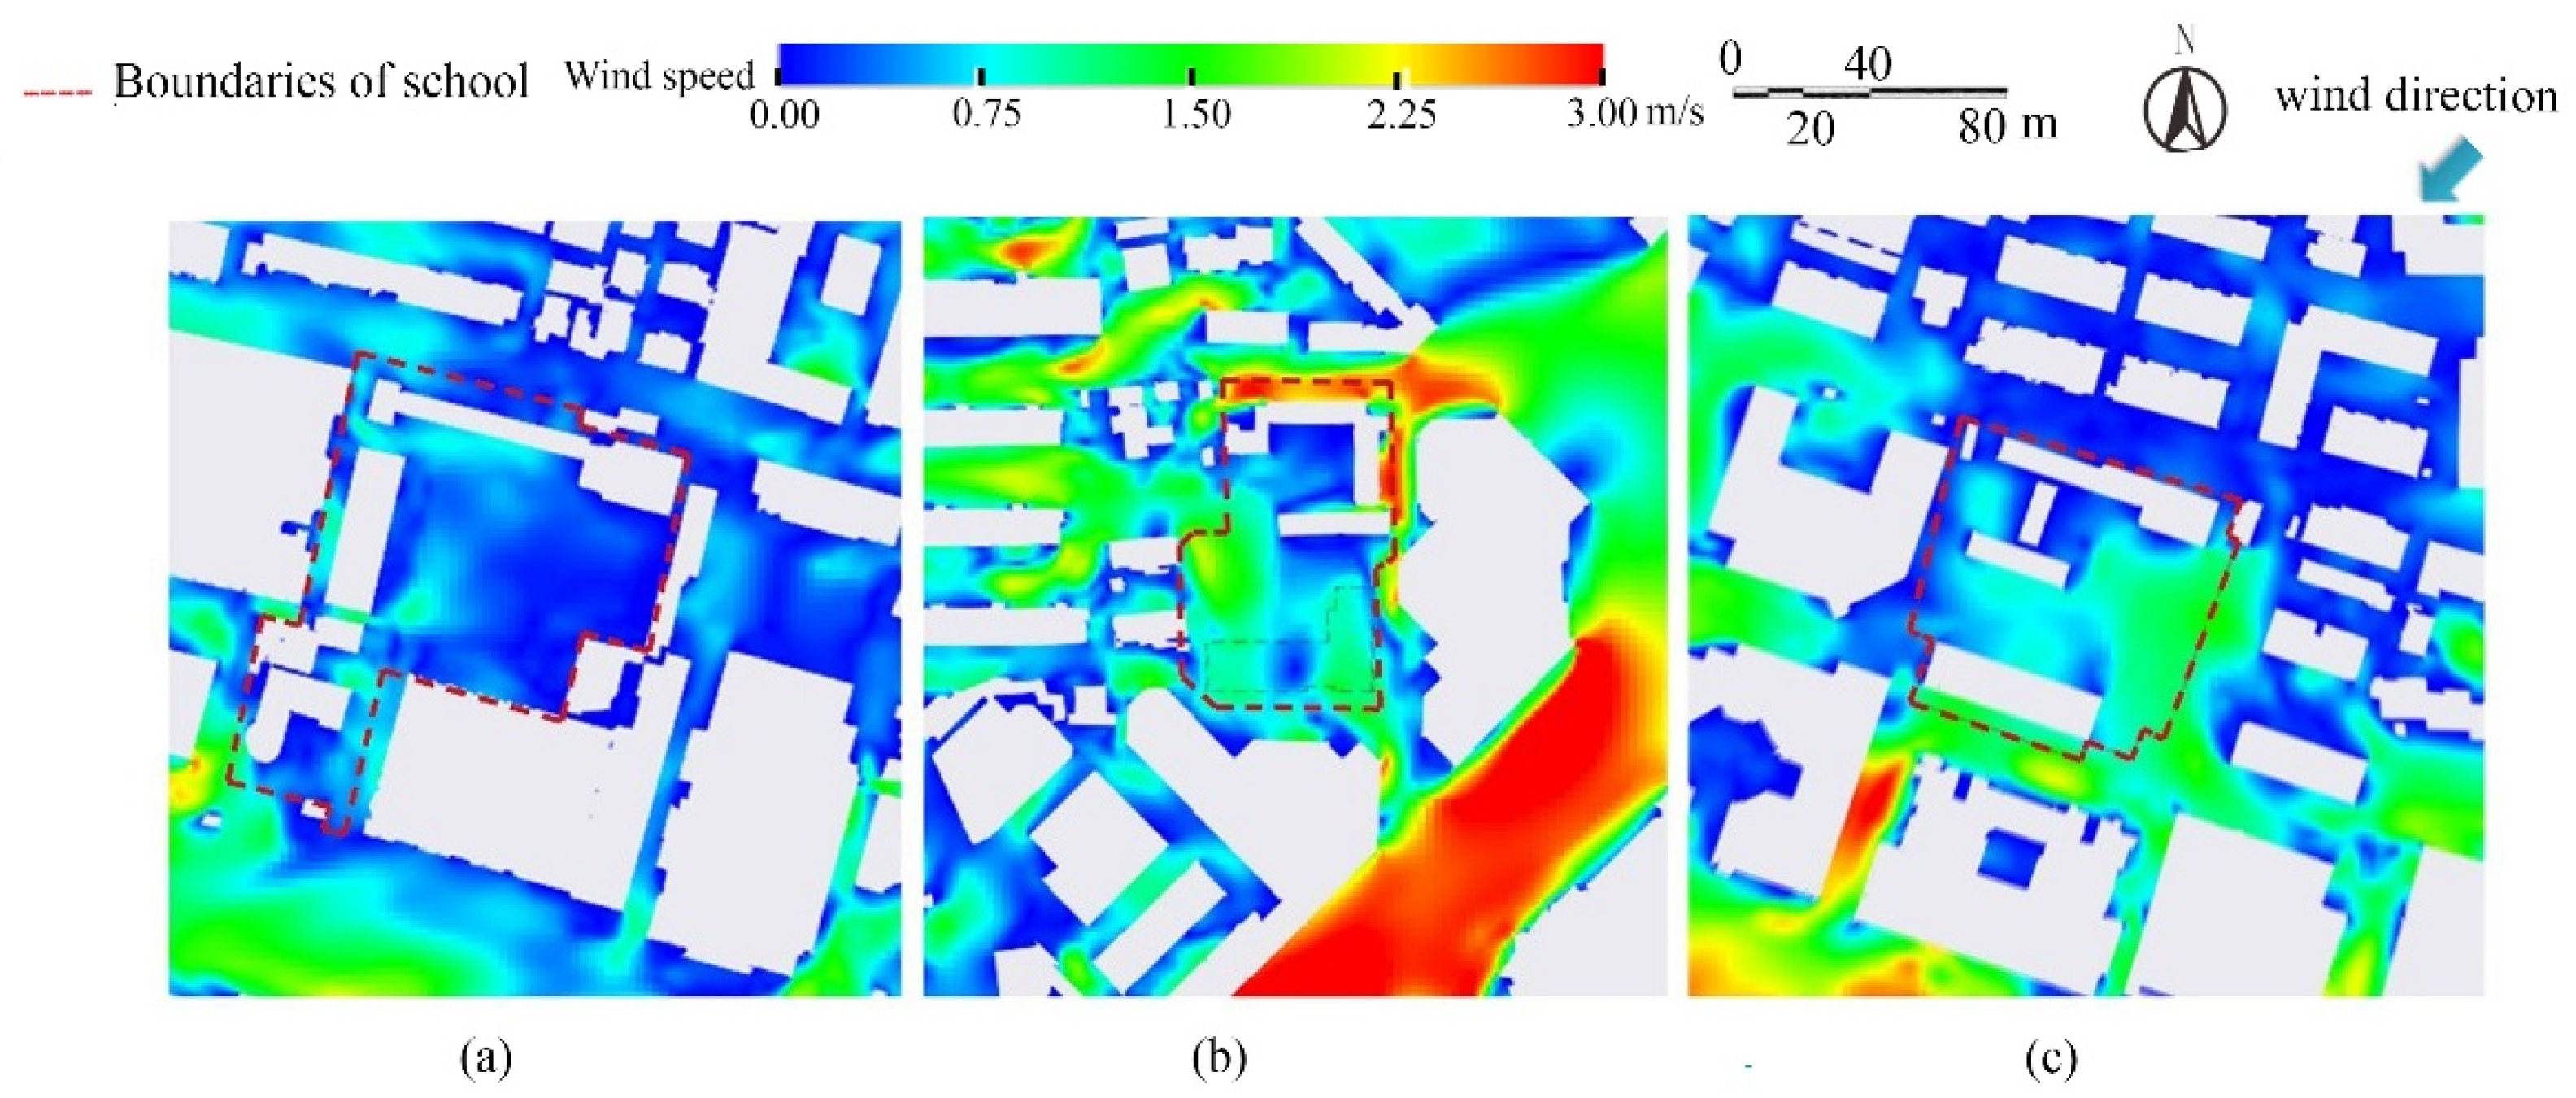
3.1. Changes of Wind Environment in Summer and Winter
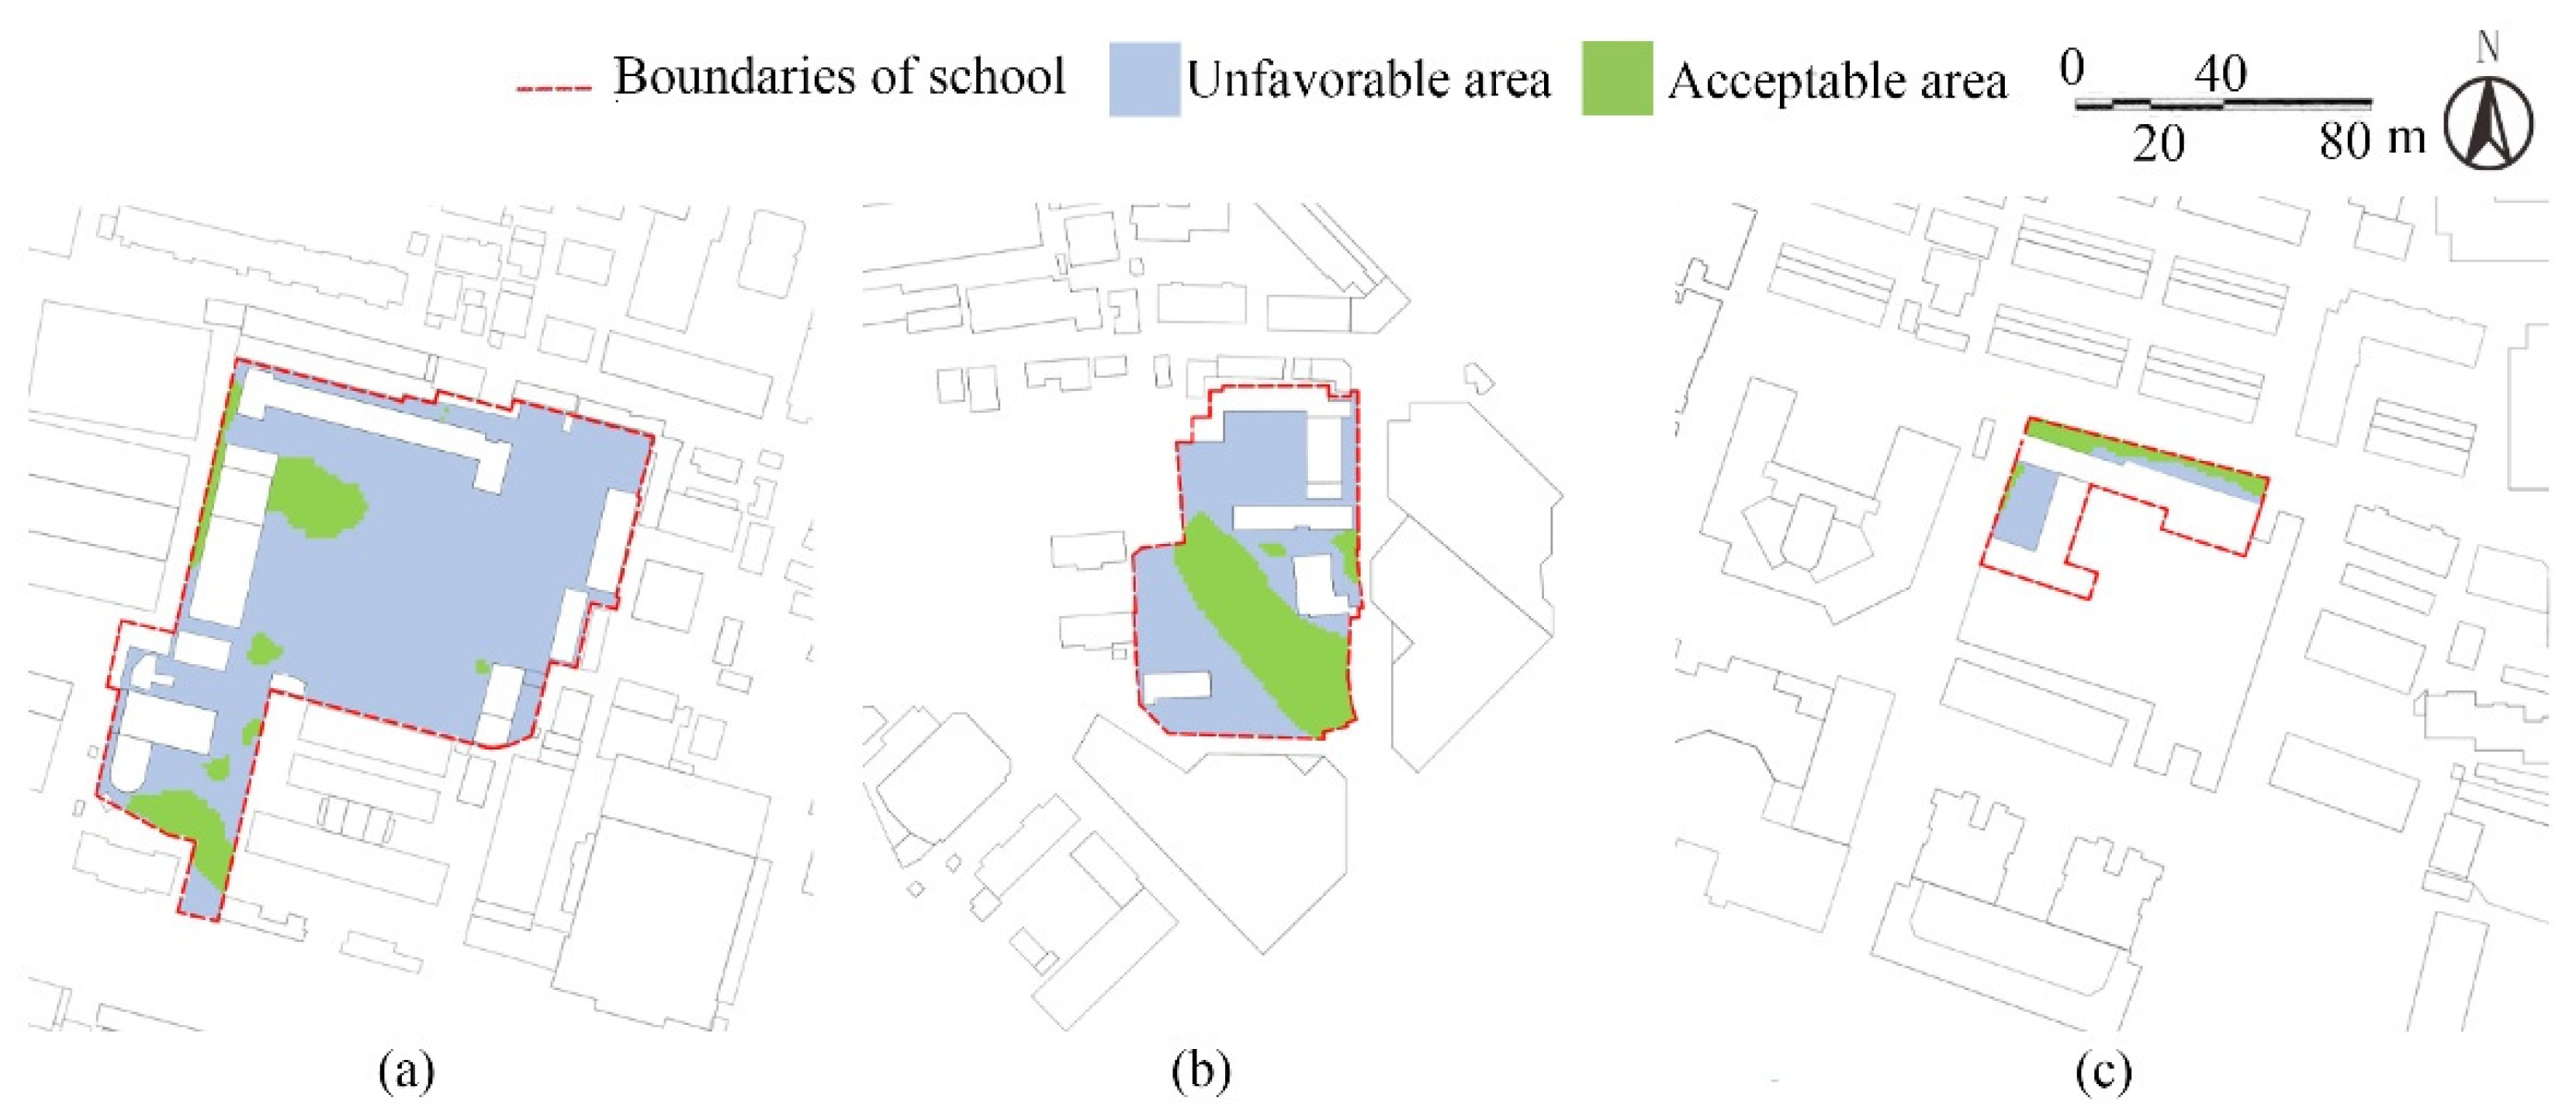
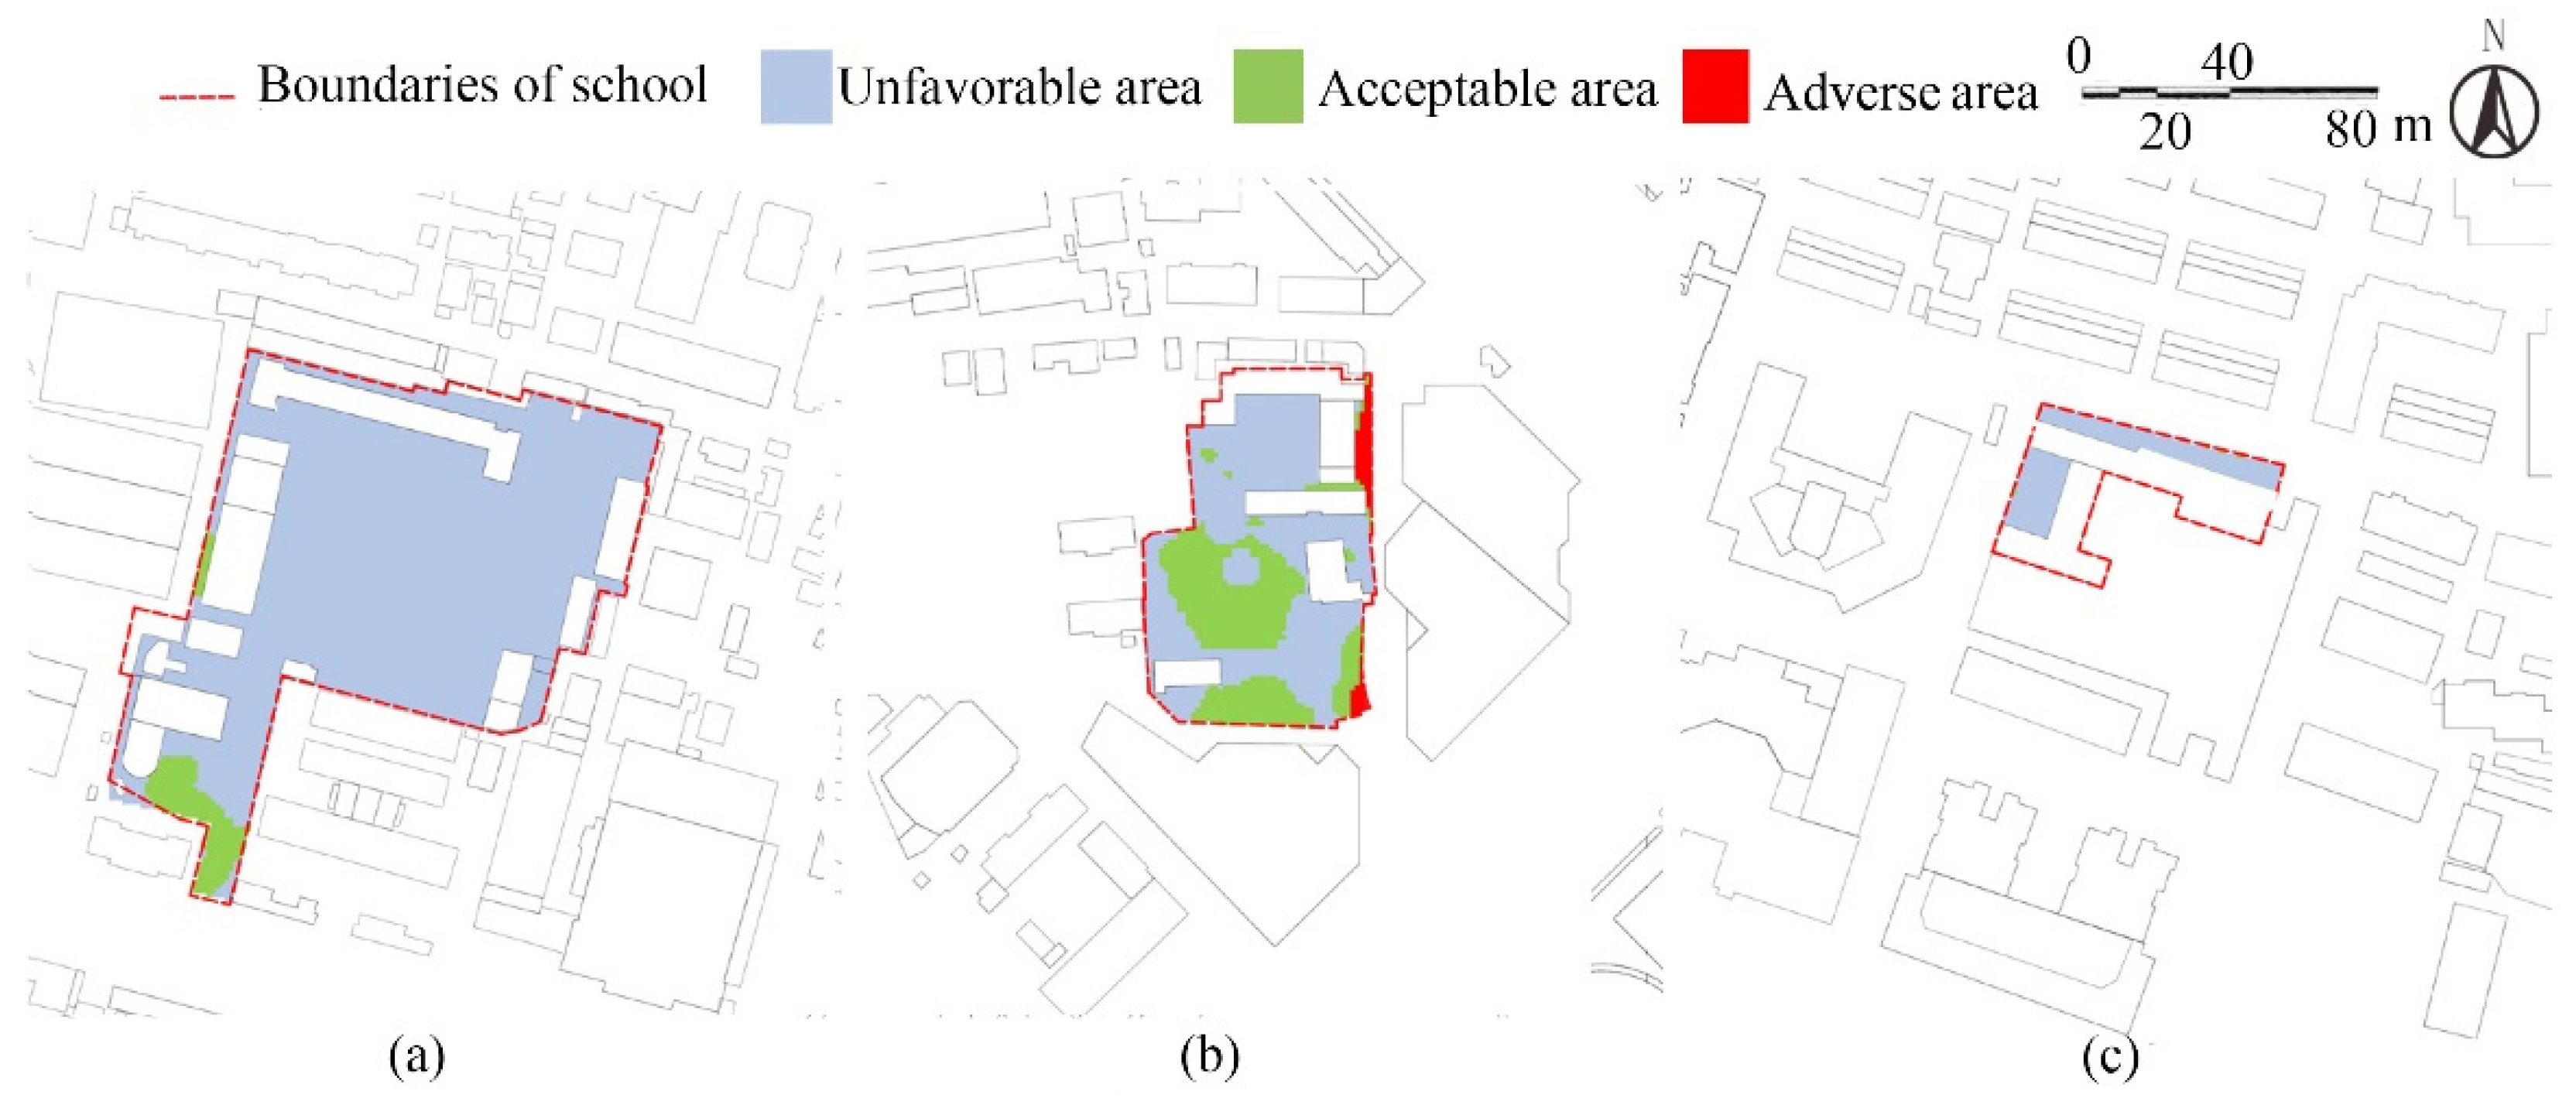
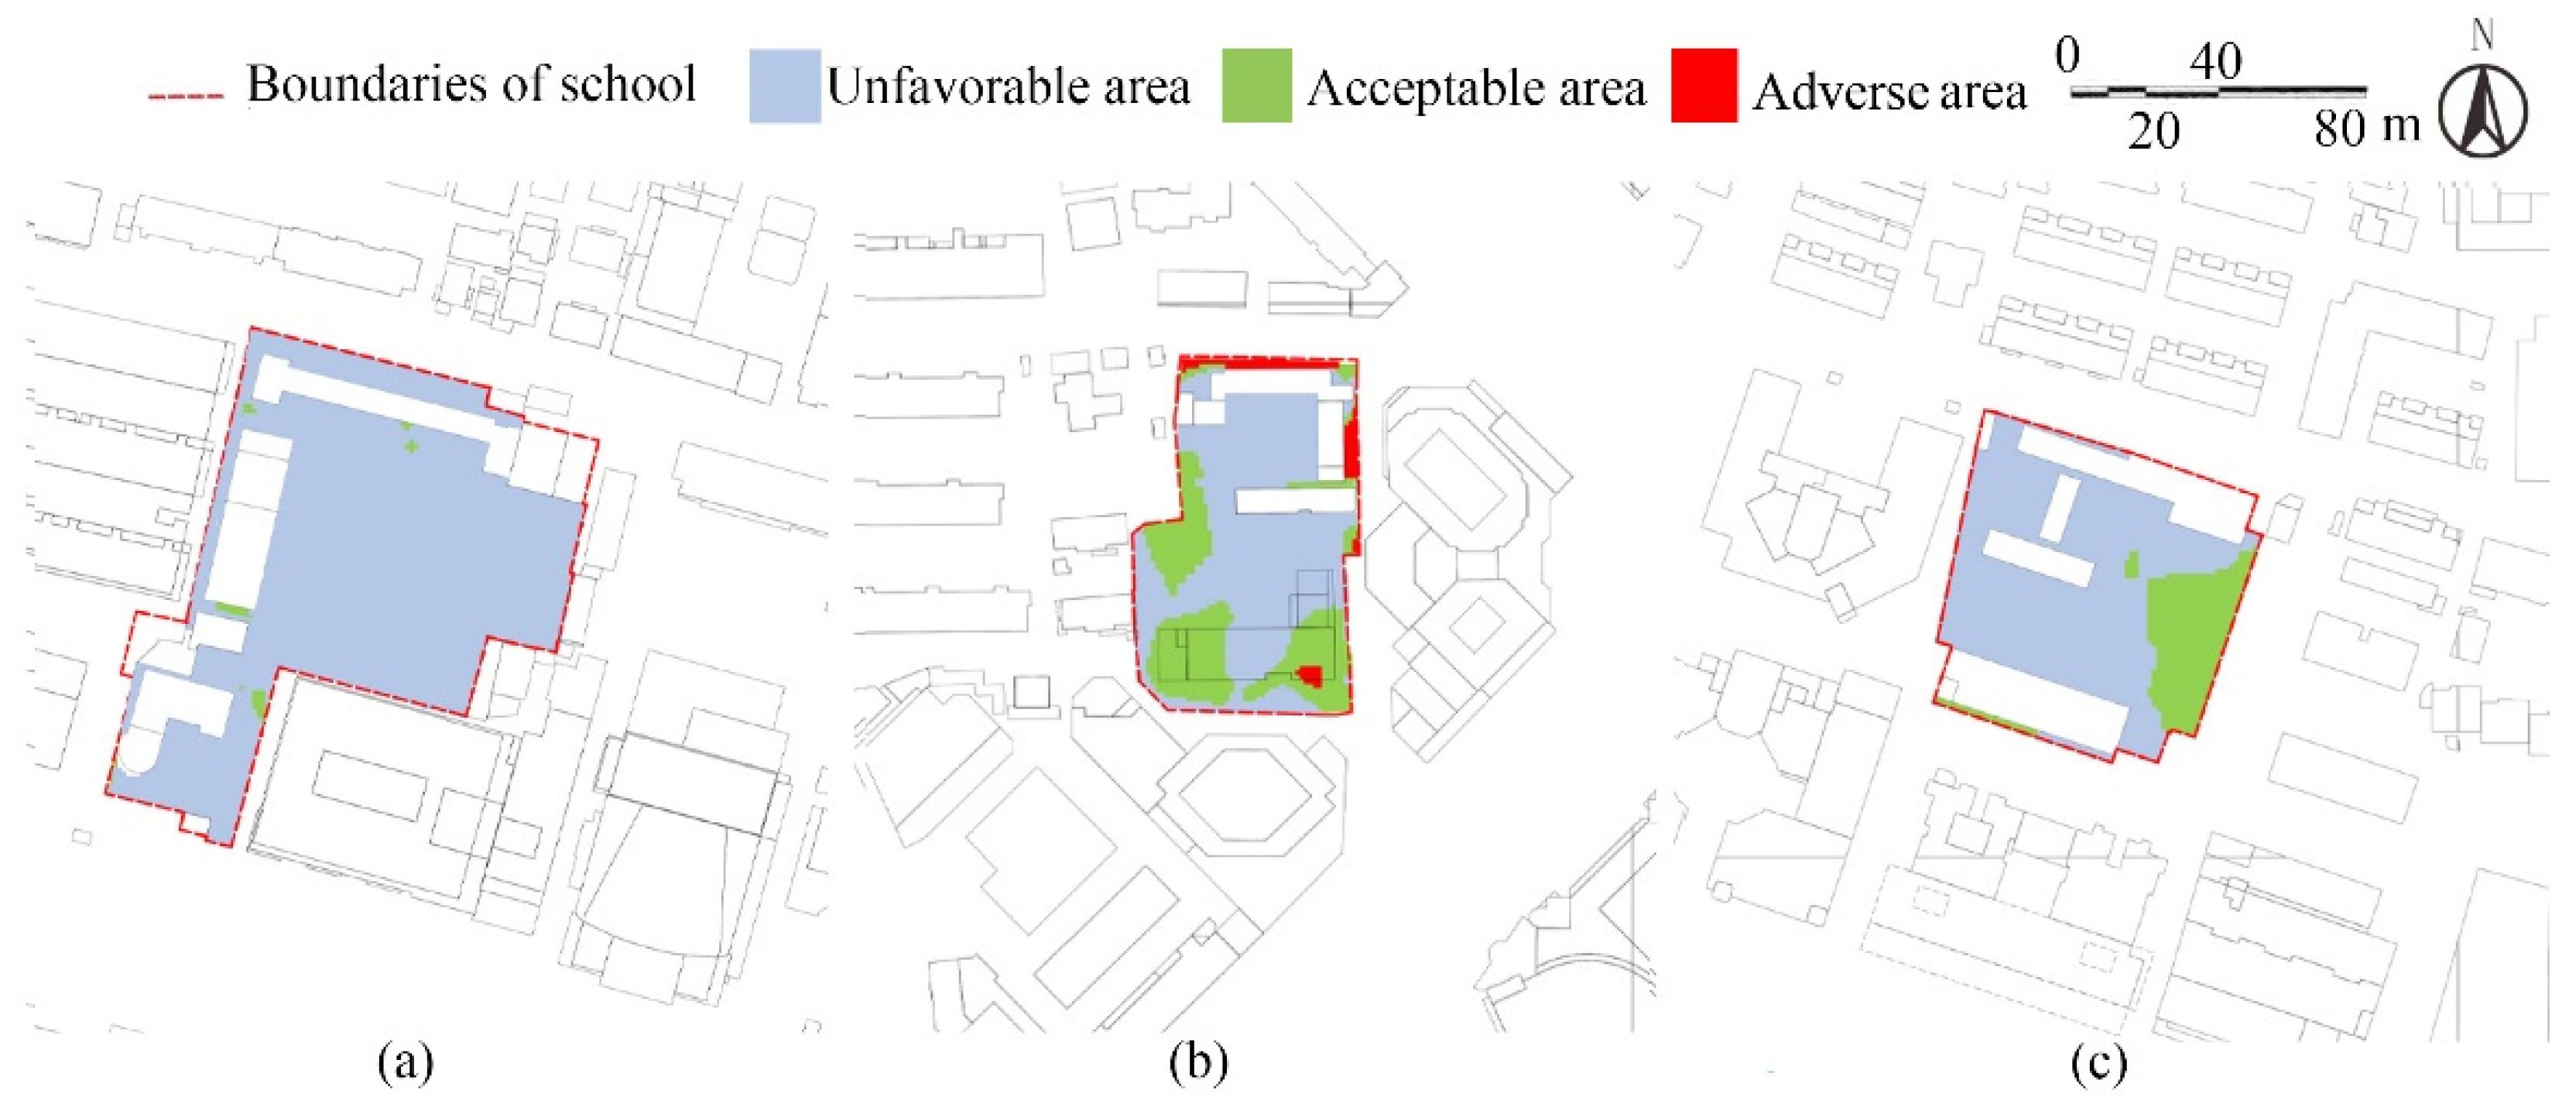
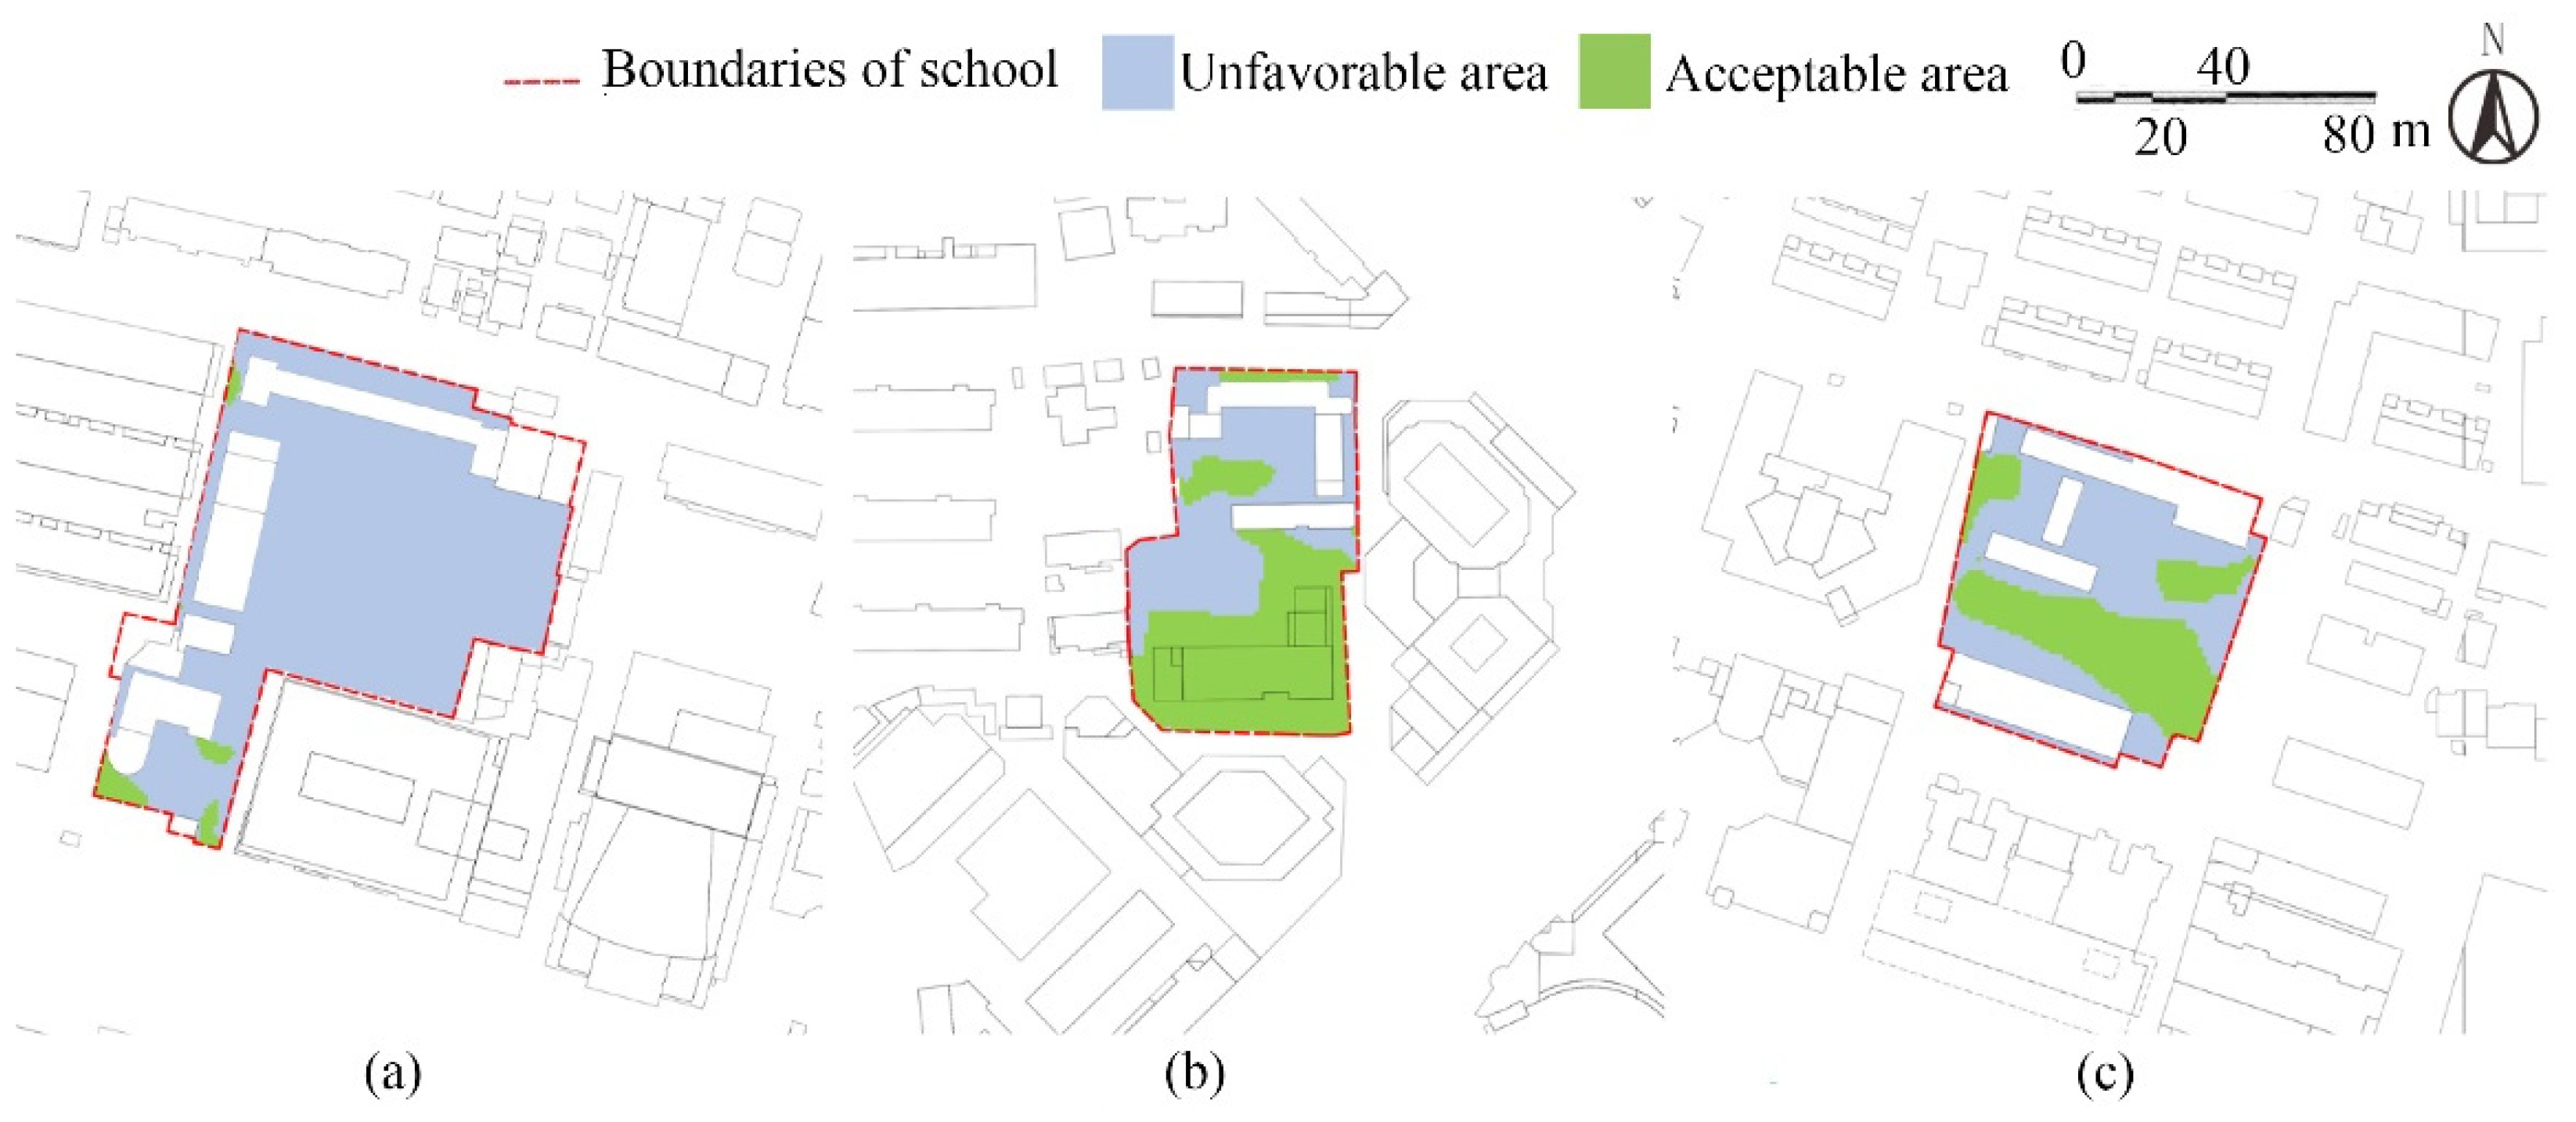
3.2. Changes in Wind Comfort in Summer and Winter
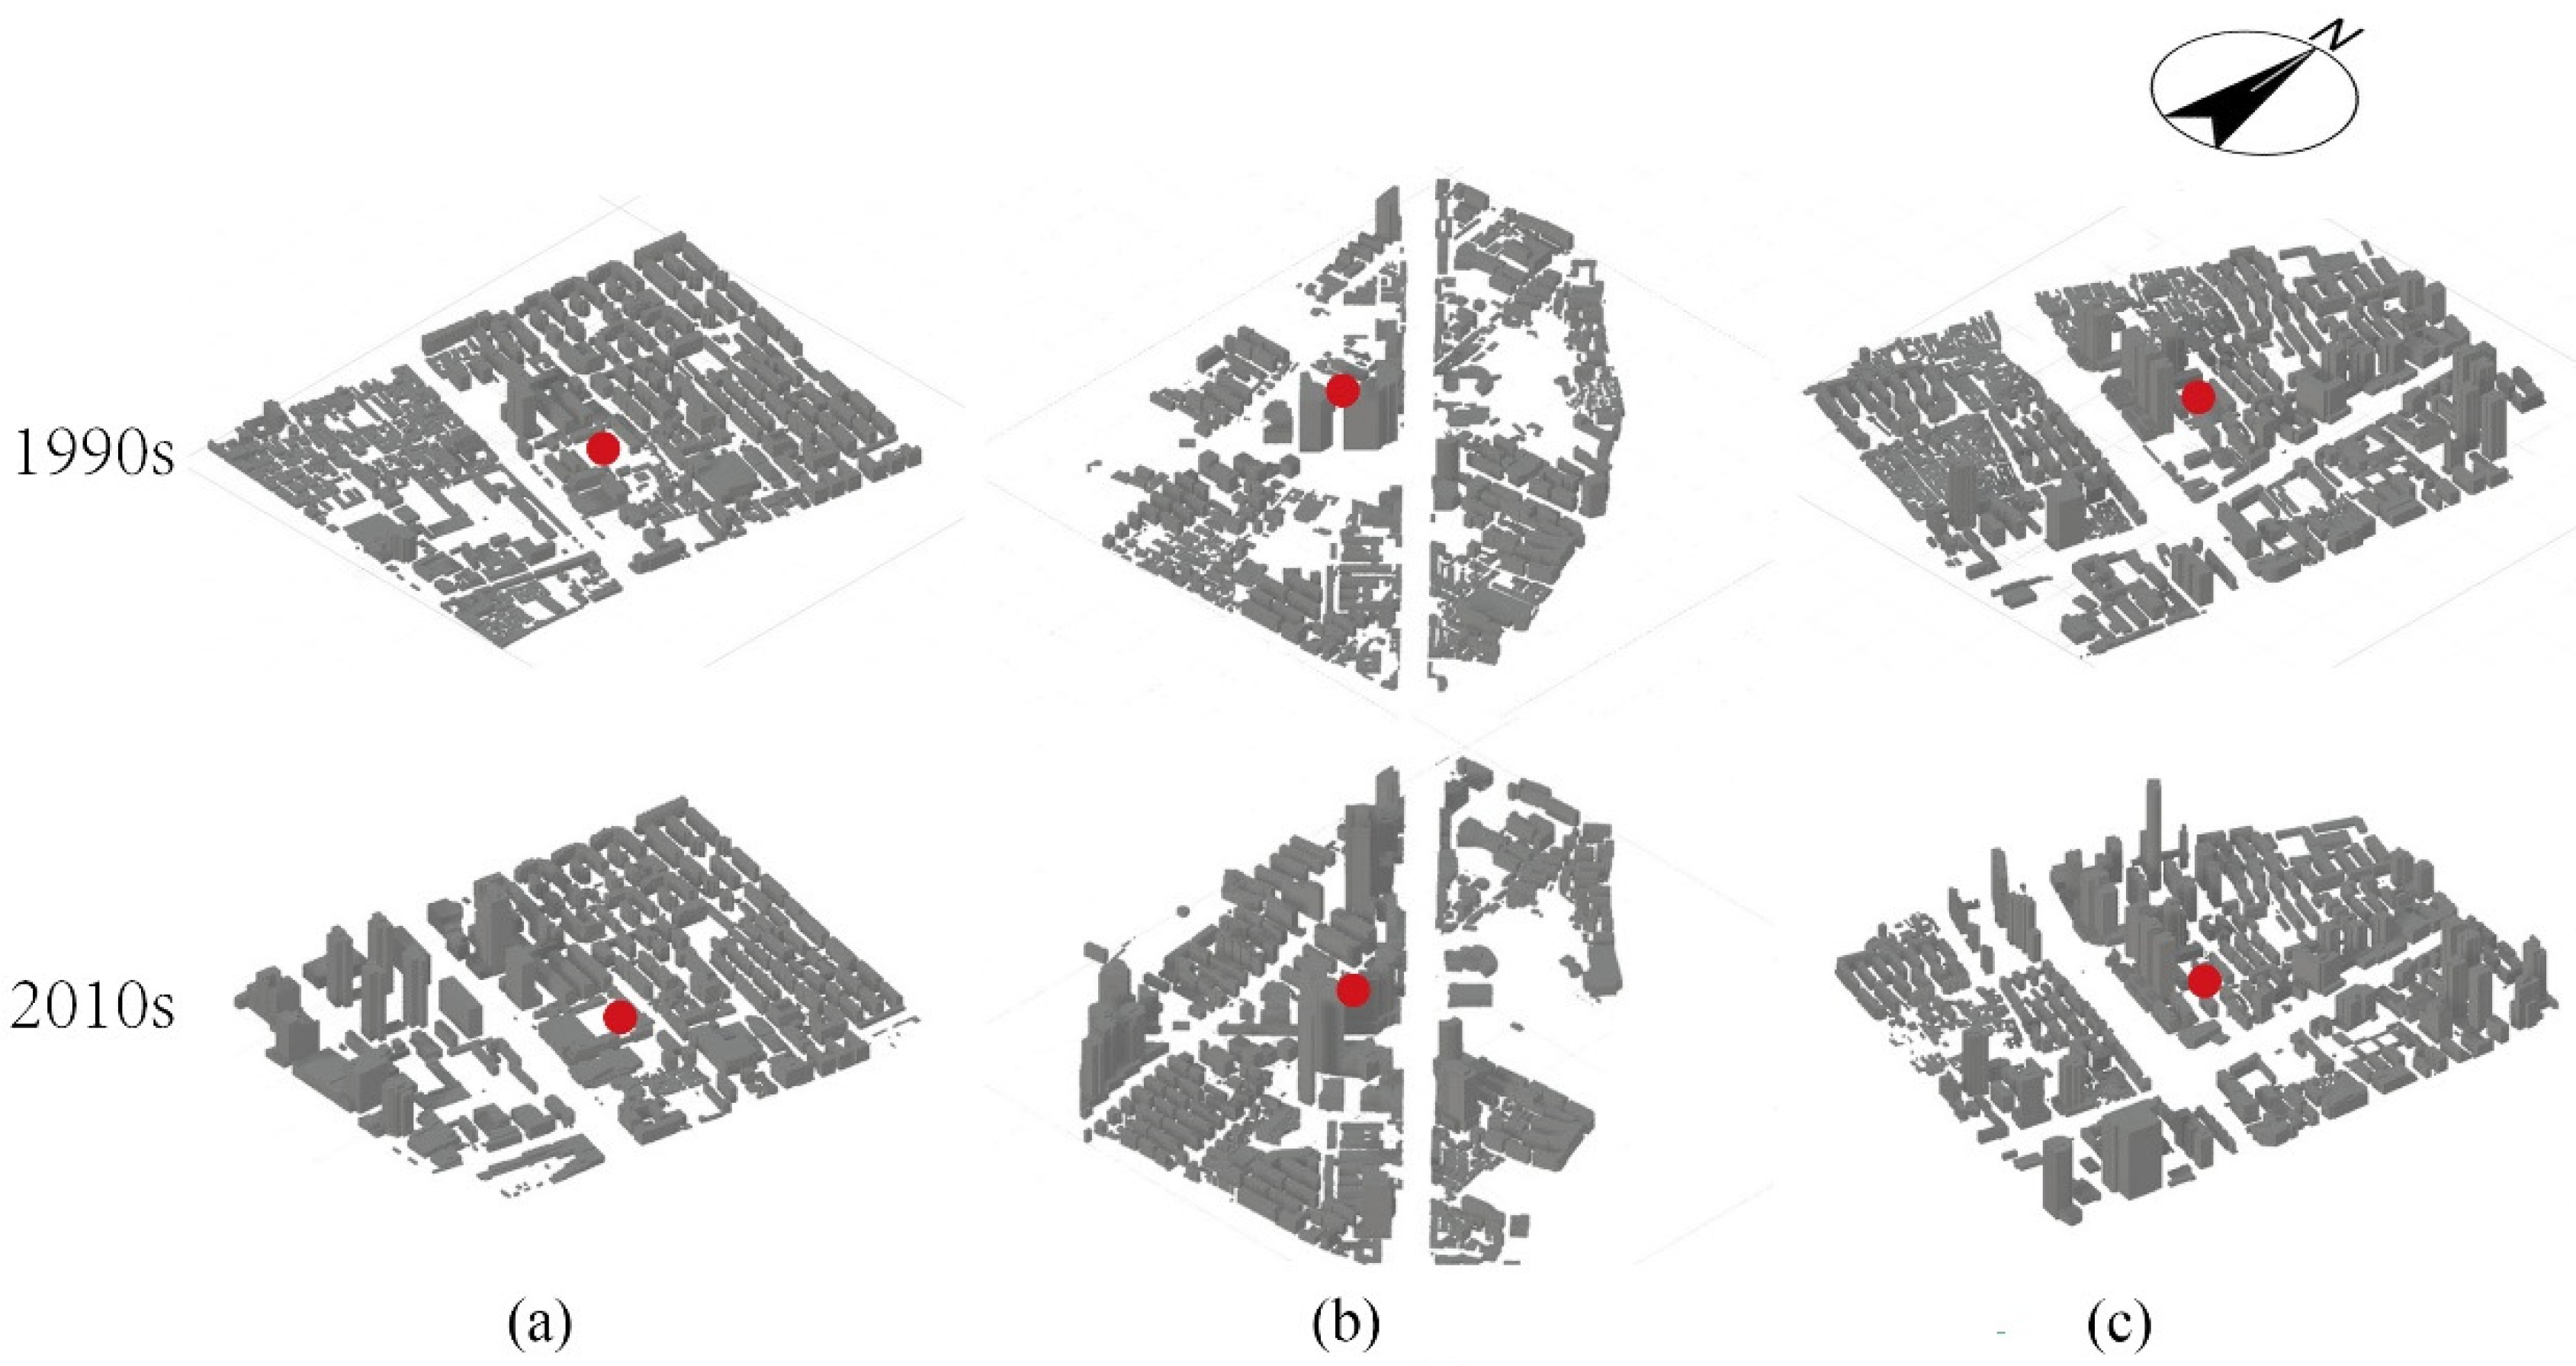
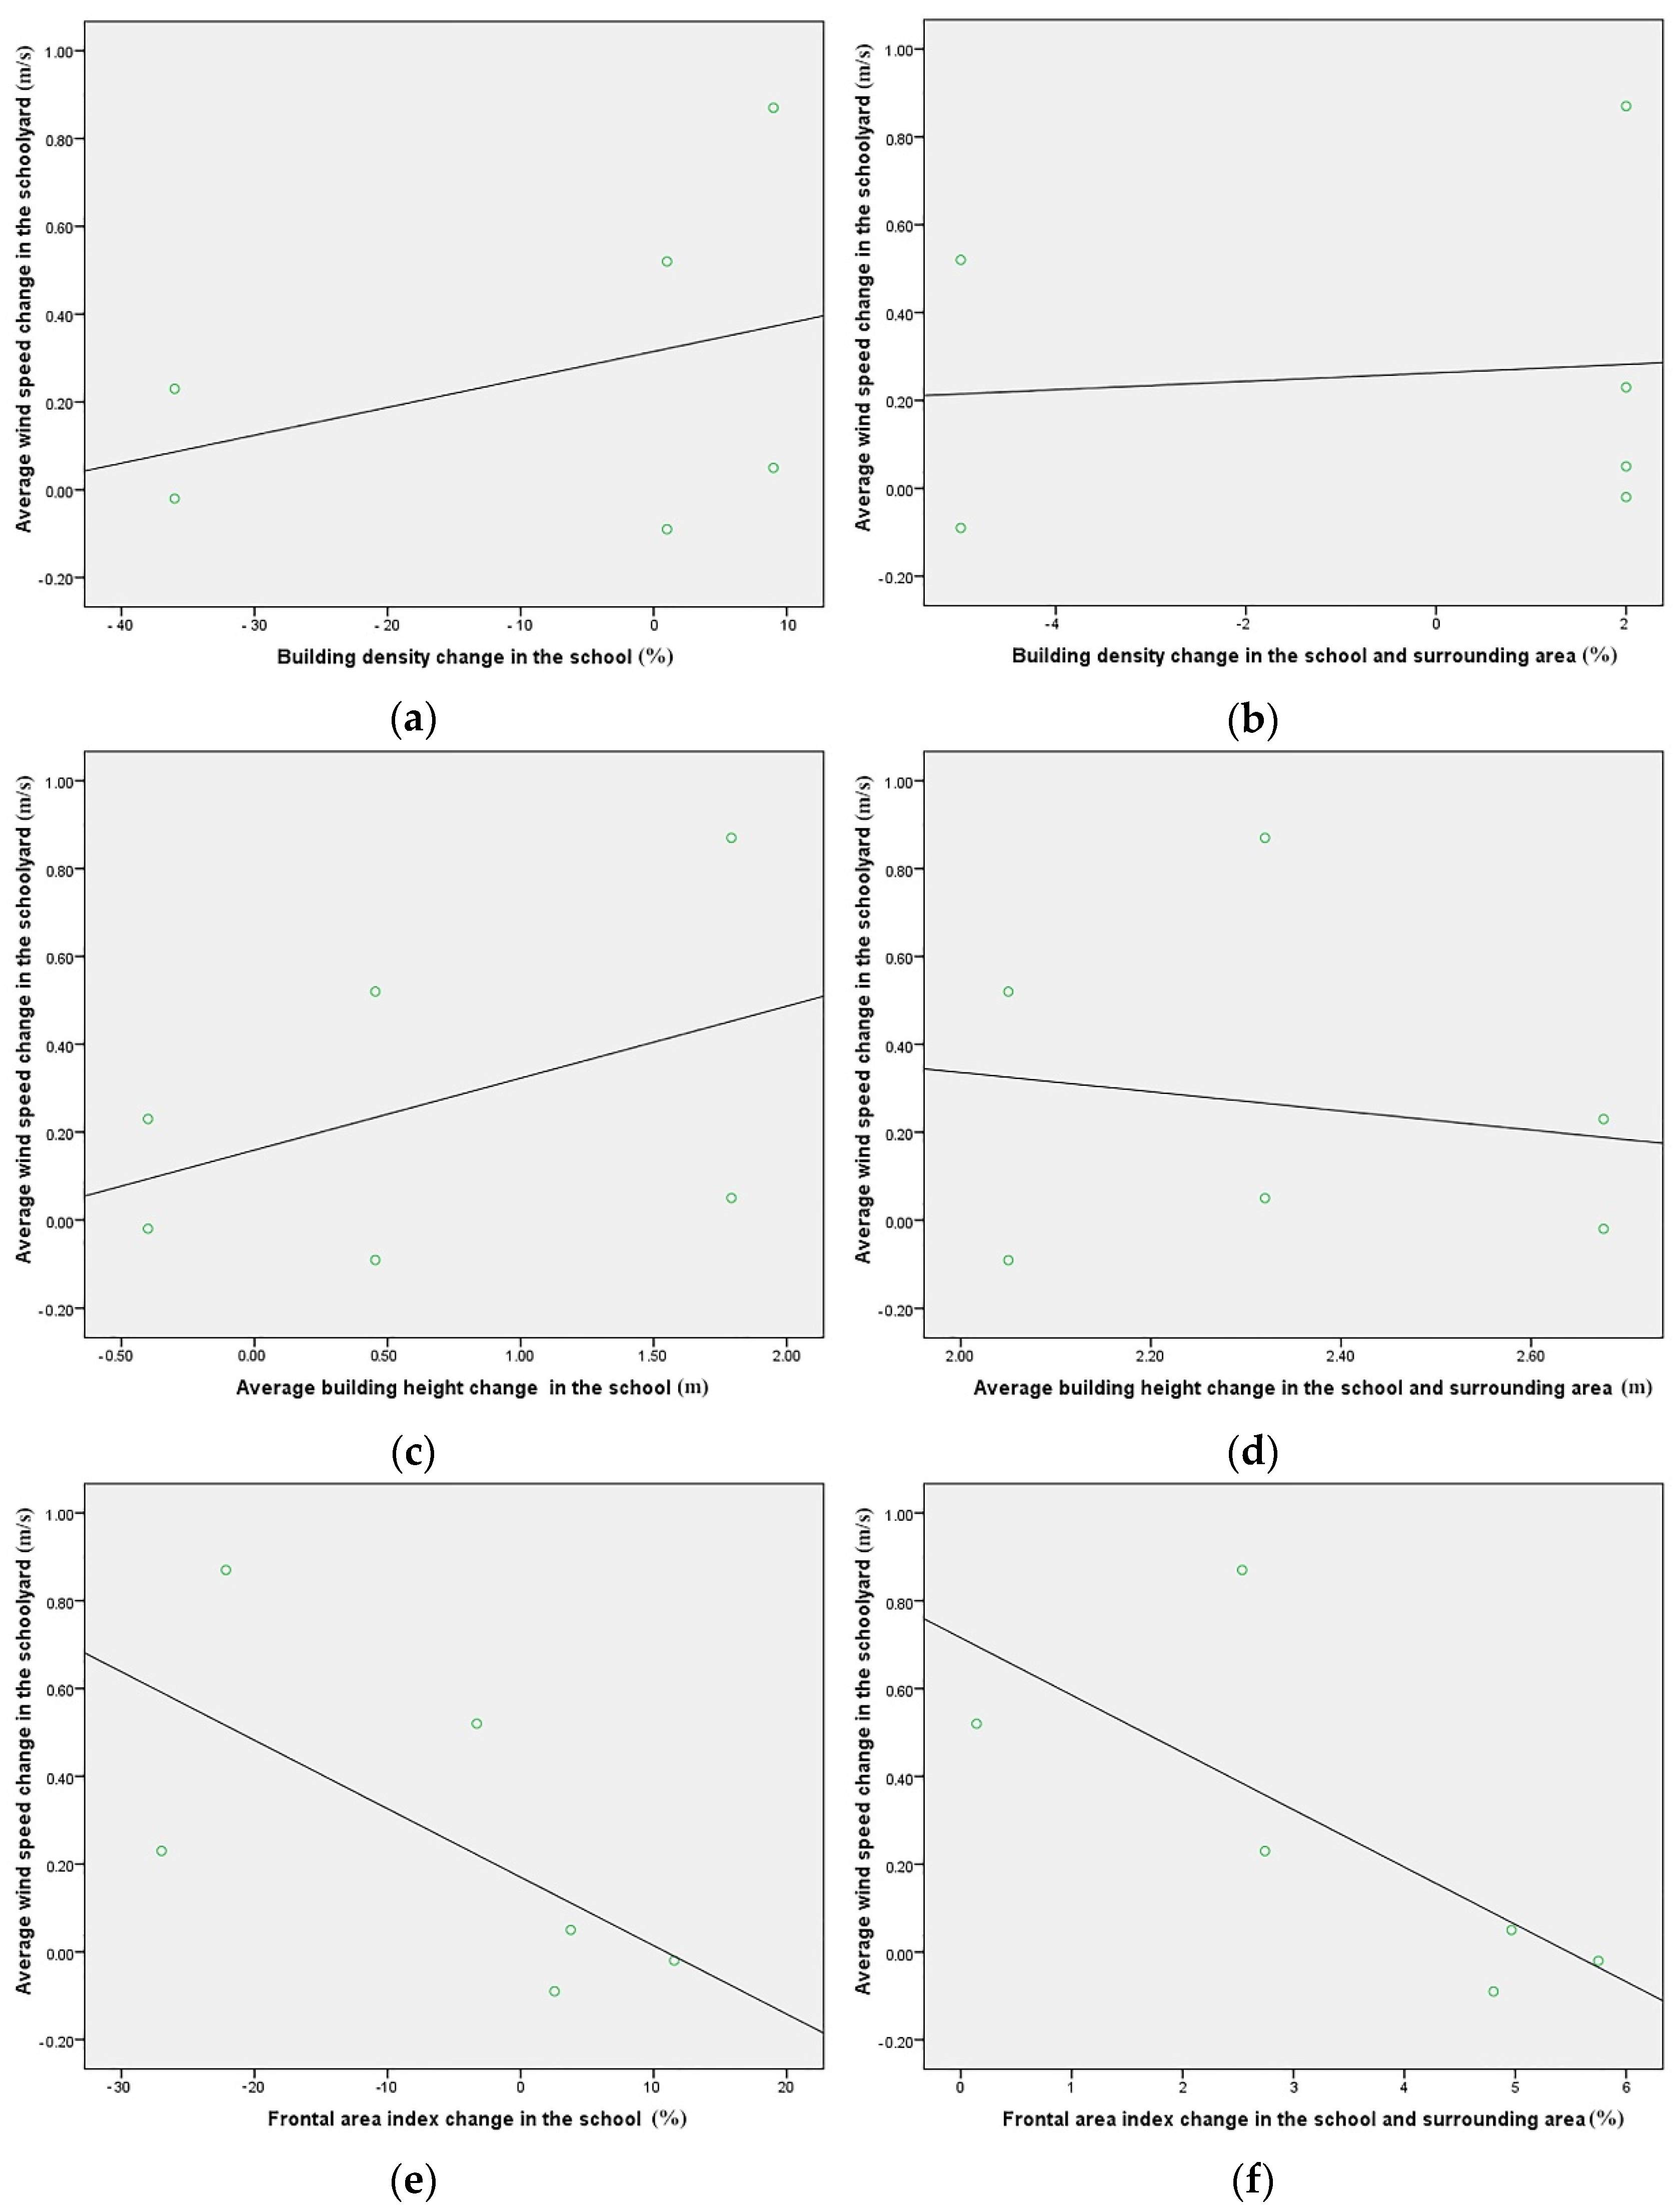
3.3. The Effect of School and Surrounding Area Morphology
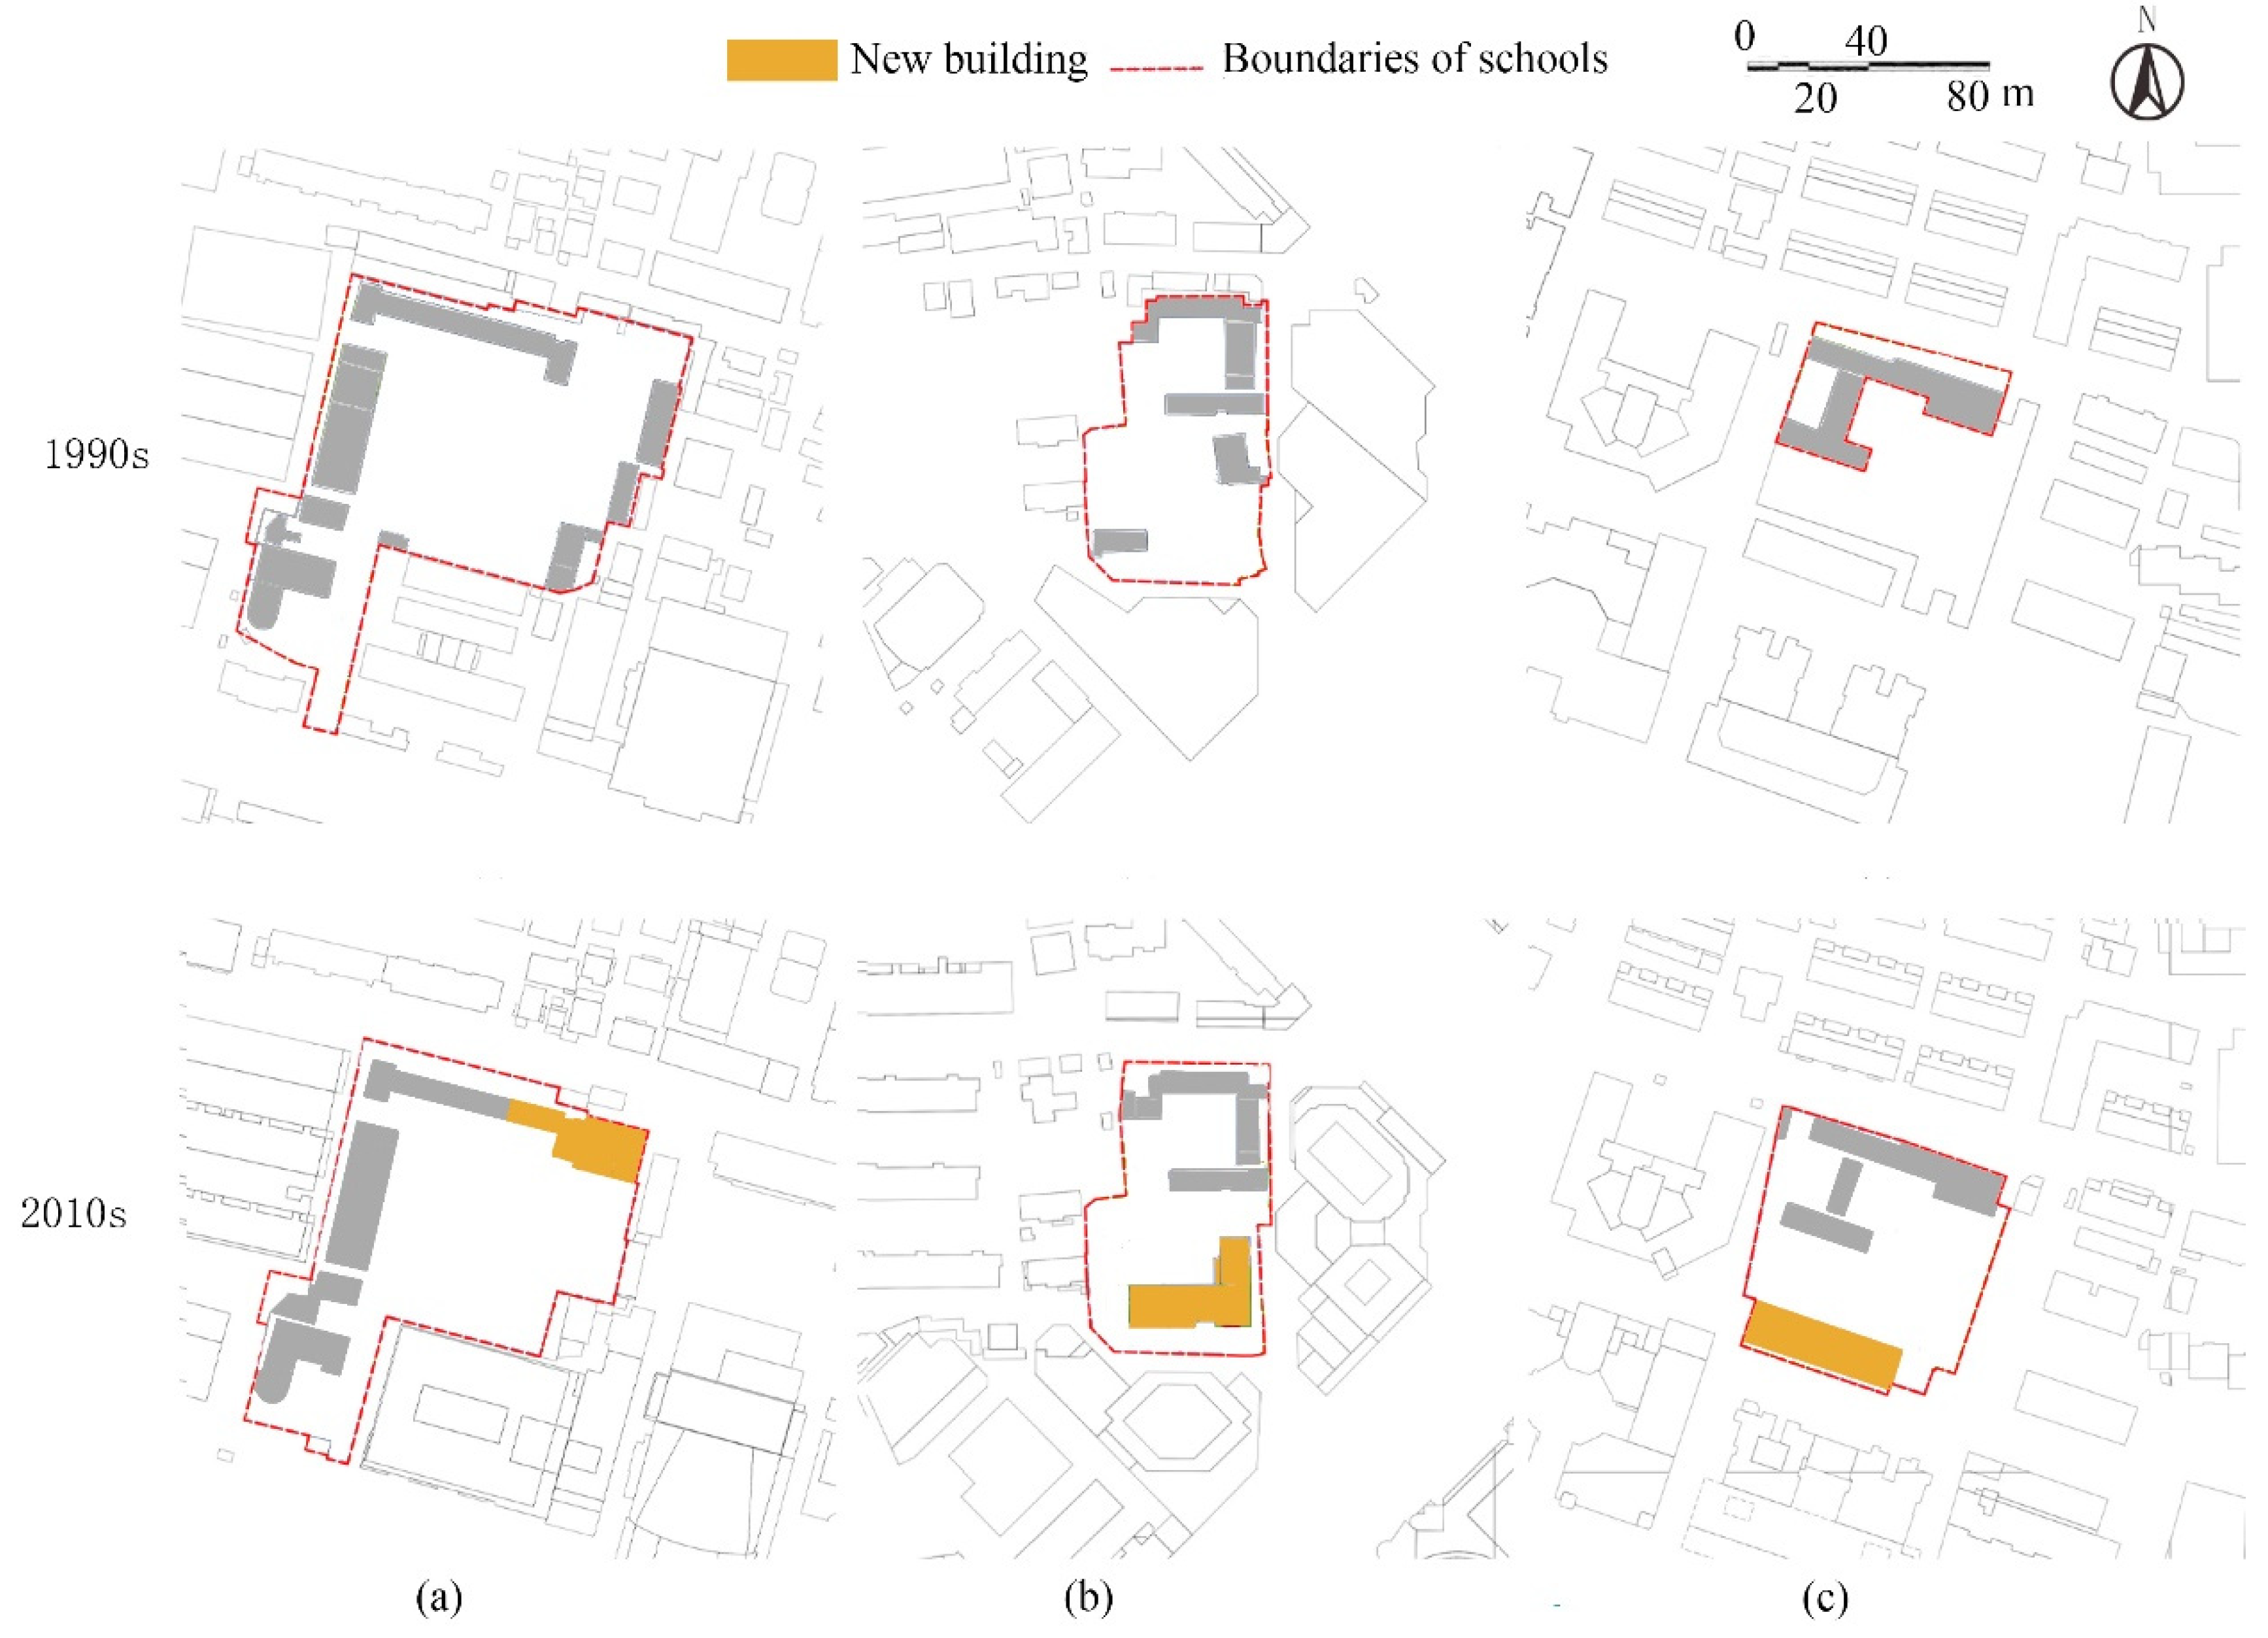
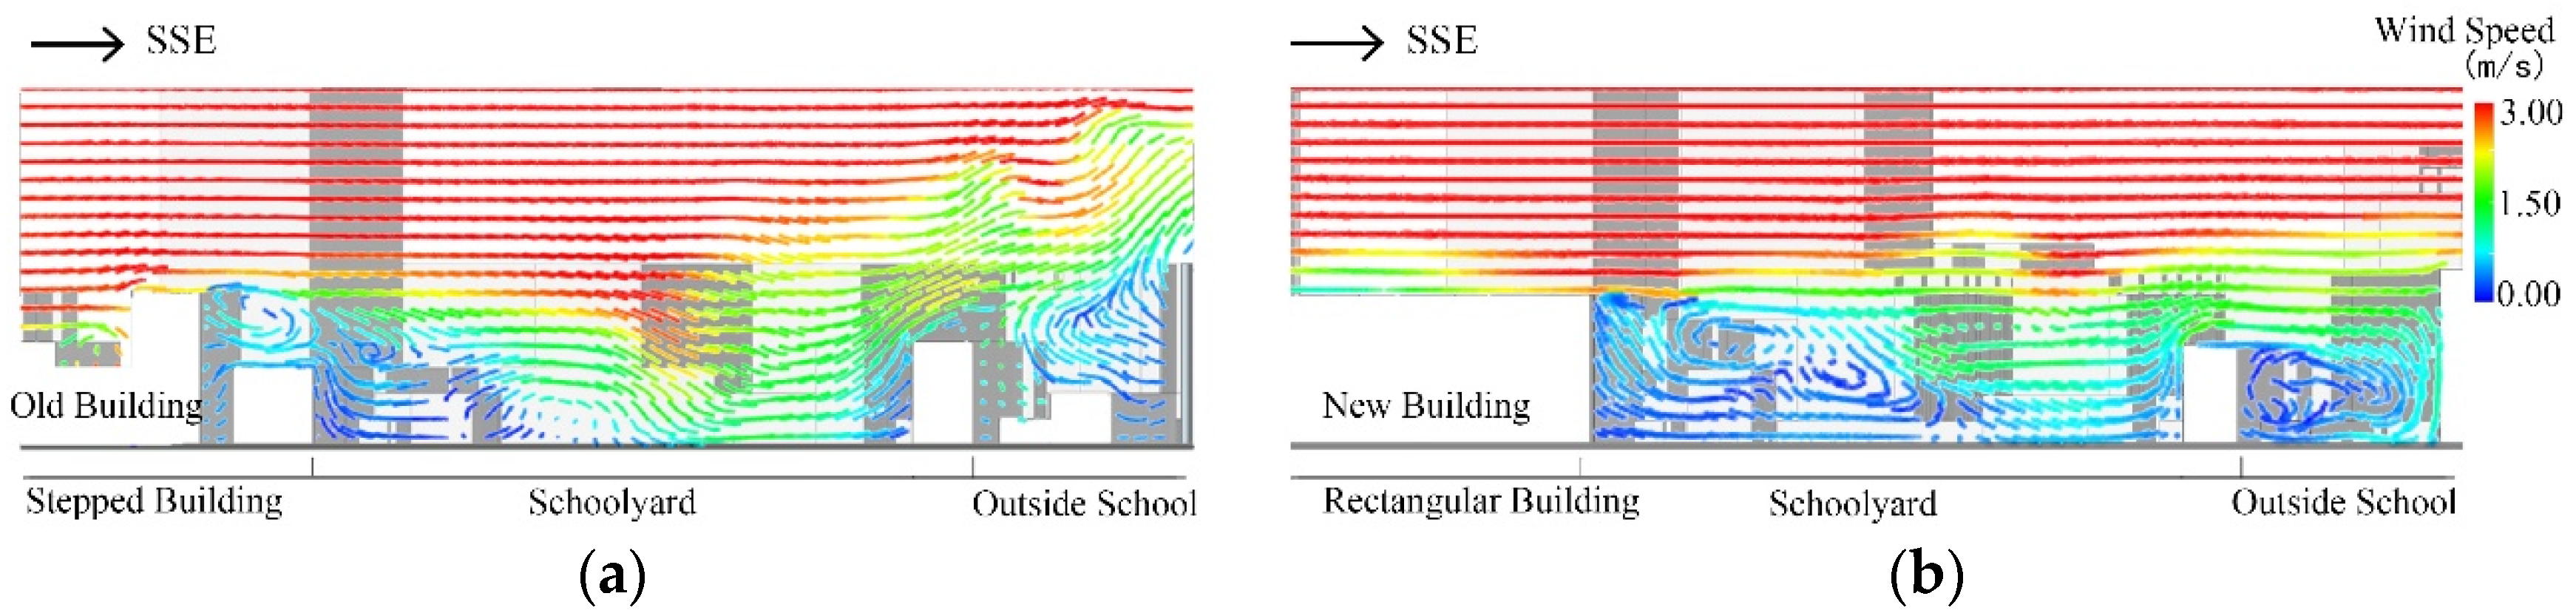
3.4. Effect of the Architectural Form
4. Conclusions
Author Contributions
Funding
Institutional Review Board Statement
Informed Consent Statement
Data Availability Statement
Acknowledgments
Conflicts of Interest
References
- Peng, L.; Liu, J.P.; Wang, Y.; Chan, P.W.; Lee, T.C.; Peng, F.; Li, Y.G. Wind weakening in a dense high-rise city due to over nearly five decades of urbanization. Build. Environ. 2018, 138, 207–220. [Google Scholar] [CrossRef]
- Ng, E. Policies and technical guidelines for urban planning of high-density cities—Air ventilation assessment (AVA) of Hong Kong. Build. Environ. 2009, 44, 1478–1488. [Google Scholar] [CrossRef]
- Vautard, R.; Cattiaux, J.; Yiou, P.; Thepaut, J.N.; Ciais, P. Northern hemisphere atmospheric stilling partly attributed to an increase in surface roughness. Nat. Geosci. 2010, 3, 756–761. [Google Scholar] [CrossRef]
- Liu, Z.R.; Hu, B.; Wang, L.L.; Wu, F.K.; Gao, W.K.; Wang, Y.S. Seasonal and diurnal variation in particulate matter (PM10 and PM2.5) at an urban site of Beijing: Analyses from a 9-year study. Environ. Sci. Pollut. Res. 2015, 22, 627–642. [Google Scholar] [CrossRef]
- Nikolopoulou, M.; Lykoudis, S. Use of outdoor spaces and microclimate in a Mediterranean urban area. Build. Environ. 2007, 42, 3691–3707. [Google Scholar] [CrossRef] [Green Version]
- Oke, T.R. City size and the urban heat island. Atmos. Environ. 1967 1973, 7, 769–779. [Google Scholar] [CrossRef]
- Ahmadi, M.; Sharifi, A.; Dorosti, S.; Ghoushchi, S.J.; Ghanbari, N. Investigation of effective climatology parameters on COVID-19 outbreak in Iran. Sci. Total Environ. 2020, 729, 7. [Google Scholar] [CrossRef]
- Mittal, H.; Sharma, A.; Gairola, A. A review on the study of urban wind at the pedestrian level around buildings. J. Build. Eng. 2018, 18, 154–163. [Google Scholar] [CrossRef]
- Falk, B. Effects of thermal stress during rest and exercise in the paediatric population. Sports Med. 1998, 25, 221–240. [Google Scholar] [CrossRef]
- Vanos, J.K. Children’s health and vulnerability in outdoor microclimates: A comprehensive review. Environ. Int. 2015, 76, 1–15. [Google Scholar] [CrossRef]
- Santamouris, M.; Synnefa, A.; Asssimakopoulos, M.; Livada, I.; Pavlou, K.; Papaglastra, M.; Gaitani, N.; Kolokotsa, D.; Assimakopoulos, V. Experimental investigation of the air flow and indoor carbon dioxide concentration in classrooms with intermittent natural ventilation. J. Phys. Chem. C 2008, 113, 1833–1843. [Google Scholar] [CrossRef]
- Heracleous, C.; Michael, A. Thermal comfort models and perception of users in free-running school buildings of east-mediterranean region. Energy Build. 2020, 215, 109912. [Google Scholar] [CrossRef]
- Baruah, P.; Singh, M.K.; Mahapatra, S. Thermal Comfort in Naturally Ventilated Classrooms. In Proceedings of the 30th International Plea Conference, Ahmedabad, India, 16–18 December 2014. [Google Scholar]
- Heracleous, C.; Michael, A. Experimental assessment of the impact of natural ventilation on indoor air quality and thermal comfort conditions of educational buildings in the eastern mediterranean region during the heating period. J. Build. Eng. 2019, 26, 100917. [Google Scholar] [CrossRef]
- Du, Y.; Mak, C.M.; Tang, B.S. Effects of building height and porosity on pedestrian level wind comfort in a high-density urban built environment. Build. Simul. 2018, 11, 1215–1228. [Google Scholar] [CrossRef]
- Kubota, T.; Miura, M.; Tominaga, Y.; Mochida, A. Wind tunnel tests on the relationship between building density and pedestrian-level wind velocity: Development of guidelines for realizing acceptable wind environment in residential neighborhoods. Build. Environ. 2008, 43, 1699–1708. [Google Scholar] [CrossRef]
- Gao, Y.; Yao, R.; Li, B.; Turkbeyler, E.; Luo, Q.; Short, A. Field studies on the effect of built forms on urban wind environments. Renew. Energy 2012, 46, 148–154. [Google Scholar] [CrossRef]
- Yuan, C.; Ng, E. Building porosity for better urban ventilation in high-density cities—A computational parametric study. Build. Environ. 2012, 50, 176–189. [Google Scholar] [CrossRef]
- Xu, Z.; Han, L.Y. The historical changes of winds above open spaces and the surroundings of Nanjing. Urban Plan. Forum 2018, 242, 81–88. [Google Scholar]
- Blocken, B.; Stathopoulos, T.; van Beeck, J.P.A.J. Pedestrian-level wind conditions around buildings: Review of wind-tunnel and CFD techniques and their accuracy for wind comfort assessment. Build. Environ. 2016, 100, 50–81. [Google Scholar] [CrossRef]
- Kim, H.; Macdonald, E. Wind and the city: An evaluation of San Francisco’s planning approach since 1985. Environ. Plan. B Urban Anal. City Sci. 2016, 44, 10–32. [Google Scholar] [CrossRef] [Green Version]
- Soligo, M.J.; Irwin, P.A.; Williams, C.J.; Schuyler, G.D. A comprehensive assessment of pedestrian comfort including thermal effects. J. Wind. Eng. Ind. Aerodyn. 1998, 77, 753–766. [Google Scholar] [CrossRef]
- Cheng, V.; Ng, E. Thermal comfort in urban open spaces for Hong Kong. Archit. Sci. Rev. 2006, 49, 236–242. [Google Scholar] [CrossRef]
- Yang, J.; Zhang, T.; Fu, X. Coupling Mechanism between Wind Environment and Spatial Form and Optimization Design in Urban Center; Southeast University Press: Nanjing, China, 2016; pp. 37–65. [Google Scholar]
- Li, H.; Guo, B.; Han, M.; Tian, M.; Zhang, J. Particulate matters pollution characteristic and the correlation between PM (PM2.5, PM10) and meteorological factors during the summer in Shijiazhuang. J. Environ. Prot. 2015, 6, 457. [Google Scholar] [CrossRef] [Green Version]
- Bourbia, F.; Boucheriba, F. Impact of street design on urban microclimate for semiarid climate (Constantine). Renew. Energy 2010, 35, 343–347. [Google Scholar] [CrossRef]
- Man, S.W.; Niched, J.E.; To, P.H.; Wang, J. A simple method for designation of urban ventilation corridors and its application to urban heat island analysis. Build. Environ. 2010, 45, 1880–1889. [Google Scholar]
- Ernest, R.; Ford, B. The role of multiple-courtyards in the promotion of convective cooling. Archit. Sci. Rev. 2012, 55, 241–249. [Google Scholar] [CrossRef] [Green Version]
- Ng, E.; Yuan, C.; Chen, L.; Ren, C.; Fung, J.C. Improving the wind environment in high-density cities by understanding urban morphology and surface roughness: A study in Hong Kong. Landsc. Urban Plan. 2011, 101, 59–74. [Google Scholar] [CrossRef] [PubMed]
- Raupach, M.R. Drag and drag partition on rough surfaces. Bound.-Layer Meteorol. 1992, 60, 375–395. [Google Scholar] [CrossRef]
- Moonen, P.; Dorer, V.; Carmeliet, J. Evaluation of the ventilation potential of courtyards and urban street canyons using RANS and LES. J. Wind. Eng. Ind. Aerodyn. 2011, 99, 414–423. [Google Scholar] [CrossRef]
- Niu, J.; Liu, J.; Lee, T.C.; Lin, Z.; Mak, C.; Tse, K.T.; Kwok, K.C.S. A new method to assess spatial variations of outdoor thermal comfort: Onsite monitoring results and implications for precinct planning. Build. Environ. 2015, 91, 263–270. [Google Scholar] [CrossRef] [Green Version]


| School | School Area (m2) | Building Density of School (%) | Building Density of Surrounding Areas (%) | ||||
|---|---|---|---|---|---|---|---|
| 1990s | 2010s | 1990s | 2010s | 1990s | 2010s | ||
| (a) | Changjiang Road Primary School | 11,446 | 9916 | 24 | 25 | 42 | 37 |
| (b) | Chibi Road Primary School (Shanxi Road Campus) | 4940 | 5212 | 21 | 30 | 30 | 32 |
| (c) | Jianye Road Primary School | 1739 | 5791 | 63 | 27 | 37 | 39 |
| Category | Summer | Winter |
|---|---|---|
| Unfavorable | <1 m/s | <1 m/s |
| Acceptable | 1 m/s ≤ v ≤ 5 m/s | 1 m/s ≤ v ≤ 2 m/s |
| Adverse | >5 m/s | >2 m/s |
| School | 1990s | 2010s | Mean Wind Speed Change (%) | ||||
|---|---|---|---|---|---|---|---|
| Min | Max | Mean | Min | Max | Mean | ||
| Changjiang Road Primary School | 0.00 | 2.20 | 0.47 | 0.00 | 2.35 | 0.38 | −19 |
| Chibi Road Primary School (Shanxi Road Campus) | 0.01 | 3.2 | 0.88 | 0.01 | 2.66 | 1.23 | +40 |
| Jianye Road Primary School | 0.04 | 1.48 | 0.84 | 0.01 | 1.58 | 0.85 | +1 |
| School | 1990s | 2010s | Mean Wind Speed Change (%) | ||||
|---|---|---|---|---|---|---|---|
| Min | Max | Mean | Min | Max | Mean | ||
| Changjiang Road Primary School | 0.00 | 1.70 | 0.34 | 0.00 | 1.41 | 0.39 | +15 |
| Chibi Road Primary School (Shanxi Road Campus) | 0.02 | 3.28 | 0.91 | 0.01 | 3.18 | 0.89 | −2 |
| Jianye Road Primary School | 0.02 | 1.09 | 0.47 | 0.01 | 1.44 | 0.70 | +49 |
Publisher’s Note: MDPI stays neutral with regard to jurisdictional claims in published maps and institutional affiliations. |
© 2021 by the authors. Licensee MDPI, Basel, Switzerland. This article is an open access article distributed under the terms and conditions of the Creative Commons Attribution (CC BY) license (https://creativecommons.org/licenses/by/4.0/).
Share and Cite
Xu, Q.; Xu, Z.; Sun, C. Evaluation Schoolyard Wind Comfort Changes Due to Rapid Developments: Case Study of Nanjing, China. Atmosphere 2022, 13, 43. https://doi.org/10.3390/atmos13010043
Xu Q, Xu Z, Sun C. Evaluation Schoolyard Wind Comfort Changes Due to Rapid Developments: Case Study of Nanjing, China. Atmosphere. 2022; 13(1):43. https://doi.org/10.3390/atmos13010043
Chicago/Turabian StyleXu, Qiuxia, Zhen Xu, and Chayn Sun. 2022. "Evaluation Schoolyard Wind Comfort Changes Due to Rapid Developments: Case Study of Nanjing, China" Atmosphere 13, no. 1: 43. https://doi.org/10.3390/atmos13010043
APA StyleXu, Q., Xu, Z., & Sun, C. (2022). Evaluation Schoolyard Wind Comfort Changes Due to Rapid Developments: Case Study of Nanjing, China. Atmosphere, 13(1), 43. https://doi.org/10.3390/atmos13010043