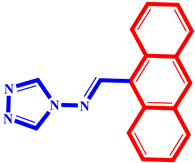
Article

Integrative Approach for Designing Novel Triazole Derivatives as α-Glucosidase Inhibitors: QSAR, Molecular Docking, ADMET, and Molecular Dynamics Investigations

1
Laboratory of Analytical and Molecular Chemistry, Faculty of Sciences Ben M’Sik, Hassan II University of Casablanca, Casablanca 7955, Morocco
2
Department of Chemistry, College of Science, United Arab Emirates University (UAEU), Al Ain P.O. Box 15551, United Arab Emirates
*
Authors to whom correspondence should be addressed.
Pharmaceuticals 2024, 17(2), 261; https://doi.org/10.3390/ph17020261
Submission received: 17 January 2024 / Revised: 11 February 2024 / Accepted: 14 February 2024 / Published: 19 February 2024
(This article belongs to the Special Issue Triazole and Derivatives in Medicinal Chemistry)

Abstract

:

Abstract

In response to the increasing prevalence of diabetes mellitus and the limitations associated with the current treatments, there is a growing need to develop novel medications for this disease. This study is focused on creating new compounds that exhibit a strong inhibition of alpha-glucosidase, which is a pivotal enzyme in diabetes control. A set of 33 triazole derivatives underwent an extensive QSAR analysis, aiming to identify the key factors influencing their inhibitory activity against α-glucosidase. Using the multiple linear regression (MLR) model, seven promising compounds were designed as potential drugs. Molecular docking and dynamics simulations were employed to shed light on the mode of interaction between the ligands and the target, and the stability of the obtained complexes. Furthermore, the pharmacokinetic properties of the designed compounds were assessed to predict their behavior in the human body. The binding free energy was also calculated using MMGBSA method and revealed favorable thermodynamic properties. The results highlighted three novel compounds with high biological activity, strong binding affinity to the target enzyme, and suitability for oral administration. These results offer interesting prospects for the development of effective and well-tolerated medications against diabetes mellitus.

Dataset License

License under which the dataset is made available (CC0, CC-BY, CC-BY-SA, CC-BY-NC, etc.)

1. Introduction

Diabetes mellitus (DM) is a chronic metabolic disorder characterized by hyperglycemia, which can be caused by reduced insulin action, inadequate insulin synthesis, or both [1]. Hyperglycemia typically aggravates the disease burden of diabetes mellitus by contributing to the development of different macrovascular complications like peripheral and autonomic neuropathy, an increased incidence of atherosclerosis, cerebrovascular diseases, neuropathy, nephropathy, and retinopathy [2].
The main feature of diabetes mellitus (DM) is thought to be accompanied by several symptoms including polyuria, polyphagia, weight loss, and blurred vision.
According to the IDF Diabetes Atlas (International Diabetes Federation), 436 million people worldwide were estimated to have diabetes in 2021; by the end of 2045, that number might potentially increase to 700 million [3,4].
The onset of diabetes mellitus is linked to diverse lifestyle factors, including smoking, excessive alcohol consumption, inadequate physical activity, and comorbid conditions such as dyslipidemia and hypertension. Additionally, genetic predisposition, stress, and obesity contribute to the risk of diabetes [5], while enzymes like alpha-glucosidase and amylase play a role in breaking down sugars into glucose and maltose, contributing to the increase in blood glucose levels, ultimately resulting in hyperglycemia and posing challenges to the proper functioning of insulin [2].
The dual inhibition of α-glucosidase and α-amylase enzymes is the most desired strategy for combating the permanent effects produced by type 2 diabetes [6]. α-glucosidase is one of the main enzymes that breaks down carbohydrates, and it is found in the brush borders of the intestine and helps break down complex oligosaccharides into simple monosaccharides [7].
By delaying the absorption of carbohydrates in the small intestine, alpha-glucosidase inhibitors effectively prompt the pancreas to release an appropriate amount of insulin. Their antihyperglycemic effect is modest, as they do not directly impact insulin secretion but rather impede the function of alpha-glucosidase in breaking down complex sugars. However, it is crucial to recognize that alpha-glucosidase inhibitors, represented by Miglitol, Acarbose, and Voglibose, are associated with various adverse side-effects, such as nausea, bloating, and flatulence [8,9].
A wide range of biological activities have attracted the attention of academia and industry to 1,2,4-triazoles and their fused heterocyclic derivatives, which are a favored structure among nitrogen-containing heterocyclic compounds [10]. Numerous clinically available, therapeutically significant drugs have been found to have the 1,2,4-triazole core such as Sitagliptin, Voriconazole, and Fluconazole [11,12].
A triazole is a ring with five members that consists of three nitrogen atoms and two Carbon atoms connected by alternating π-bonds. C2H3N3 is the chemical formula for this heterocyclic compound. Triazoles possess structural characteristics that make them pharmacologically active, including a moderate dipole characteristic, the capacity to form Hydrogen Bonds, ion–dipole interactions, π–π stacking, cation–π interactions, the hydrophobic effect, van der Waal forces, stiffness, and stability [13].
A variety of 1,2,4-triazole derivatives were synthesized in 2020 by Emmanuel Oloruntoba Yeye et al. [14], who also evaluated the compounds’ IC50 value for experimentation. The principal objective of this work is to discover new 1,2,4-triazole compounds that have encouraging action against α-glucosidase. We specifically used a 2D-QSAR study on these derivatives to build molecular models that can be used to design novel triazole derivatives and anticipate their biological activities before their synthesis [15,16].

2. Results and Discussion

2.1. QSAR Model Analysis and Validation According to the OECD Principles

Using the GA-MLR approach, this study produced a number of molecular models with descriptors in the range of (4–6). The best model was chosen based on its statistical characteristics, which indicate the robustness, strength, and consistency of the generated model. The model selected, which includes the descriptors AATSC8s, VE3_Dzs, nHsOH, CIC1, and RotBFrac as listed in Table 1 and Table 2, satisfied all of the evaluation criteria. These included the leave-one-out cross-validation coefficient (Q2LOO = 0.633), the R-squared coefficient of determination (R2= 0.767), the root-mean-squared error (RMSE = 0.082), the coefficient adjusted for degrees of freedom (R2adj = 0.712), and the coefficient of determination for the test set (R2test = 0.649).
The results of the Y-randomization test showed that none of the random trials could match the original model, as indicated in Table 1. The lesser values for R2 and Q2 on each iteration, and their averages (R2YS = 0.195 and Q2YS = −0.341) suggest that the developed QSAR models are not based on random correlations.
The applicability domain (AD) of the model was determined to define the chemical space of set compounds, and it aids in estimating the uncertainty in the prediction of a particular compound based on how similar it is to the training compounds. In this regard, William’s plot was employed, considering predictability using three standard deviations and leverage levels below the critical leverage. Therefore, the prediction of a modeled response using QSAR is applicable only if the compound being predicted falls within the AD of the mode. The evaluation’s findings demonstrated that neither the training set nor the test set had response values that were outside of the range of responses. The leverages of all the compounds are less than the leverage threshold value of h* = 0.667 (Figure 1), and their standard deviations are all within the ±x range (x = 3) [14].

2.2. Design of Novel Compounds

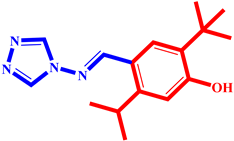
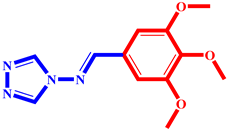
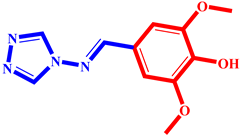
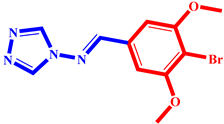
A prior investigation by Emmanuel Oloruntoba Yeye et al. assessed the ability of a set of 33 synthetic chemicals to inhibit α-glucosidase. According to the findings, compounds 14, 16, 20, 21, 25, 27, 28, and 33 showed action that was comparable to that of the well-known α-glucosidase inhibitor Acarbose. The analysis of these compounds consistently revealed the presence of halogen elements, amino groups, and/or nitro groups.
It was discovered that compounds with nitro, amino, or halogen components showed more inhibitory potential, while triazole derivatives with hydroxy groups exhibited less inhibitory potential.
Using the best-selected model and this information as a foundation, this study attempted to create novel drugs with enhanced α-glucosidase inhibitory action. A higher pIC50 value against α-glucosidase in comparison to the series’ most active compounds was the aim.
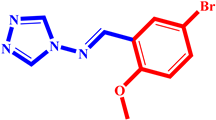
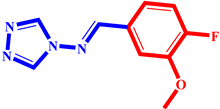
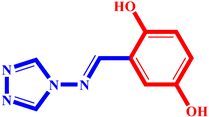
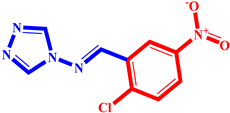
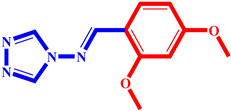
We concentrated on adding chemical groups like nitro and halogen components to the molecular structure in order to raise the values of the AATSC8s and VE3_Dzs descriptors, and avoiding the addition of hydroxy groups, which were discovered to have adverse effects on the intended activity. We were also able to lower the values of nHsOH, CIC1, and RotBFrac. As indicated in Table 3, seven interesting novel compounds were created by applying these recommended structural alterations to the triazole derivatives. Comparing these compounds to the most active one in the series (Table 4), each one showed a higher pIC50 percentage.

2.3. Applicability Domain

The obtained leverage values (hi = xit × (Xt × X) − 1 × xi (i = 1, 2, 3... n)) for the designed molecules were compared with the warning leverage (h*). The compound was recommended to be inside the applicability domain of the model based on the leverage (hi) being smaller than the warning leverage (h*). In this case, the superscript t denotes the transpose of the matrix or vector of the designed molecules, n is the number of training set compounds, and k is the number of model descriptors. xi is the matrix of model descriptors of each designed molecule, and X is the matrix of model descriptor values for n training set compounds [14]. Using the leverage threshold h* as a guide, we computed the leverages of every molecule proposed. Based on the values of hi, which has the range of (0.055–0.358), the findings displayed in Table 4 indicate that all of these compounds are acceptable.

2.4. Molecular Docking

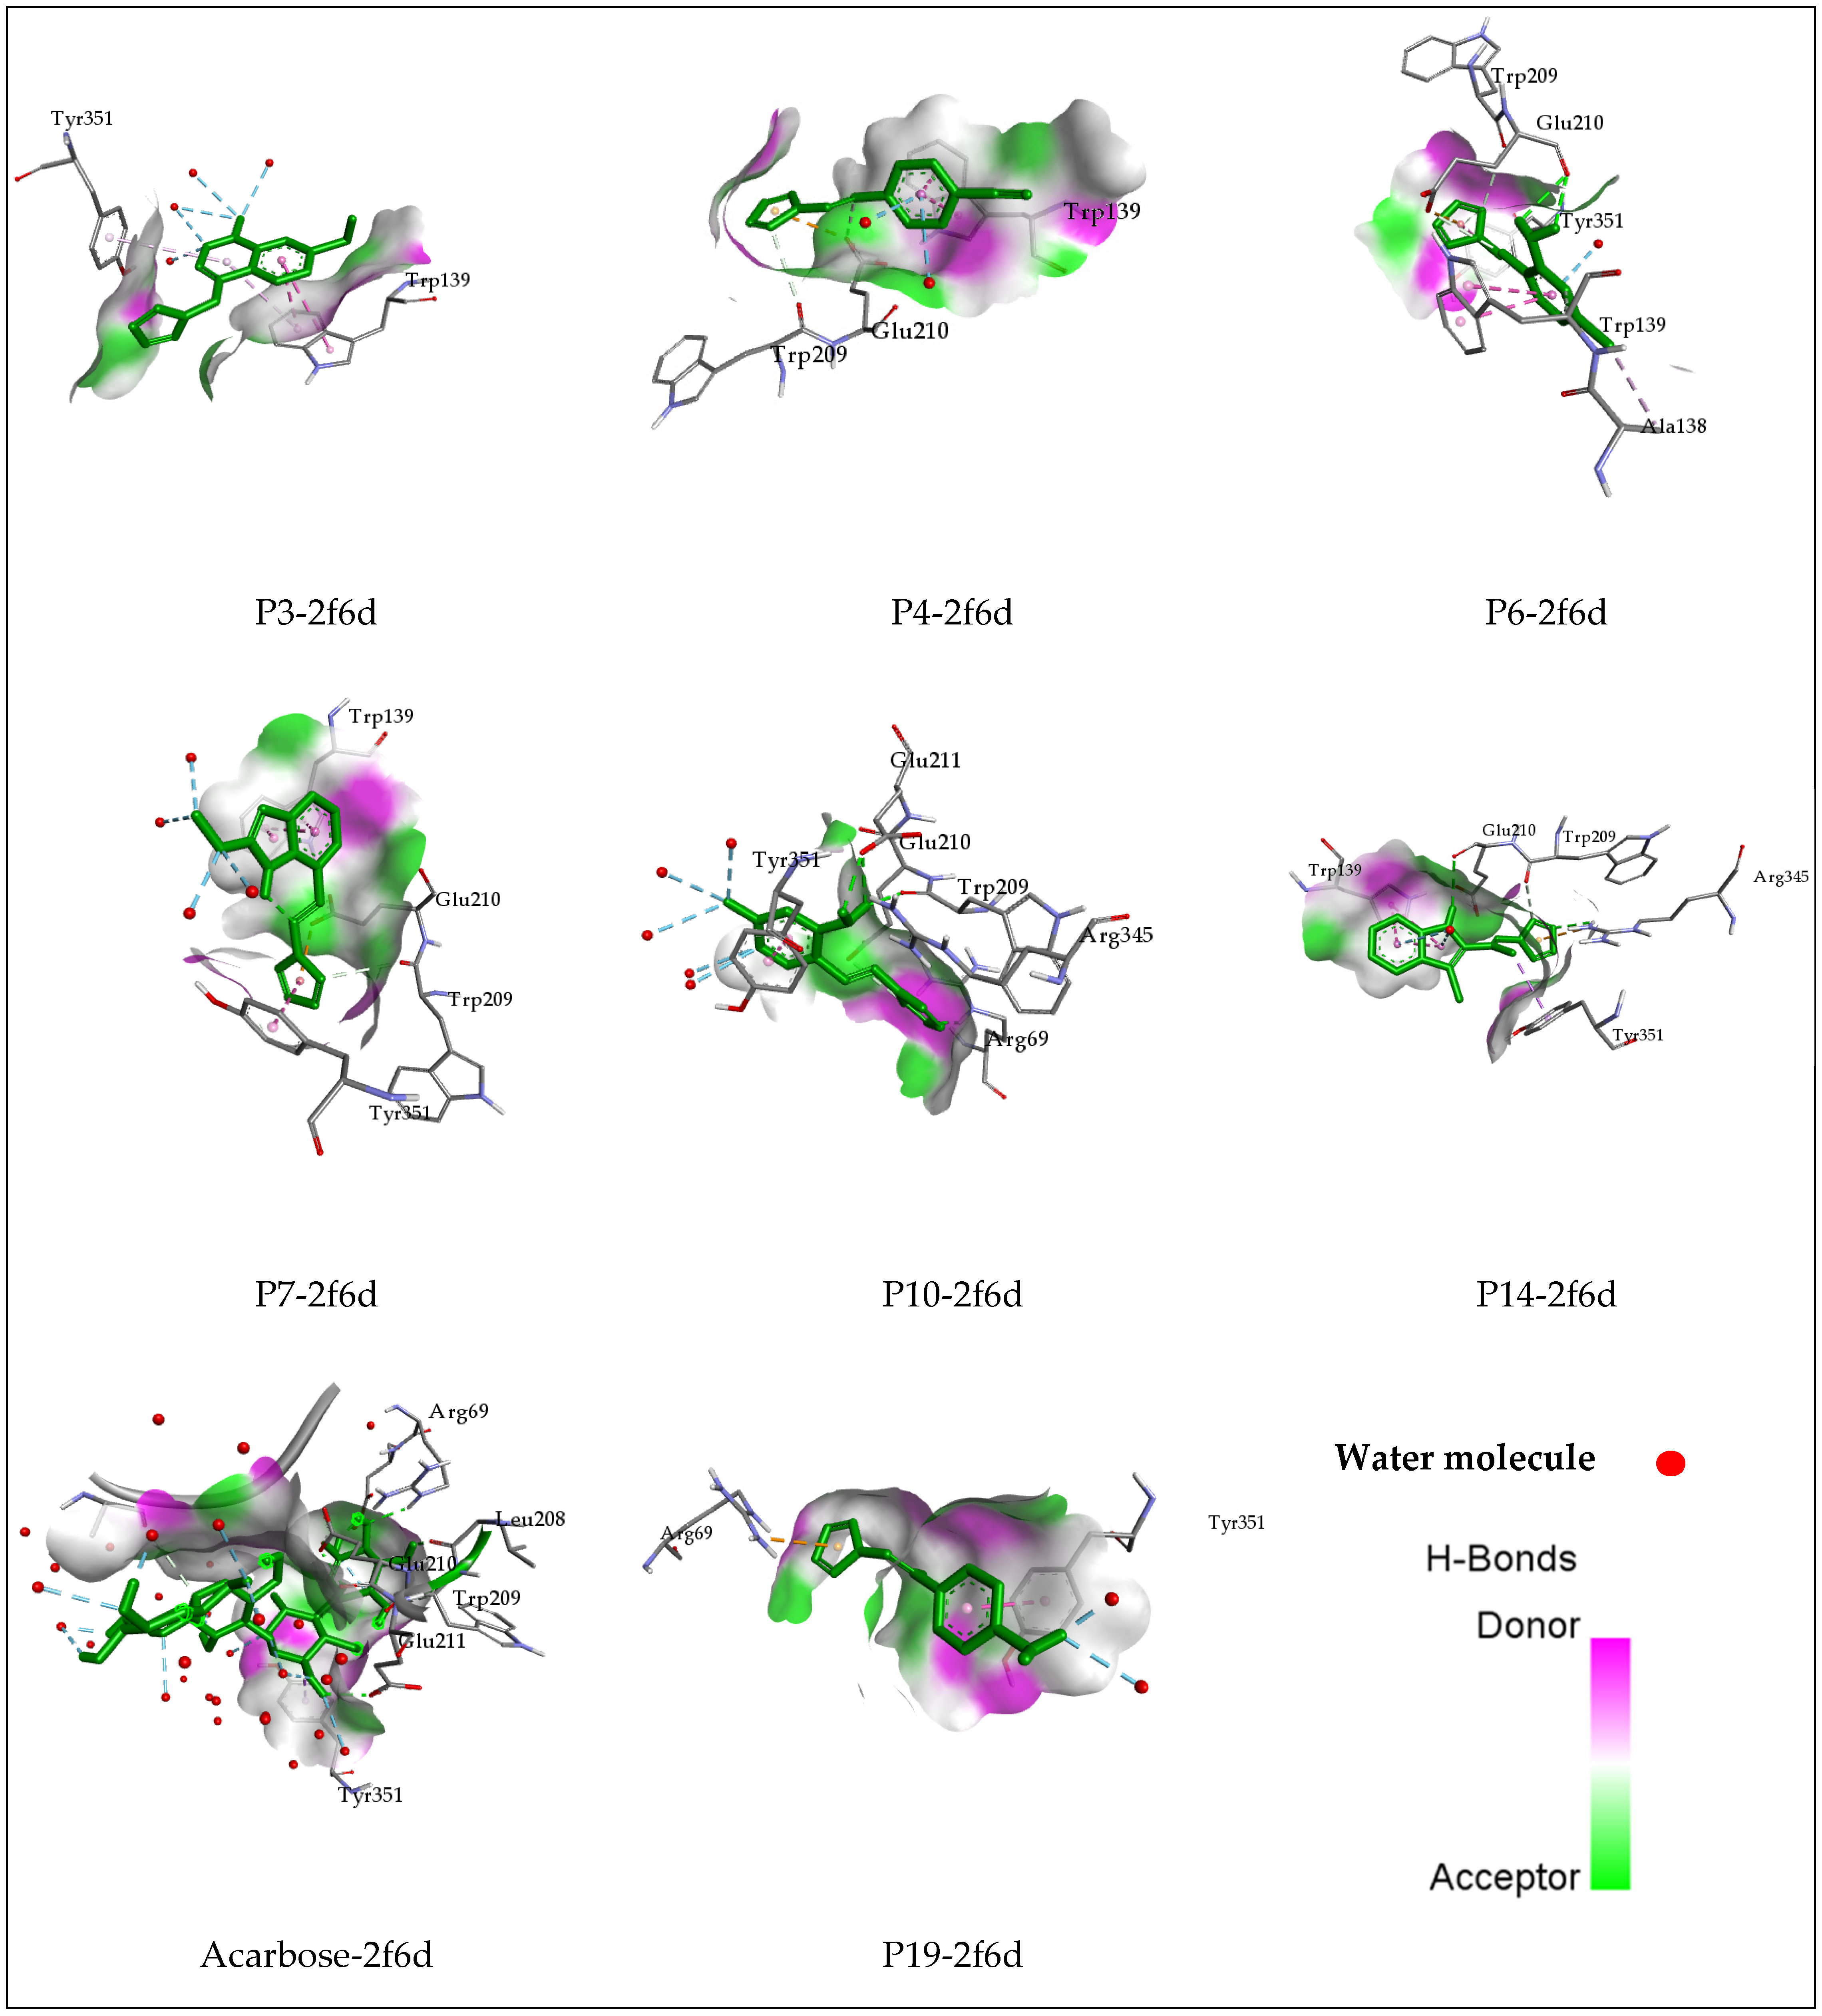
The molecular docking of all investigated compounds was conducted within the active site of the target receptor. The findings are illustrated in Figure 2 and Figure 3 and Table 5 and demonstrate favorable binding affinities for all complexes, attributed to the diverse interactions established between the ligands and key residues situated in the binding site. Acarbose, recognized as an alpha-glucosidase inhibitor, was included in the docking simulations to elucidate the interactions formed within the receptor. The Acarbose-2f6d complex revealed notable interactions, including five Conventional Hydrogen Bonds with Arg69, Glu211, Glu210, Leu208, and Asp70 residues, as well as two Carbon–Hydrogen Bonds with Trp209 and Ala138, and a Pi–Sigma interaction with Tyr351. Distances for these interactions ranged between 1.84 Å and 3.79 Å. Moreover, Water Hydrogen bonds were detected, underscoring the involvement of Water molecules in the formation of this intricate complex.
These interactions observed, including Conventional Hydrogen Bonds, Carbon–Hydrogen Bonds, and Pi–Sigma interaction with key residues and additional interactions with Water molecules, are indicative of a complex and intricate binding pattern within the active site of the receptor. Such interactions are crucial and may play a pivotal role in inhibiting the activity of the alpha-glucosidase enzyme. The binding affinity and specificity of the ligands towards the receptor, as evidenced by these interactions, suggest a potential mechanism for effective inhibition, contributing to the therapeutic impact of the studied compounds on alpha-glucosidase activity.
Compound P3 engaged in intricate interactions within the receptor’s active site, including two Pi–Pi Stacked and two Pi–Alkyl interactions with Trp139 and Tyr351 residues. Additionally, Water Hydrogen Bonds were observed with HOH1163, HOH1189, HOH1672, HOH1504, HOH1672, and HOH1723 at distances ranging between 2.92 and 5.29 Å.
For Compound P4, a complex was formed through a Carbon–Hydrogen Bond, Pi–Anion, and Pi–Pi Stacked interactions with Trp209, Glu210, and Trp139 residues. Water Hydrogen Bonds with HOH1433 were also detected.
The complex formed by Compound P6 involved a spectrum of interactions, including a Conventional Hydrogen Bond, Carbon–Hydrogen Bond, Pi–Anion, Pi–Pi Stacked, and Alkyl interactions with Trp139, Trp209, Glu210, Tyr351, and Ala138. A Water Hydrogen Bond with HOH1163 was also identified. Further, Compound P7 created a complex through a Carbon–Hydrogen Bond, Pi–Anion, and Pi–Pi Stacked interactions with Trp209, Glu210, Tyr351, Trp139, and Water Hydrogen Bonds with HOH1282, HOH1672, HOH1723, HOH1232, and HOH1280.
In the case of Compound P10, a complex was formed through a Conventional Hydrogen Bond, Carbon–Hydrogen Bond, and Pi–Pi Stacked interactions with Arg69, Trp209, Glu211, Glu210, and Tyr351. Water Hydrogen Bonds were observed with HOH1464, HOH1672, HOH1723, HOH1189, and HOH1282.
Compound P14 exhibited a diverse array of interactions, including a Conventional Hydrogen Bond, Carbon–Hydrogen Bond, Pi–Cation, Pi–Sigma, and Pi–Pi Stacked interactions with Arg345, Glu210, Trp209, Tyr351, and Trp139 residues, while the complex formed by Compound 19 involved Pi–Cation and Pi–Pi Stacked interactions with Arg69 and Tyr351, along with Water Hydrogen Bonds with HOH1723 and HOH1464.
Among the compounds subjected to docking, ligands P6, P10, and P14 were anticipated to establish interactions similar to Acarbose, including Conventional Hydrogen bonds, Carbon–Hydrogen bonds, and Pi–Sigma interactions. These interactions were projected to involve the same residues, such as Arg69, Trp209, Glu210, Glu211, and Tyr351. This anticipation suggests a potential similarity in the binding mechanism between these ligands and the reference drug, indicating a likelihood of shared effects within the studied receptor. This observation implies that these ligands may operate through a comparable mechanism to Acarbose, demonstrating a potential therapeutic impact on the target receptor.

2.5. ADMET Properties Prediction

The pharmacokinetic properties of the studied compounds were predicted using the pkCSM online tools. The results of the analysis are listed in Table 6. It was found that all investigated compounds adhere to the Lipinski rules.
All of the substances are expected to have high absorption from the gastrointestinal (GI) tract into the bloodstream, indicating their potency for absorption, based on the information provided in Table 6. Additionally, the compounds showed excellent Water solubility, which is advantageous for absorption. All compounds except for Compounds P10 and P19 exhibited strong Caco-2 permeability.
Since none of the substances were expected to be P-glycoprotein inhibitors, it is unlikely that they will obstruct the efflux transporters that allow medications to be pumped out of cells. Compounds P7 and P14, on the other hand, were predicted to be P-glycoprotein substrates, which means P-glycoprotein could be able to detect and transport them. Furthermore, it was noted that all compounds had a high level of skin permeability, signifying its capacity to penetrate the epidermal barrier and enter the body. Here, a LogKp value of less than −2.5 is considered high-skin-permeability.
All compounds were predicted to have a low volume of distribution at steady state (VDss) values, except Compounds P3 and P7. In this context, a low VDss value is defined as a LogVDss value less than −0.15, indicating that in a steady state, the chemicals have a relatively small volume of distribution throughout the body. Compound P14 was predicted to have a modest potential to cross the blood–brain barrier, as demonstrated by a LogBB (logarithm of the blood–brain barrier partition coefficient) higher than 0.3. The remaining compounds were estimated to have a modest potential to cross. Compound 3 was found to have the potency to penetrate the central nervous system (CNS), while Compounds P6, P7, and P10 were considered unable to penetrate the CNS.
There was a low chance that any of the substances would interact with any of these specific cytochrome P450 enzymes because it was anticipated that they would all be inhibitors of CYP1A2 and neither substrates nor inhibitors of CYP2D6, CYP2C19, CYP2C9, or CYP3A4. Nevertheless, it was considered that Compounds P6 and P14 were CYP3A4 substrates, indicating that the CYP3A4 enzyme could metabolize them.
Except for Compound P7, which was thought to be an OCT2 substrate and may be carried via the kidney’s OCT2 transporter, other compounds were predicted to be non-renal OCT2 substrates. The range of the medications’ total clearance values (Log(ml/min/kg)) indicates potential dose rates required to achieve steady-state concentrations, from 0.063 to 0.586.
Since the compounds were projected to be neither hERG I nor hERG II inhibitors, it is unlikely that they will have a major impact on the hERG channel, which is crucial for heart function. Additionally, it was anticipated that they would not produce skin sensitization, which means that when they come into contact with skin, they will likely not trigger allergic responses.
According to the AMES test, chemicals P6, P10, and P14 were expected to not introduce AMES toxicity, indicating that it is unlikely that they will result in bacterial cell mutations.

2.6. Molecular Dynamics Simulation

Ligands P6, P10, and P14 were selected for molecular dynamics simulation based on their favorable pharmacological properties, good binding scores, and interactions with key residues of the analyzed enzyme.

2.6.1. Root-Mean-Squared Deviation

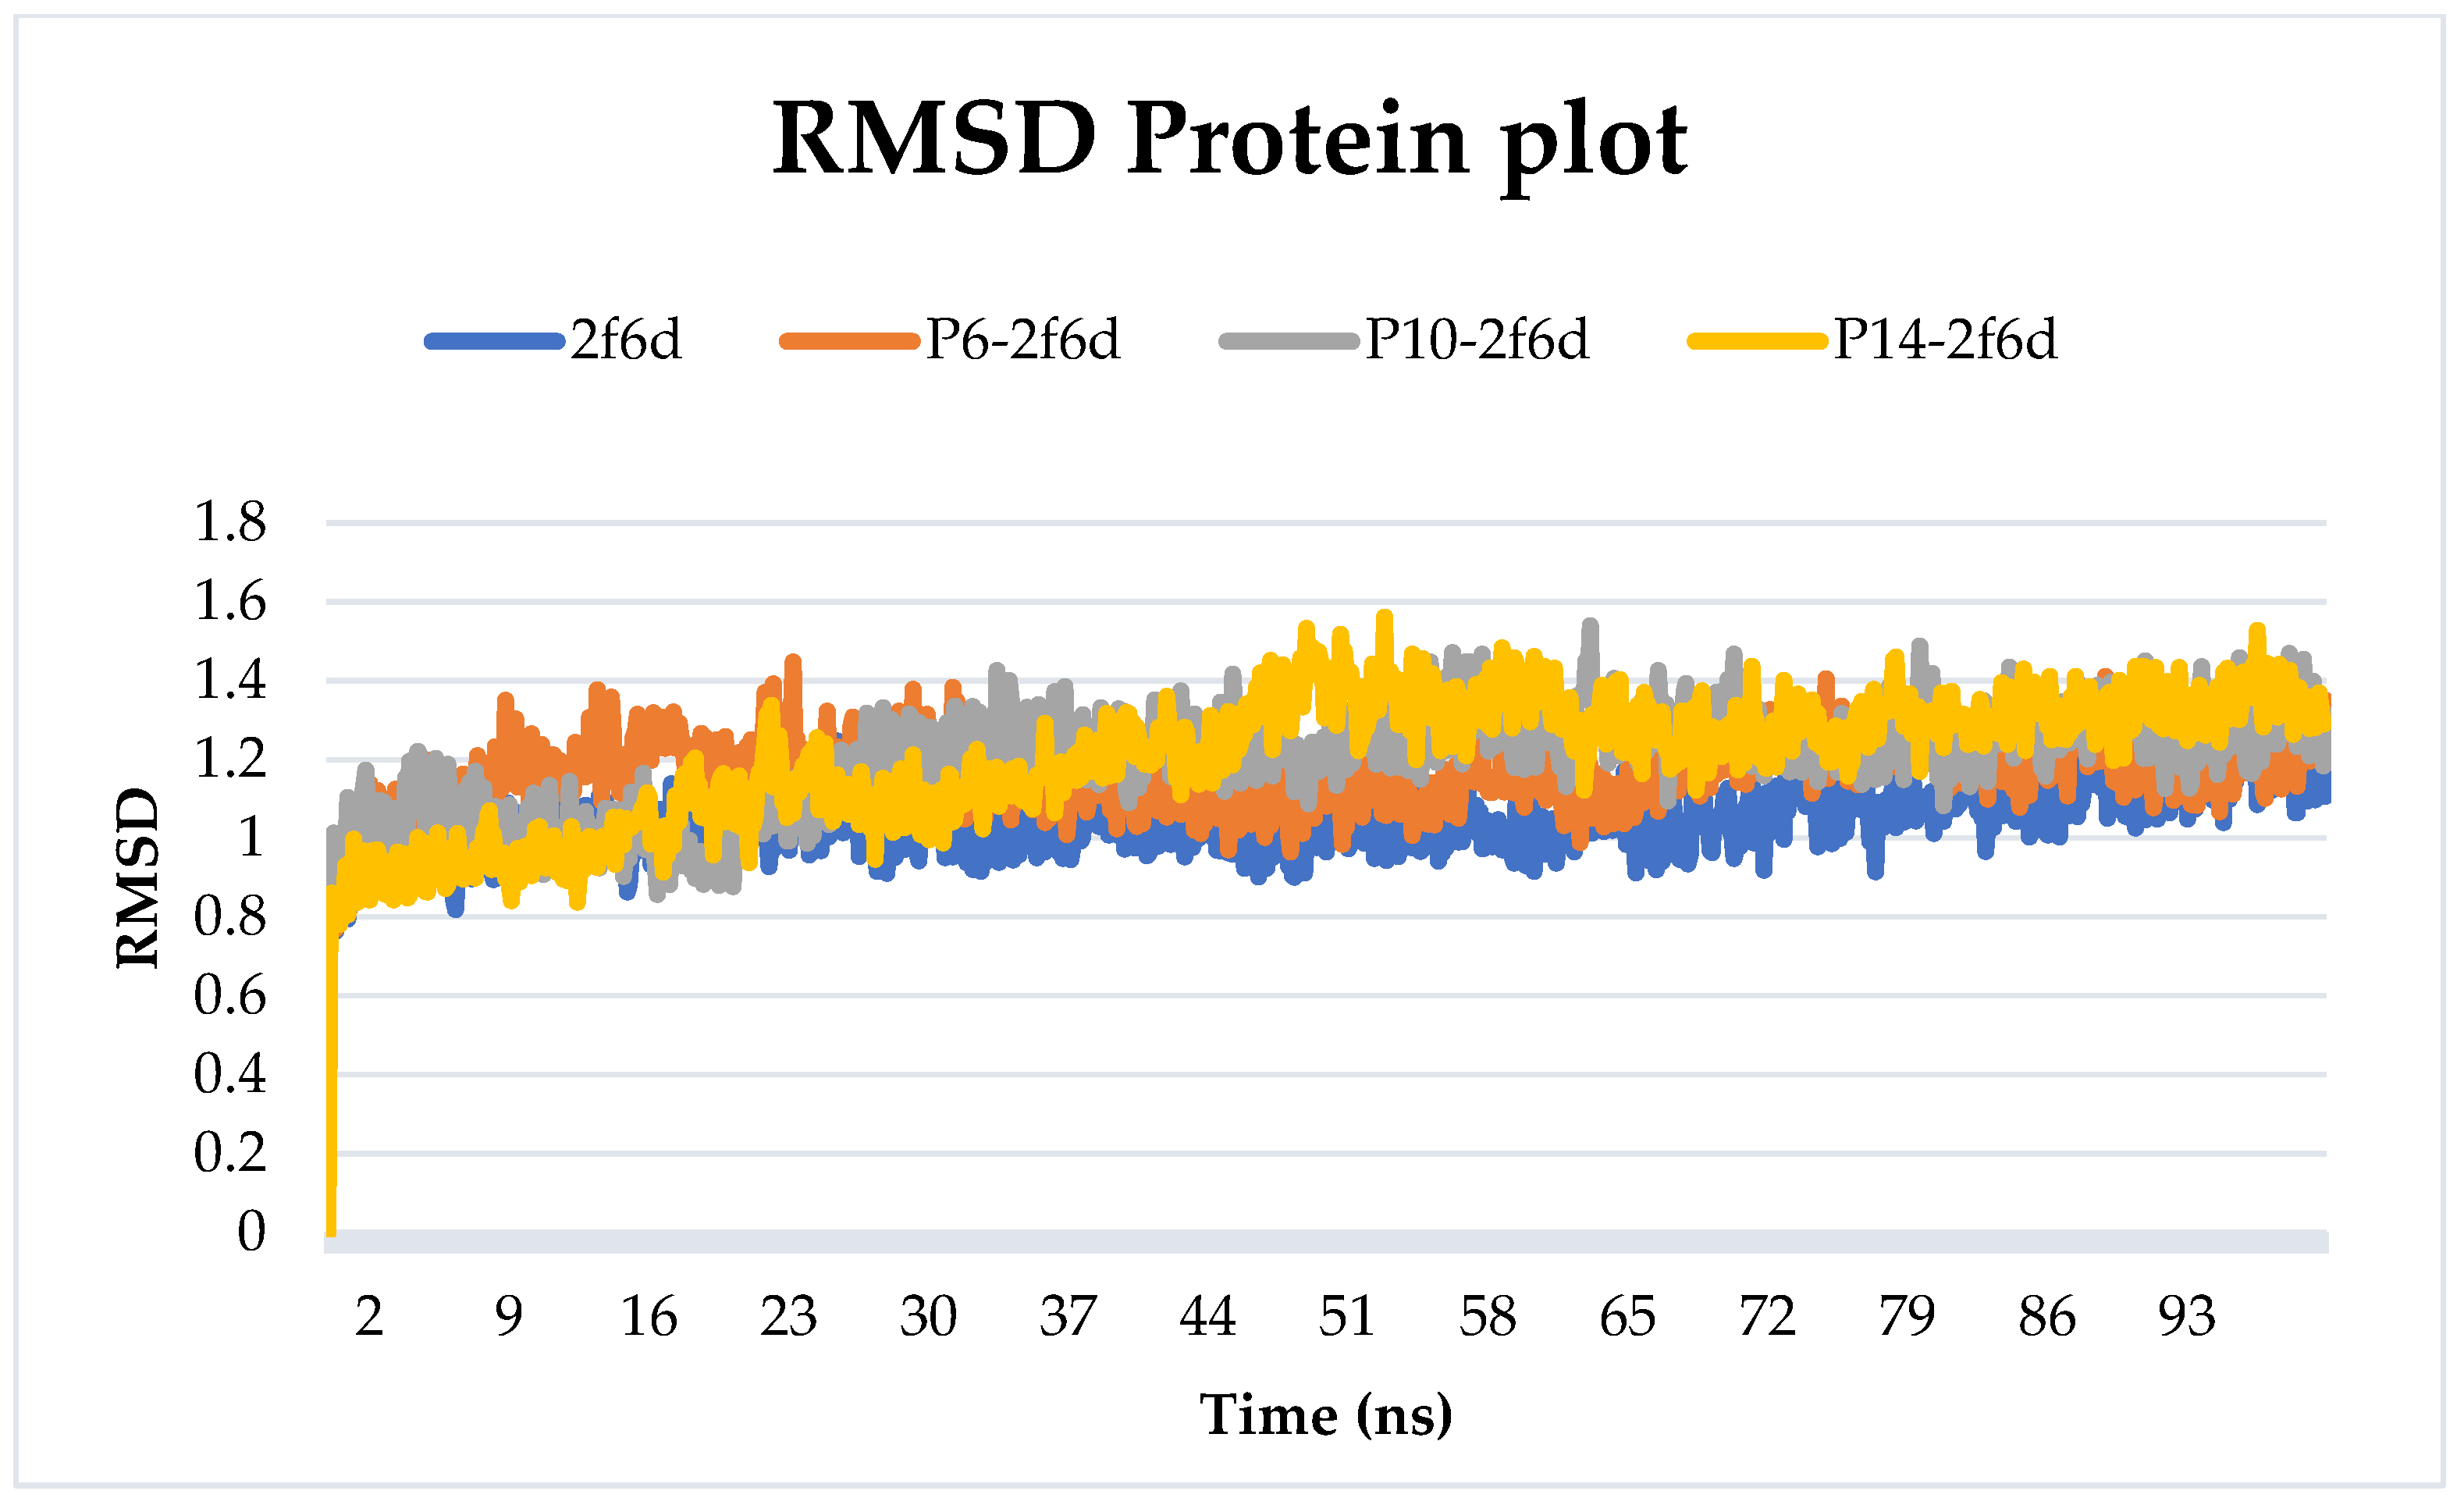
A 100 ns simulation was conducted on the protein–ligand complexes (2f6d with P6, P10, and P14) and the uncomplexed protein to observe any deviations or structural changes induced when the protein was bound to the selected ligands. The Root-Mean-Square Deviation (RMSD) values for the proteins were computed and are visualized in Figure 4. The outcomes revealed a consistent state with an RMSD consistently below 3 Å over the entire simulation period. This signifies that the complexes attained a stable conformation, indicating stability despite their interactions with the examined ligands. The persistent and low RMSD values suggest that the complexes maintained structural integrity throughout the simulation.
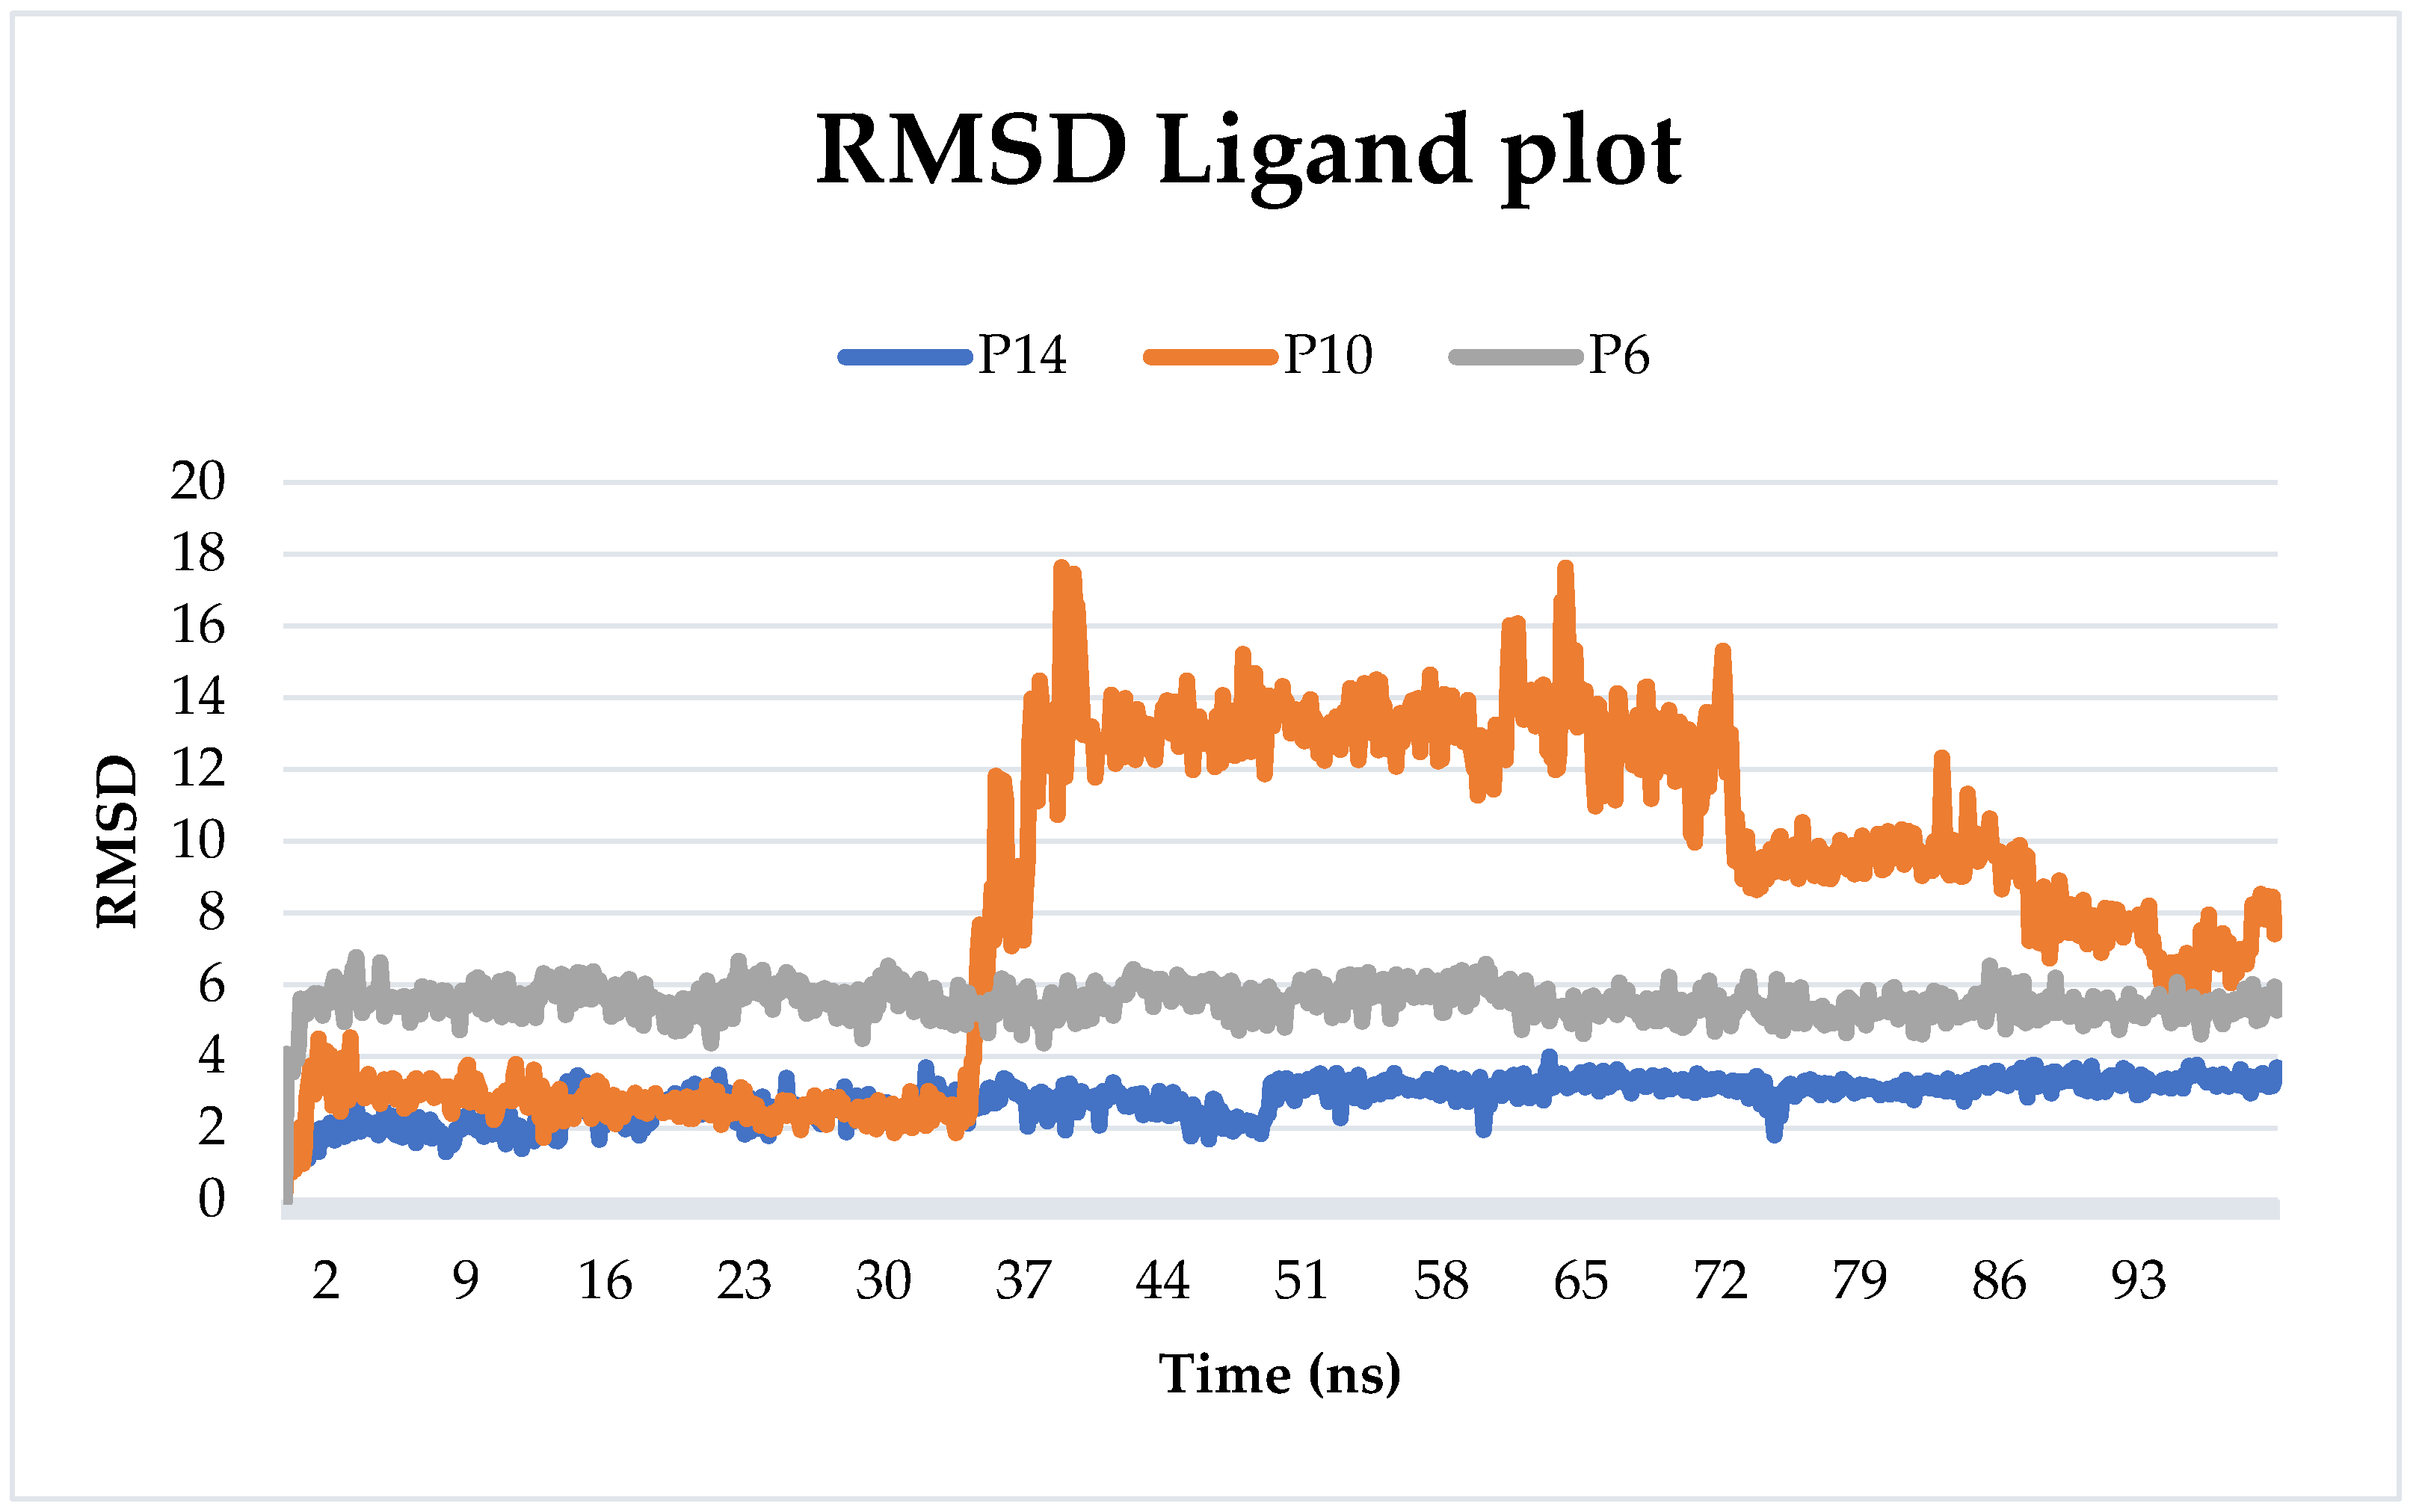
Figure 5 illustrates the RMSD values of the proposed ligands during their interaction with the target. The findings suggest stability throughout the simulation for P6 and P14, with average RMSD values of 5.52 Å and 2.82 Å, respectively. In contrast, P10 initially maintained a consistent state for the first thirty nanoseconds before exhibiting fluctuations exceeding 15 Å, and then a decrease in RMSD value was eventually noted towards the end of the simulation. The average RMSD of P10 was 8.16 Å.

2.6.2. Root-Mean-Squared Fluctuation

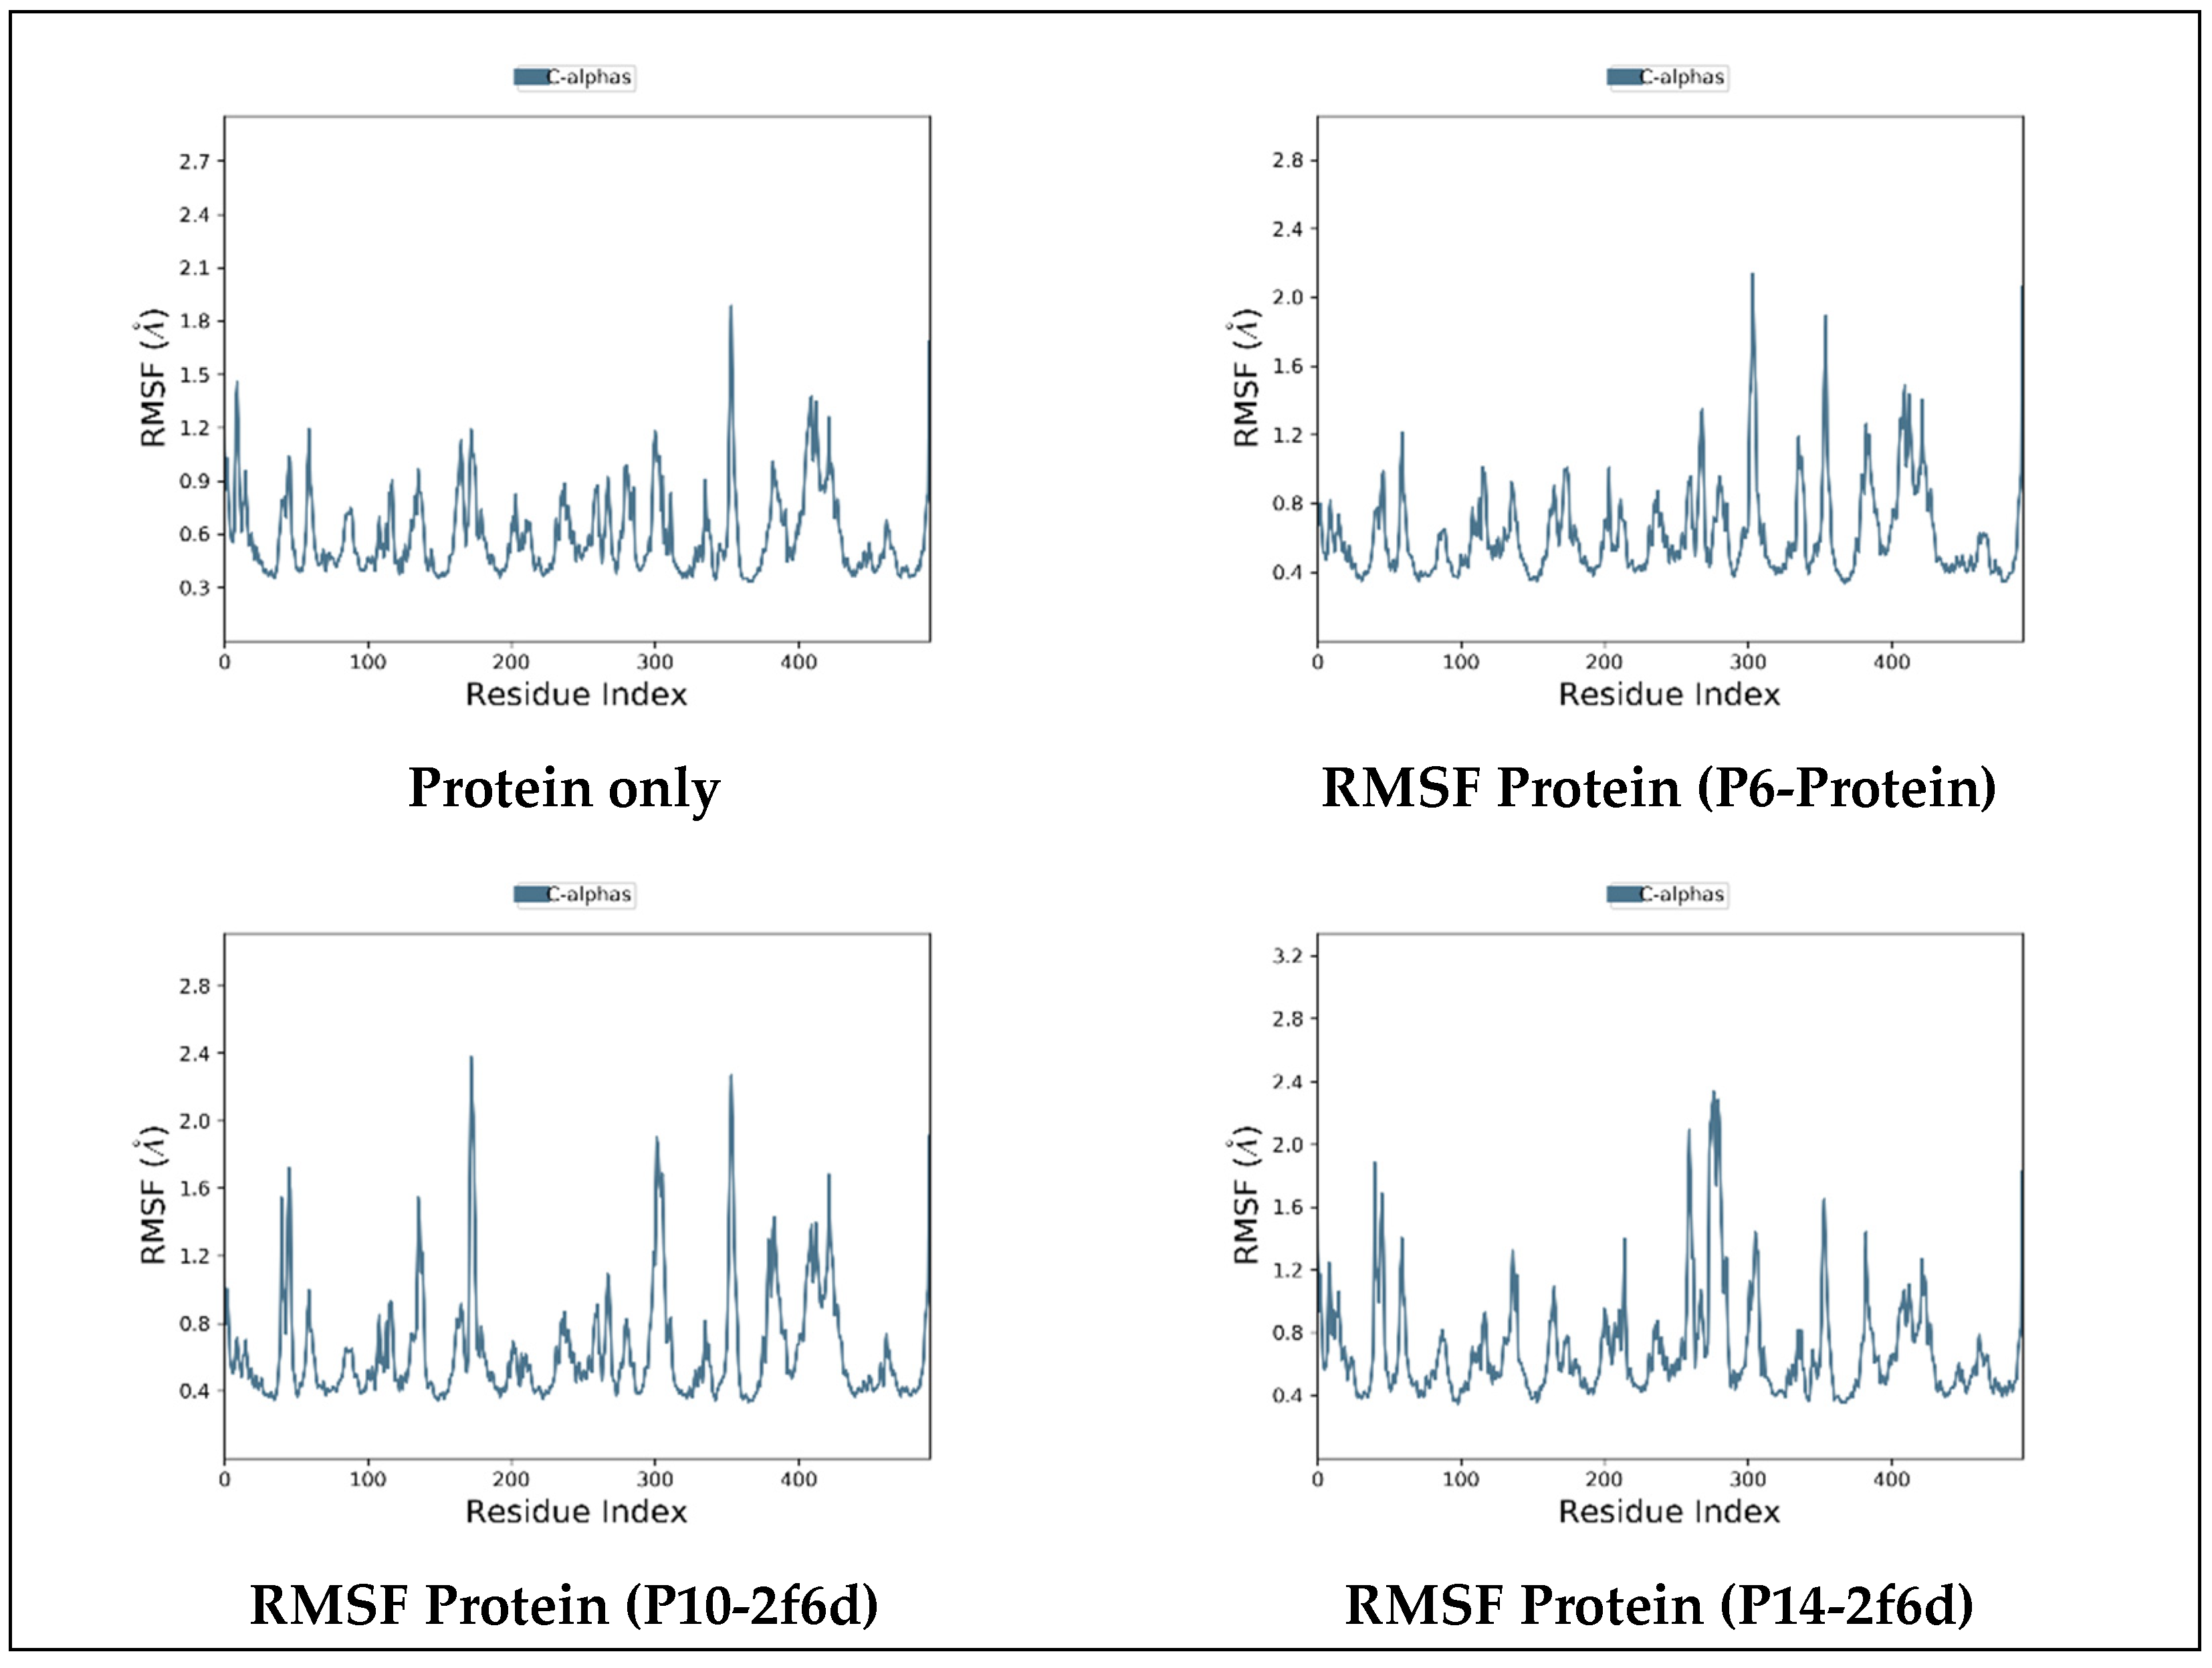
The investigation included a Root-Mean-Squared Fluctuation (RMSF) analysis for all simulated complexes, and a separate simulation was conducted for the uncomplexed protein to compare residue fluctuations during the simulation period. The primary objective of this analysis was to evaluate the stability of protein residues in the presence of the investigated ligands. The RMSF values for protein residues remained below 3 Å for all simulated complexes (Figure 6), indicating the absence of significant fluctuations. This implies that a state of stability was achieved for the protein residues despite their interactions with the studied ligands.

2.6.3. Protein–Ligand Contact

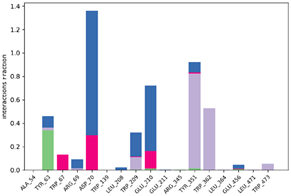
The ligand–protein interactions were thoroughly investigated, uncovering a diverse range of molecular bonds and bridges contributing to their binding affinity, as illustrated in Table 7. Specifically, P6 formed Hydrogen bonds with Tyr63, indicating a directed interaction. Hydrophobic interactions played a crucial role, with P6 engaging hydrophobic residues Trp209, Tyr351, Trp362, and Trp473, enhancing complex stability. Ionic bonds with Trp67, Asp70, and Glu210 added an electrostatic dimension to the interaction. Water molecules acted as bridges, mediating specific interactions with Tyr63, Arg69, Asp70, Trp209, and Glu210. The persistence of interactions, particularly with Asp63, Asp70, Trp209, Glu210, Tyr351, and Trp362 residues, underscored their crucial role in maintaining complex stability.
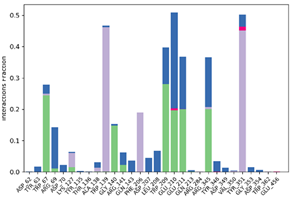
For P10-2f6d and P14-2f6d, the ligand–protein interactions revealed a nuanced network of molecular bonds contributing to their binding affinity. P10 engaged in diverse and specific interactions, forming Hydrogen bonds with Trp67, Gly140, Trp209, Glu210, Glu211, and Arg345. Water bridges with Arg69-, Asp207-, Leu208-, Trp209-, Glu210-, Glu211-, and Arg345-mediated specific contacts. Hydrophobic bonds with Lys127, Trp139, Phe206, and Tyr351 enhanced complex stability, while ionic bonds with Glu210 and Tyr351 introduced an electrostatic dimension. P14 formed ionic bonds with Tyr63 and Glu210, indicating specific electrostatic interactions. Hydrophobic bonds with Tyr63, Trp209, Tyr351, and Trp62 contributed to complex stability. Water bridges involving Ala54, Arg69, Asp70, Leu208, Glu210, and Trp473 facilitated specific contacts. Hydrogen bonds with Tyr63 and Trp209 enriched the interaction profile, providing comprehensive insights into the molecular basis of their binding mechanisms. Persistent interactions were consistently observed throughout the simulation, establishing connections between P14 and residues Tyr63, Asp70, Trp209, Glu210, and Tyr351, suggesting the role of these interactions in maintaining the stability of the formed complex P14-2f6d.

2.6.4. Binding Free Energy

The binding free energy calculations for the three simulated complexes, P6-2f6d, P10-2f6d, and P14-2f6d, revealed favorable thermodynamic stability. The negative values of ΔG (−32.59 kcal/mol, −35.8 kcal/mol, and −41.17 kcal/mol, respectively) indicate spontaneous and energetically favorable interactions between the ligands and the protein. These results suggest strong binding affinities, with P14-2f6d exhibiting the highest negative ΔG, highlighting its potentially robust and stable interaction with the target protein.

3. Material and Methods

A database containing 33 substituted 1,2,4-triazoles was retrieved from a previous study [14]. These compounds exhibited moderate-to-high activity against α-glucosidase, as listed in Table 8, where their IC50 values were transformed into pIC50 values (-logIC50) for QSAR modeling. The structures of the studied compounds were generated and optimized under the MMFF94 force field by using Chem3D V.19.0.0.22 [22].

3.1. Molecular Descriptor Computation and Pruning

The PaDEL tool was utilized to calculate the molecular descriptors of the substances [23]. PaDEL offers over 800 molecular characteristics for every molecule; hence, it was required to filter these descriptors to only contain pertinent data. For this, the objective feature selection module from QSARINS software [24] was employed. Descriptors with high co-linearity (|r| > 0.90) and virtually constant (>95%) values were excluded to avoid multi-collinear and spurious variables in the GA-MLR models. A dataset including 433 molecular descriptors encompassing mono-dimensional (1D-) and bi-dimensional (2D-) descriptor spaces was retained after the descriptor reduction step [25,26].

3.2. QSAR Model Construction and Validation

The QSARINS software was utilized to build the QSAR models. This program is well known for producing statistically strong GA-MLR-based QSAR models. QSARINS’s random splitting option was used to divide the dataset into training and test sets at random for this purpose [27]. Twenty percent of the compounds were in the test set and eighty percent were in the training set [28]. The models were generated using a representative subset of the dataset and assessed on a different collection of substances thanks to this tried-and-true methodology [29].
By including the maximum number of molecular descriptors impacting or altering biological potential/activity, this method aimed to enhance the performance of the models [30]. The calculated molecular descriptors are used as independent variables to predict or explain the activity of a molecule by employing Formula (1):
Y = a0 + a1X1 + a2X2
In accordance with the OECD guidelines [31,32], the obtained models underwent comprehensive external and internal statistical validations, Y-randomization, and applicability domain analysis. A variety of model evaluation metrics and statistical parameters were taken into account to assess the models’ performance and choose the best model. These included the coefficient adjusted for degrees of freedom (R2adj), coefficient of determination for the test set (R2test), root-mean-squared error (RMSE), and R-squared coefficient of determination (R2). As the fitness function, the leave-one-out cross-validation coefficient, or Q2LOO, was also given. Typically, measurements with values higher than 0.6 signify a more stable and consistent model [33,34,35].
Leverage analysis—expressed as William’s plot—is used in chemometrics and QSAR analysis to assess a model’s applicability domain (AD) by determining the standardized residuals (r) and the leverage threshold values (h* = (3 × (k + 1))/n), where n denotes the number of trainings and k the number of descriptors. The range that the model is thought to be dependable for forecasting new values is represented by the AD [36,37].

3.3. Molecular Docking

The molecular docking method is widely used to predict the best poses of the examined ligands when docked in the active pocket of the target, as well as the binding affinity values and the created molecular interactions between the residues located in the receptor and the studied ligands [38].
The receptor utilized in this investigation was sourced from the Protein Data Bank, identified by the PDB ID of 2f6d [39], corresponding to the complex structure involving a glucoamylase from Saccharomycopsis fibuligera and Acarbose.
The selection of this particular structure was influenced by its intricate nature, resembling that of Acarbose. Acarbose is renowned for its effectiveness in inhibiting the alpha-glucosidase enzyme. Furthermore, the high resolution of this structure, standing at 1.60 Å (below 2 Å), adds to its suitability. The receptor comprises 492 amino acids in the ‘Chain A’, referred to as glucoamylase (Figure 7A). It also contains additional heteroatoms such as alpha-acarbose, phosphate, and sodium ions, which were excluded before the commencement of the molecular docking phase [39].
In preparation for the docking simulations, the receptor underwent necessary adjustments, including minimizing the energy of the protein structure using Swiss PDB Viewer [40], the addition of polar Hydrogens, and computation of Gasteiger charges using AutoDock vina software [41,42,43]. In this case, given the presence of Water molecules within the binding site of the protein, they were preserved to explore potential interactions with the docked ligands. The ligands underwent an energy minimization process employing the MMFF94 force field through Avogadro software [44]. This step was undertaken to refine and optimize the structural conformation of the ligands.
The choice of the grid box for docking was strategic, determined by the initial position of the co-crystalized ligand (Acarbose), which is acknowledged as an inhibitor of alpha-glucosidase activity [45], serving as the reference drug for comparative analysis of interactions. The coordinates of the binding site were meticulously set at x = 12.68 Å, y = 10.80 Å, z = −6.35 Å, with a size of 20 Å3 and a space center of 0.375 Å (Figure 7B).
The molecular docking process was iterated five times to ensure robustness and reliability. The conformations of the ligands were selected based on their frequency of appearance across these multiple runs. Notably, all chosen conformations exhibited consistent presence in every run, affirming their reliability and reinforcing the confidence in their representativeness. Figure 8 provides a visualization of the frequency for the obtained conformations in each run.
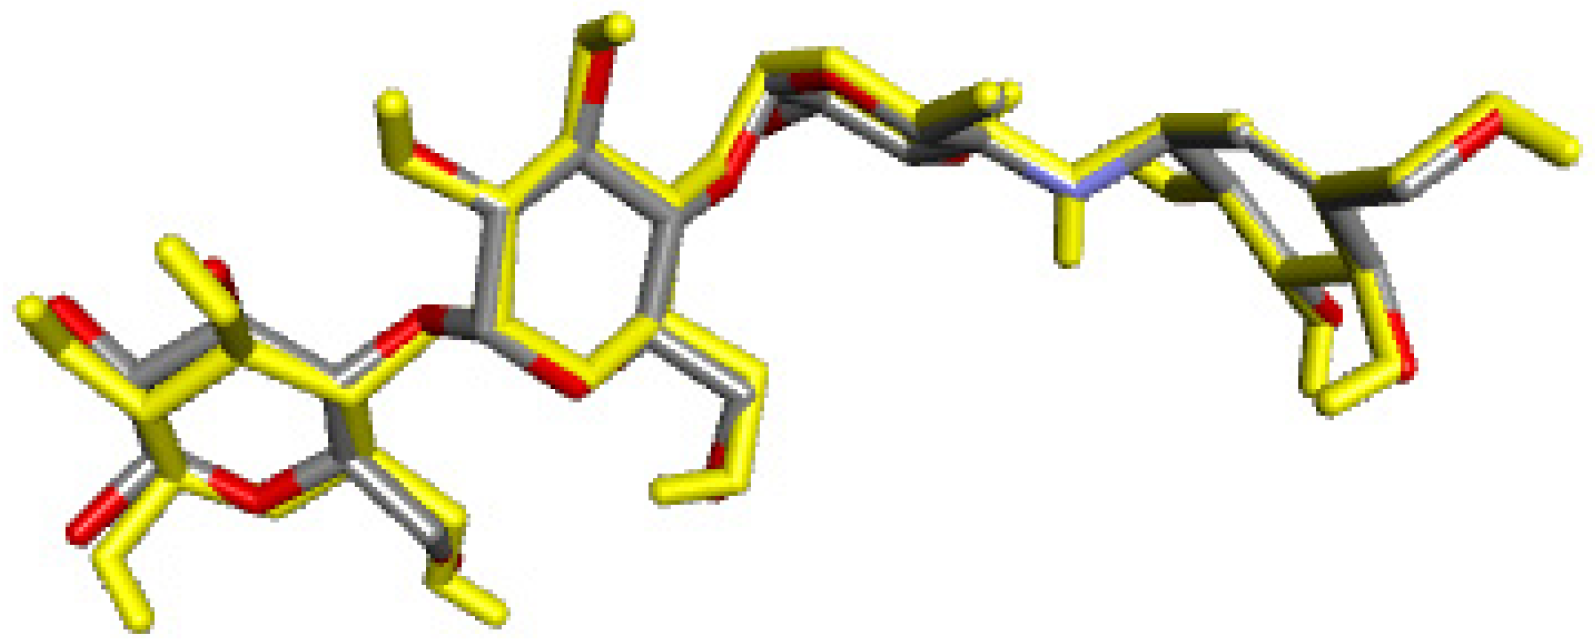
The co-crystalized ligand (Acarbose) was initially docked into the binding site of the receptor to validate the docking protocol [8]. Subsequently, AutoDock tools [46] facilitated the molecular docking of all designed compounds, enabling an in-depth exploration of potential interactions and the determination of binding affinities within the active site of the receptor. The docking simulation was conducted through a total of 9 runs, and the complex resulting from the run with the lowest binding affinity, corresponding to an RMSD of 0, was selected and subjected to analysis [47]. The calculated Root-Mean-Squared Deviation (RMSD) value of 0.217 Å (below 2 Å) indicates a minimal deviation between the initial ligand and the docked ligand (Figure 9). This result affirms the precision of the docking protocol in faithfully reproducing the binding pose of the reference ligand within the active site of the receptor [48].

3.4. ADMET Analysis

The designed compounds with a high value of pIC50 against alpha-glucosidase activity were subjected to an ADMET analysis for the purpose of gaining insight into the pharmacological properties which includes several properties such as the absorption, distribution, metabolism, excretion, and toxicity [49,50]. The pkCSM website is widely used for predicting these properties and evaluating the behavior of compounds in the human body.
Lipinski’s rules were used to eliminate the compounds that do not respect the threshold values of these principles, including a molecular weight of less than 500 g/Mol, no more than 5 donor bonds, no more than 10 acceptor bonds, and a partition coefficient (LogP) no more than 5 [51]. Additionally, several properties were evaluated to determine the behavior of the analyzed compounds in the human body [51] such as Caco-2 permeability, Intestinal absorption (human), and the volume of distribution at steady state (VDss). These evaluations offer interesting details into the potential behavior and suitability of the compounds for further development.

3.5. Molecular Dynamics (MD) Simulation

To gain insight into the structural changes that befell the protein and ligand through key parameters like the (RMSD) Root-Mean-Squared Deviation and (RMSF) Root-Mean-Squared Fluctuation, the hit compounds with the best binding score, highest biological activity, and good pharmacological properties were put through a molecular dynamics’ simulation. The generated molecular interactions between them were then assessed to determine the cause of stability or changes observed in the protein and ligand structures [52,53].
The generated complexes were prepared, minimized, and optimized under the OPLS3e force field [54] using the protein preparation wizard which is available in Maestro software [55]. More recently, we used the Water model (TIP3P) to build an orthorhombic simulation [56]. Following the addition of Na+ and Cl counterions to neutralize the charge of the solvated systems, the physiological salt concentration was adjusted to 0.15 M. After that, the system was heated gradually to the target temperature (which is under 300 K and one bar of pressure) using the Nose–Hoover thermal algorithm and the Martina–Tobias-Klein method [57]. A recording interval, an isothermal–isobaric ensemble (NPT), and an MD simulation duration of 100 ns were all employed. In this work, MD simulations were performed using the Desmond package [58], which is part of the Schrödinger 2020-3 academic program.
The Molecular Mechanics/Generalized Born Surface Area (MM/GBSA) technique, a crucial component of the Maestro software package, was used to calculate the binding free energy for the simulated complexes. The binding free energies in molecular dynamics simulations were estimated using MM/GBSA. It is especially helpful for comprehending the thermodynamics of ligand binding in molecular dynamics simulations and offers a thorough and effective method of analyzing the energetics of protein–ligand interactions [59].

4. Conclusions

This study employed a comprehensive QSAR analysis of 33 triazole derivatives to identify the key factors influencing their inhibitory activity against alpha-glucosidase. This analysis aimed to identify novel potential compounds that could serve as novel medications for diabetes mellitus. Based on the best selected MLR model, seven promising compounds were designed as potential drugs, and subjected to the molecular docking and dynamics simulations to gain insights into the stability and the mode of interaction between the designed compounds and the target enzyme. The pharmacokinetic properties of the compounds were assessed to predict their behavior in the human body through various parameters such as absorption, distribution, metabolism, and excretion of the compounds. The results highlighted three novel compounds (P6, P10, and P14) with high biological activity, strong binding affinity to the target enzyme, favorable thermodynamic properties, and suitability for oral administration.

Author Contributions

Conceptualization, S.C. and A.S.; methodology, S.C.; software, S.C.; validation, A.E., A.S. and S.C.; formal analysis, H.N.; investigation, M.K.; resources, I.Y.; data curation, O.A.; writing—original draft preparation, O.A.; writing—review and editing, I.Y. and A.E.; visualization, M.K.; supervision, S.C.; project administration, S.C.; funding acquisition, S.C. All authors have read and agreed to the published version of the manuscript.

Funding

This research received no external funding.

Institutional Review Board Statement

Not applicable.

Informed Consent Statement

Not applicable.

Data Availability Statement

Data are contained within the article.

Acknowledgments

The authors gratefully acknowledge the financial support received from the Deanship of Graduate Studies Scientific Research, Middle East University, MEU, Department of Pharmacy. Abdelouahid Samadi thanks the UAEU for an internal Start-up grant 2023 (Grant Code G00004400) for support.

Conflicts of Interest

The authors declare no conflicts of interest.

References

  1. Sarwar, N.; Gao, P.; Seshasai, S.R.; Gobin, R.; Kaptoge, S.; Di Angelan-tonio, E.; Ingelsson, E.; Lawlor, D.A.; Selvin, E.; Stampfer, M. Emerging risk factors collaboration diabetes mellitus, fasting blood glucose concentration, and risk of vascular disease: A collaborative meta-analysis of 102 prospective studies. Lancet 2010, 375, 2215–2222. [Google Scholar]
  2. Abchir, O.; Daoui, O.; Nour, H.; Yamari, I.; Elkhattabi, S.; Errougui, A.; Chtita, S. Exploration of cannabis constituents as potential candidates against diabetes mellitus disease using molecular docking, dynamics simulations and Admet investigations. Sci. Afr. 2023, 21, e014745. [Google Scholar] [CrossRef]
  3. International Diabetes Federation. Diabetes Federation. Diabetes around the world in 2021. In IDF Diabetes Atlas; International Diabetes Federation: Brussels, Belgium, 2021. [Google Scholar]
  4. Fatima, I.; Taha, M.; Wadood, A.; Mohammad, J.I.; Khan, H. 2-Aryl benzimidazoles: Synthesis, in vitro α-amylase inhibitory activity, and molecular docking study. Eur. J. Med. Chem. 2018, 150, 248–260. [Google Scholar]
  5. Tanaka, M.; Akiyama, Y.; Mori, K.; Hosaka, I.; Kato, K.; Endo, K.; Ogawa, T.; Sato, T.; Suzuki, T.; Yano, T.; et al. Predictive modeling for the development of diabetes mellitus using key factors in various machine learning approaches. Diabetes Epidemiology Manag. 2024, 13, 100191. [Google Scholar] [CrossRef]
  6. Shadakshari, A.; Kumara, T.S.; Kumar, N.; Chandra, S.J.; Kumar, K.A.; Ramu, R. Synthesis, characterization, and biocomputational assessment of the novel 3-hydroxy-4-(phenyl(pyridin-2-ylamino) methyl)-2-naphthoic acid derivatives as potential dual inhibitors of α-glucosidase and α-amylase enzymes. Results Chem. 2023, 5, 100745. [Google Scholar] [CrossRef]
  7. Gong, L.; Feng, D.; Wang, T.; Ren, Y.; Liu, Y.; Wang, J. Inhibitors of α-amylase and α-glucosidase: Potential linkage for whole cereal foods on prevention of hyperglycemia. Food Sci. Nutr. 2020, 8, 6320–6337. [Google Scholar] [CrossRef] [PubMed]
  8. Abchir, O.; Nour, H.; Daoui, O.; Yamari, I.; ElKhattabi, S.; El Kouali, M.; Talbi, M.; Errougui, A.; Chtita, S. Structure-based virtual screening, ADMET analysis, and molecular dynamics simulation of Moroccan natural compounds as candidates for the SARS-CoV-2 inhibitors. Nat. Prod. Res. 2023, 2023, 1–8. [Google Scholar] [CrossRef] [PubMed]
  9. Lee, S.-R.; Choi, J.; Choi, E.-K.; Lee, H.; Han, M.; Ahn, H.-J.; Kwon, S.; Lee, S.-W.; Han, K.-D.; Oh, S.; et al. Early rhythm control on diabetes-related complications and mortality in patients with type 2 diabetes mellitus and atrial fibrillation. Diabetes Res. Clin. Pract. 2023, 206, 1110200. [Google Scholar] [CrossRef]
  10. Chaidam, S.; Saehlim, N.; Athipornchai, A.; Sirion, U.; Saeeng, R. Synthesis and biological evaluation of 1,6-bis-triazole-2,3,4-tri-O-benzyl-α-d-glucopyranosides as a novel α-glucosidase inhibitor in the treatment of Type 2 diabetes. Bioorganic Med. Chem. Lett. 2021, 50, 128331. [Google Scholar] [CrossRef]
  11. Dahmani, R.; Manachou, M.; Belaidi, S.; Chtita, S.; Boughdiri, S. Structural characterization and QSAR modeling of 1,2,4-triazole derivatives as α-glucosidase inhibitors. N. J. Chem. 2021, 45, 1253–1261. [Google Scholar] [CrossRef]
  12. Fallah, Z.; Tajbakhsh, M.; Alikhani, M.; Larijani, B.; Faramarzi, M.A.; Hamedifar, H.; Mohammadi-Khanaposhtani, M.; Mahdavi, M. A review on synthesis, mechanism of action, and structure-activity relationships of 1,2,3-triazole-based α-glucosidase inhibitors as promising anti-diabetic agents. J. Mol. Struct. 2022, 1255, 132469. [Google Scholar] [CrossRef]
  13. Matin, M.M.; Matin, P.; Rahman, R.; Ben Hadda, T.; Almalki, F.A.; Mahmud, S.; Ghoneim, M.M.; Alruwaily, M.; Alshehri, S. Triazoles and Their Derivatives: Chemistry, Synthesis, and Therapeutic Applications. Front. Mol. Biosci. 2022, 9, 864286. [Google Scholar] [CrossRef]
  14. Yeye, E.O.; Khan, K.M.; Chigurupati, S.; Wadood, A.; Rehman, A.U.; Perveen, S.; Maharajan, M.K.; Shamim, S.; Hameed, S.; Aboaba, S.A.; et al. Syntheses, in vitro α-amylase and α-glucosidase dual inhibitory activities of 4-amino-1,2,4-triazole derivatives their molecular docking and kinetic studies. Bioorganic Med. Chem. 2020, 28, 115467. [Google Scholar] [CrossRef]
  15. Sharma, P.; Thakur, A.; Goyal, A.; Grewal, A.S. Molecular docking, 2D-QSAR and ADMET studies of 4-sulfonyl-2-pyridone heterocycle as a potential glucokinase activator. Results Chem. 2023, 6, 101105. [Google Scholar] [CrossRef]
  16. Mitra, S.; Chatterjee, S.; Bose, S.; Panda, P.; Basak, S.; Ghosh, N.; Mandal, S.C.; Singhmura, S.; Halder, A.K. Finding structural requirements of structurally diverse α-glucosidase and α-amylase inhibitors through validated and predictive 2D-QSAR and 3D-QSAR analyses. J. Mol. Graph. Model. 2024, 126, 108640. [Google Scholar] [CrossRef] [PubMed]
  17. Adeniji, S.E.; Uba, S.; Uzairu, A. Theoretical modeling and molecular docking simulation for investigating and evaluating some active compounds as potent anti-tubercular agents against MTB CYP121 receptor. Futur. J. Pharm. Sci. 2018, 4, 284–295. [Google Scholar] [CrossRef]
  18. Huang, X.; Ma, S.; Wu, Y.; Wan, C.; Zhao, C.; Wang, H.; Ju, S. High-Throughput Screening of Amorphous Polymers with High Intrinsic Thermal Conductivity via Automated Physical Feature Engineering. J. Mater. Chem. A 2023, 11, 20539–20548. [Google Scholar] [CrossRef]
  19. Mouhsin, M.; Abchir, O.; El Otmani, F.S.; Oumghar, A.A.; Oubenali, M.; Chtita, S.; Mbarki, M.; Gamouh, A. Identification of novel NLRP3 inhibitors: A comprehensive approach using 2D-QSAR, molecular docking, molecular dynamics simulation and drug-likeness evaluation. Chem. Pap. 2023, 78, 1193–1204. [Google Scholar] [CrossRef]
  20. Yang, L.; Wang, Y.; Hao, W.; Chang, J.; Pan, Y.; Li, J.; Wang, H. Modeling pesticides toxicity to Sheepshead minnow using QSAR. Ecotoxicol. Environ. Saf. 2020, 193, 110352. [Google Scholar] [CrossRef] [PubMed]
  21. Papa, E.; Sangion, A.; Arnot, J.A.; Gramatica, P. Development of human biotransformation QSARs and application for PBT assessment refinement. Food Chem. Toxicol. 2018, 112, 535–543. [Google Scholar] [CrossRef] [PubMed]
  22. ChemOffice. PerkinElmer Informatics. 2016. Available online: http://www.cambridgesoft.com (accessed on 10 December 2023).
  23. PaDEL-Descriptor Yap. An open source software to calculate molecular descriptors and fingerprints. J. Comput. Chem. 2011, 32, 1466–1474. [Google Scholar] [CrossRef]
  24. Gramatica, P.; Chirico, N.; Papa, E.; Cassani, S.; Kovarich, S. QSARINS: A new software for the development, analysis, and validation of QSAR MLR models. J. Comput. Chem. 2013, 34, 2121–2132. [Google Scholar] [CrossRef]
  25. Mauri, A.; Consonni, V.; Todeschini, R. Molecular descriptors. In Handbook of Computational Chemistry; Springer: Cham, Switzerland, 2017; pp. 2065–2093. [Google Scholar] [CrossRef]
  26. Gramatica, P.; Cassani, S.; Roy, P.P.; Kovarich, S.; Yap, C.W.; Papa, E. QSAR Modeling is not “Push a Button and Find a Correlation”: A Case Study of Toxicity of (Benzo-)triazoles on Algae. Mol. Inform. 2012, 31, 817–835. [Google Scholar] [CrossRef] [PubMed]
  27. Nour, H.; Abchir, O.; Belaidi, S.; Qais, F.A.; Chtita, S.; Belaaouad, S. 2D-QSAR and molecular docking studies of carbamate derivatives to discover novel potent anti-butyrylcholinesterase agents for Alzheimer’s disease treatment. Bull. Korean Chem. Soc. 2021, 43, 277–292. [Google Scholar] [CrossRef]
  28. Nour, H.; Abchir, O.; Belaidi, S.; Chtita, S. Research of new acetylcholinesterase inhibitors based on QSAR and molecular docking studies of benzene-based carbamate derivatives. Struct. Chem. 2022, 33, 1935–1946. [Google Scholar] [CrossRef]
  29. Chirico, N.; Gramatica, P. Real External Predictivity of QSAR Models. Part 2. New Intercomparable Thresholds for Different Validation Criteria and the Need for Scatter Plot Inspection. J. Chem. Inf. Model. 2012, 52, 2044–2058. [Google Scholar] [CrossRef]
  30. Bennani, F.E.; Doudach, L.; Karrouchi, K.; El Rhayam, Y.; Rudd, C.E.; Ansar, M.; Faouzi, M.E.A. 2D-QSAR study and design of novel pyrazole derivatives as an anticancer lead compound against A-549, MCF-7, HeLa, HepG-2, PaCa-2, DLD-1. Comput. Toxicol. 2023, 26, 100265. [Google Scholar] [CrossRef]
  31. Sun, G.; Zhang, Y.; Pei, L.; Lou, Y.; Mu, Y.; Yun, J.; Li, F.; Wang, Y.; Hao, Z.; Xi, S.; et al. Chemometric QSAR modeling of acute oral toxicity of Polycyclic Aromatic Hydrocarbons (PAHs) to rat using simple 2D descriptors and interspecies toxicity modeling with mouse. Ecotoxicol. Environ. Saf. 2021, 222, 112525. [Google Scholar] [CrossRef]
  32. Gramatica, P.; Sangion, A. A Historical Excursus on the Statistical Validation Parameters for QSAR Models: A Clarification Concerning Metrics and Terminology. J. Chem. Inf. Model. 2016, 56, 1127–1131. [Google Scholar] [CrossRef] [PubMed]
  33. Nath, A.; Ojha, P.K.; Roy, K. Computational modeling of aquatic toxicity of polychlorinated naphthalenes (PCNs) employing 2D-QSAR and chemical read-across. Aquat. Toxicol. 2023, 257, 106429. [Google Scholar] [CrossRef]
  34. Gramatica, P. Principles of QSAR models validation: Internal and external. QSAR Comb. Sci. 2007, 26, 694–701. [Google Scholar] [CrossRef]
  35. Khedraoui, M.; Nour, H.; Yamari, I.; Abchir, O.; Errougui, A.; Chtita, S. Design of a new potent Alzheimer’s disease inhibitor based on QSAR, molecular docking and molecular dynamics investigations. Chem. Phys. Impact 2023, 7, 100361. [Google Scholar] [CrossRef]
  36. Eriksson, L.; Jaworska, J.; Worth, A.P.; Cronin, M.T.; McDowell, R.M.; Gramatica, P. Methods for reliability and uncertainty assessment and for applicability evaluations of classification-and regression-based QSARs. Environ. Health Perspect. 2003, 111, 1361–1375. [Google Scholar] [CrossRef] [PubMed]
  37. Netzeva, T.I.; Worth, A.P.; Aldenberg, T.; Benigni, R.; Cronin, M.T.; Gramatica, P.; Jaworska, J.S.; Kahn, S.; Klopman, G.; Marchant, C.A. Current status of methods for defining the applicability domain of (quantitative) structure-activity relationships: The report and recommendations of ECVAM workshop 52. Altern. Lab. Anim. 2005, 33, 155–173. [Google Scholar] [CrossRef] [PubMed]
  38. Yamari, I.; Abchir, O.; Siddique, F.; Zaki, H.; Errougui, A.; Talbi, M.; Bouachrine, M.; ElKouali, M.; Chtita, S. The anticoagulant potential of Lippia Alba extract in inhibiting SARS-CoV-2 Mpro: Density functional calculation, molecular docking analysis, and molecular dynamics simulations. Sci. Afr. 2024, 23, e01986. [Google Scholar] [CrossRef]
  39. Ševčík, J.; Hostinová, E.; Solovicová, A.; Gašperík, J.; Dauter, Z.; Wilson, K.S. Structure of the complex of a yeast glucoamylase with acarbose reveals the presence of a raw starch binding site on the catalytic domain. FEBS J. 2006, 273, 2161–2171. [Google Scholar] [CrossRef]
  40. Guex, N.; Peitsch, M.C. SWISS-MODEL and the Swiss-Pdb Viewer: An environment for comparative protein modeling. Electrophoresis 1997, 18, 2714–2723. [Google Scholar] [CrossRef]
  41. Trott, O.; Olson, A. Software news and update AutoDock Vina: Improving the speed and accuracy of docking with a new scoring function, efficient optimization, and multithreading. J. Comput. Chem. 2009, 31, 455–461. [Google Scholar] [CrossRef]
  42. Diniyah, N.; Alam, B.; Javed, A.; Alshammari, F.H.; Choi, H.-J.; Lee, S.-H. In silico and docking studies on the binding activities of Keap1 of antioxidant compounds in non-oilseed legumes. Arab. J. Chem. 2023, 16, 104414. [Google Scholar] [CrossRef]
  43. Elangovan, N.; Sowrirajan, S.; Arumugam, N.; Almansour, A.I.; Mahalingam, S.M.; Kanchana, S. Synthesis, solvent role (water and DMSO), antimicrobial activity, reactivity analysis, inter and intramolecular charge transfer, topology, and molecular docking studies on adenine derivative. J. Mol. Liq. 2023, 391, 123250. [Google Scholar] [CrossRef]
  44. Hanwell, M.D.; Curtis, D.E.; Lonie, D.C.; Vandermeersch, T.; Zurek, E.; Hutchison, G.R. Avogadro: An advanced semantic chemical editor, visualization, and analysis platform. J. Cheminform. 2012, 4, 17. [Google Scholar] [CrossRef]
  45. Liu, X.; Zang, X.; Yin, X.; Yang, W.; Huang, J.; Huang, J.; Yu, C.; Ke, C.; Hong, Y. Semi-synthesis of C28-modified triterpene acid derivatives from maslinic acid or corosolic acid as potential α-glucosidase inhibitors. Bioorganic Chem. 2020, 97, 103694. [Google Scholar] [CrossRef]
  46. Morris, G.M.; Huey, R.; Lindstrom, W.; Sanner, M.F.; Belew, R.K.; Goodsell, D.S.; Olson, A.J. AutoDock4 and AutoDockTools4: Automated docking with selective receptor flexibility. J. Comput. Chem. 2009, 30, 2785–2791. [Google Scholar] [CrossRef]
  47. Yusuf, T.L.; Waziri, I.; Olofinsan, K.A.; Akintemi, E.O.; Hosten, E.C.; Muller, A.J. Evaluating the in vitro antidiabetic, antibacterial and antioxidant properties of copper(II) Schiff base complexes: An experimental and computational studies. J. Mol. Liq. 2023, 389, 122845. [Google Scholar] [CrossRef]
  48. Shukla, R.; Munjal, N.S.; Singh, T.R. Identification of novel small molecules against GSK3β for Alzheimer’s disease using chemoinformatics approach. J. Mol. Graph. Model. 2019, 91, 91–104. [Google Scholar] [CrossRef] [PubMed]
  49. Yamari, I.; Abchir, O.; Nour, H.; El Kouali, M.; Chtita, S. Identification of new dihydrophenanthrene derivatives as promising anti-SARS-CoV-2 drugs through in silico investigations. Main Group Chem. 2023, 22, 469–484. [Google Scholar] [CrossRef]
  50. Duchowicz, P.R.; Talevi, A.; Bellera, C.; Bruno-Blanch, L.E.; Castro, E.A. Application of descriptors based on Lipinski’s rules in the QSPR study of aqueous solubilities. Bioorganic Med. Chem. 2007, 15, 3711–3719. [Google Scholar] [CrossRef] [PubMed]
  51. Chagas, C.M.; Moss, S.; Alisaraie, L. Drug metabolites and their effects on the development of adverse reactions: Revisiting Lipinski’s Rule of Five. Int. J. Pharm. 2018, 549, 133–149. [Google Scholar] [CrossRef] [PubMed]
  52. Lambring, C.B.; Fiadjoe, H.; Behera, S.K.; Basha, R. Docking and molecular dynamic simulations of Mithramycin-A and Tolfenamic acid against Sp1 and survivin. Process. Biochem. 2024, 137, 207–216. [Google Scholar] [CrossRef]
  53. Basnet, S.; Ghimire, M.P.; Lamichhane, T.R.; Adhikari, R.; Adhikari, A. Identification of potential human pancreatic α-amylase inhibitors from natural products by molecular docking, MM/GBSA calculations, MD simulations, and ADMET analysis. PLoS ONE 2023, 18, e0275765. [Google Scholar] [CrossRef] [PubMed]
  54. Roos, K.; Wu, C.; Damm, W.; Reboul, M.; Stevenson, J.M.; Lu, C.; Dahlgren, M.K.; Mondal, S.; Chen, W.; Wang, L.; et al. OPLS3e: Extending Force Field Coverage for Drug-Like Small Molecules. J. Chem. Theory Comput. 2019, 15, 1863–1874. [Google Scholar] [CrossRef] [PubMed]
  55. Protein Preparation Wizard. Available online: https://www.schrodinger.com/science-articles/protein-preparation-wizard (accessed on 10 March 2023).
  56. Mark, P.; Nilsson, L. Structure and Dynamics of the TIP3P, SPC, and SPC/E Water Models at 298 K. J. Phys. Chem. A 2001, 105, 9954–9960. [Google Scholar] [CrossRef]
  57. Uba, A.I.; Chea, J.; Hoag, H.; Hryb, M.; Bui-Linh, C.; Wu, C. Binding of a positive allosteric modulator CDPPB to metabotropic glutamate receptor type 5 (mGluR5) probed by all-atom molecular dynamics simulations. Life Sci. 2022, 309, 121014. [Google Scholar] [CrossRef] [PubMed]
  58. D.E. Shaw Research. Desmond Molecular Dynamics System, Maestro-Desmond Interoperability Tools; Schrödinger: New York, NY, USA, 2021. [Google Scholar]
  59. Bhattacharya, P.; Abualnaja, K.M.; Javed, S. Theoretical studies, spectroscopic investigation, molecular docking, molecular dynamics and MMGBSA calculations with 2-hydrazinoquinoline. J. Mol. Struct. 2023, 1274, 134482. [Google Scholar] [CrossRef]
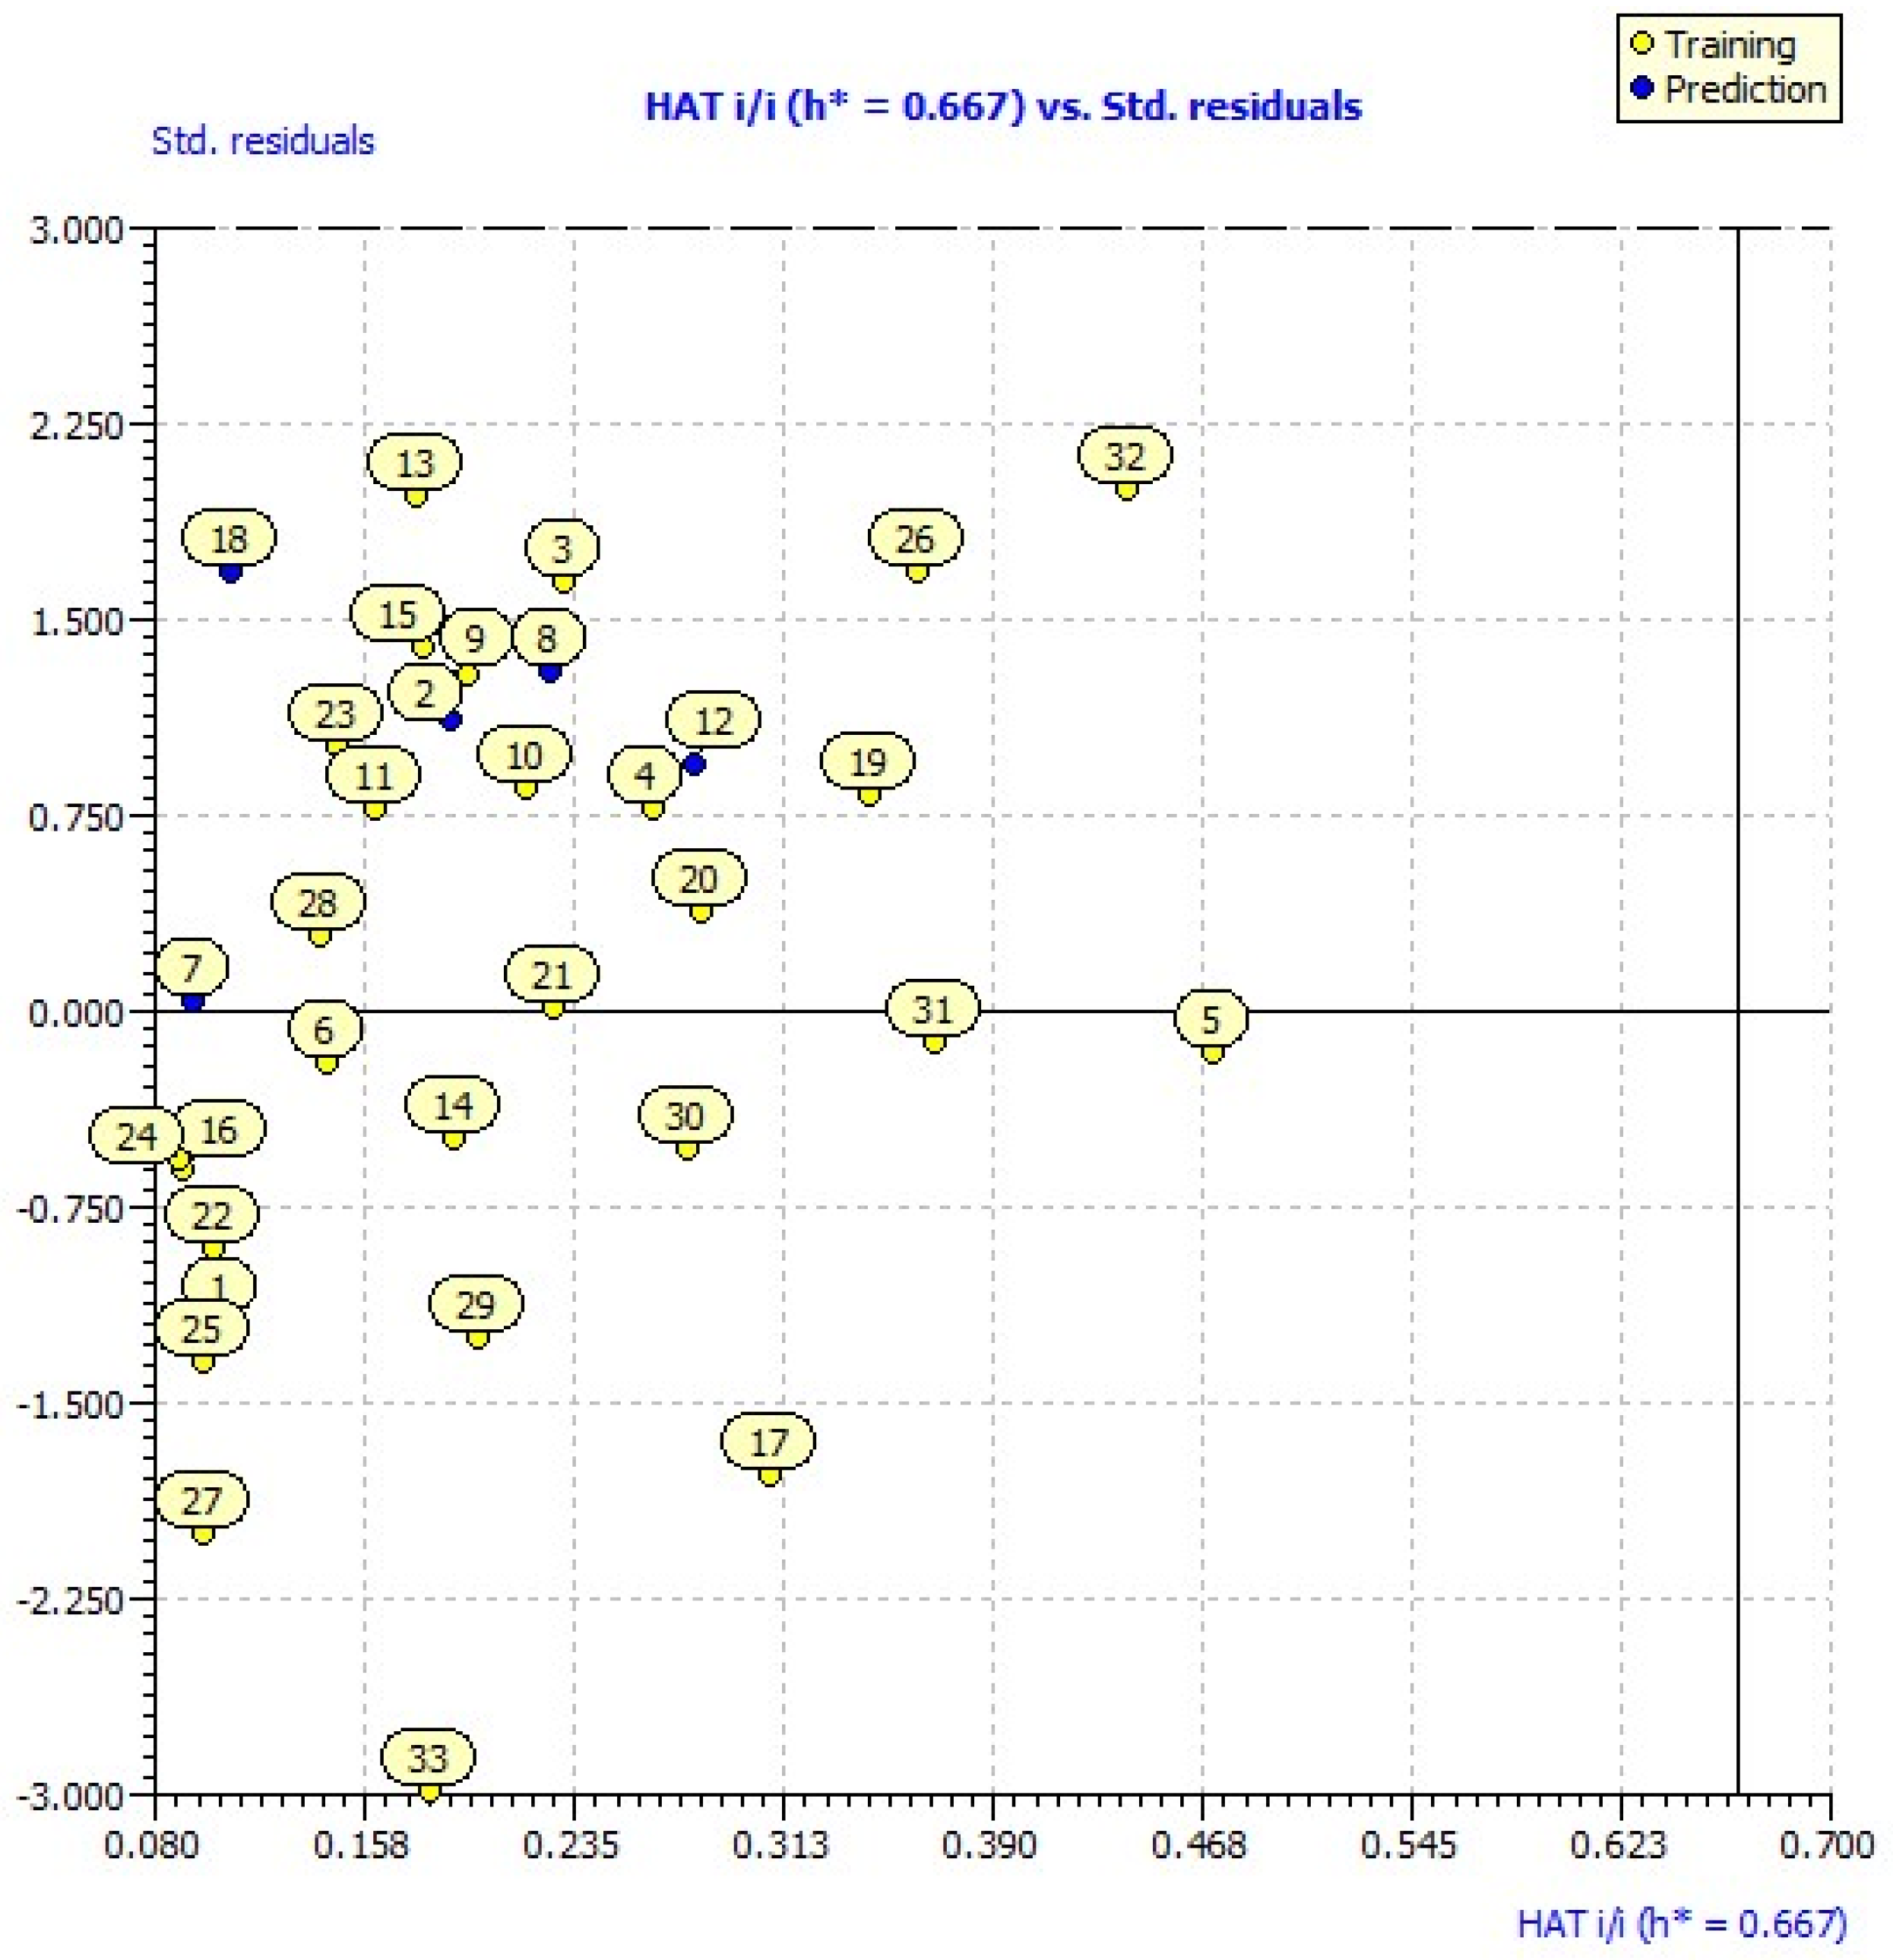
Figure 1. William’s plot of the developed model.
Pharmaceuticals 17 00261 g001
Figure 2. Three-dimensional visualization of the docked ligands into the binding site of alpha-glucosidase receptor.
Pharmaceuticals 17 00261 g002
Figure 3. The 2D visualization of created complexes after molecular docking, with distances, interaction types, and participating residues.
Pharmaceuticals 17 00261 g003aPharmaceuticals 17 00261 g003b
Figure 4. Protein RMSD plot of all simulated complexes after 100 ns.
Pharmaceuticals 17 00261 g004
Figure 5. Ligand RMSD plot of all simulated complexes after 100 ns.
Pharmaceuticals 17 00261 g005
Figure 6. Protein RMSF plot of all simulated complexes after 100ns.
Pharmaceuticals 17 00261 g006
Figure 7. (A) The 3D visualization of the 2f6d receptor; (B) the binding site of the 2f6d receptor.
Pharmaceuticals 17 00261 g007
Figure 8. Frequency of appearance for each docking conformation in five independent runs.
Pharmaceuticals 17 00261 g008
Figure 9. The alignment of the docked ligand (Yellow) with the initial ligand (Grey) illustrates a noteworthy similarity, affirming the reliability of the molecular docking protocol.
Pharmaceuticals 17 00261 g009
Table 1. The developed model using GA-MLR and its evaluated statistical parameters.
Model Equation
pIC50 = 6.403 + 0.759 AATSC8s + 0.022 VE3_Dzs − 0.112 nHsOH − 0.338 CIC1 − 1.804 RotBFrac
Set33Training set27Test set6
Fitting criteriaInternal validation criteriaExternal validation criteria
R20.767Q2LOO0.649R2ext0.633
R2adj0.712Random Models Parameters
R2-R2adj0.055Average R Average R2 Average Q2 cRp2
RMSE0.0820.4280.196−0.3420.669
Table 2. The significance of the molecular descriptors constructed the developed model.
Descriptor SymbolName of DescriptorReferences
AATSC8sAveraged and centered Moreau–Broto autocorrelation of lag 8 weighted by intrinsic state[17]
VE3_DzsLogarithmic coefficient sum of the last eigenvector from Barysz matrix weighted by Sanderson EN[18]
nHsOHThe count of a specific atom-type Hydrogen (H) E-State associated with hydroxy groups (OH)[19]
CIC11-ordered complementary information content[20]
RotBFracFraction of rotatable bonds, excluding terminal bonds[21]
Table 3. The 2D visualization of the new designed compounds using the developed model.
NStructureNStructure
3Pharmaceuticals 17 00261 i00110Pharmaceuticals 17 00261 i002
4Pharmaceuticals 17 00261 i00314Pharmaceuticals 17 00261 i004
6Pharmaceuticals 17 00261 i00519Pharmaceuticals 17 00261 i006
7Pharmaceuticals 17 00261 i007
Table 4. The values of the descriptors constructing the developed model for the synthetized compounds, designed compounds with their calculated pIC50, and leverages.
NameAATSC8sVE3_DzsnHsOHCIC1RotBFracpIC50hi
Synthetized Compounds 1 *−0.006−3.81911.4390.1335.582h* = 0.667
2 *−0.010−6.59921.3160.1255.264
30.037−7.79721.3160.1255.264
4−0.010−8.58721.3160.1255.270
5−0.075−5.28731.3280.1185.241
60.064−7.49801.5780.2225.369
7 *0.043−6.00401.5780.2225.367
8 *0.184−4.74001.8300.2505.263
90.131−5.43401.6330.2635.271
100.122−7.00701.6330.2635.262
11−0.174−3.35501.6210.1255.369
12 *−0.169−1.72401.9680.1675.196
13−0.128−2.26401.5070.1335.368
14−0.128−2.53101.3460.1255.604
15−0.127−7.23301.3760.1775.270
160.044−4.37501.3760.1775.607
17−0.074−2.61812.2140.1825.198
18 *0.032−7.78111.1930.1765.276
190.256−4.96511.3960.2115.485
200.220−5.27001.3490.2115.599
21−0.004−2.95011.1030.1255.625
22−0.021−6.06910.9370.1675.599
23−0.103−3.62201.1610.1765.461
240.012−5.28401.1610.1765.633
25−0.010−6.83901.1610.1765.644
26−0.127−9.69001.0550.1675.359
27−0.030−6.92911.0110.1675.636
28−0.080−4.90101.0690.1335.613
290.001−3.75502.2160.2175.264
30−0.037−3.69202.0940.2405.184
310.000−4.56602.6410.0835.267
320.026−4.19602.7200.0745.201
33−0.019−7.01001.6640.1115.680
Designed compoundsP3−0.106−3.08201.1430.0505.7800.084
P4−0.005−3.52401.1030.1185.7380.023
P6−0.084−3.32800.8910.1255.7410.059
P70.083−4.03201.0360.1505.7580.055
P100.077−5.26300.8000.1255.8520.082
P140.113−8.22201.2240.1005.7170.358
P190.109−3.41001.3180.1255.7410.081
*: test compounds, P: proposed compounds.
Table 5. The created interactions of obtained complexes with binding scores, participated residues, molecular interactions, and distances expressed in Å.
NScore Kcal/MolResidueInteraction TypeDistance (Å)
P3−6.4Trp139Pi–Pi Stacked4.87
Trp139Pi–Pi Stacked4.19
Trp139Pi–Alkyl5.13
Tyr351Pi–Alkyl5.29
HOH1163Water Hydrogen Bond3.57
HOH1189Water Hydrogen Bond2.92
HOH1672Water Hydrogen Bond3.38
HOH1504Water Hydrogen Bond3.09
HOH1672Water Hydrogen Bond3.45
HOH1723 Water Hydrogen Bond3.23
P4−7Trp209Carbon–Hydrogen Bond3.39
Glu210Carbon–Hydrogen Bond3.39
Glu210Pi–Anion3.85
Trp139Pi–Pi Stacked3.85
Trp139Pi–Pi Stacked4.36
HOH1433Water Hydrogen Bond4.17
P6−7.2Glu210Conventional Hydrogen Bond2.62
Glu210Conventional Hydrogen Bond2.66
Trp139Carbon–Hydrogen Bond3.36
Trp209Carbon–Hydrogen Bond3.38
Glu210Carbon–Hydrogen Bond3.59
Glu210Pi–Anion3.77
Trp139Pi–Pi Stacked4.59
Trp139Pi–Pi Stacked3.97
Tyr351Pi–Pi Stacked4.29
Ala138Alkyl4.1
HOH1163Water Hydrogen Bond4
P7−7.3Trp209Carbon–Hydrogen Bond3.61
Glu210Pi–Anion3.69
Trp139Pi–Pi Stacked4.43
Trp139Pi–Pi Stacked3.74
Tyr351Pi–Pi Stacked4.54
Trp139Pi–Pi Stacked4.56
HOH1282Water Hydrogen Bond3.81
HOH1672Water Hydrogen Bond2.88
HOH1723Water Hydrogen Bond3.29
HOH1232Water Hydrogen Bond3.17
HOH1280Water Hydrogen Bond3.67
P10−7.1Arg69Conventional Hydrogen Bond2.52
Trp209Conventional Hydrogen Bond2.17
Glu211Conventional Hydrogen Bond2.68
Glu211Conventional Hydrogen Bond2.38
Glu210Carbon–Hydrogen Bond3.26
Tyr351Pi–Pi Stacked4.04
HOH1464Water Hydrogen Bond2.93
HOH1672Water Hydrogen Bond3.48
HOH1723Water Hydrogen Bond3.18
HOH1189Water Hydrogen Bond3.24
HOH1282Water Hydrogen Bond3.39
P14−7.3Arg345Conventional Hydrogen Bond2.71
Glu210Conventional Hydrogen Bond2.93
Trp209Carbon–Hydrogen Bond3.08
Arg345Pi–Cation3.42
Tyr351Pi–Sigma3.79
Trp139Pi–Pi Stacked5.27
Trp139Pi–Pi Stacked4.73
Trp139Pi–Pi Stacked3.97
Trp139Pi–Pi Stacked4.45
P19−7.2Arg69Pi–Cation3.66
Tyr351Pi–Pi Stacked3.89
HOH1723Water Hydrogen Bond2.67
HOH1464Water Hydrogen Bond1.83
Acarbose−12.3Arg69Conventional Hydrogen Bond2.25
Glu211Conventional Hydrogen Bond2.21
Glu210Conventional Hydrogen Bond2.14
Leu208Conventional Hydrogen Bond1.9
Asp70Conventional Hydrogen Bond1.84
Trp209Carbon–Hydrogen Bond3.52
Ala138Carbon–Hydrogen Bond3.79
Tyr351Pi–Sigma3.54
HOH1449Water Hydrogen Bond2.72
HOH1504Water Hydrogen Bond2.91
HOH1778Water Hydrogen Bond3.03
HOH1797Water Hydrogen Bond1.8
HOH1663Water Hydrogen Bond2.73
HOH1663Water Hydrogen Bond1.99
HOH1232Water Hydrogen Bond2
HOH1282Water Hydrogen Bond2.32
HOH1095Water Hydrogen Bond3.01
Table 6. The predicted ADMET properties of analyzed compounds by using pkCSM online tools.
CompoundsP3P4P6P7P10P14P19
MOL_WEIGHT257.322276.097222.639242.242206.184259.7201.233
LOGP1.42251.794480.79091.04520.27662.68511.1326
ROTATABLE_BONDS1223222
ACCEPTORS6566645
DONORS1011111
SURFACE_AREA108.812100.17190.409102.13584.271108.10587.251
Water solubility−3.072−3.119−2.684−2.956−2.446−3.667−1.893
Caco2 permeability1.2921.0111.2941.3220.741.3360.728
Intestinal absorption (human)98.13497.51784.35877.07285.84493.4272.544
Skin Permeability−2.618−2.554−2.84−2.735−2.769−2.72−2.897
P-glycoprotein substrateNoNoNoYesNoYesNo
P-glycoprotein I inhibitorNoNoNoNoNoNoNo
P-glycoprotein II inhibitorNoNoNoNoNoNoNo
VDss (human)−0.294−0.351−0.7140.051−0.767−0.195−0.367
Fraction unbound (human)0.3390.2930.4480.3780.4480.2150.311
BBB permeability−0.0430.149−0.764−0.587−0.7960.373−0.323
CNS permeability−1.977−2.814−3.047−3.456−3.118−2.06−2.414
CYP2D6 substrateNoNoNoNoNoNoNo
CYP3A4 substrateYesNoNoNoNoYesNo
CYP1A2 inhibitorYesYesYesYesYesYesYes
CYP2C19 inhibitorNoNoNoNoNoNoNo
CYP2C9 inhibitorNoNoNoNoNoNoNo
CYP2D6 inhibitorNoNoNoNoNoNoNo
CYP3A4 inhibitorNoNoNoNoNoNoNo
Total Clearance0.1090.0630.160.5860.5570.5030.239
Renal OCT2 substrateNoNoNoYesNoNoNo
AMES toxicityYesYesNoYesNoNoYes
Max. tolerated dose (human)−0.7490.3970.6320.5930.613−0.250.378
hERG I inhibitorNoNoNoNoNoNoNo
hERG II inhibitorNoNoNoNoNoNoNo
Oral Rat Acute Toxicity (LD50)2.2542.3132.3791.8042.222.512.383
Oral Rat Chronic Toxicity (LOAEL)1.7051.7471.6041.1280.6641.6691.82
HepatotoxicityYesNoNoYesYesYesNo
Skin SensitizationNoNoNoNoNoNoNo
T. Pyriformis toxicity0.5641.1760.2840.2850.2411.0020.647
Minnow toxicity2.5861.5242.6842.5293.0211.282.364
Table 7. Protein–ligand contact (histogram and timeline) of all simulated complexes after 100 ns (Pink: ionic bond; bleu: water bridge; violet: hydrophobic bond, and Green: Hydrogen bond).
ComplexPL-Contacts HistogramPL-Contacts Timeline
P6-2f6dPharmaceuticals 17 00261 i008Pharmaceuticals 17 00261 i009
P10-2f6dPharmaceuticals 17 00261 i010Pharmaceuticals 17 00261 i011
P14-2f6dPharmaceuticals 17 00261 i012Pharmaceuticals 17 00261 i013
Table 8. The 2D structure of 33 triazole derivatives with their biological activity against alpha-glucosidase pIC50.
Pharmaceuticals 17 00261 i014
(1) pIC50 = 5.58
Pharmaceuticals 17 00261 i015
(12) pIC50= 5.20
Pharmaceuticals 17 00261 i016
(23) pIC50 = 5.46
Pharmaceuticals 17 00261 i017
(2) pIC50 = 5.26
Pharmaceuticals 17 00261 i018
(13) pIC50 = 5.37
Pharmaceuticals 17 00261 i019
(24) pIC50 = 5.63
Pharmaceuticals 17 00261 i020
(3) pIC50 = 5.26
Pharmaceuticals 17 00261 i021
(14) pIC50 = 5.60
Pharmaceuticals 17 00261 i022
(25) pIC50 = 5.64
Pharmaceuticals 17 00261 i023
(4) pIC50 = 5.27
Pharmaceuticals 17 00261 i024
(15) pIC50 = 5.27
Pharmaceuticals 17 00261 i025
(26) pIC50 = 5.36
Pharmaceuticals 17 00261 i026
(5) pIC50 = 5.24
Pharmaceuticals 17 00261 i027
(16) pIC50 = 5.61
Pharmaceuticals 17 00261 i028
(27) pIC50 = 5.64
Pharmaceuticals 17 00261 i029
(6) pIC50 = 5.37
Pharmaceuticals 17 00261 i030
(17) pIC50 = 5.20
Pharmaceuticals 17 00261 i031
(28) pIC50 = 5.61
Pharmaceuticals 17 00261 i032
(7) pIC50 = 5.37
Pharmaceuticals 17 00261 i033
(18) pIC50 = 5.28
Pharmaceuticals 17 00261 i034
(29) pIC50 = 5.26
Pharmaceuticals 17 00261 i035
(8) pIC50 = 5.26
Pharmaceuticals 17 00261 i036
(19) pIC50 = 5.48
Pharmaceuticals 17 00261 i037
(30) pIC50 = 5.18
Pharmaceuticals 17 00261 i038
(9) pIC50 = 5.27
Pharmaceuticals 17 00261 i039
(20) pIC50 = 5.60
Pharmaceuticals 17 00261 i040
(31) pIC50 = 5.27
Pharmaceuticals 17 00261 i041
(10) pIC50 = 5.26
Pharmaceuticals 17 00261 i042
(21) pIC50 = 5.62
Pharmaceuticals 17 00261 i043
(32) pIC50 = 5.20
Pharmaceuticals 17 00261 i044
(11) pIC50 = 5.37
Pharmaceuticals 17 00261 i045
(22) pIC50 = 5.60
Pharmaceuticals 17 00261 i046
(33) pIC50 = 5.68
Disclaimer/Publisher’s Note: The statements, opinions and data contained in all publications are solely those of the individual author(s) and contributor(s) and not of MDPI and/or the editor(s). MDPI and/or the editor(s) disclaim responsibility for any injury to people or property resulting from any ideas, methods, instructions or products referred to in the content.