
Integrative Approach for Designing Novel Triazole Derivatives as α-Glucosidase Inhibitors: QSAR, Molecular Docking, ADMET, and Molecular Dynamics Investigations

 ,
,  , and
, and
Abstract
Abstract
Dataset License
1. Introduction
2. Results and Discussion
2.1. QSAR Model Analysis and Validation According to the OECD Principles
2.2. Design of Novel Compounds
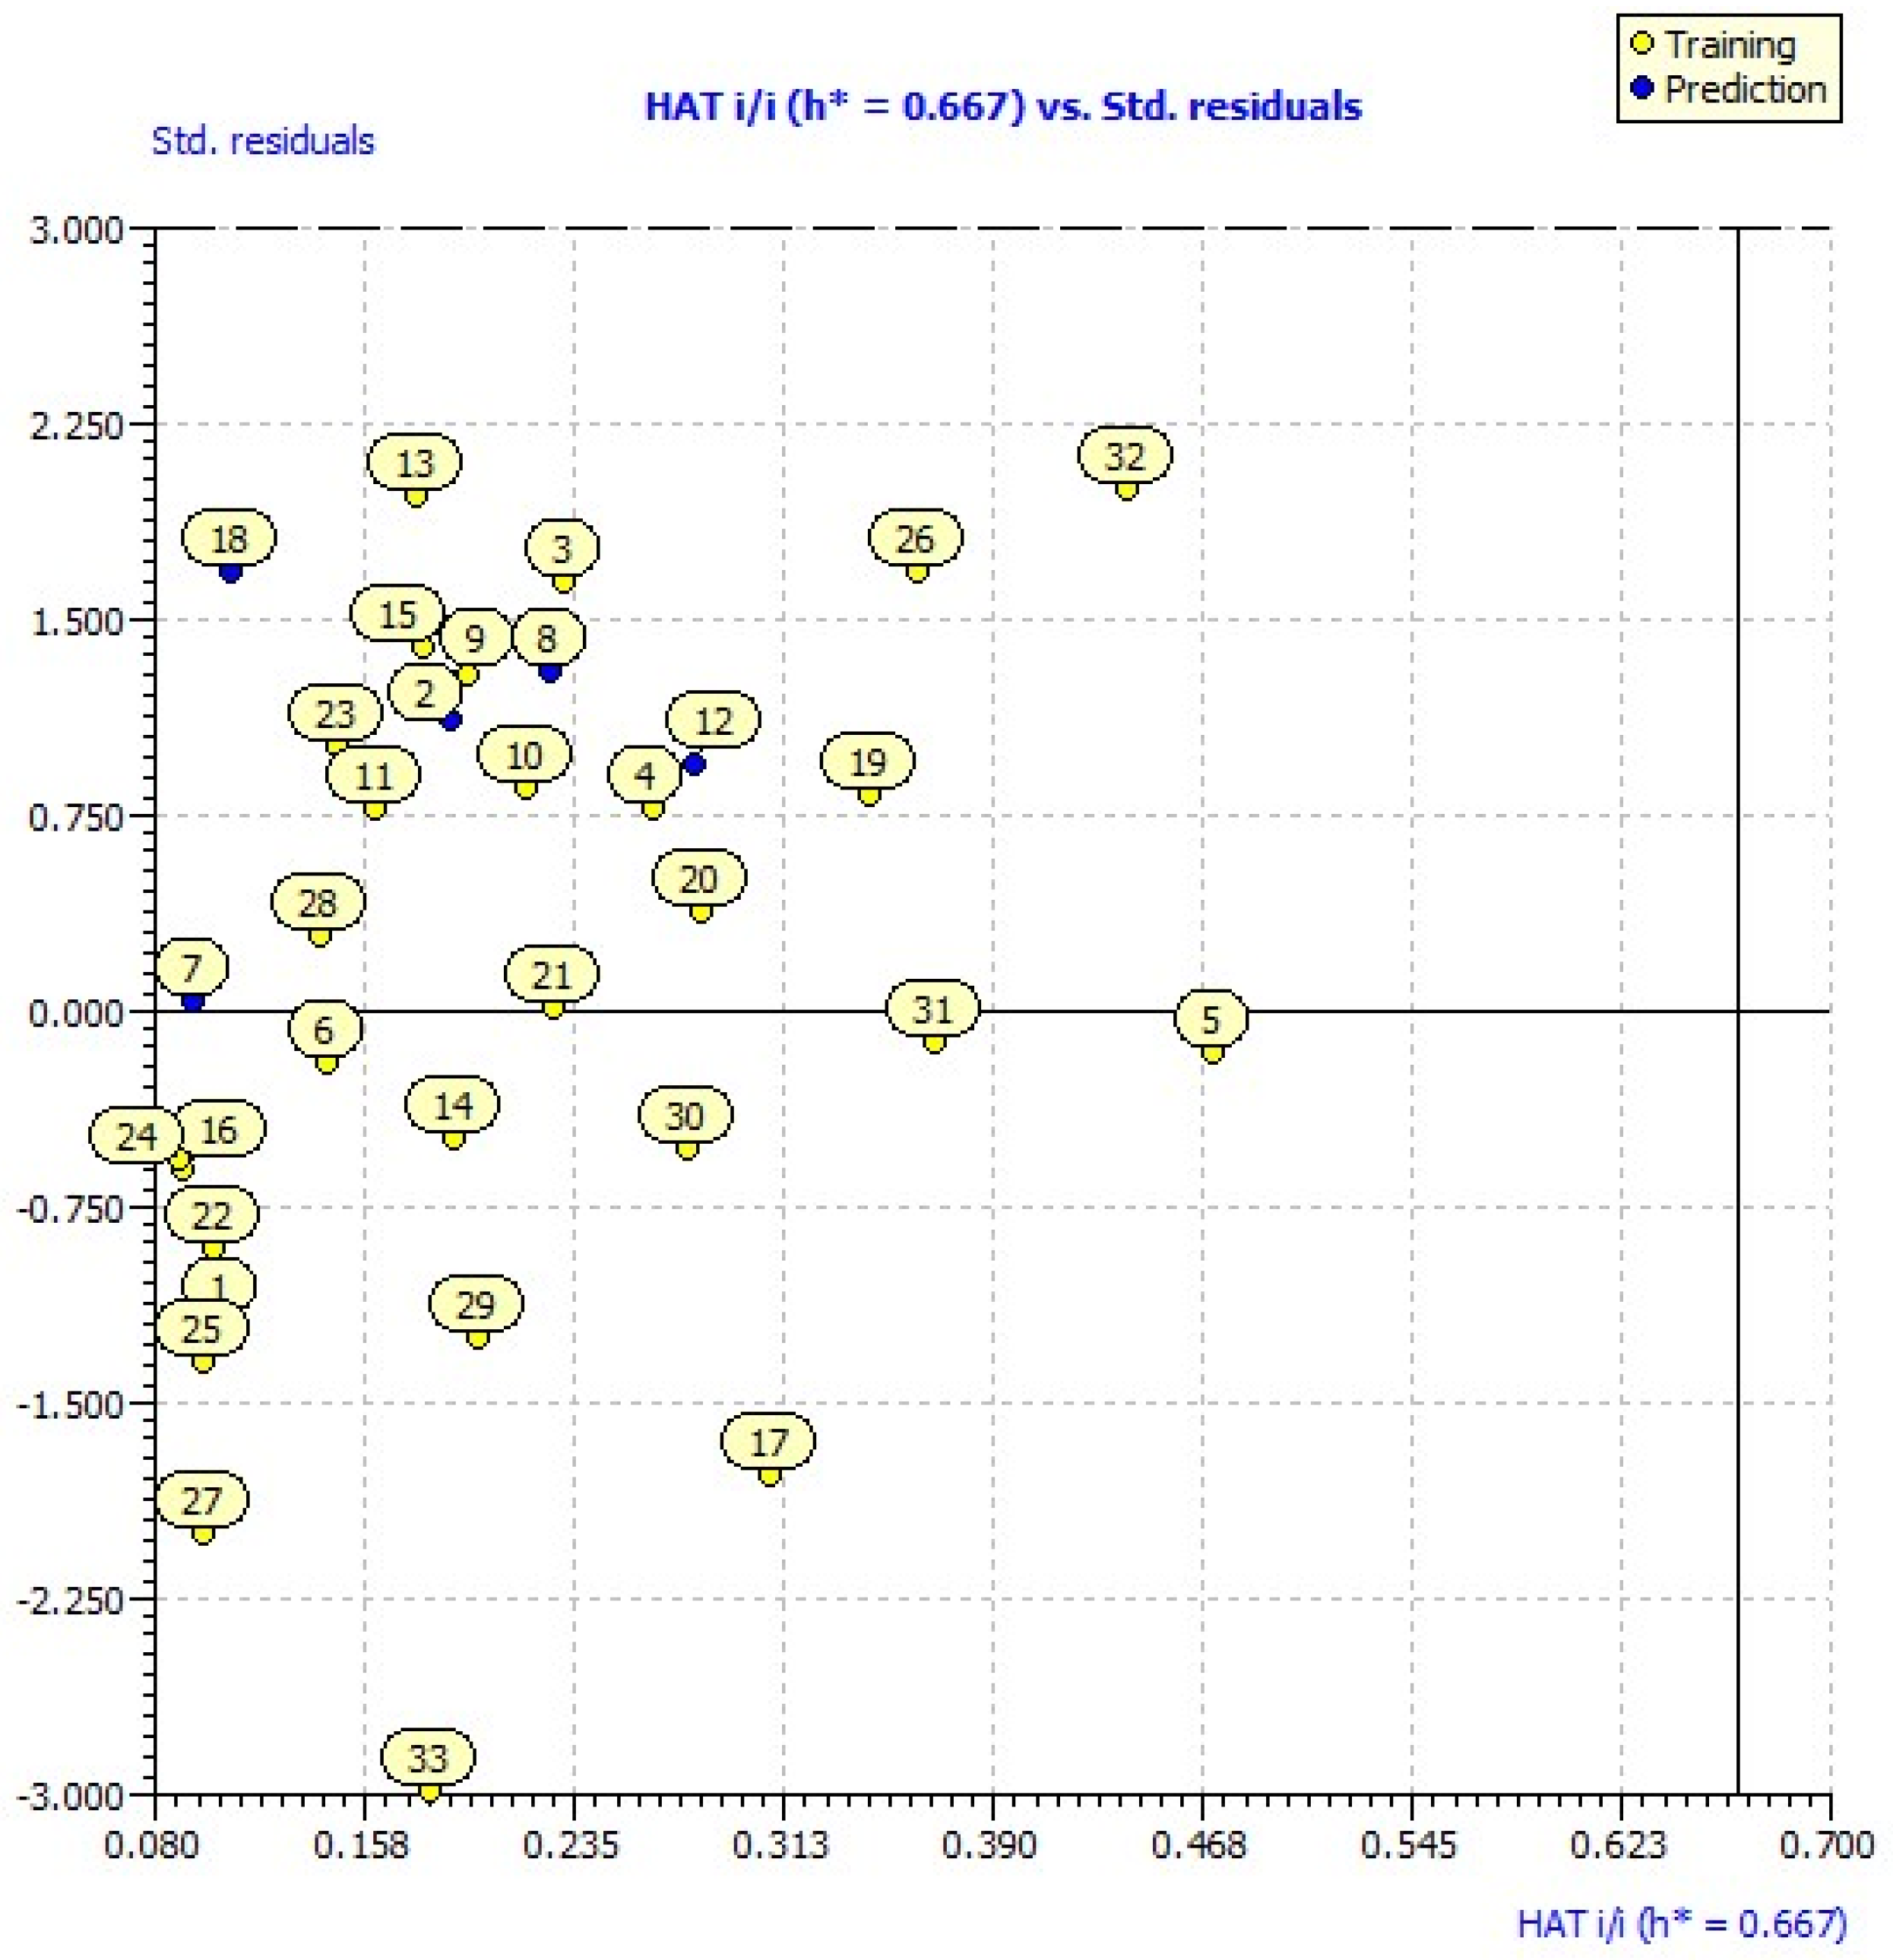
2.3. Applicability Domain
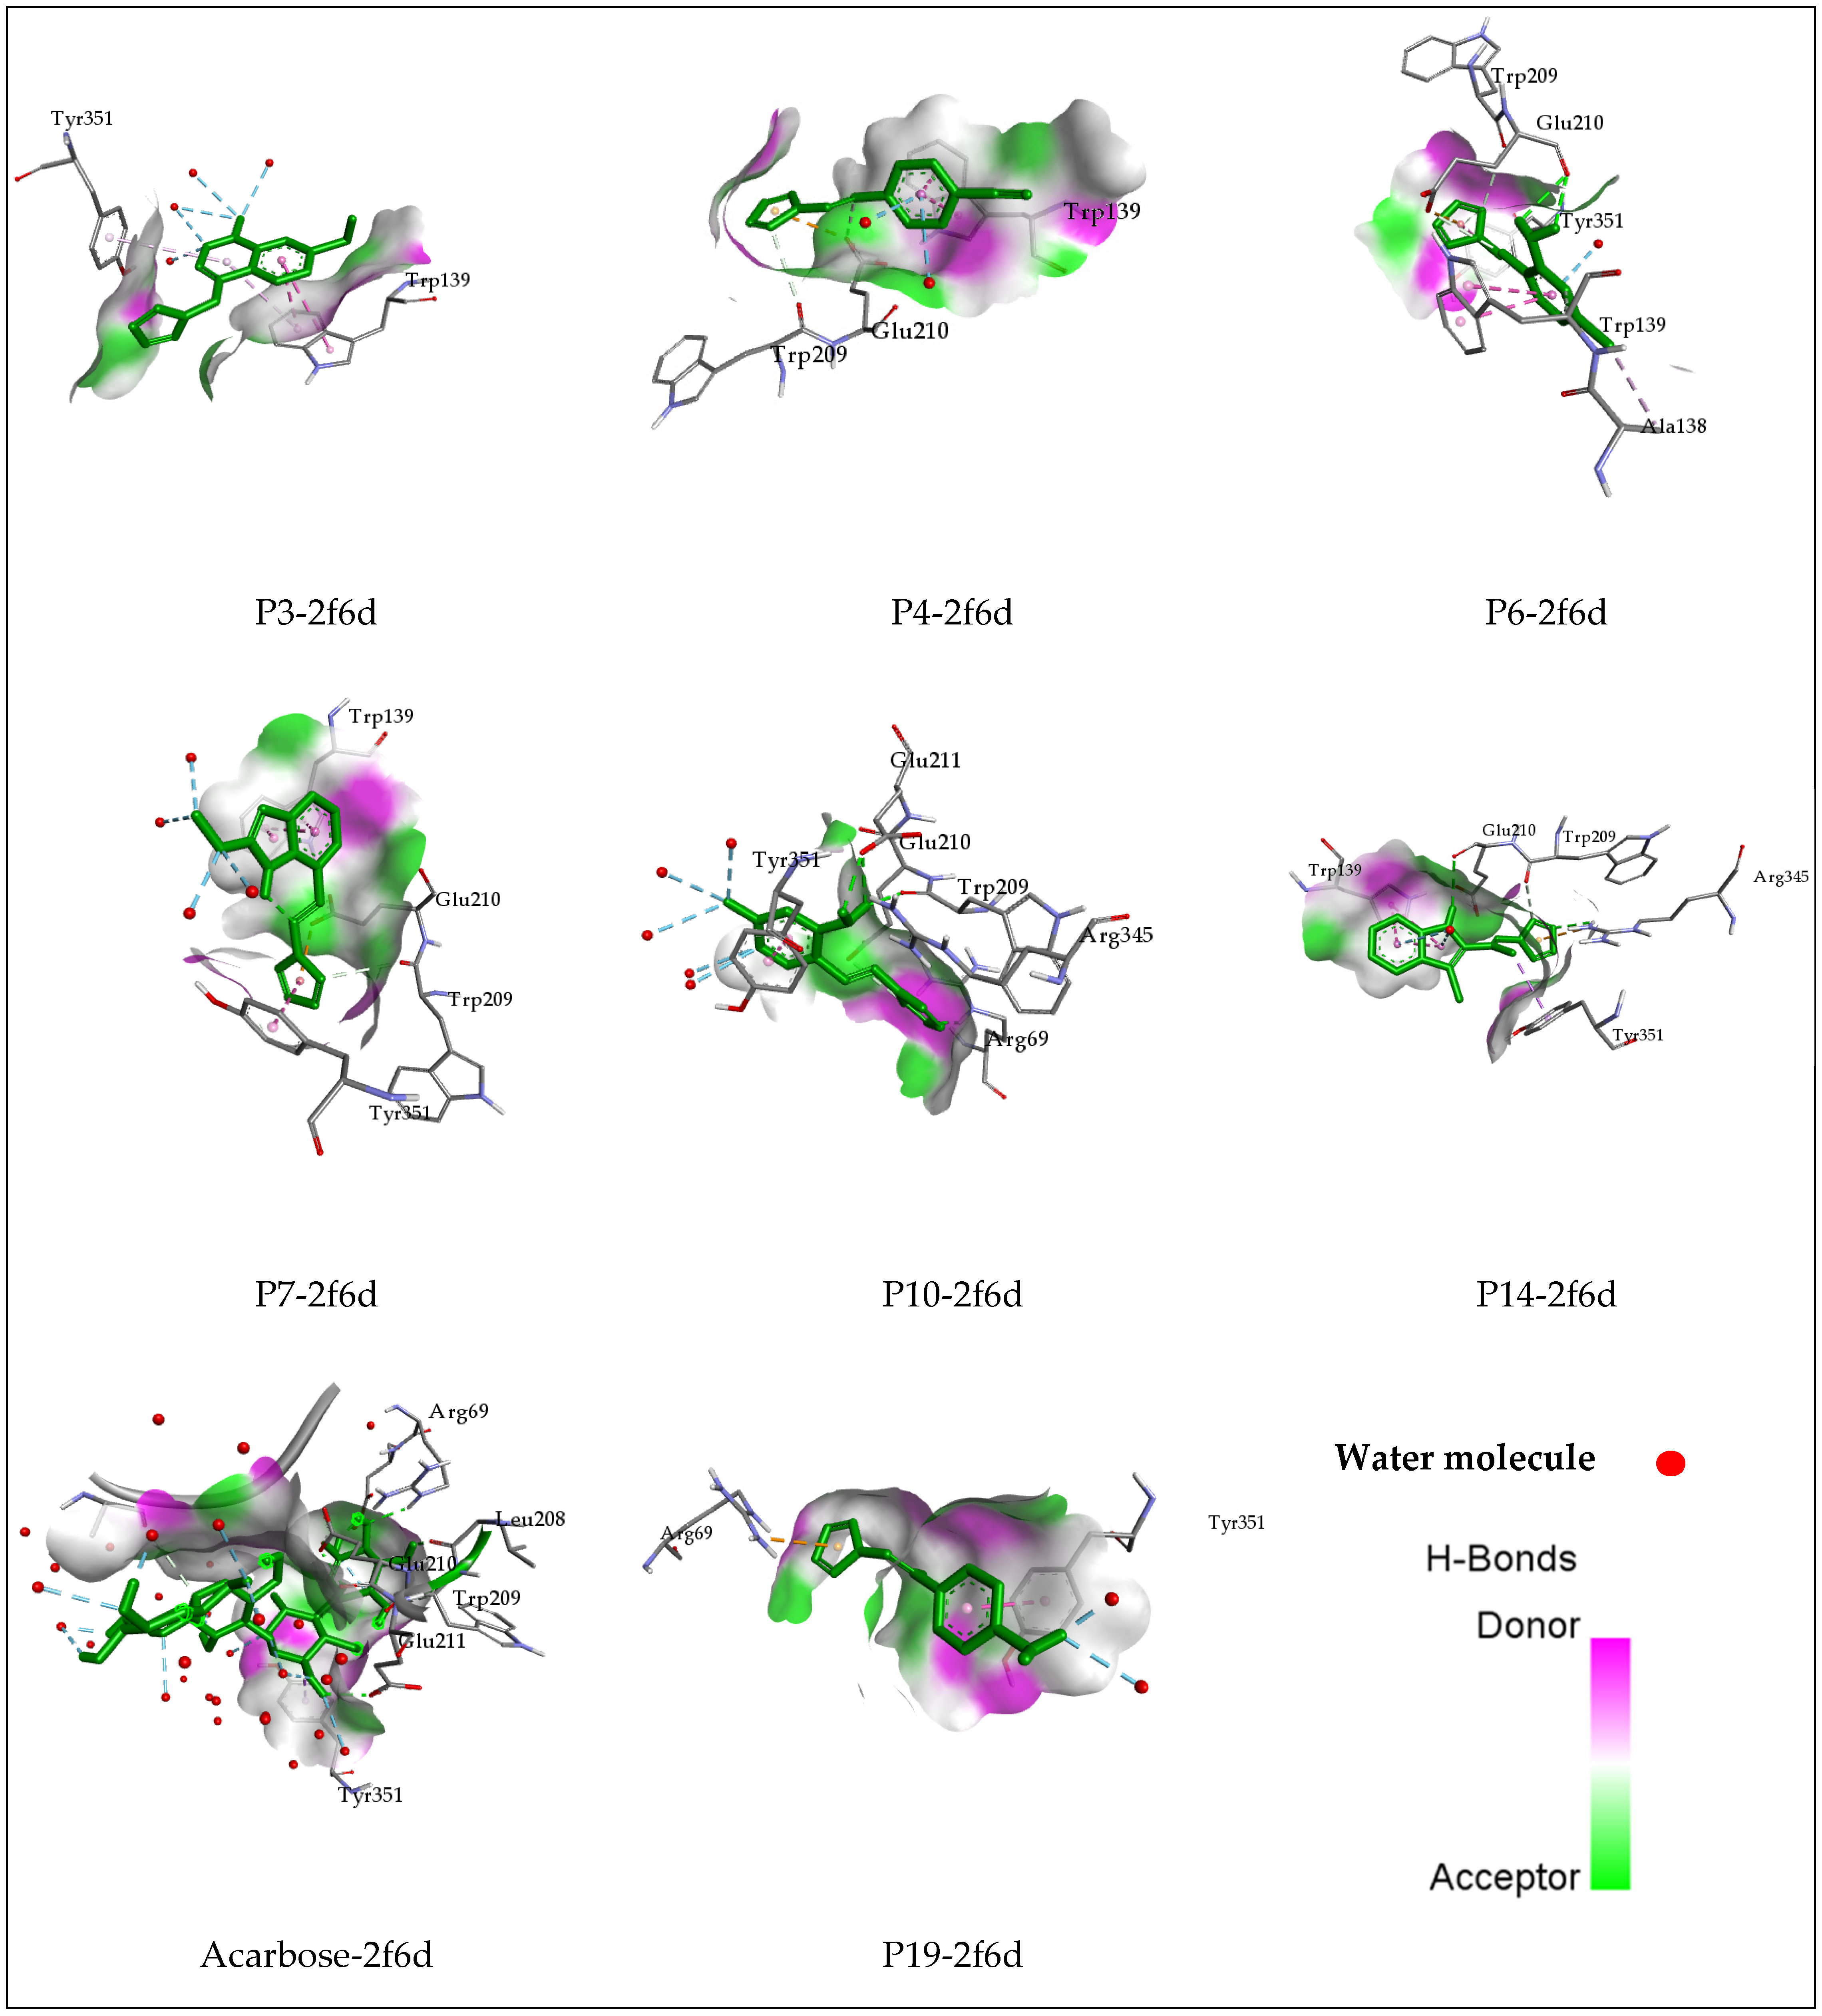
2.4. Molecular Docking
2.5. ADMET Properties Prediction
2.6. Molecular Dynamics Simulation
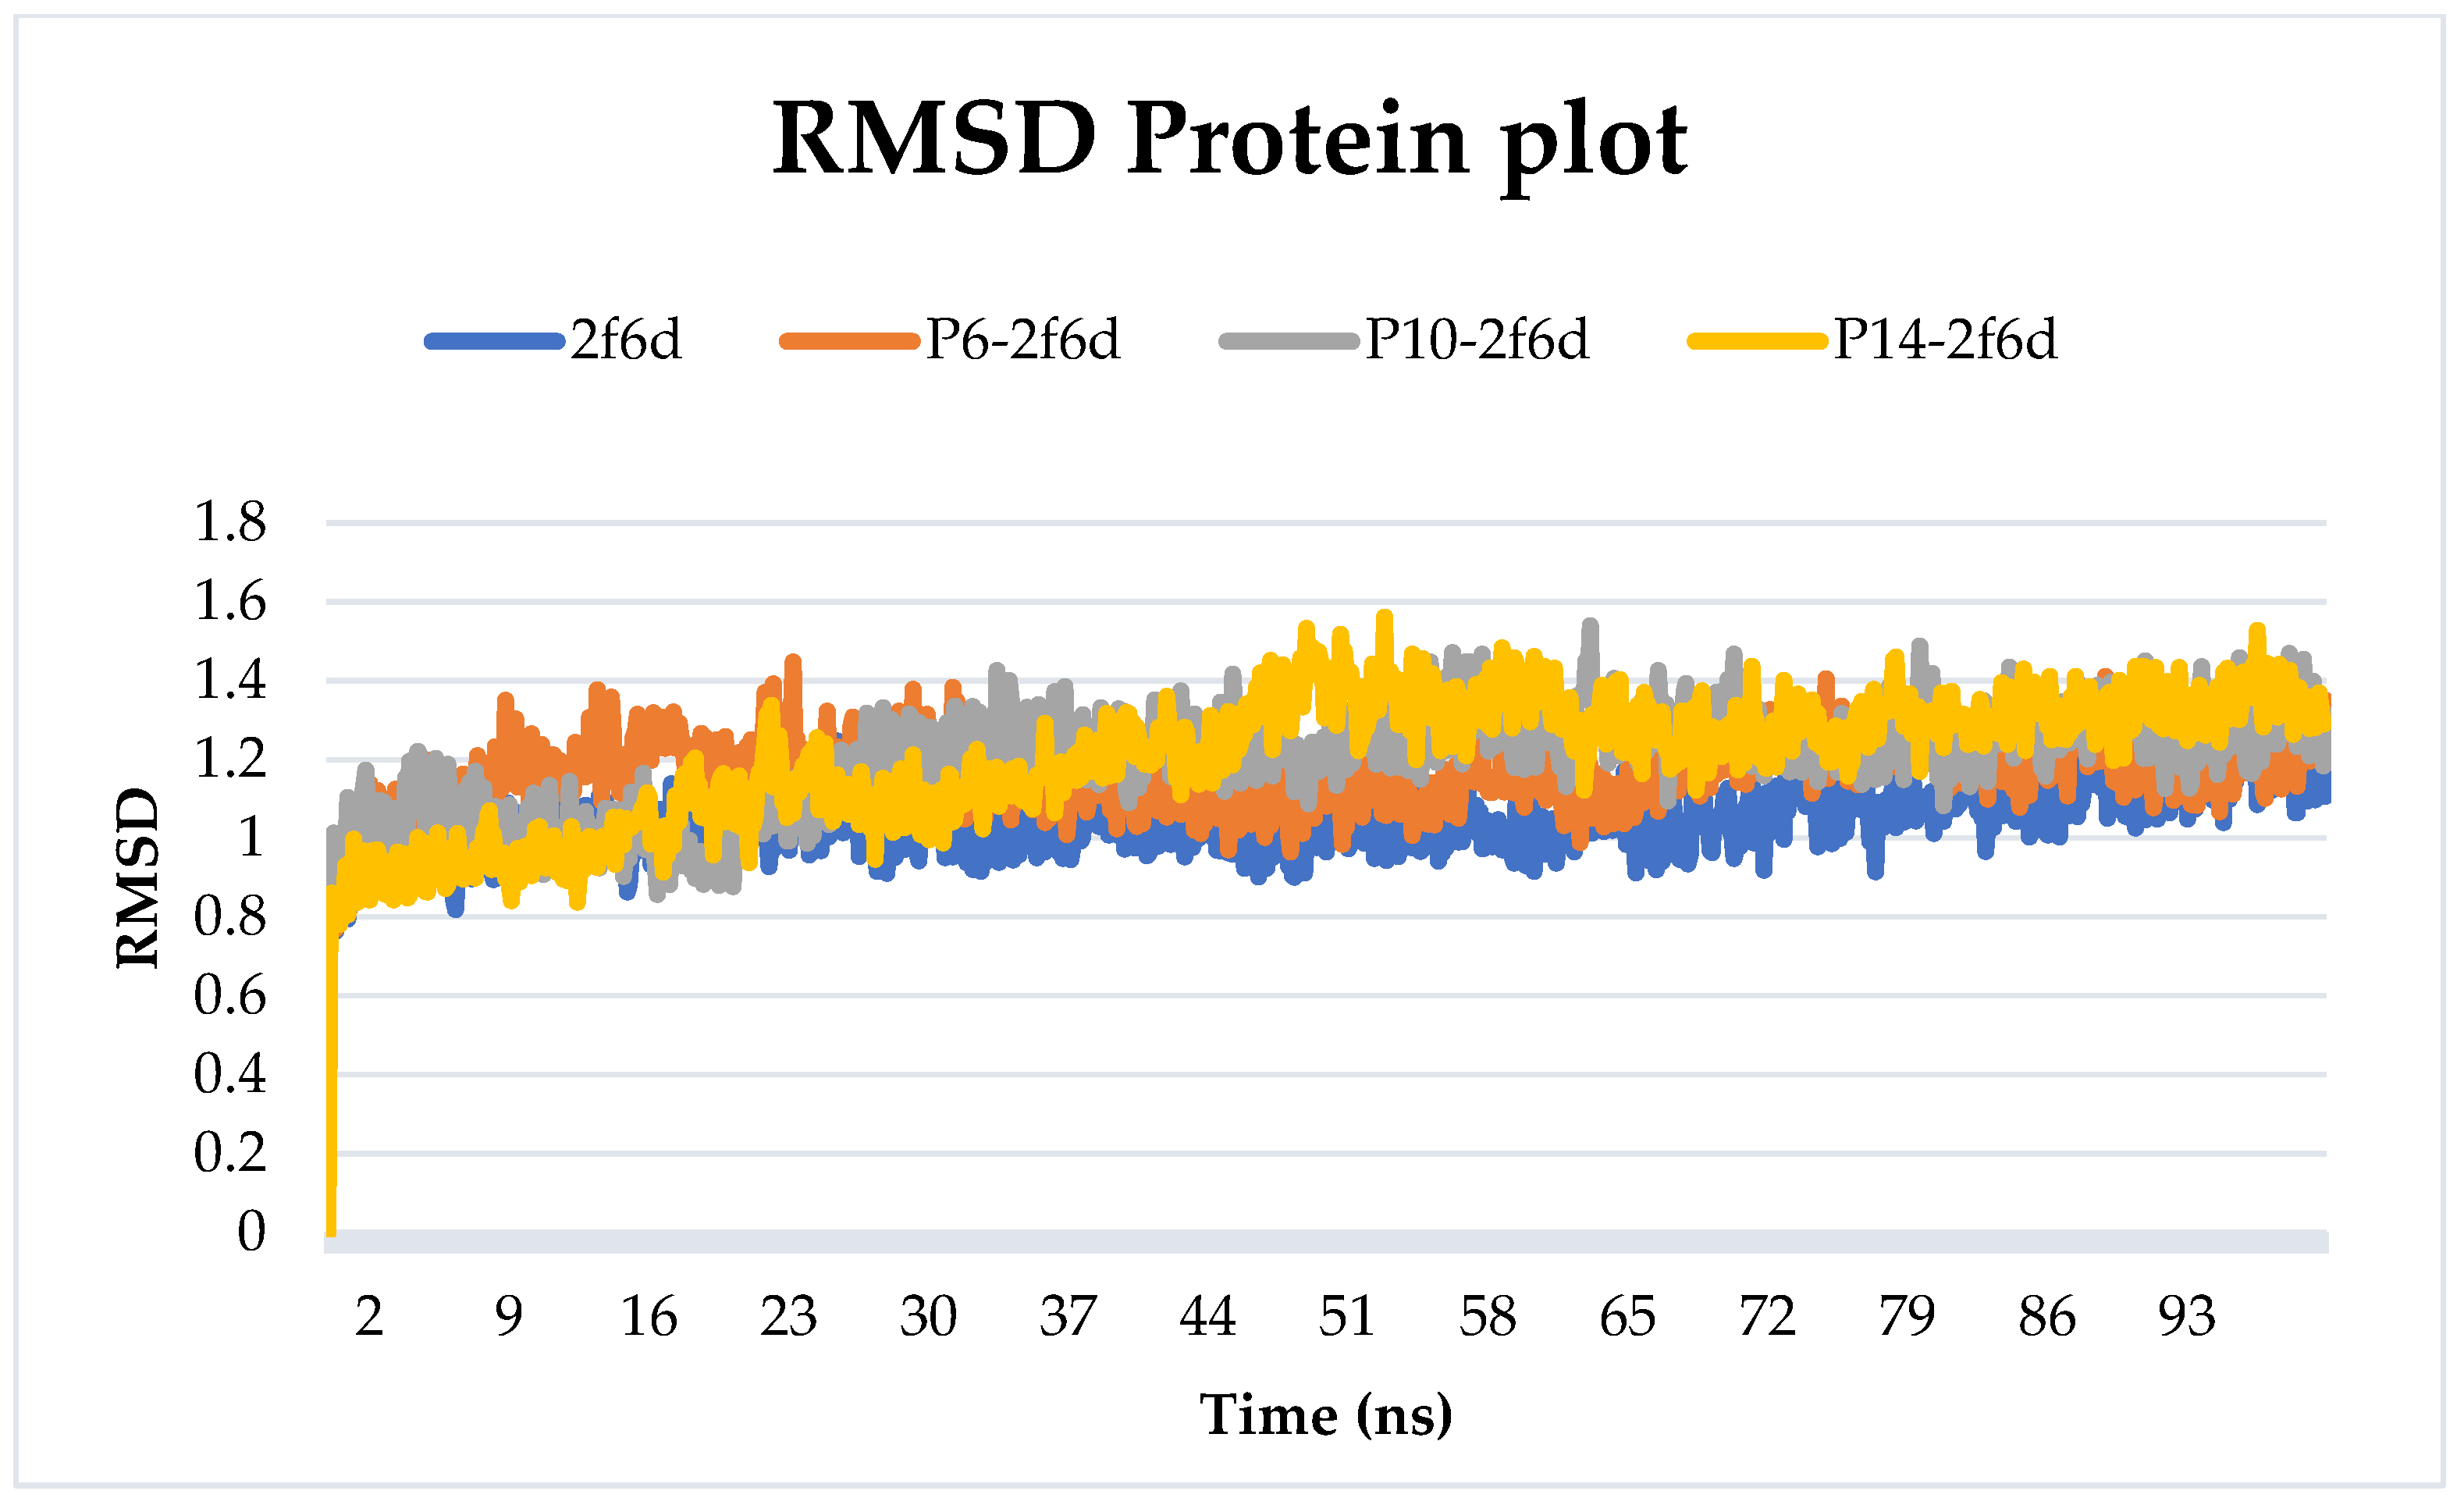
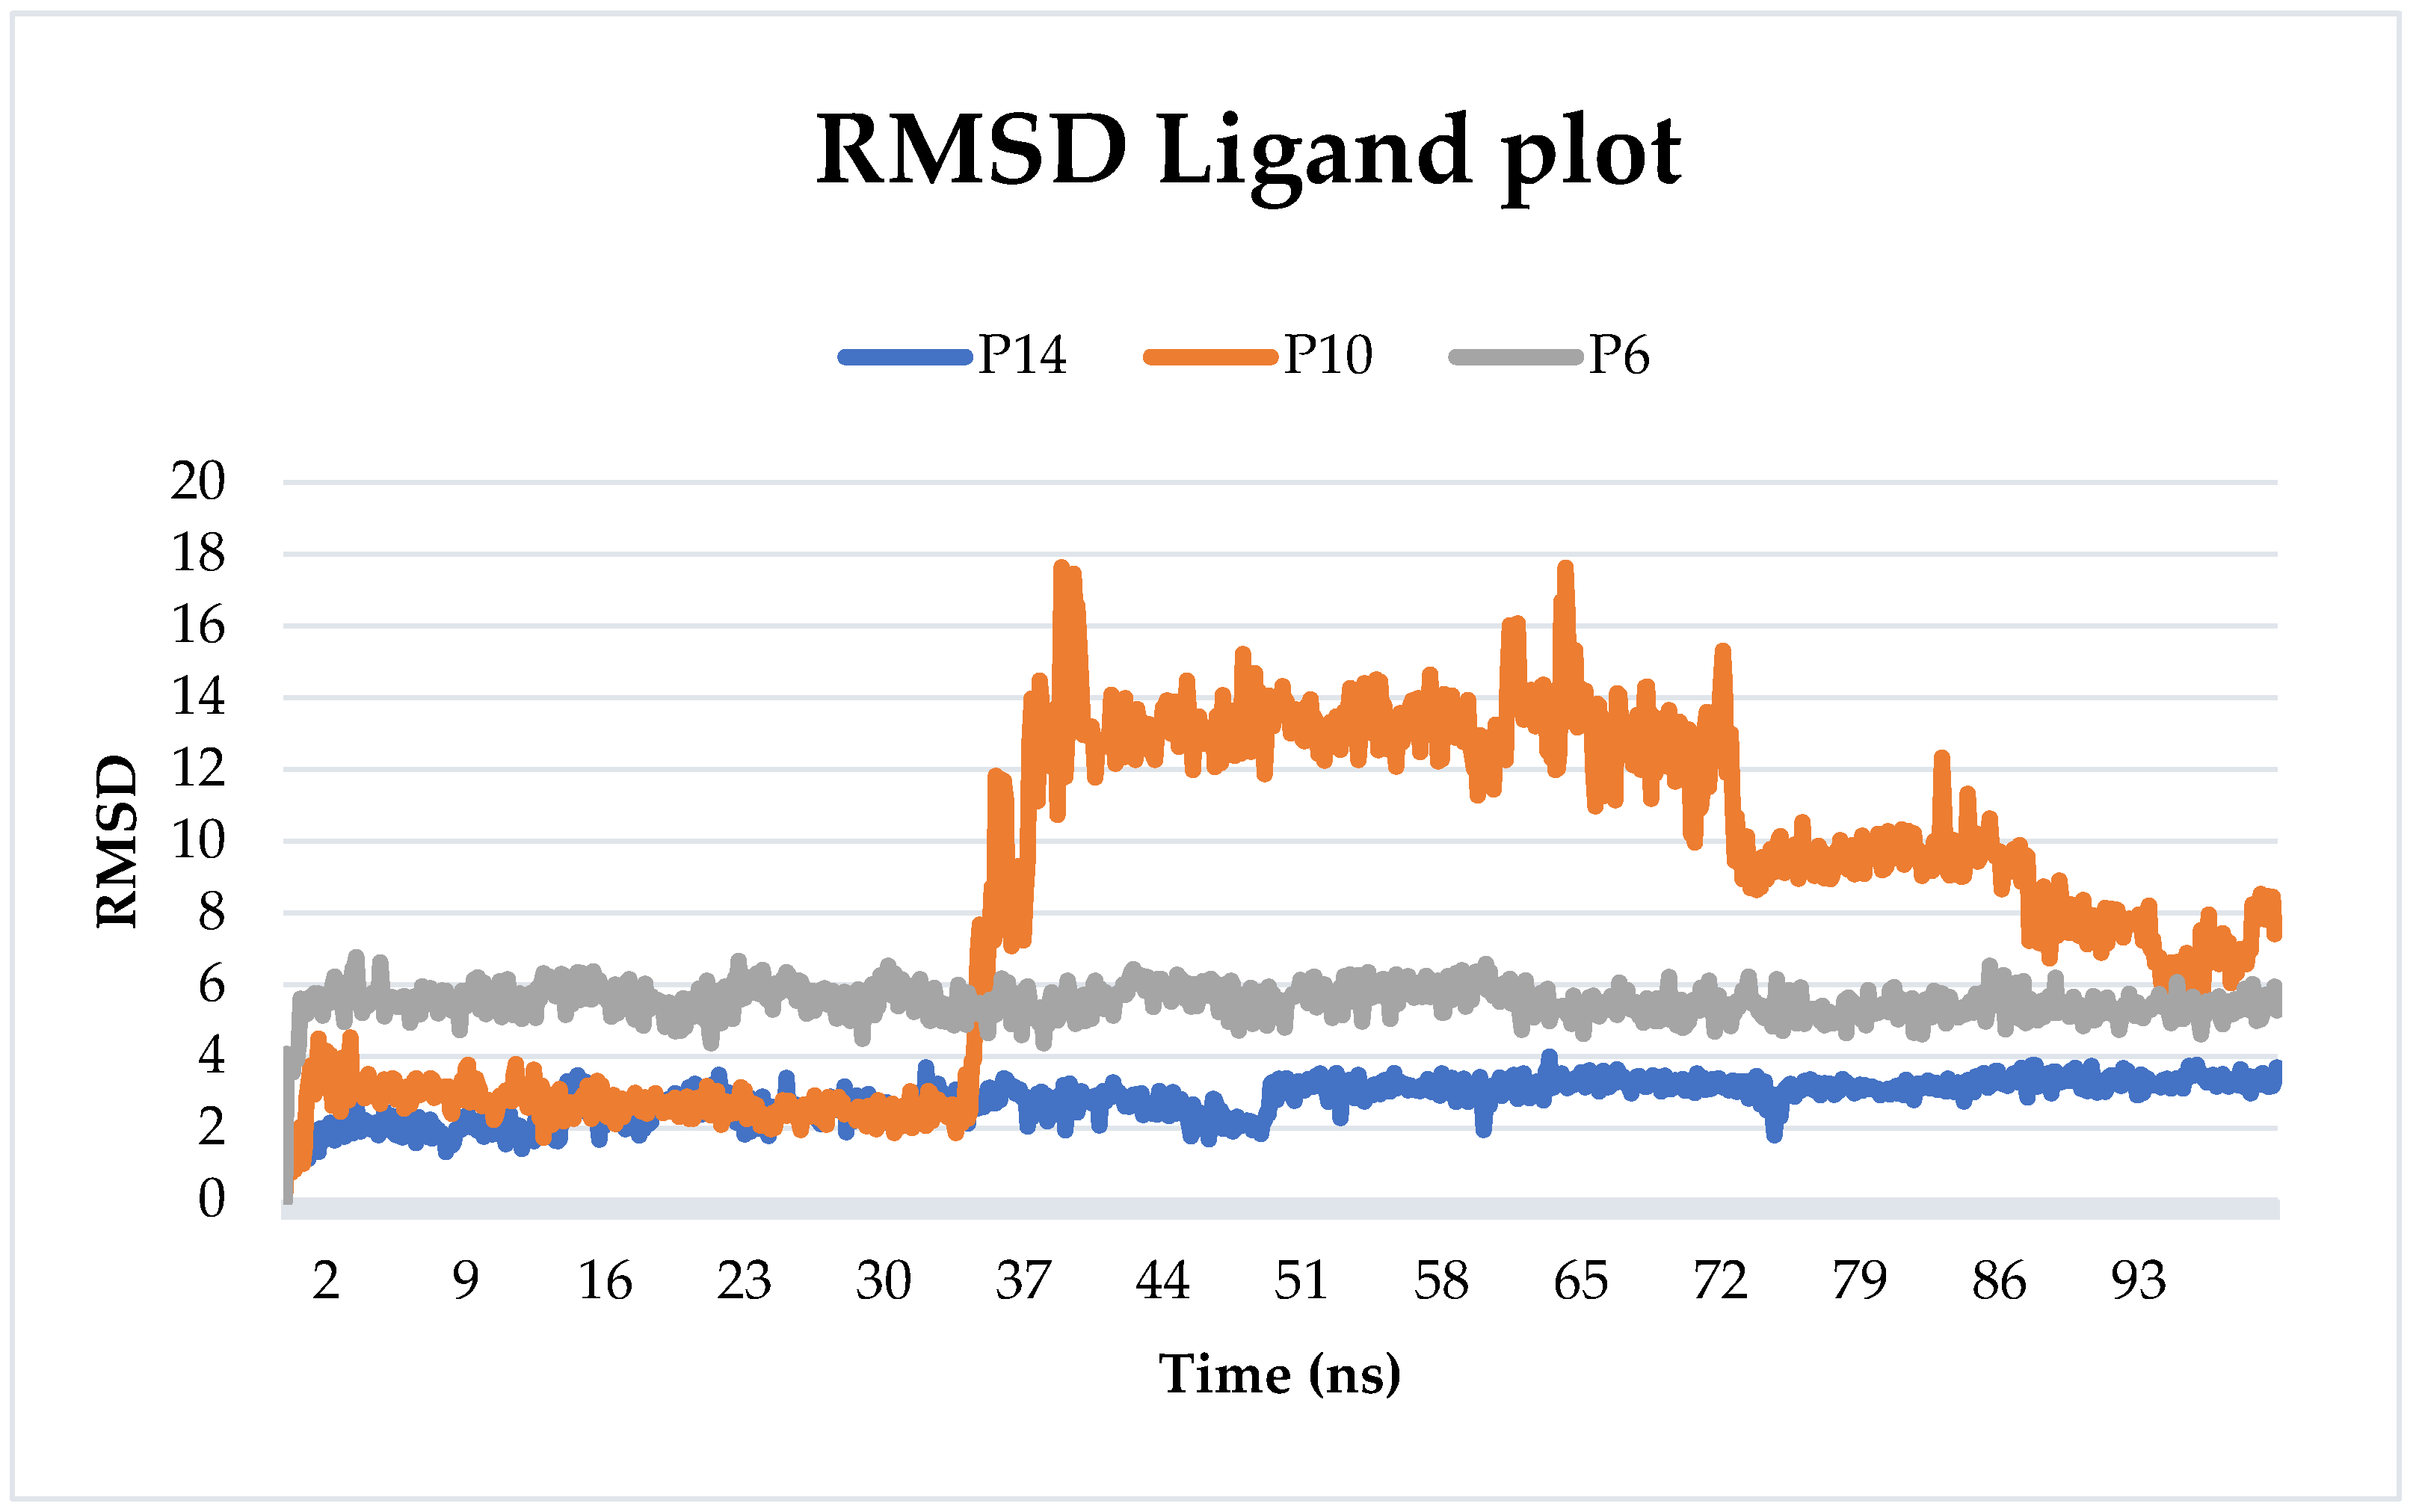
2.6.1. Root-Mean-Squared Deviation
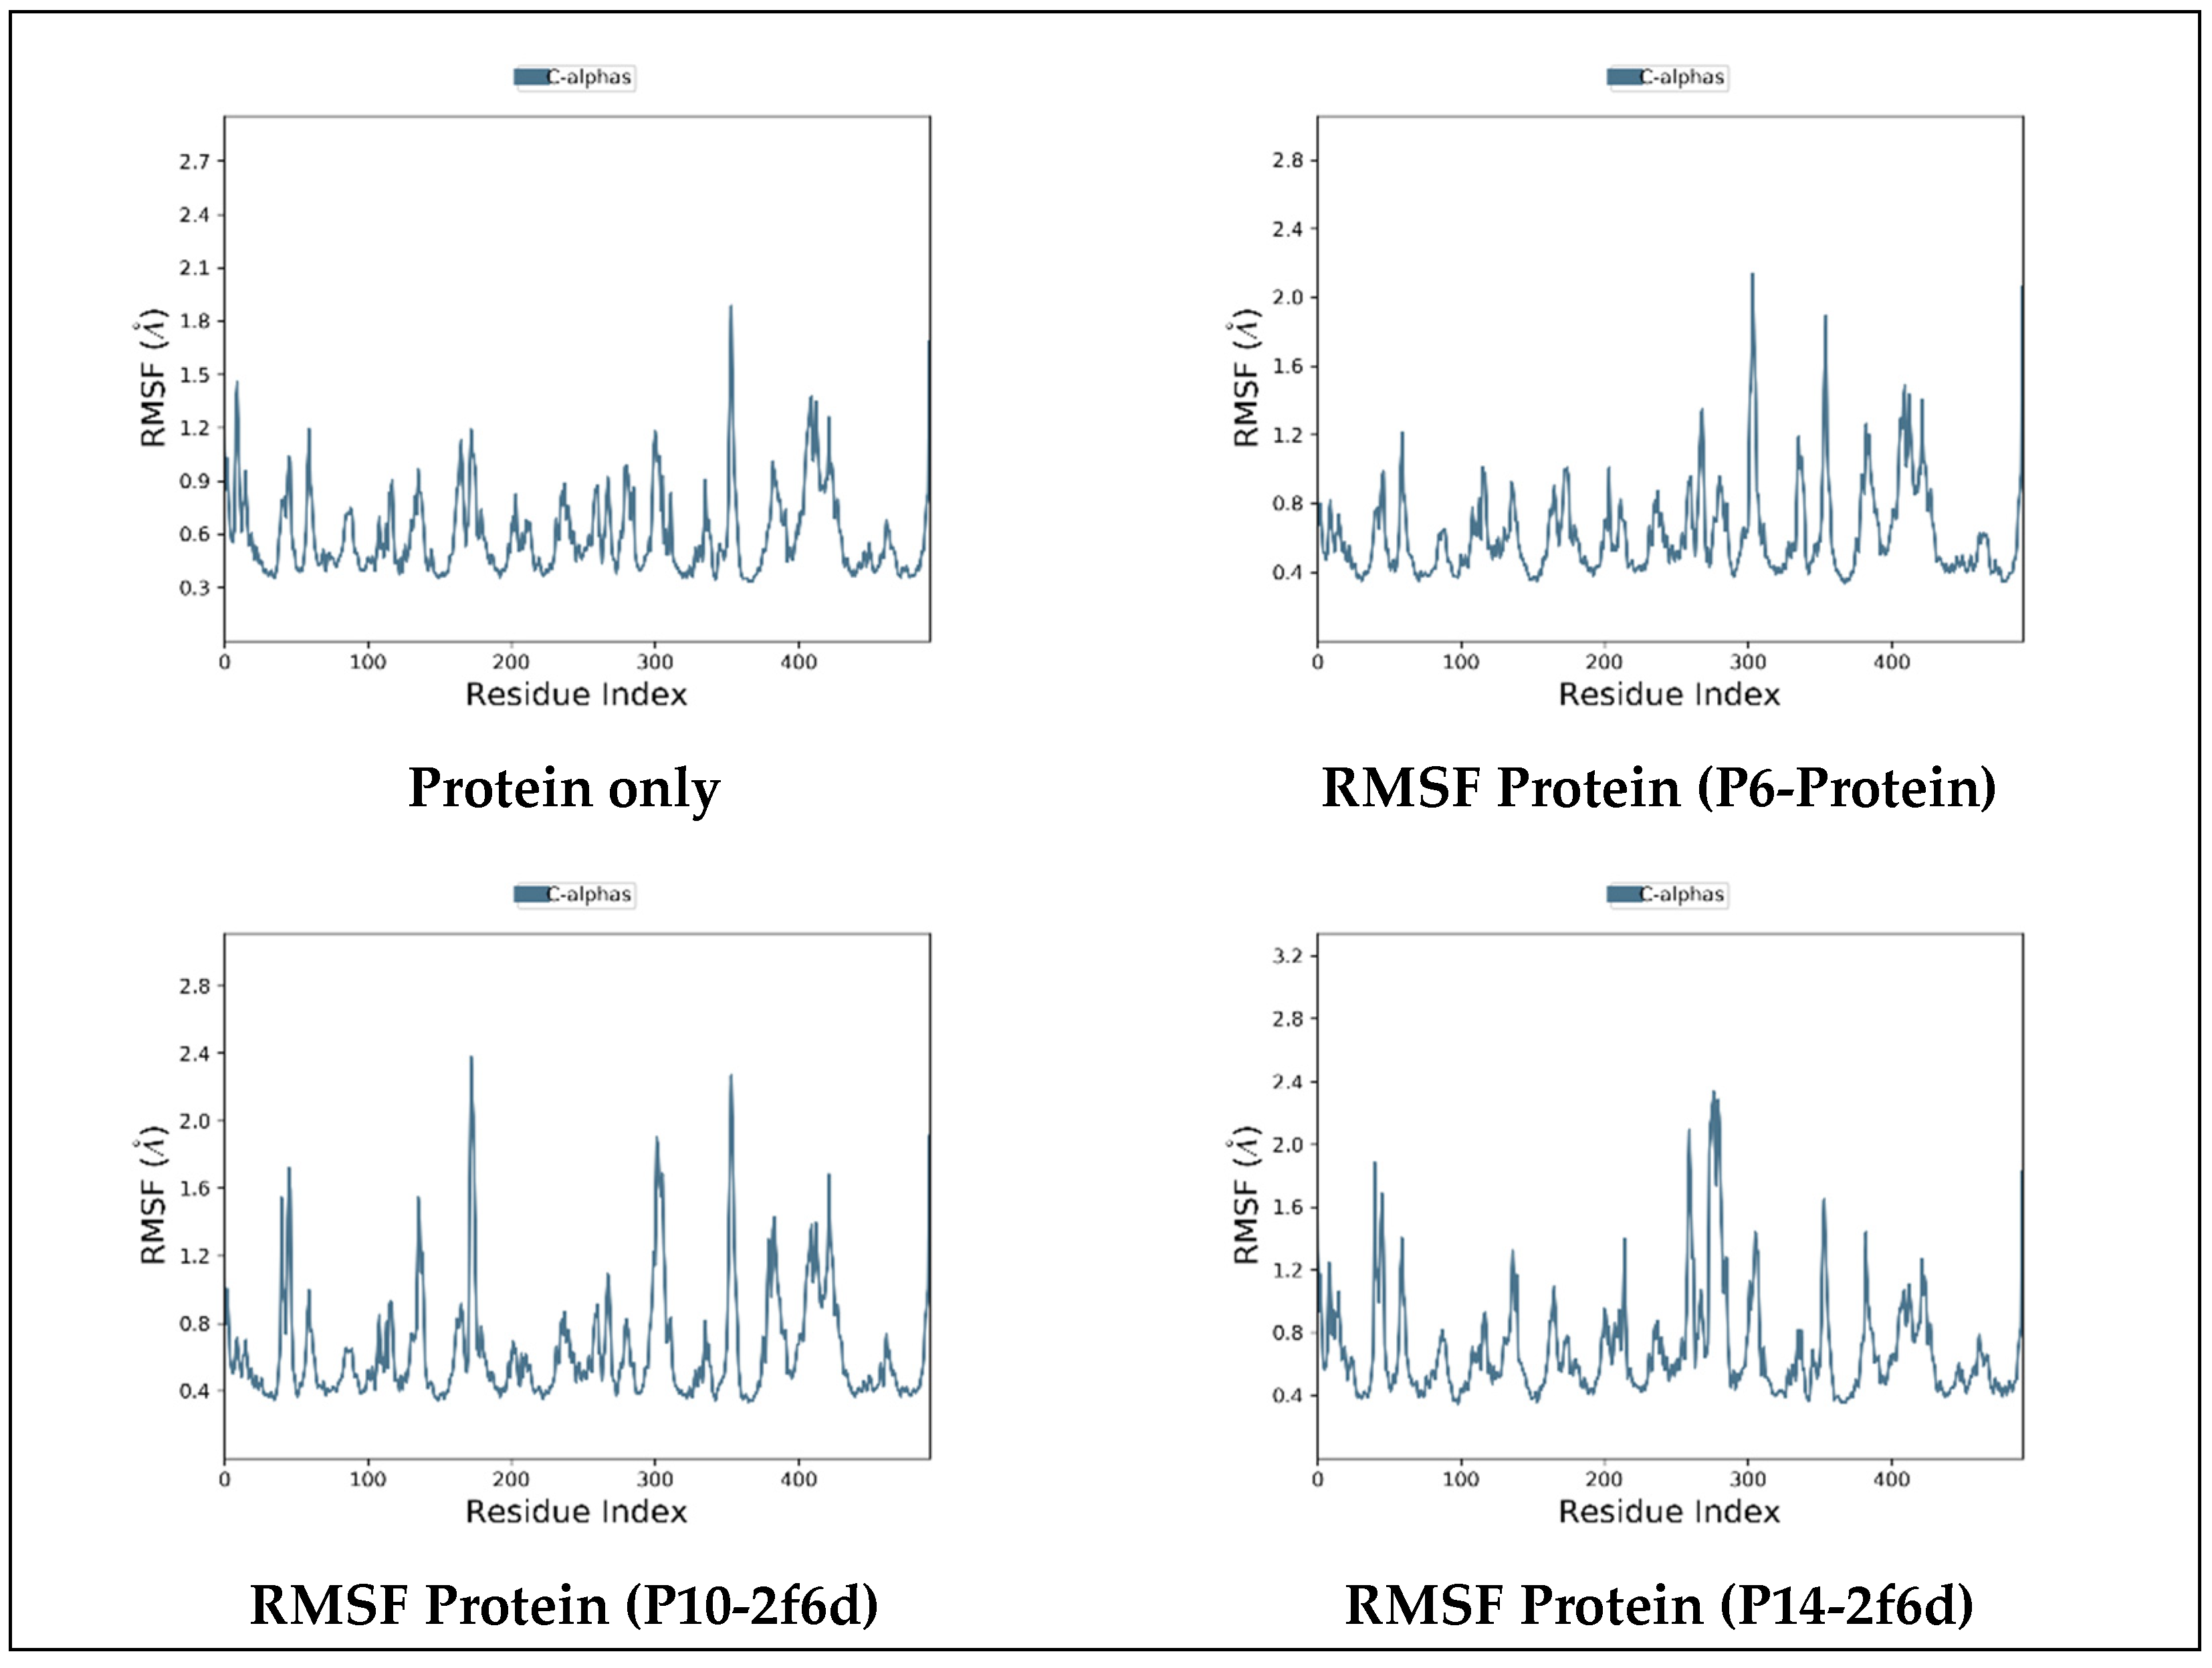
2.6.2. Root-Mean-Squared Fluctuation
2.6.3. Protein–Ligand Contact
2.6.4. Binding Free Energy
3. Material and Methods
3.1. Molecular Descriptor Computation and Pruning
3.2. QSAR Model Construction and Validation
3.3. Molecular Docking
3.4. ADMET Analysis
3.5. Molecular Dynamics (MD) Simulation
4. Conclusions
Author Contributions
Funding
Institutional Review Board Statement
Informed Consent Statement
Data Availability Statement
Acknowledgments
Conflicts of Interest
References
- Sarwar, N.; Gao, P.; Seshasai, S.R.; Gobin, R.; Kaptoge, S.; Di Angelan-tonio, E.; Ingelsson, E.; Lawlor, D.A.; Selvin, E.; Stampfer, M. Emerging risk factors collaboration diabetes mellitus, fasting blood glucose concentration, and risk of vascular disease: A collaborative meta-analysis of 102 prospective studies. Lancet 2010, 375, 2215–2222. [Google Scholar]
- Abchir, O.; Daoui, O.; Nour, H.; Yamari, I.; Elkhattabi, S.; Errougui, A.; Chtita, S. Exploration of cannabis constituents as potential candidates against diabetes mellitus disease using molecular docking, dynamics simulations and Admet investigations. Sci. Afr. 2023, 21, e014745. [Google Scholar] [CrossRef]
- International Diabetes Federation. Diabetes Federation. Diabetes around the world in 2021. In IDF Diabetes Atlas; International Diabetes Federation: Brussels, Belgium, 2021. [Google Scholar]
- Fatima, I.; Taha, M.; Wadood, A.; Mohammad, J.I.; Khan, H. 2-Aryl benzimidazoles: Synthesis, in vitro α-amylase inhibitory activity, and molecular docking study. Eur. J. Med. Chem. 2018, 150, 248–260. [Google Scholar]
- Tanaka, M.; Akiyama, Y.; Mori, K.; Hosaka, I.; Kato, K.; Endo, K.; Ogawa, T.; Sato, T.; Suzuki, T.; Yano, T.; et al. Predictive modeling for the development of diabetes mellitus using key factors in various machine learning approaches. Diabetes Epidemiology Manag. 2024, 13, 100191. [Google Scholar] [CrossRef]
- Shadakshari, A.; Kumara, T.S.; Kumar, N.; Chandra, S.J.; Kumar, K.A.; Ramu, R. Synthesis, characterization, and biocomputational assessment of the novel 3-hydroxy-4-(phenyl(pyridin-2-ylamino) methyl)-2-naphthoic acid derivatives as potential dual inhibitors of α-glucosidase and α-amylase enzymes. Results Chem. 2023, 5, 100745. [Google Scholar] [CrossRef]
- Gong, L.; Feng, D.; Wang, T.; Ren, Y.; Liu, Y.; Wang, J. Inhibitors of α-amylase and α-glucosidase: Potential linkage for whole cereal foods on prevention of hyperglycemia. Food Sci. Nutr. 2020, 8, 6320–6337. [Google Scholar] [CrossRef] [PubMed]
- Abchir, O.; Nour, H.; Daoui, O.; Yamari, I.; ElKhattabi, S.; El Kouali, M.; Talbi, M.; Errougui, A.; Chtita, S. Structure-based virtual screening, ADMET analysis, and molecular dynamics simulation of Moroccan natural compounds as candidates for the SARS-CoV-2 inhibitors. Nat. Prod. Res. 2023, 2023, 1–8. [Google Scholar] [CrossRef] [PubMed]
- Lee, S.-R.; Choi, J.; Choi, E.-K.; Lee, H.; Han, M.; Ahn, H.-J.; Kwon, S.; Lee, S.-W.; Han, K.-D.; Oh, S.; et al. Early rhythm control on diabetes-related complications and mortality in patients with type 2 diabetes mellitus and atrial fibrillation. Diabetes Res. Clin. Pract. 2023, 206, 1110200. [Google Scholar] [CrossRef]
- Chaidam, S.; Saehlim, N.; Athipornchai, A.; Sirion, U.; Saeeng, R. Synthesis and biological evaluation of 1,6-bis-triazole-2,3,4-tri-O-benzyl-α-d-glucopyranosides as a novel α-glucosidase inhibitor in the treatment of Type 2 diabetes. Bioorganic Med. Chem. Lett. 2021, 50, 128331. [Google Scholar] [CrossRef]
- Dahmani, R.; Manachou, M.; Belaidi, S.; Chtita, S.; Boughdiri, S. Structural characterization and QSAR modeling of 1,2,4-triazole derivatives as α-glucosidase inhibitors. N. J. Chem. 2021, 45, 1253–1261. [Google Scholar] [CrossRef]
- Fallah, Z.; Tajbakhsh, M.; Alikhani, M.; Larijani, B.; Faramarzi, M.A.; Hamedifar, H.; Mohammadi-Khanaposhtani, M.; Mahdavi, M. A review on synthesis, mechanism of action, and structure-activity relationships of 1,2,3-triazole-based α-glucosidase inhibitors as promising anti-diabetic agents. J. Mol. Struct. 2022, 1255, 132469. [Google Scholar] [CrossRef]
- Matin, M.M.; Matin, P.; Rahman, R.; Ben Hadda, T.; Almalki, F.A.; Mahmud, S.; Ghoneim, M.M.; Alruwaily, M.; Alshehri, S. Triazoles and Their Derivatives: Chemistry, Synthesis, and Therapeutic Applications. Front. Mol. Biosci. 2022, 9, 864286. [Google Scholar] [CrossRef]
- Yeye, E.O.; Khan, K.M.; Chigurupati, S.; Wadood, A.; Rehman, A.U.; Perveen, S.; Maharajan, M.K.; Shamim, S.; Hameed, S.; Aboaba, S.A.; et al. Syntheses, in vitro α-amylase and α-glucosidase dual inhibitory activities of 4-amino-1,2,4-triazole derivatives their molecular docking and kinetic studies. Bioorganic Med. Chem. 2020, 28, 115467. [Google Scholar] [CrossRef]
- Sharma, P.; Thakur, A.; Goyal, A.; Grewal, A.S. Molecular docking, 2D-QSAR and ADMET studies of 4-sulfonyl-2-pyridone heterocycle as a potential glucokinase activator. Results Chem. 2023, 6, 101105. [Google Scholar] [CrossRef]
- Mitra, S.; Chatterjee, S.; Bose, S.; Panda, P.; Basak, S.; Ghosh, N.; Mandal, S.C.; Singhmura, S.; Halder, A.K. Finding structural requirements of structurally diverse α-glucosidase and α-amylase inhibitors through validated and predictive 2D-QSAR and 3D-QSAR analyses. J. Mol. Graph. Model. 2024, 126, 108640. [Google Scholar] [CrossRef] [PubMed]
- Adeniji, S.E.; Uba, S.; Uzairu, A. Theoretical modeling and molecular docking simulation for investigating and evaluating some active compounds as potent anti-tubercular agents against MTB CYP121 receptor. Futur. J. Pharm. Sci. 2018, 4, 284–295. [Google Scholar] [CrossRef]
- Huang, X.; Ma, S.; Wu, Y.; Wan, C.; Zhao, C.; Wang, H.; Ju, S. High-Throughput Screening of Amorphous Polymers with High Intrinsic Thermal Conductivity via Automated Physical Feature Engineering. J. Mater. Chem. A 2023, 11, 20539–20548. [Google Scholar] [CrossRef]
- Mouhsin, M.; Abchir, O.; El Otmani, F.S.; Oumghar, A.A.; Oubenali, M.; Chtita, S.; Mbarki, M.; Gamouh, A. Identification of novel NLRP3 inhibitors: A comprehensive approach using 2D-QSAR, molecular docking, molecular dynamics simulation and drug-likeness evaluation. Chem. Pap. 2023, 78, 1193–1204. [Google Scholar] [CrossRef]
- Yang, L.; Wang, Y.; Hao, W.; Chang, J.; Pan, Y.; Li, J.; Wang, H. Modeling pesticides toxicity to Sheepshead minnow using QSAR. Ecotoxicol. Environ. Saf. 2020, 193, 110352. [Google Scholar] [CrossRef] [PubMed]
- Papa, E.; Sangion, A.; Arnot, J.A.; Gramatica, P. Development of human biotransformation QSARs and application for PBT assessment refinement. Food Chem. Toxicol. 2018, 112, 535–543. [Google Scholar] [CrossRef] [PubMed]
- ChemOffice. PerkinElmer Informatics. 2016. Available online: http://www.cambridgesoft.com (accessed on 10 December 2023).
- PaDEL-Descriptor Yap. An open source software to calculate molecular descriptors and fingerprints. J. Comput. Chem. 2011, 32, 1466–1474. [Google Scholar] [CrossRef]
- Gramatica, P.; Chirico, N.; Papa, E.; Cassani, S.; Kovarich, S. QSARINS: A new software for the development, analysis, and validation of QSAR MLR models. J. Comput. Chem. 2013, 34, 2121–2132. [Google Scholar] [CrossRef]
- Mauri, A.; Consonni, V.; Todeschini, R. Molecular descriptors. In Handbook of Computational Chemistry; Springer: Cham, Switzerland, 2017; pp. 2065–2093. [Google Scholar] [CrossRef]
- Gramatica, P.; Cassani, S.; Roy, P.P.; Kovarich, S.; Yap, C.W.; Papa, E. QSAR Modeling is not “Push a Button and Find a Correlation”: A Case Study of Toxicity of (Benzo-)triazoles on Algae. Mol. Inform. 2012, 31, 817–835. [Google Scholar] [CrossRef] [PubMed]
- Nour, H.; Abchir, O.; Belaidi, S.; Qais, F.A.; Chtita, S.; Belaaouad, S. 2D-QSAR and molecular docking studies of carbamate derivatives to discover novel potent anti-butyrylcholinesterase agents for Alzheimer’s disease treatment. Bull. Korean Chem. Soc. 2021, 43, 277–292. [Google Scholar] [CrossRef]
- Nour, H.; Abchir, O.; Belaidi, S.; Chtita, S. Research of new acetylcholinesterase inhibitors based on QSAR and molecular docking studies of benzene-based carbamate derivatives. Struct. Chem. 2022, 33, 1935–1946. [Google Scholar] [CrossRef]
- Chirico, N.; Gramatica, P. Real External Predictivity of QSAR Models. Part 2. New Intercomparable Thresholds for Different Validation Criteria and the Need for Scatter Plot Inspection. J. Chem. Inf. Model. 2012, 52, 2044–2058. [Google Scholar] [CrossRef]
- Bennani, F.E.; Doudach, L.; Karrouchi, K.; El Rhayam, Y.; Rudd, C.E.; Ansar, M.; Faouzi, M.E.A. 2D-QSAR study and design of novel pyrazole derivatives as an anticancer lead compound against A-549, MCF-7, HeLa, HepG-2, PaCa-2, DLD-1. Comput. Toxicol. 2023, 26, 100265. [Google Scholar] [CrossRef]
- Sun, G.; Zhang, Y.; Pei, L.; Lou, Y.; Mu, Y.; Yun, J.; Li, F.; Wang, Y.; Hao, Z.; Xi, S.; et al. Chemometric QSAR modeling of acute oral toxicity of Polycyclic Aromatic Hydrocarbons (PAHs) to rat using simple 2D descriptors and interspecies toxicity modeling with mouse. Ecotoxicol. Environ. Saf. 2021, 222, 112525. [Google Scholar] [CrossRef]
- Gramatica, P.; Sangion, A. A Historical Excursus on the Statistical Validation Parameters for QSAR Models: A Clarification Concerning Metrics and Terminology. J. Chem. Inf. Model. 2016, 56, 1127–1131. [Google Scholar] [CrossRef] [PubMed]
- Nath, A.; Ojha, P.K.; Roy, K. Computational modeling of aquatic toxicity of polychlorinated naphthalenes (PCNs) employing 2D-QSAR and chemical read-across. Aquat. Toxicol. 2023, 257, 106429. [Google Scholar] [CrossRef]
- Gramatica, P. Principles of QSAR models validation: Internal and external. QSAR Comb. Sci. 2007, 26, 694–701. [Google Scholar] [CrossRef]
- Khedraoui, M.; Nour, H.; Yamari, I.; Abchir, O.; Errougui, A.; Chtita, S. Design of a new potent Alzheimer’s disease inhibitor based on QSAR, molecular docking and molecular dynamics investigations. Chem. Phys. Impact 2023, 7, 100361. [Google Scholar] [CrossRef]
- Eriksson, L.; Jaworska, J.; Worth, A.P.; Cronin, M.T.; McDowell, R.M.; Gramatica, P. Methods for reliability and uncertainty assessment and for applicability evaluations of classification-and regression-based QSARs. Environ. Health Perspect. 2003, 111, 1361–1375. [Google Scholar] [CrossRef] [PubMed]
- Netzeva, T.I.; Worth, A.P.; Aldenberg, T.; Benigni, R.; Cronin, M.T.; Gramatica, P.; Jaworska, J.S.; Kahn, S.; Klopman, G.; Marchant, C.A. Current status of methods for defining the applicability domain of (quantitative) structure-activity relationships: The report and recommendations of ECVAM workshop 52. Altern. Lab. Anim. 2005, 33, 155–173. [Google Scholar] [CrossRef] [PubMed]
- Yamari, I.; Abchir, O.; Siddique, F.; Zaki, H.; Errougui, A.; Talbi, M.; Bouachrine, M.; ElKouali, M.; Chtita, S. The anticoagulant potential of Lippia Alba extract in inhibiting SARS-CoV-2 Mpro: Density functional calculation, molecular docking analysis, and molecular dynamics simulations. Sci. Afr. 2024, 23, e01986. [Google Scholar] [CrossRef]
- Ševčík, J.; Hostinová, E.; Solovicová, A.; Gašperík, J.; Dauter, Z.; Wilson, K.S. Structure of the complex of a yeast glucoamylase with acarbose reveals the presence of a raw starch binding site on the catalytic domain. FEBS J. 2006, 273, 2161–2171. [Google Scholar] [CrossRef]
- Guex, N.; Peitsch, M.C. SWISS-MODEL and the Swiss-Pdb Viewer: An environment for comparative protein modeling. Electrophoresis 1997, 18, 2714–2723. [Google Scholar] [CrossRef]
- Trott, O.; Olson, A. Software news and update AutoDock Vina: Improving the speed and accuracy of docking with a new scoring function, efficient optimization, and multithreading. J. Comput. Chem. 2009, 31, 455–461. [Google Scholar] [CrossRef]
- Diniyah, N.; Alam, B.; Javed, A.; Alshammari, F.H.; Choi, H.-J.; Lee, S.-H. In silico and docking studies on the binding activities of Keap1 of antioxidant compounds in non-oilseed legumes. Arab. J. Chem. 2023, 16, 104414. [Google Scholar] [CrossRef]
- Elangovan, N.; Sowrirajan, S.; Arumugam, N.; Almansour, A.I.; Mahalingam, S.M.; Kanchana, S. Synthesis, solvent role (water and DMSO), antimicrobial activity, reactivity analysis, inter and intramolecular charge transfer, topology, and molecular docking studies on adenine derivative. J. Mol. Liq. 2023, 391, 123250. [Google Scholar] [CrossRef]
- Hanwell, M.D.; Curtis, D.E.; Lonie, D.C.; Vandermeersch, T.; Zurek, E.; Hutchison, G.R. Avogadro: An advanced semantic chemical editor, visualization, and analysis platform. J. Cheminform. 2012, 4, 17. [Google Scholar] [CrossRef]
- Liu, X.; Zang, X.; Yin, X.; Yang, W.; Huang, J.; Huang, J.; Yu, C.; Ke, C.; Hong, Y. Semi-synthesis of C28-modified triterpene acid derivatives from maslinic acid or corosolic acid as potential α-glucosidase inhibitors. Bioorganic Chem. 2020, 97, 103694. [Google Scholar] [CrossRef]
- Morris, G.M.; Huey, R.; Lindstrom, W.; Sanner, M.F.; Belew, R.K.; Goodsell, D.S.; Olson, A.J. AutoDock4 and AutoDockTools4: Automated docking with selective receptor flexibility. J. Comput. Chem. 2009, 30, 2785–2791. [Google Scholar] [CrossRef]
- Yusuf, T.L.; Waziri, I.; Olofinsan, K.A.; Akintemi, E.O.; Hosten, E.C.; Muller, A.J. Evaluating the in vitro antidiabetic, antibacterial and antioxidant properties of copper(II) Schiff base complexes: An experimental and computational studies. J. Mol. Liq. 2023, 389, 122845. [Google Scholar] [CrossRef]
- Shukla, R.; Munjal, N.S.; Singh, T.R. Identification of novel small molecules against GSK3β for Alzheimer’s disease using chemoinformatics approach. J. Mol. Graph. Model. 2019, 91, 91–104. [Google Scholar] [CrossRef] [PubMed]
- Yamari, I.; Abchir, O.; Nour, H.; El Kouali, M.; Chtita, S. Identification of new dihydrophenanthrene derivatives as promising anti-SARS-CoV-2 drugs through in silico investigations. Main Group Chem. 2023, 22, 469–484. [Google Scholar] [CrossRef]
- Duchowicz, P.R.; Talevi, A.; Bellera, C.; Bruno-Blanch, L.E.; Castro, E.A. Application of descriptors based on Lipinski’s rules in the QSPR study of aqueous solubilities. Bioorganic Med. Chem. 2007, 15, 3711–3719. [Google Scholar] [CrossRef] [PubMed]
- Chagas, C.M.; Moss, S.; Alisaraie, L. Drug metabolites and their effects on the development of adverse reactions: Revisiting Lipinski’s Rule of Five. Int. J. Pharm. 2018, 549, 133–149. [Google Scholar] [CrossRef] [PubMed]
- Lambring, C.B.; Fiadjoe, H.; Behera, S.K.; Basha, R. Docking and molecular dynamic simulations of Mithramycin-A and Tolfenamic acid against Sp1 and survivin. Process. Biochem. 2024, 137, 207–216. [Google Scholar] [CrossRef]
- Basnet, S.; Ghimire, M.P.; Lamichhane, T.R.; Adhikari, R.; Adhikari, A. Identification of potential human pancreatic α-amylase inhibitors from natural products by molecular docking, MM/GBSA calculations, MD simulations, and ADMET analysis. PLoS ONE 2023, 18, e0275765. [Google Scholar] [CrossRef] [PubMed]
- Roos, K.; Wu, C.; Damm, W.; Reboul, M.; Stevenson, J.M.; Lu, C.; Dahlgren, M.K.; Mondal, S.; Chen, W.; Wang, L.; et al. OPLS3e: Extending Force Field Coverage for Drug-Like Small Molecules. J. Chem. Theory Comput. 2019, 15, 1863–1874. [Google Scholar] [CrossRef] [PubMed]
- Protein Preparation Wizard. Available online: https://www.schrodinger.com/science-articles/protein-preparation-wizard (accessed on 10 March 2023).
- Mark, P.; Nilsson, L. Structure and Dynamics of the TIP3P, SPC, and SPC/E Water Models at 298 K. J. Phys. Chem. A 2001, 105, 9954–9960. [Google Scholar] [CrossRef]
- Uba, A.I.; Chea, J.; Hoag, H.; Hryb, M.; Bui-Linh, C.; Wu, C. Binding of a positive allosteric modulator CDPPB to metabotropic glutamate receptor type 5 (mGluR5) probed by all-atom molecular dynamics simulations. Life Sci. 2022, 309, 121014. [Google Scholar] [CrossRef] [PubMed]
- D.E. Shaw Research. Desmond Molecular Dynamics System, Maestro-Desmond Interoperability Tools; Schrödinger: New York, NY, USA, 2021. [Google Scholar]
- Bhattacharya, P.; Abualnaja, K.M.; Javed, S. Theoretical studies, spectroscopic investigation, molecular docking, molecular dynamics and MMGBSA calculations with 2-hydrazinoquinoline. J. Mol. Struct. 2023, 1274, 134482. [Google Scholar] [CrossRef]


| Model Equation | |||||
|---|---|---|---|---|---|
| pIC50 = 6.403 + 0.759 AATSC8s + 0.022 VE3_Dzs − 0.112 nHsOH − 0.338 CIC1 − 1.804 RotBFrac | |||||
| Set | 33 | Training set | 27 | Test set | 6 |
| Fitting criteria | Internal validation criteria | External validation criteria | |||
| R2 | 0.767 | Q2LOO | 0.649 | R2ext | 0.633 |
| R2adj | 0.712 | Random Models Parameters | |||
| R2-R2adj | 0.055 | Average R | Average R2 | Average Q2 | cRp2 |
| RMSE | 0.082 | 0.428 | 0.196 | −0.342 | 0.669 |
| Descriptor Symbol | Name of Descriptor | References |
|---|---|---|
| AATSC8s | Averaged and centered Moreau–Broto autocorrelation of lag 8 weighted by intrinsic state | [17] |
| VE3_Dzs | Logarithmic coefficient sum of the last eigenvector from Barysz matrix weighted by Sanderson EN | [18] |
| nHsOH | The count of a specific atom-type Hydrogen (H) E-State associated with hydroxy groups (OH) | [19] |
| CIC1 | 1-ordered complementary information content | [20] |
| RotBFrac | Fraction of rotatable bonds, excluding terminal bonds | [21] |
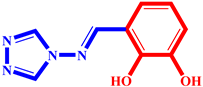
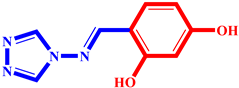
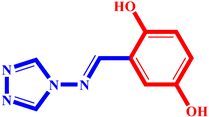
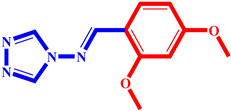
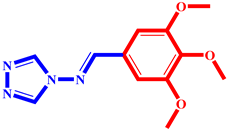
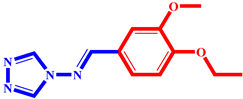
| N | Structure | N | Structure |
|---|---|---|---|
| 3 |  | 10 |  |
| 4 | 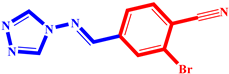 | 14 |  |
| 6 | 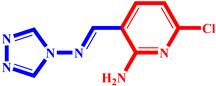 | 19 |  |
| 7 |  | ||
| Name | N° | AATSC8s | VE3_Dzs | nHsOH | CIC1 | RotBFrac | pIC50 | hi |
|---|---|---|---|---|---|---|---|---|
| Synthetized Compounds | 1 * | −0.006 | −3.819 | 1 | 1.439 | 0.133 | 5.582 | h* = 0.667 |
| 2 * | −0.010 | −6.599 | 2 | 1.316 | 0.125 | 5.264 | ||
| 3 | 0.037 | −7.797 | 2 | 1.316 | 0.125 | 5.264 | ||
| 4 | −0.010 | −8.587 | 2 | 1.316 | 0.125 | 5.270 | ||
| 5 | −0.075 | −5.287 | 3 | 1.328 | 0.118 | 5.241 | ||
| 6 | 0.064 | −7.498 | 0 | 1.578 | 0.222 | 5.369 | ||
| 7 * | 0.043 | −6.004 | 0 | 1.578 | 0.222 | 5.367 | ||
| 8 * | 0.184 | −4.740 | 0 | 1.830 | 0.250 | 5.263 | ||
| 9 | 0.131 | −5.434 | 0 | 1.633 | 0.263 | 5.271 | ||
| 10 | 0.122 | −7.007 | 0 | 1.633 | 0.263 | 5.262 | ||
| 11 | −0.174 | −3.355 | 0 | 1.621 | 0.125 | 5.369 | ||
| 12 * | −0.169 | −1.724 | 0 | 1.968 | 0.167 | 5.196 | ||
| 13 | −0.128 | −2.264 | 0 | 1.507 | 0.133 | 5.368 | ||
| 14 | −0.128 | −2.531 | 0 | 1.346 | 0.125 | 5.604 | ||
| 15 | −0.127 | −7.233 | 0 | 1.376 | 0.177 | 5.270 | ||
| 16 | 0.044 | −4.375 | 0 | 1.376 | 0.177 | 5.607 | ||
| 17 | −0.074 | −2.618 | 1 | 2.214 | 0.182 | 5.198 | ||
| 18 * | 0.032 | −7.781 | 1 | 1.193 | 0.176 | 5.276 | ||
| 19 | 0.256 | −4.965 | 1 | 1.396 | 0.211 | 5.485 | ||
| 20 | 0.220 | −5.270 | 0 | 1.349 | 0.211 | 5.599 | ||
| 21 | −0.004 | −2.950 | 1 | 1.103 | 0.125 | 5.625 | ||
| 22 | −0.021 | −6.069 | 1 | 0.937 | 0.167 | 5.599 | ||
| 23 | −0.103 | −3.622 | 0 | 1.161 | 0.176 | 5.461 | ||
| 24 | 0.012 | −5.284 | 0 | 1.161 | 0.176 | 5.633 | ||
| 25 | −0.010 | −6.839 | 0 | 1.161 | 0.176 | 5.644 | ||
| 26 | −0.127 | −9.690 | 0 | 1.055 | 0.167 | 5.359 | ||
| 27 | −0.030 | −6.929 | 1 | 1.011 | 0.167 | 5.636 | ||
| 28 | −0.080 | −4.901 | 0 | 1.069 | 0.133 | 5.613 | ||
| 29 | 0.001 | −3.755 | 0 | 2.216 | 0.217 | 5.264 | ||
| 30 | −0.037 | −3.692 | 0 | 2.094 | 0.240 | 5.184 | ||
| 31 | 0.000 | −4.566 | 0 | 2.641 | 0.083 | 5.267 | ||
| 32 | 0.026 | −4.196 | 0 | 2.720 | 0.074 | 5.201 | ||
| 33 | −0.019 | −7.010 | 0 | 1.664 | 0.111 | 5.680 | ||
| Designed compounds | P3 | −0.106 | −3.082 | 0 | 1.143 | 0.050 | 5.780 | 0.084 |
| P4 | −0.005 | −3.524 | 0 | 1.103 | 0.118 | 5.738 | 0.023 | |
| P6 | −0.084 | −3.328 | 0 | 0.891 | 0.125 | 5.741 | 0.059 | |
| P7 | 0.083 | −4.032 | 0 | 1.036 | 0.150 | 5.758 | 0.055 | |
| P10 | 0.077 | −5.263 | 0 | 0.800 | 0.125 | 5.852 | 0.082 | |
| P14 | 0.113 | −8.222 | 0 | 1.224 | 0.100 | 5.717 | 0.358 | |
| P19 | 0.109 | −3.410 | 0 | 1.318 | 0.125 | 5.741 | 0.081 |
| N | Score Kcal/Mol | Residue | Interaction Type | Distance (Å) |
|---|---|---|---|---|
| P3 | −6.4 | Trp139 | Pi–Pi Stacked | 4.87 |
| Trp139 | Pi–Pi Stacked | 4.19 | ||
| Trp139 | Pi–Alkyl | 5.13 | ||
| Tyr351 | Pi–Alkyl | 5.29 | ||
| HOH1163 | Water Hydrogen Bond | 3.57 | ||
| HOH1189 | Water Hydrogen Bond | 2.92 | ||
| HOH1672 | Water Hydrogen Bond | 3.38 | ||
| HOH1504 | Water Hydrogen Bond | 3.09 | ||
| HOH1672 | Water Hydrogen Bond | 3.45 | ||
| HOH1723 | Water Hydrogen Bond | 3.23 | ||
| P4 | −7 | Trp209 | Carbon–Hydrogen Bond | 3.39 |
| Glu210 | Carbon–Hydrogen Bond | 3.39 | ||
| Glu210 | Pi–Anion | 3.85 | ||
| Trp139 | Pi–Pi Stacked | 3.85 | ||
| Trp139 | Pi–Pi Stacked | 4.36 | ||
| HOH1433 | Water Hydrogen Bond | 4.17 | ||
| P6 | −7.2 | Glu210 | Conventional Hydrogen Bond | 2.62 |
| Glu210 | Conventional Hydrogen Bond | 2.66 | ||
| Trp139 | Carbon–Hydrogen Bond | 3.36 | ||
| Trp209 | Carbon–Hydrogen Bond | 3.38 | ||
| Glu210 | Carbon–Hydrogen Bond | 3.59 | ||
| Glu210 | Pi–Anion | 3.77 | ||
| Trp139 | Pi–Pi Stacked | 4.59 | ||
| Trp139 | Pi–Pi Stacked | 3.97 | ||
| Tyr351 | Pi–Pi Stacked | 4.29 | ||
| Ala138 | Alkyl | 4.1 | ||
| HOH1163 | Water Hydrogen Bond | 4 | ||
| P7 | −7.3 | Trp209 | Carbon–Hydrogen Bond | 3.61 |
| Glu210 | Pi–Anion | 3.69 | ||
| Trp139 | Pi–Pi Stacked | 4.43 | ||
| Trp139 | Pi–Pi Stacked | 3.74 | ||
| Tyr351 | Pi–Pi Stacked | 4.54 | ||
| Trp139 | Pi–Pi Stacked | 4.56 | ||
| HOH1282 | Water Hydrogen Bond | 3.81 | ||
| HOH1672 | Water Hydrogen Bond | 2.88 | ||
| HOH1723 | Water Hydrogen Bond | 3.29 | ||
| HOH1232 | Water Hydrogen Bond | 3.17 | ||
| HOH1280 | Water Hydrogen Bond | 3.67 | ||
| P10 | −7.1 | Arg69 | Conventional Hydrogen Bond | 2.52 |
| Trp209 | Conventional Hydrogen Bond | 2.17 | ||
| Glu211 | Conventional Hydrogen Bond | 2.68 | ||
| Glu211 | Conventional Hydrogen Bond | 2.38 | ||
| Glu210 | Carbon–Hydrogen Bond | 3.26 | ||
| Tyr351 | Pi–Pi Stacked | 4.04 | ||
| HOH1464 | Water Hydrogen Bond | 2.93 | ||
| HOH1672 | Water Hydrogen Bond | 3.48 | ||
| HOH1723 | Water Hydrogen Bond | 3.18 | ||
| HOH1189 | Water Hydrogen Bond | 3.24 | ||
| HOH1282 | Water Hydrogen Bond | 3.39 | ||
| P14 | −7.3 | Arg345 | Conventional Hydrogen Bond | 2.71 |
| Glu210 | Conventional Hydrogen Bond | 2.93 | ||
| Trp209 | Carbon–Hydrogen Bond | 3.08 | ||
| Arg345 | Pi–Cation | 3.42 | ||
| Tyr351 | Pi–Sigma | 3.79 | ||
| Trp139 | Pi–Pi Stacked | 5.27 | ||
| Trp139 | Pi–Pi Stacked | 4.73 | ||
| Trp139 | Pi–Pi Stacked | 3.97 | ||
| Trp139 | Pi–Pi Stacked | 4.45 | ||
| P19 | −7.2 | Arg69 | Pi–Cation | 3.66 |
| Tyr351 | Pi–Pi Stacked | 3.89 | ||
| HOH1723 | Water Hydrogen Bond | 2.67 | ||
| HOH1464 | Water Hydrogen Bond | 1.83 | ||
| Acarbose | −12.3 | Arg69 | Conventional Hydrogen Bond | 2.25 |
| Glu211 | Conventional Hydrogen Bond | 2.21 | ||
| Glu210 | Conventional Hydrogen Bond | 2.14 | ||
| Leu208 | Conventional Hydrogen Bond | 1.9 | ||
| Asp70 | Conventional Hydrogen Bond | 1.84 | ||
| Trp209 | Carbon–Hydrogen Bond | 3.52 | ||
| Ala138 | Carbon–Hydrogen Bond | 3.79 | ||
| Tyr351 | Pi–Sigma | 3.54 | ||
| HOH1449 | Water Hydrogen Bond | 2.72 | ||
| HOH1504 | Water Hydrogen Bond | 2.91 | ||
| HOH1778 | Water Hydrogen Bond | 3.03 | ||
| HOH1797 | Water Hydrogen Bond | 1.8 | ||
| HOH1663 | Water Hydrogen Bond | 2.73 | ||
| HOH1663 | Water Hydrogen Bond | 1.99 | ||
| HOH1232 | Water Hydrogen Bond | 2 | ||
| HOH1282 | Water Hydrogen Bond | 2.32 | ||
| HOH1095 | Water Hydrogen Bond | 3.01 |
| Compounds | P3 | P4 | P6 | P7 | P10 | P14 | P19 |
|---|---|---|---|---|---|---|---|
| MOL_WEIGHT | 257.322 | 276.097 | 222.639 | 242.242 | 206.184 | 259.7 | 201.233 |
| LOGP | 1.4225 | 1.79448 | 0.7909 | 1.0452 | 0.2766 | 2.6851 | 1.1326 |
| ROTATABLE_BONDS | 1 | 2 | 2 | 3 | 2 | 2 | 2 |
| ACCEPTORS | 6 | 5 | 6 | 6 | 6 | 4 | 5 |
| DONORS | 1 | 0 | 1 | 1 | 1 | 1 | 1 |
| SURFACE_AREA | 108.812 | 100.171 | 90.409 | 102.135 | 84.271 | 108.105 | 87.251 |
| Water solubility | −3.072 | −3.119 | −2.684 | −2.956 | −2.446 | −3.667 | −1.893 |
| Caco2 permeability | 1.292 | 1.011 | 1.294 | 1.322 | 0.74 | 1.336 | 0.728 |
| Intestinal absorption (human) | 98.134 | 97.517 | 84.358 | 77.072 | 85.844 | 93.42 | 72.544 |
| Skin Permeability | −2.618 | −2.554 | −2.84 | −2.735 | −2.769 | −2.72 | −2.897 |
| P-glycoprotein substrate | No | No | No | Yes | No | Yes | No |
| P-glycoprotein I inhibitor | No | No | No | No | No | No | No |
| P-glycoprotein II inhibitor | No | No | No | No | No | No | No |
| VDss (human) | −0.294 | −0.351 | −0.714 | 0.051 | −0.767 | −0.195 | −0.367 |
| Fraction unbound (human) | 0.339 | 0.293 | 0.448 | 0.378 | 0.448 | 0.215 | 0.311 |
| BBB permeability | −0.043 | 0.149 | −0.764 | −0.587 | −0.796 | 0.373 | −0.323 |
| CNS permeability | −1.977 | −2.814 | −3.047 | −3.456 | −3.118 | −2.06 | −2.414 |
| CYP2D6 substrate | No | No | No | No | No | No | No |
| CYP3A4 substrate | Yes | No | No | No | No | Yes | No |
| CYP1A2 inhibitor | Yes | Yes | Yes | Yes | Yes | Yes | Yes |
| CYP2C19 inhibitor | No | No | No | No | No | No | No |
| CYP2C9 inhibitor | No | No | No | No | No | No | No |
| CYP2D6 inhibitor | No | No | No | No | No | No | No |
| CYP3A4 inhibitor | No | No | No | No | No | No | No |
| Total Clearance | 0.109 | 0.063 | 0.16 | 0.586 | 0.557 | 0.503 | 0.239 |
| Renal OCT2 substrate | No | No | No | Yes | No | No | No |
| AMES toxicity | Yes | Yes | No | Yes | No | No | Yes |
| Max. tolerated dose (human) | −0.749 | 0.397 | 0.632 | 0.593 | 0.613 | −0.25 | 0.378 |
| hERG I inhibitor | No | No | No | No | No | No | No |
| hERG II inhibitor | No | No | No | No | No | No | No |
| Oral Rat Acute Toxicity (LD50) | 2.254 | 2.313 | 2.379 | 1.804 | 2.22 | 2.51 | 2.383 |
| Oral Rat Chronic Toxicity (LOAEL) | 1.705 | 1.747 | 1.604 | 1.128 | 0.664 | 1.669 | 1.82 |
| Hepatotoxicity | Yes | No | No | Yes | Yes | Yes | No |
| Skin Sensitization | No | No | No | No | No | No | No |
| T. Pyriformis toxicity | 0.564 | 1.176 | 0.284 | 0.285 | 0.241 | 1.002 | 0.647 |
| Minnow toxicity | 2.586 | 1.524 | 2.684 | 2.529 | 3.021 | 1.28 | 2.364 |
| Complex | PL-Contacts Histogram | PL-Contacts Timeline |
|---|---|---|
| P6-2f6d | 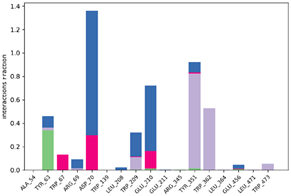 |  |
| P10-2f6d | 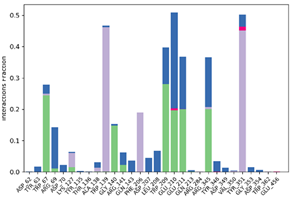 |  |
| P14-2f6d |  |  |
 (1) pIC50 = 5.58 |  (12) pIC50= 5.20 |  (23) pIC50 = 5.46 |
 (2) pIC50 = 5.26 | 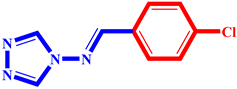 (13) pIC50 = 5.37 | 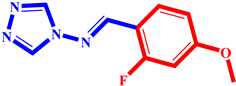 (24) pIC50 = 5.63 |
 (3) pIC50 = 5.26 | 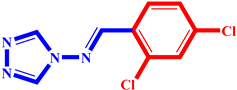 (14) pIC50 = 5.60 | 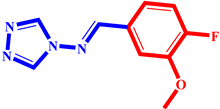 (25) pIC50 = 5.64 |
 (4) pIC50 = 5.27 |  (15) pIC50 = 5.27 | 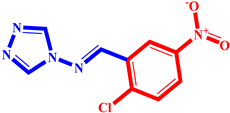 (26) pIC50 = 5.36 |
 (5) pIC50 = 5.24 |  (16) pIC50 = 5.61 |  (27) pIC50 = 5.64 |
 (6) pIC50 = 5.37 | 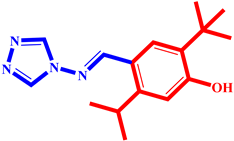 (17) pIC50 = 5.20 | 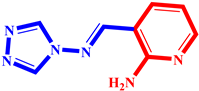 (28) pIC50 = 5.61 |
 (7) pIC50 = 5.37 |  (18) pIC50 = 5.28 |  (29) pIC50 = 5.26 |
 (8) pIC50 = 5.26 |  (19) pIC50 = 5.48 |  (30) pIC50 = 5.18 |
 (9) pIC50 = 5.27 | 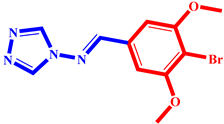 (20) pIC50 = 5.60 | 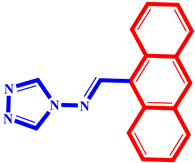 (31) pIC50 = 5.27 |
 (10) pIC50 = 5.26 | 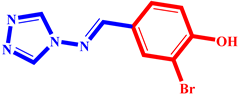 (21) pIC50 = 5.62 |  (32) pIC50 = 5.20 |
 (11) pIC50 = 5.37 |  (22) pIC50 = 5.60 |  (33) pIC50 = 5.68 |
Disclaimer/Publisher’s Note: The statements, opinions and data contained in all publications are solely those of the individual author(s) and contributor(s) and not of MDPI and/or the editor(s). MDPI and/or the editor(s) disclaim responsibility for any injury to people or property resulting from any ideas, methods, instructions or products referred to in the content. |
© 2024 by the authors. Licensee MDPI, Basel, Switzerland. This article is an open access article distributed under the terms and conditions of the Creative Commons Attribution (CC BY) license (https://creativecommons.org/licenses/by/4.0/).
Share and Cite
Abchir, O.; Khedraoui, M.; Nour, H.; Yamari, I.; Errougui, A.; Samadi, A.; Chtita, S. Integrative Approach for Designing Novel Triazole Derivatives as α-Glucosidase Inhibitors: QSAR, Molecular Docking, ADMET, and Molecular Dynamics Investigations. Pharmaceuticals 2024, 17, 261. https://doi.org/10.3390/ph17020261
Abchir O, Khedraoui M, Nour H, Yamari I, Errougui A, Samadi A, Chtita S. Integrative Approach for Designing Novel Triazole Derivatives as α-Glucosidase Inhibitors: QSAR, Molecular Docking, ADMET, and Molecular Dynamics Investigations. Pharmaceuticals. 2024; 17(2):261. https://doi.org/10.3390/ph17020261
Chicago/Turabian StyleAbchir, Oussama, Meriem Khedraoui, Hassan Nour, Imane Yamari, Abdelkbir Errougui, Abdelouahid Samadi, and Samir Chtita. 2024. "Integrative Approach for Designing Novel Triazole Derivatives as α-Glucosidase Inhibitors: QSAR, Molecular Docking, ADMET, and Molecular Dynamics Investigations" Pharmaceuticals 17, no. 2: 261. https://doi.org/10.3390/ph17020261
APA StyleAbchir, O., Khedraoui, M., Nour, H., Yamari, I., Errougui, A., Samadi, A., & Chtita, S. (2024). Integrative Approach for Designing Novel Triazole Derivatives as α-Glucosidase Inhibitors: QSAR, Molecular Docking, ADMET, and Molecular Dynamics Investigations. Pharmaceuticals, 17(2), 261. https://doi.org/10.3390/ph17020261