
Nobiletin Ameliorates Cellular Damage and Stress Response and Restores Neuronal Identity Altered by Sodium Arsenate Exposure in Human iPSCs-Derived hNPCs

 ,
,  ,
,  , , ,
, , ,  , , ,
, , , 
Abstract
:1. Introduction
2. Results
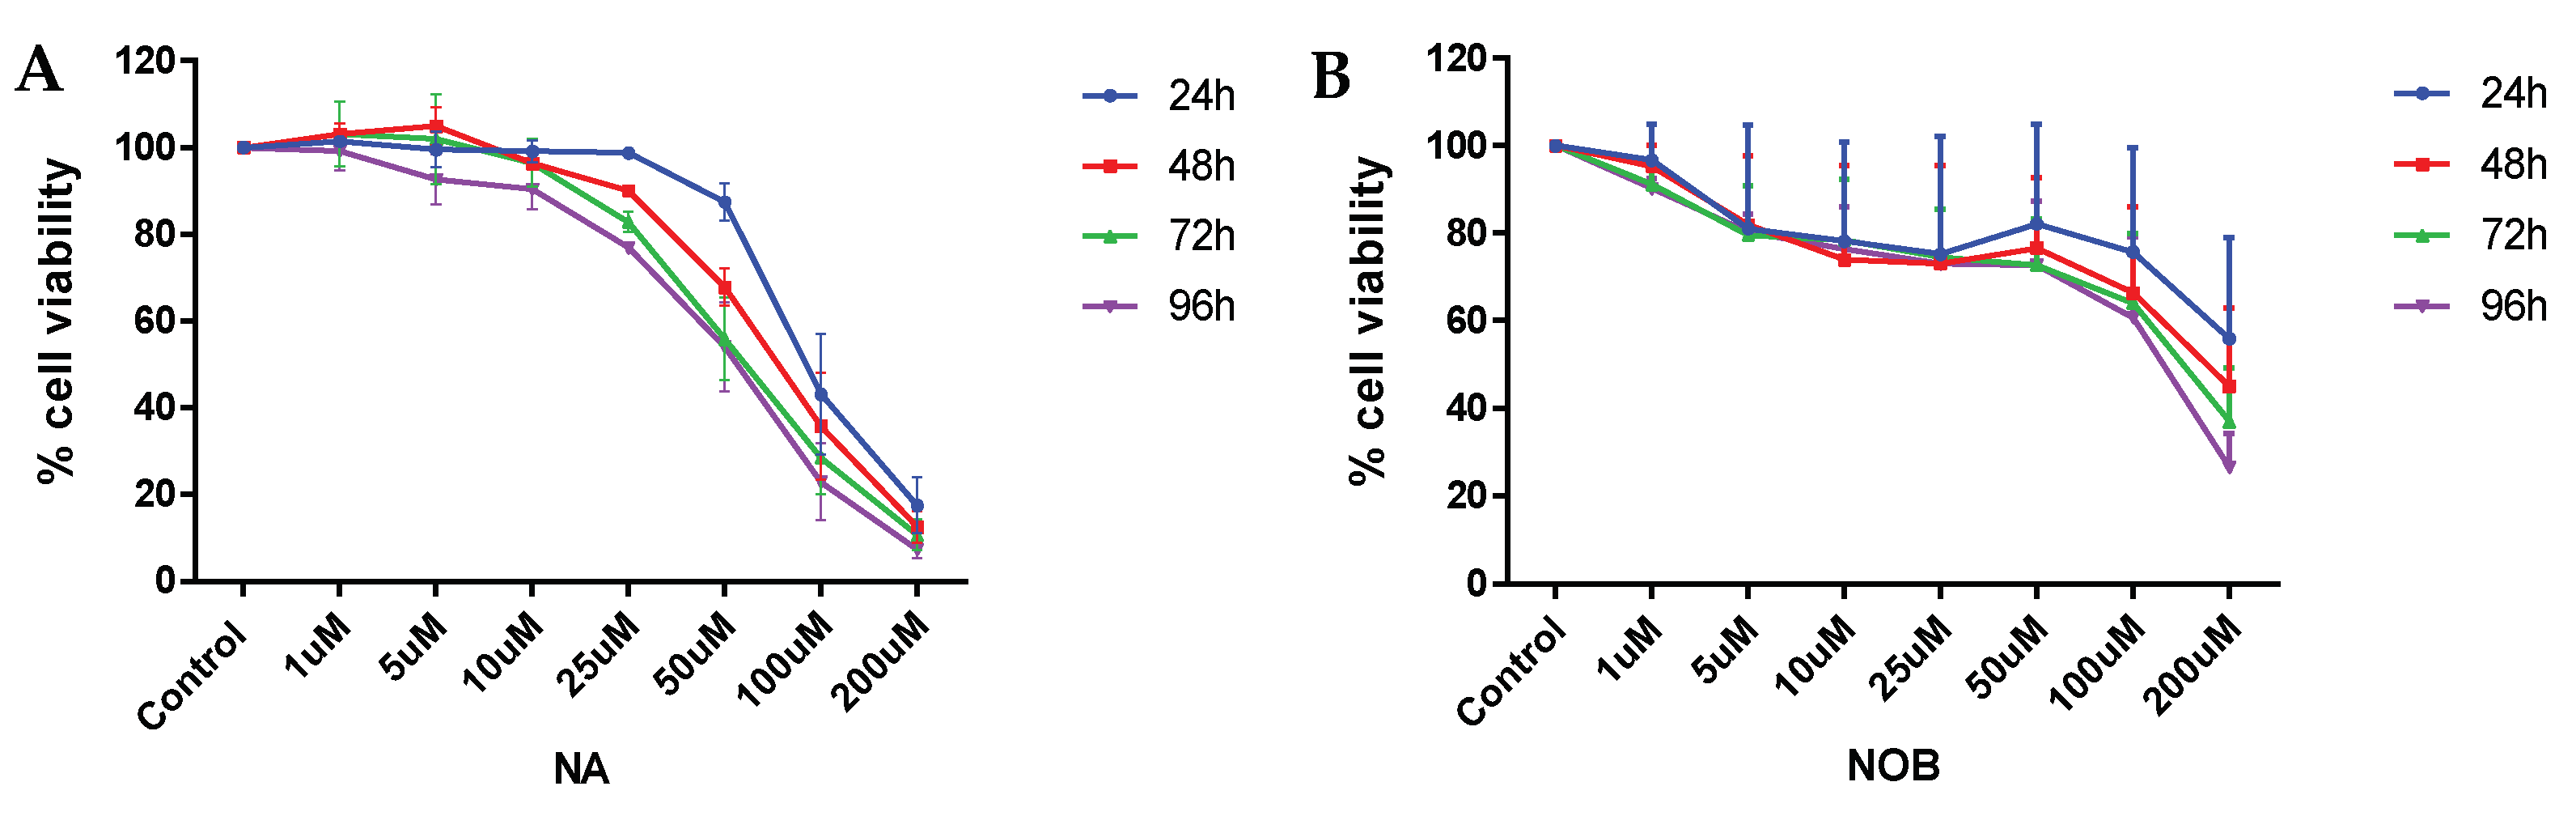
2.1. Cell Viability
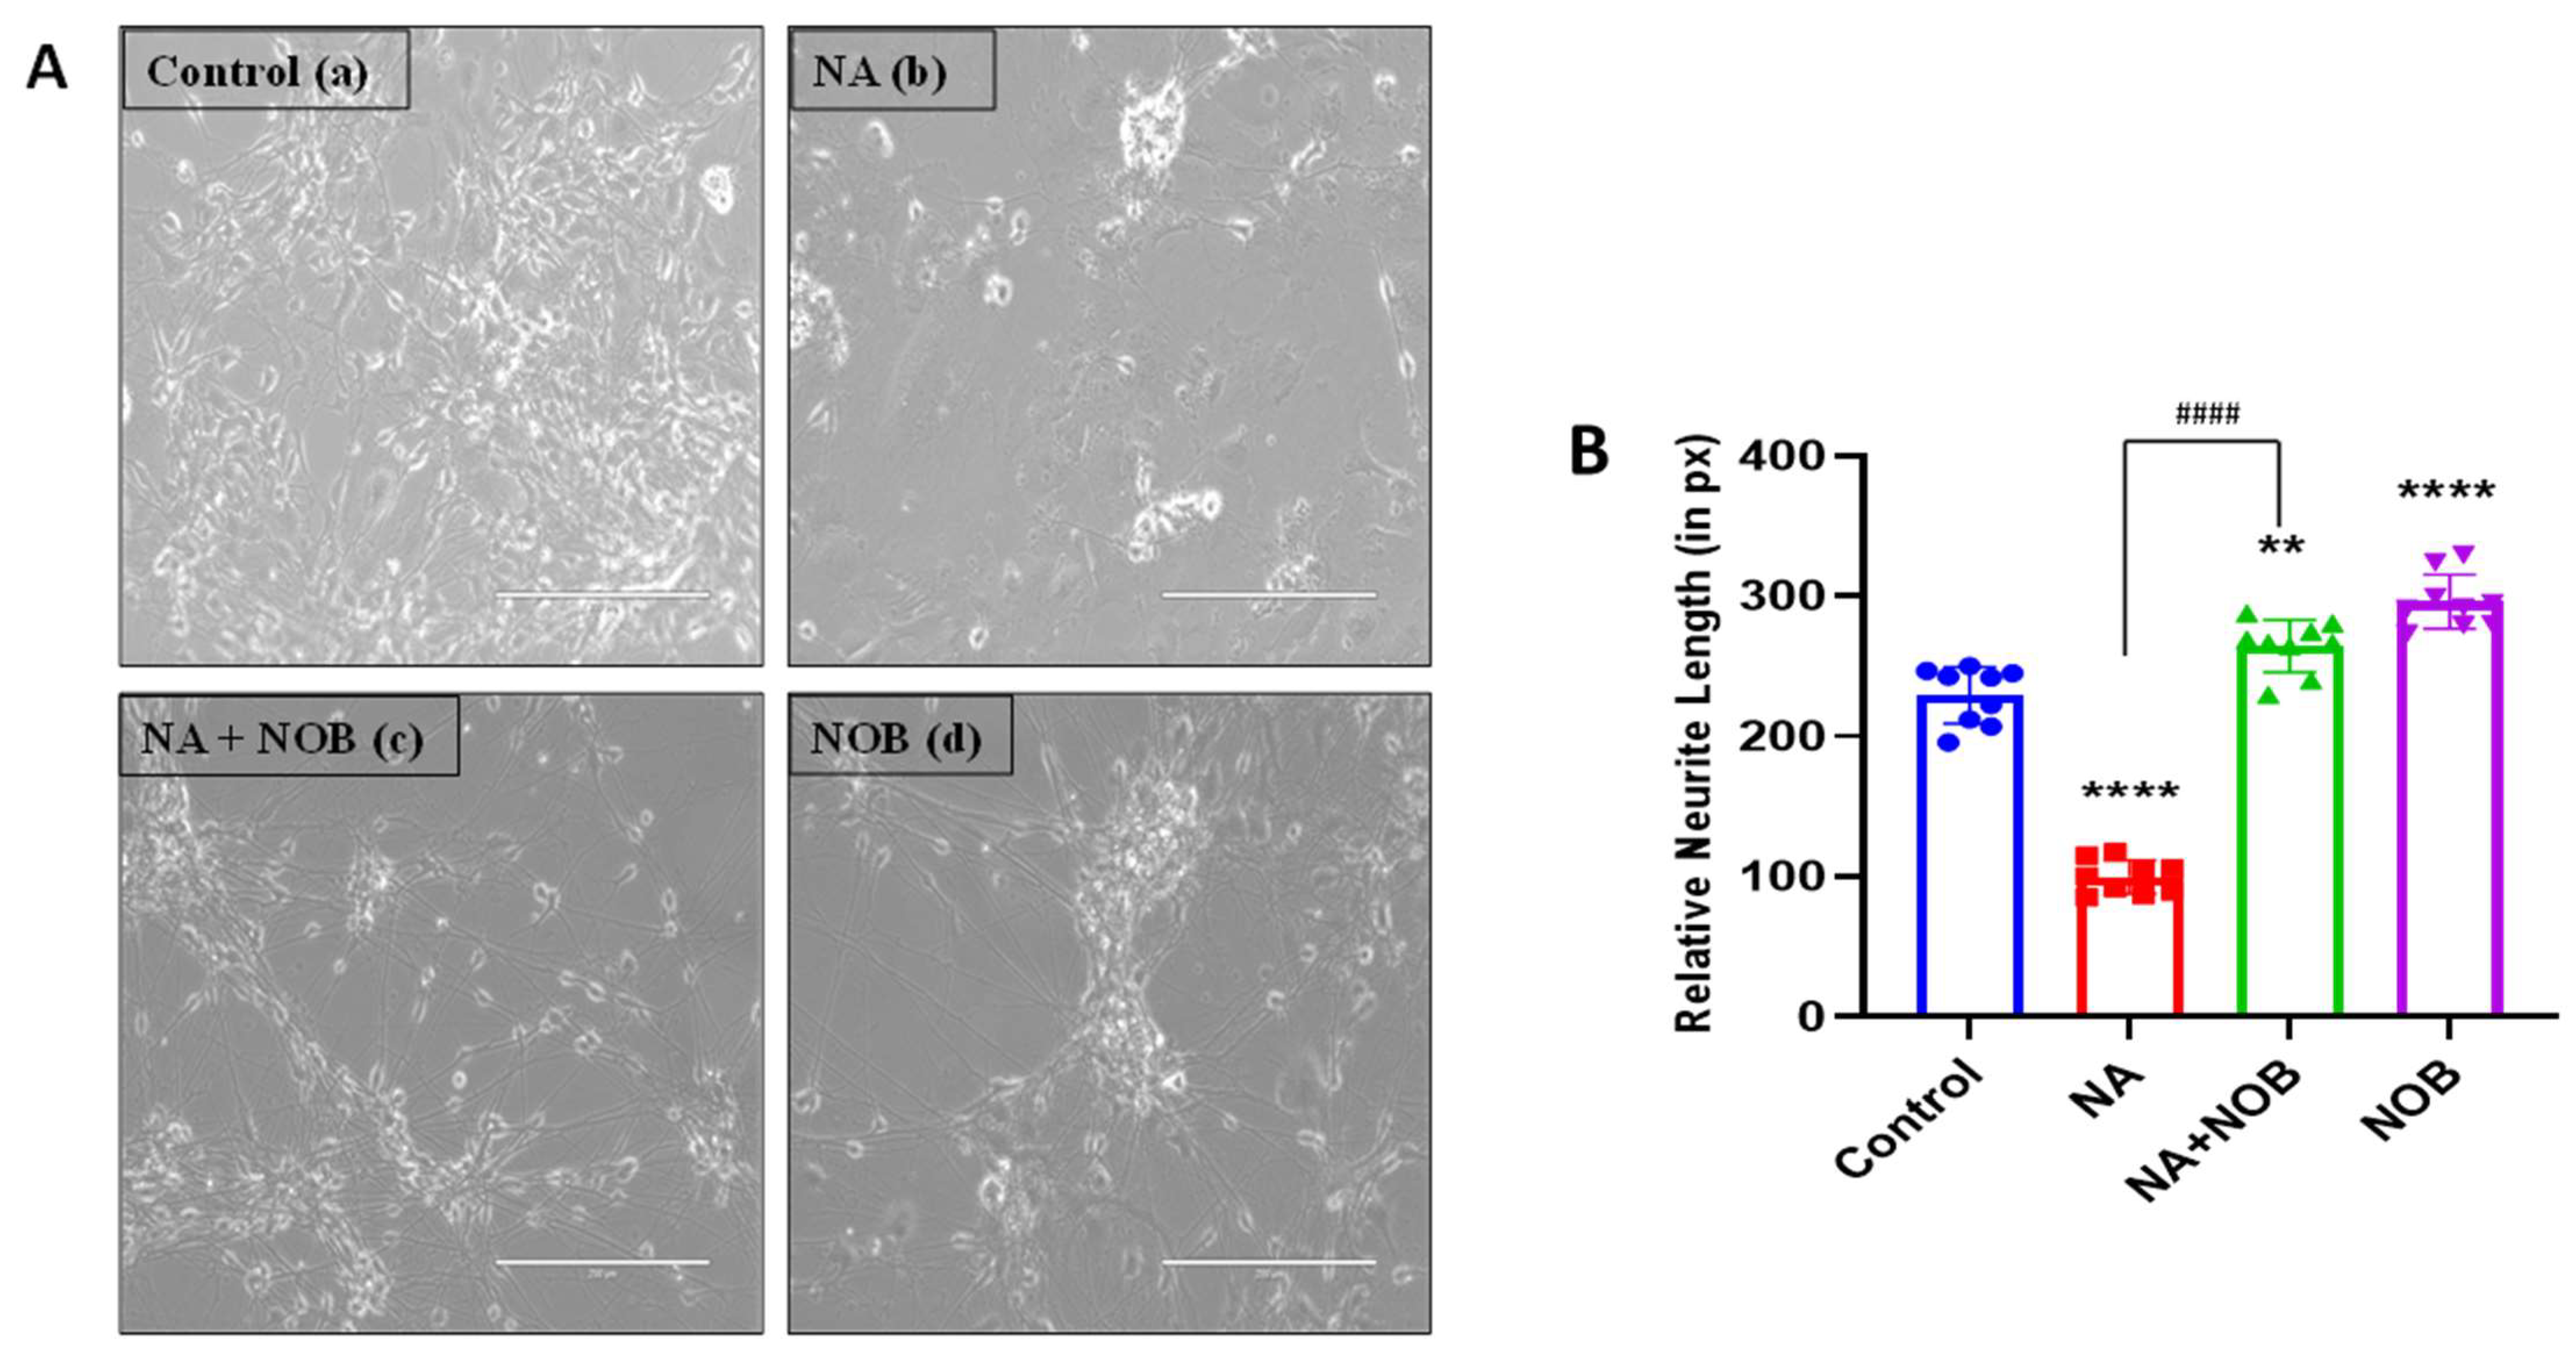
2.2. Nobiletin (NOB) Protects hNPCs against Sodium Arsenate (NA)-Induced Neurotoxicity
2.3. Antioxidative Properties of Nobiletin
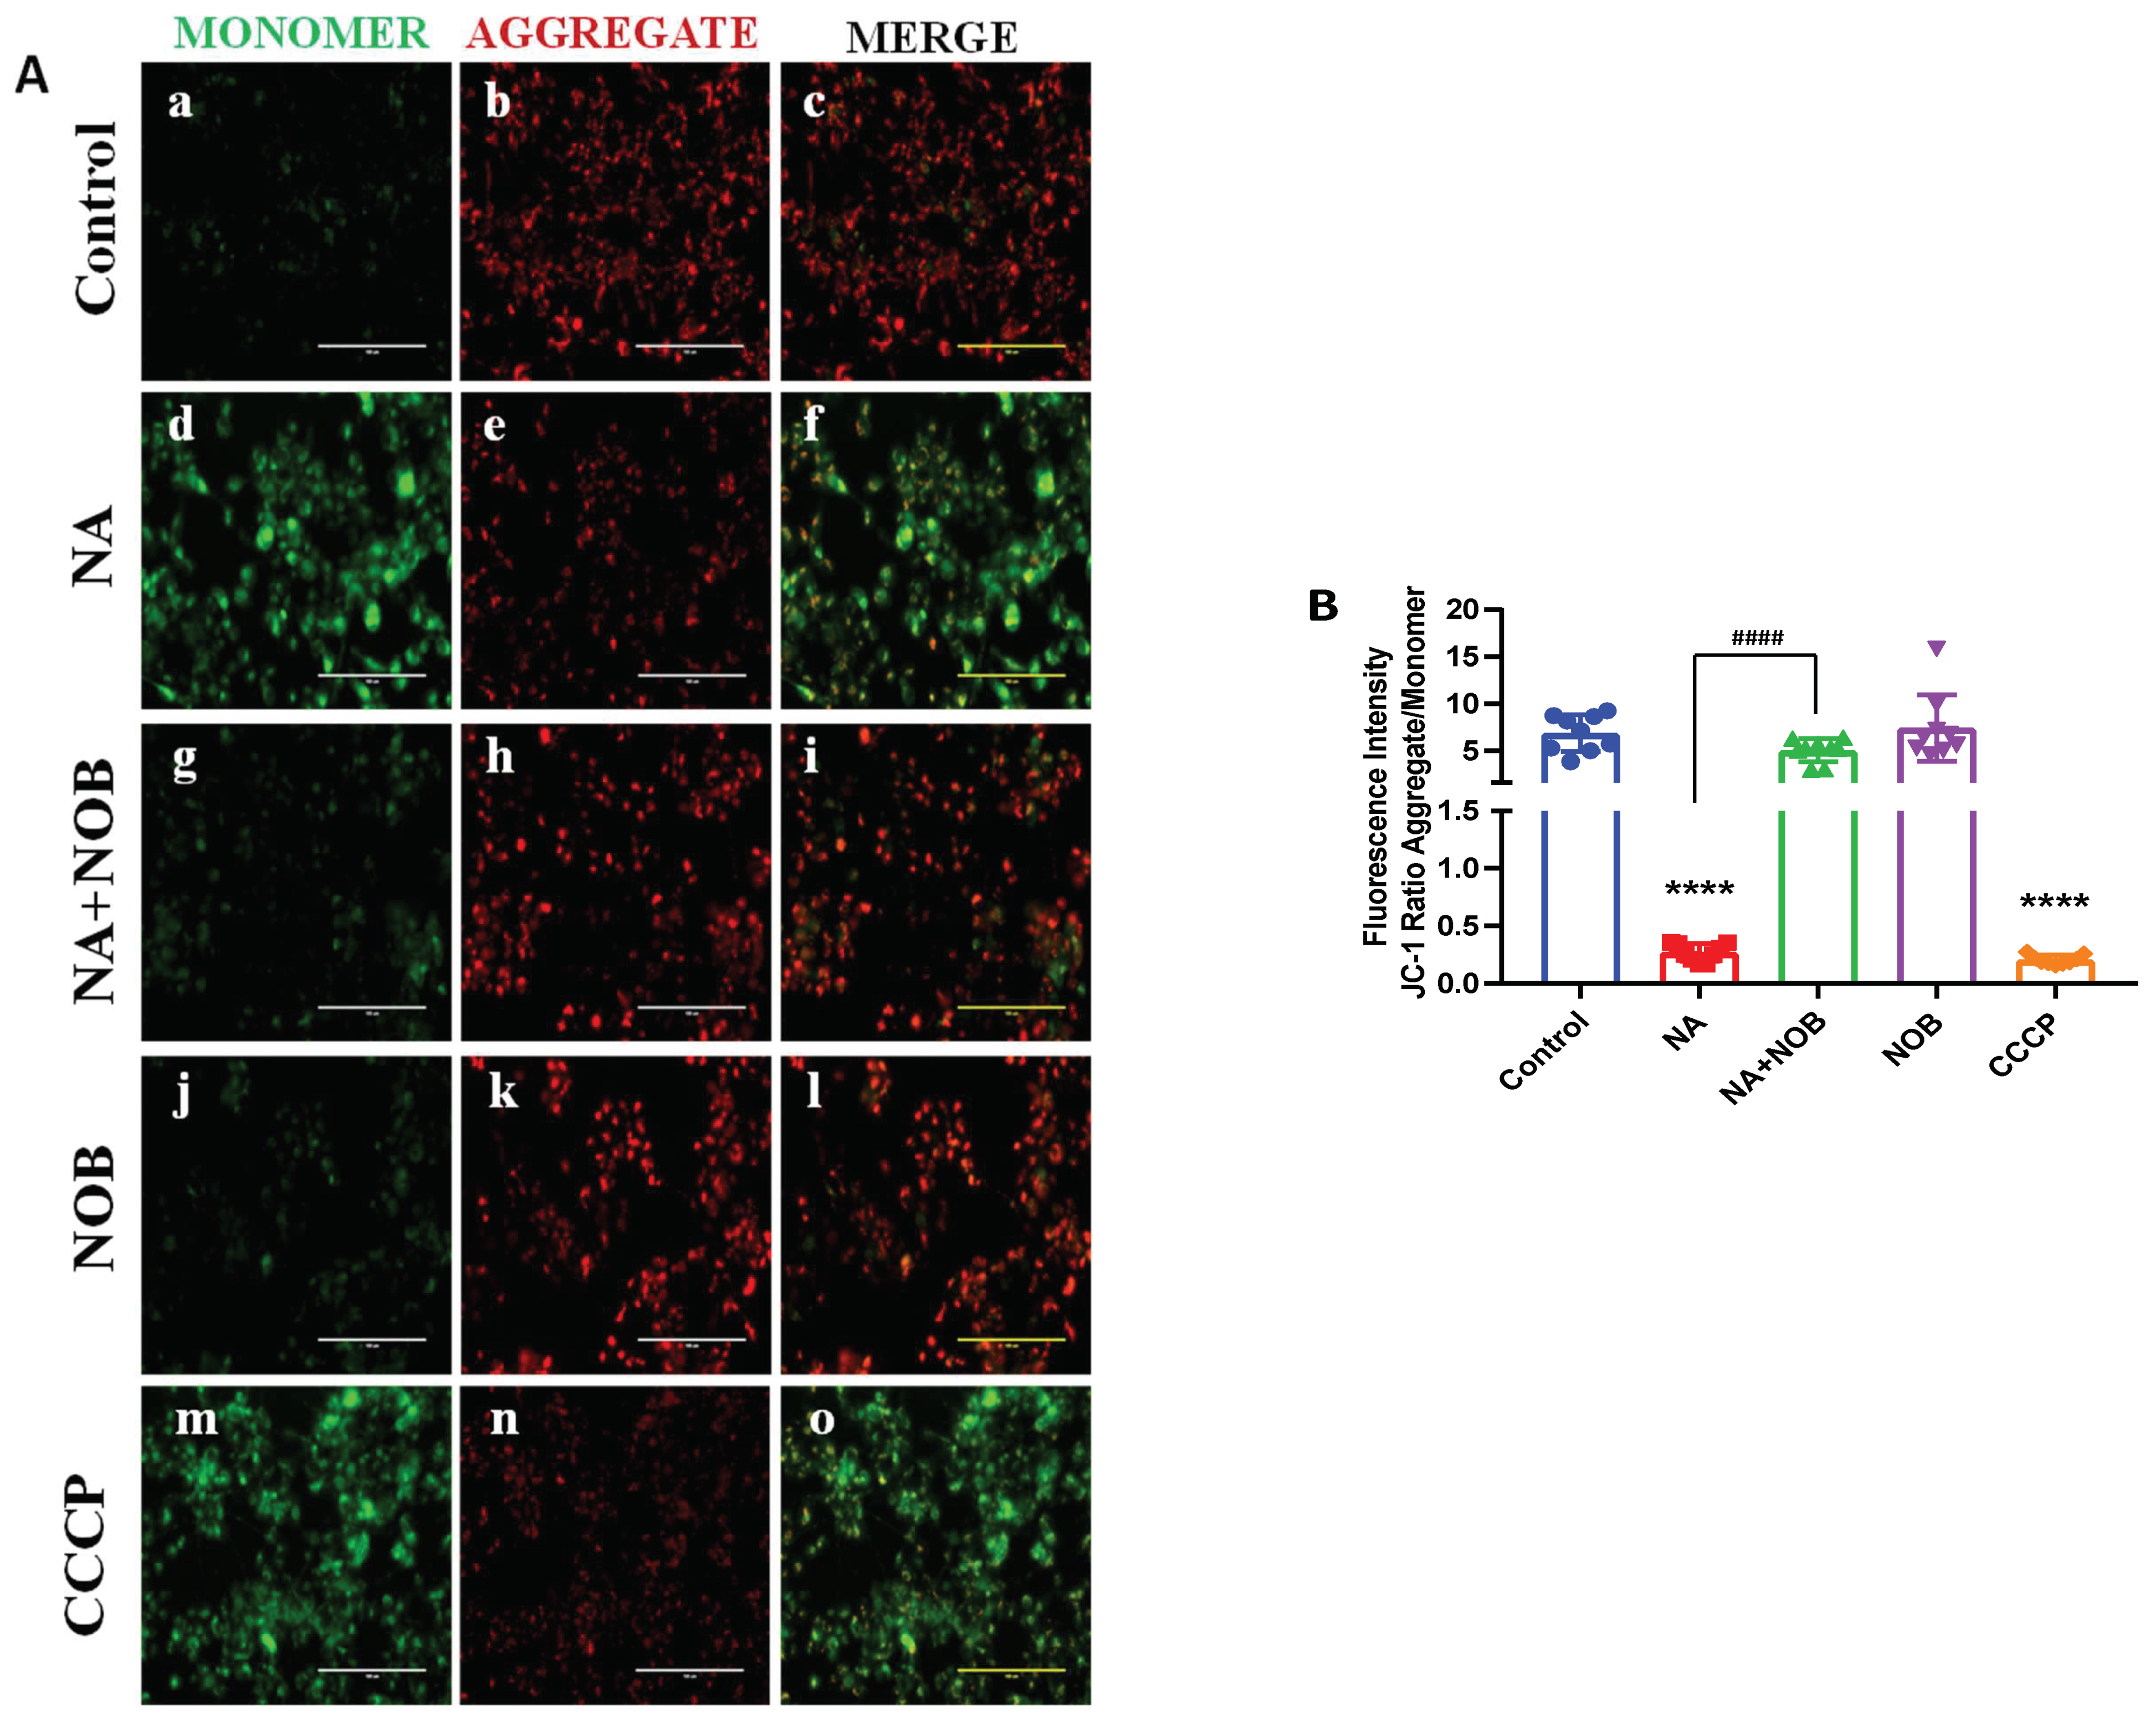
2.4. Protective effect of NOB against NA-induced MMP alteration
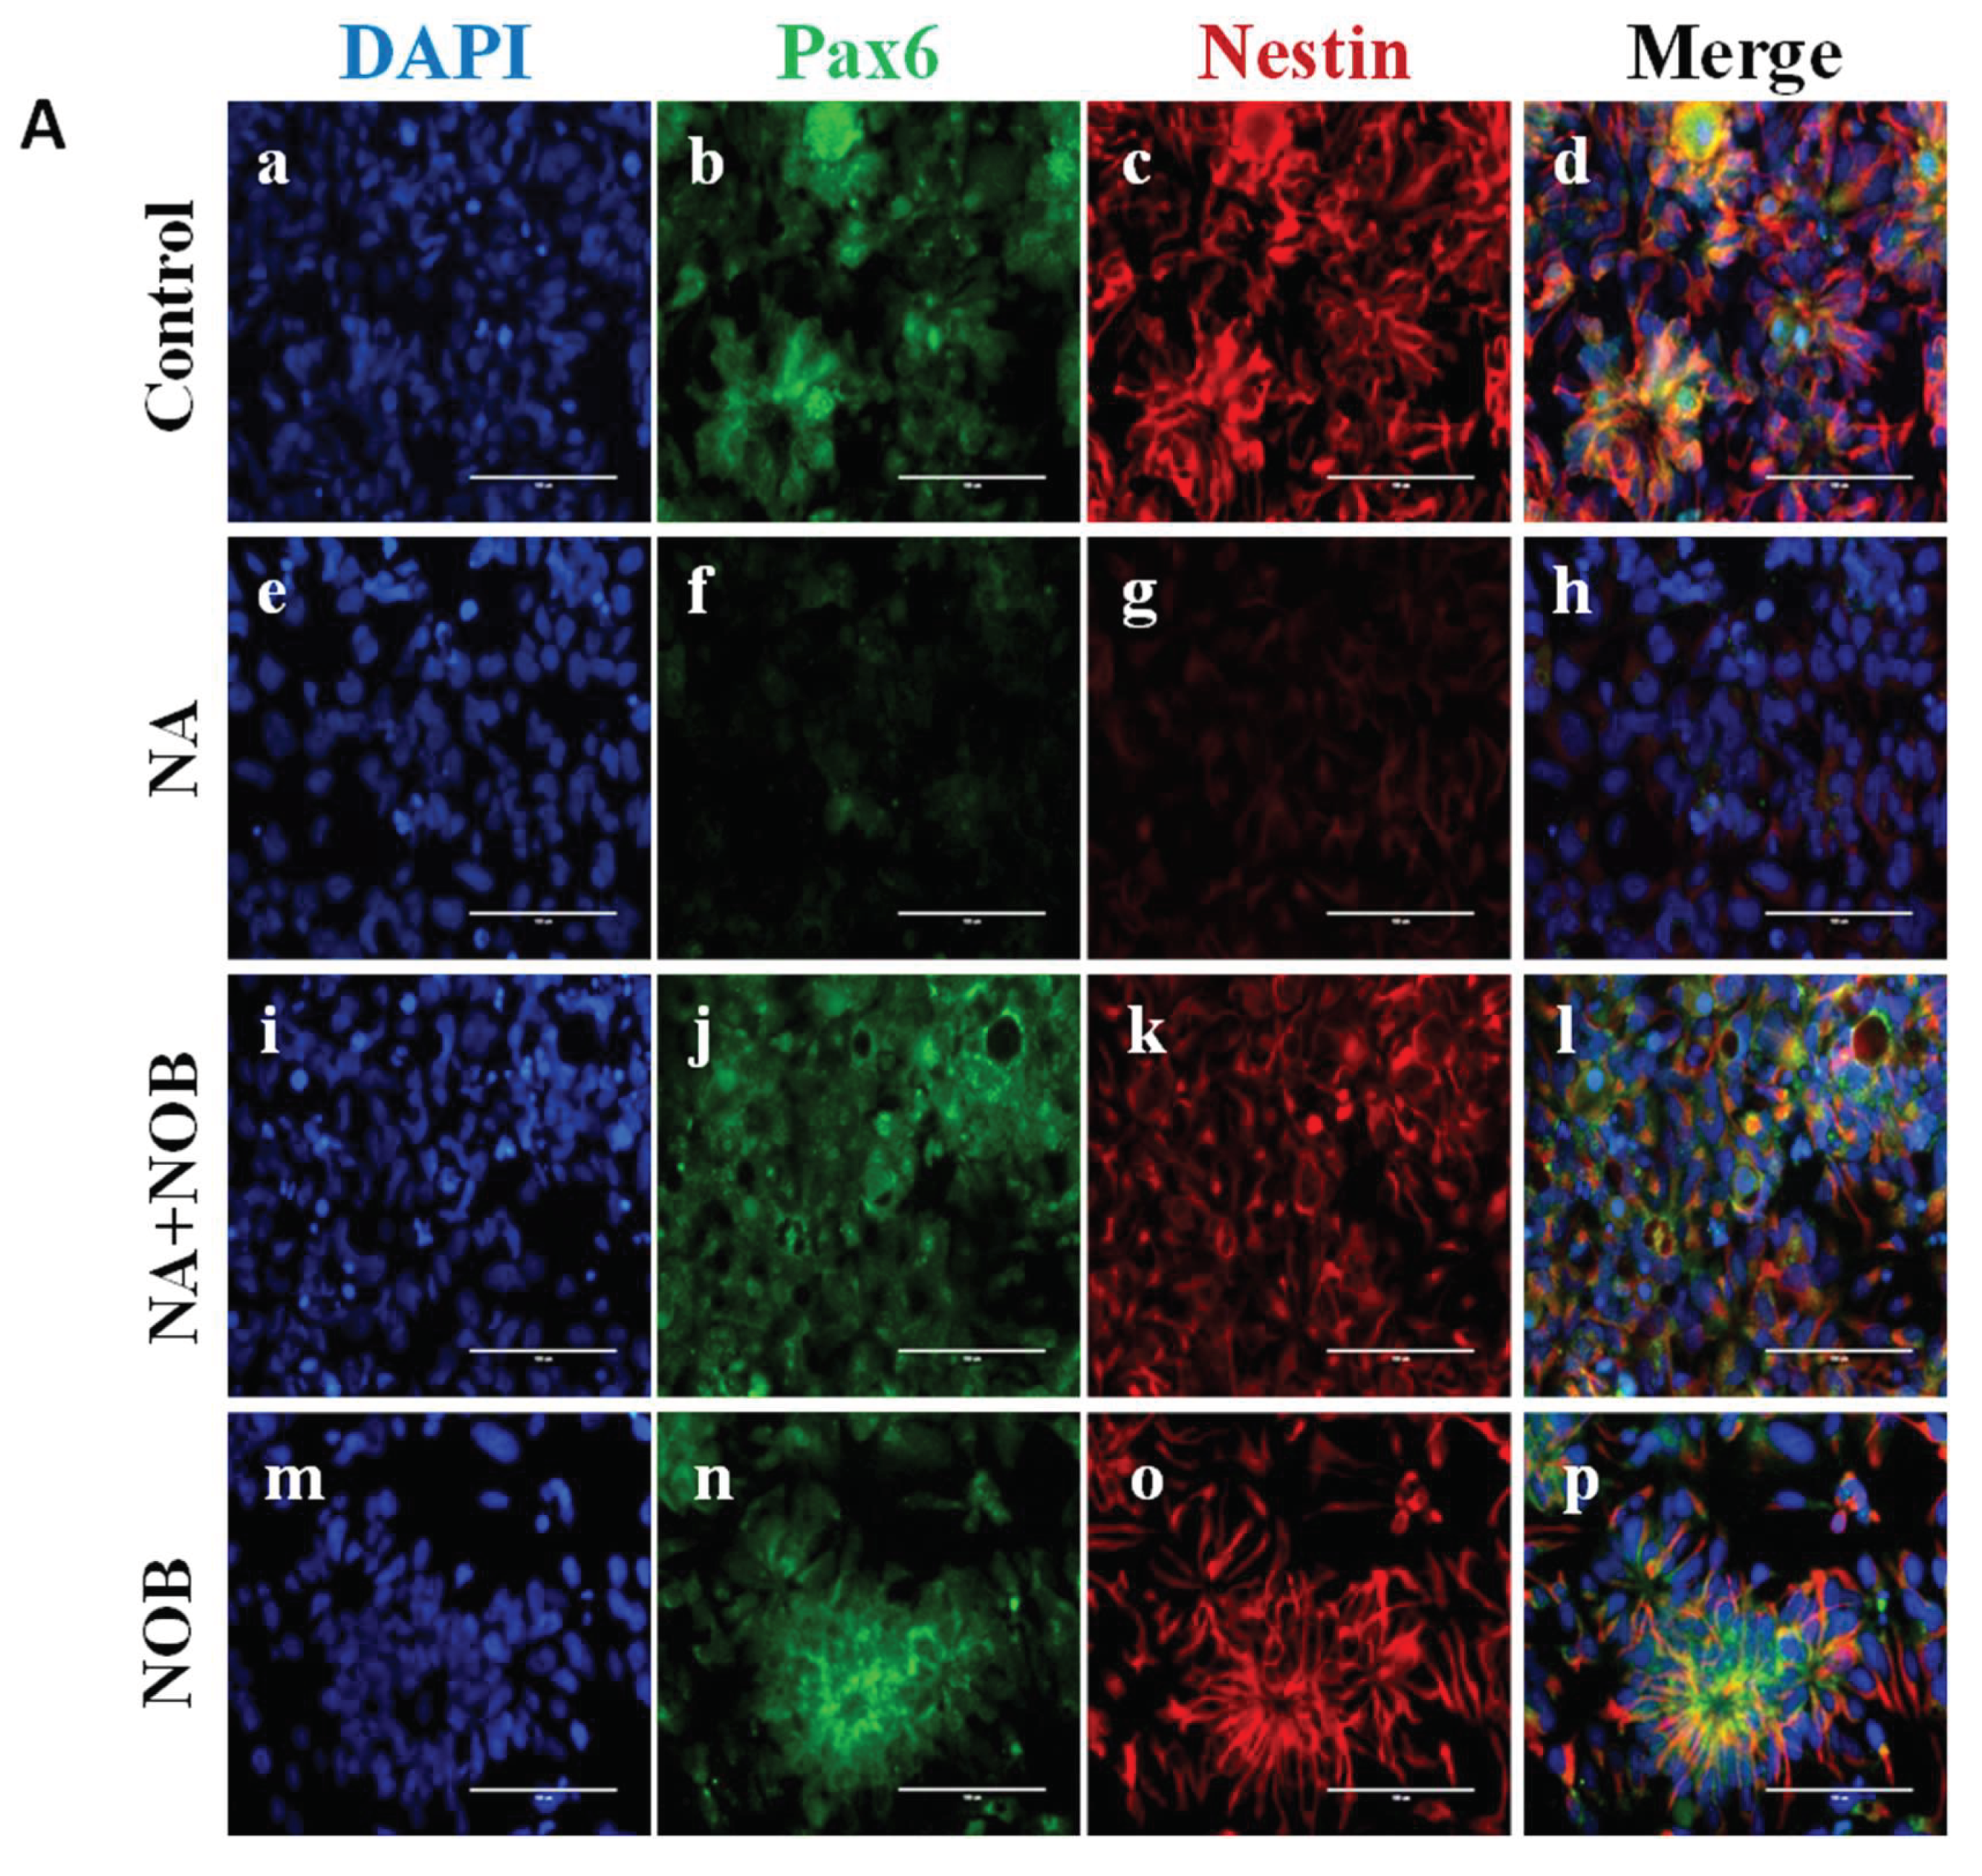
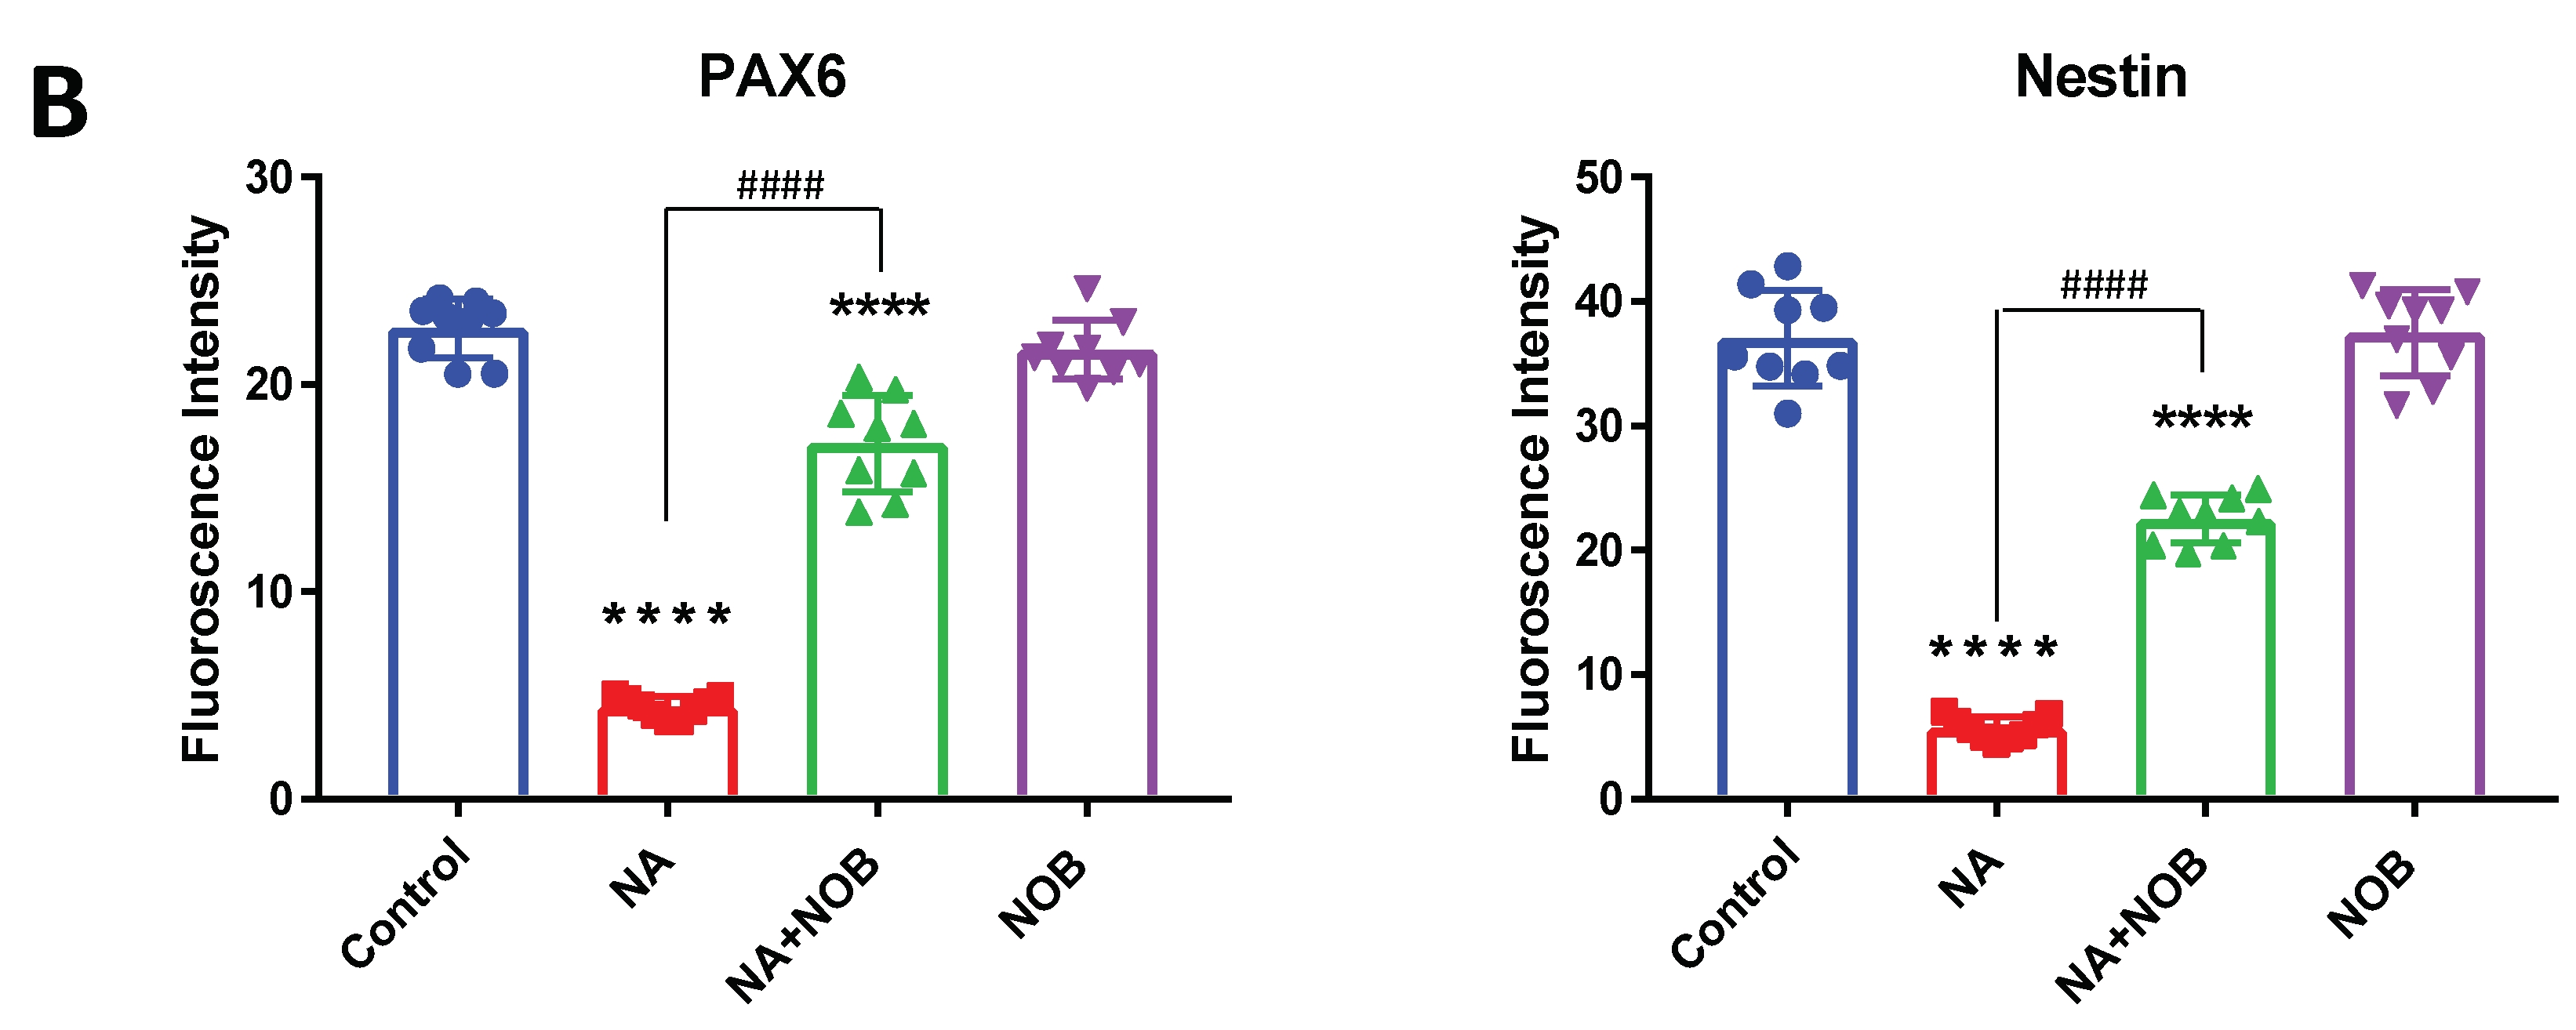
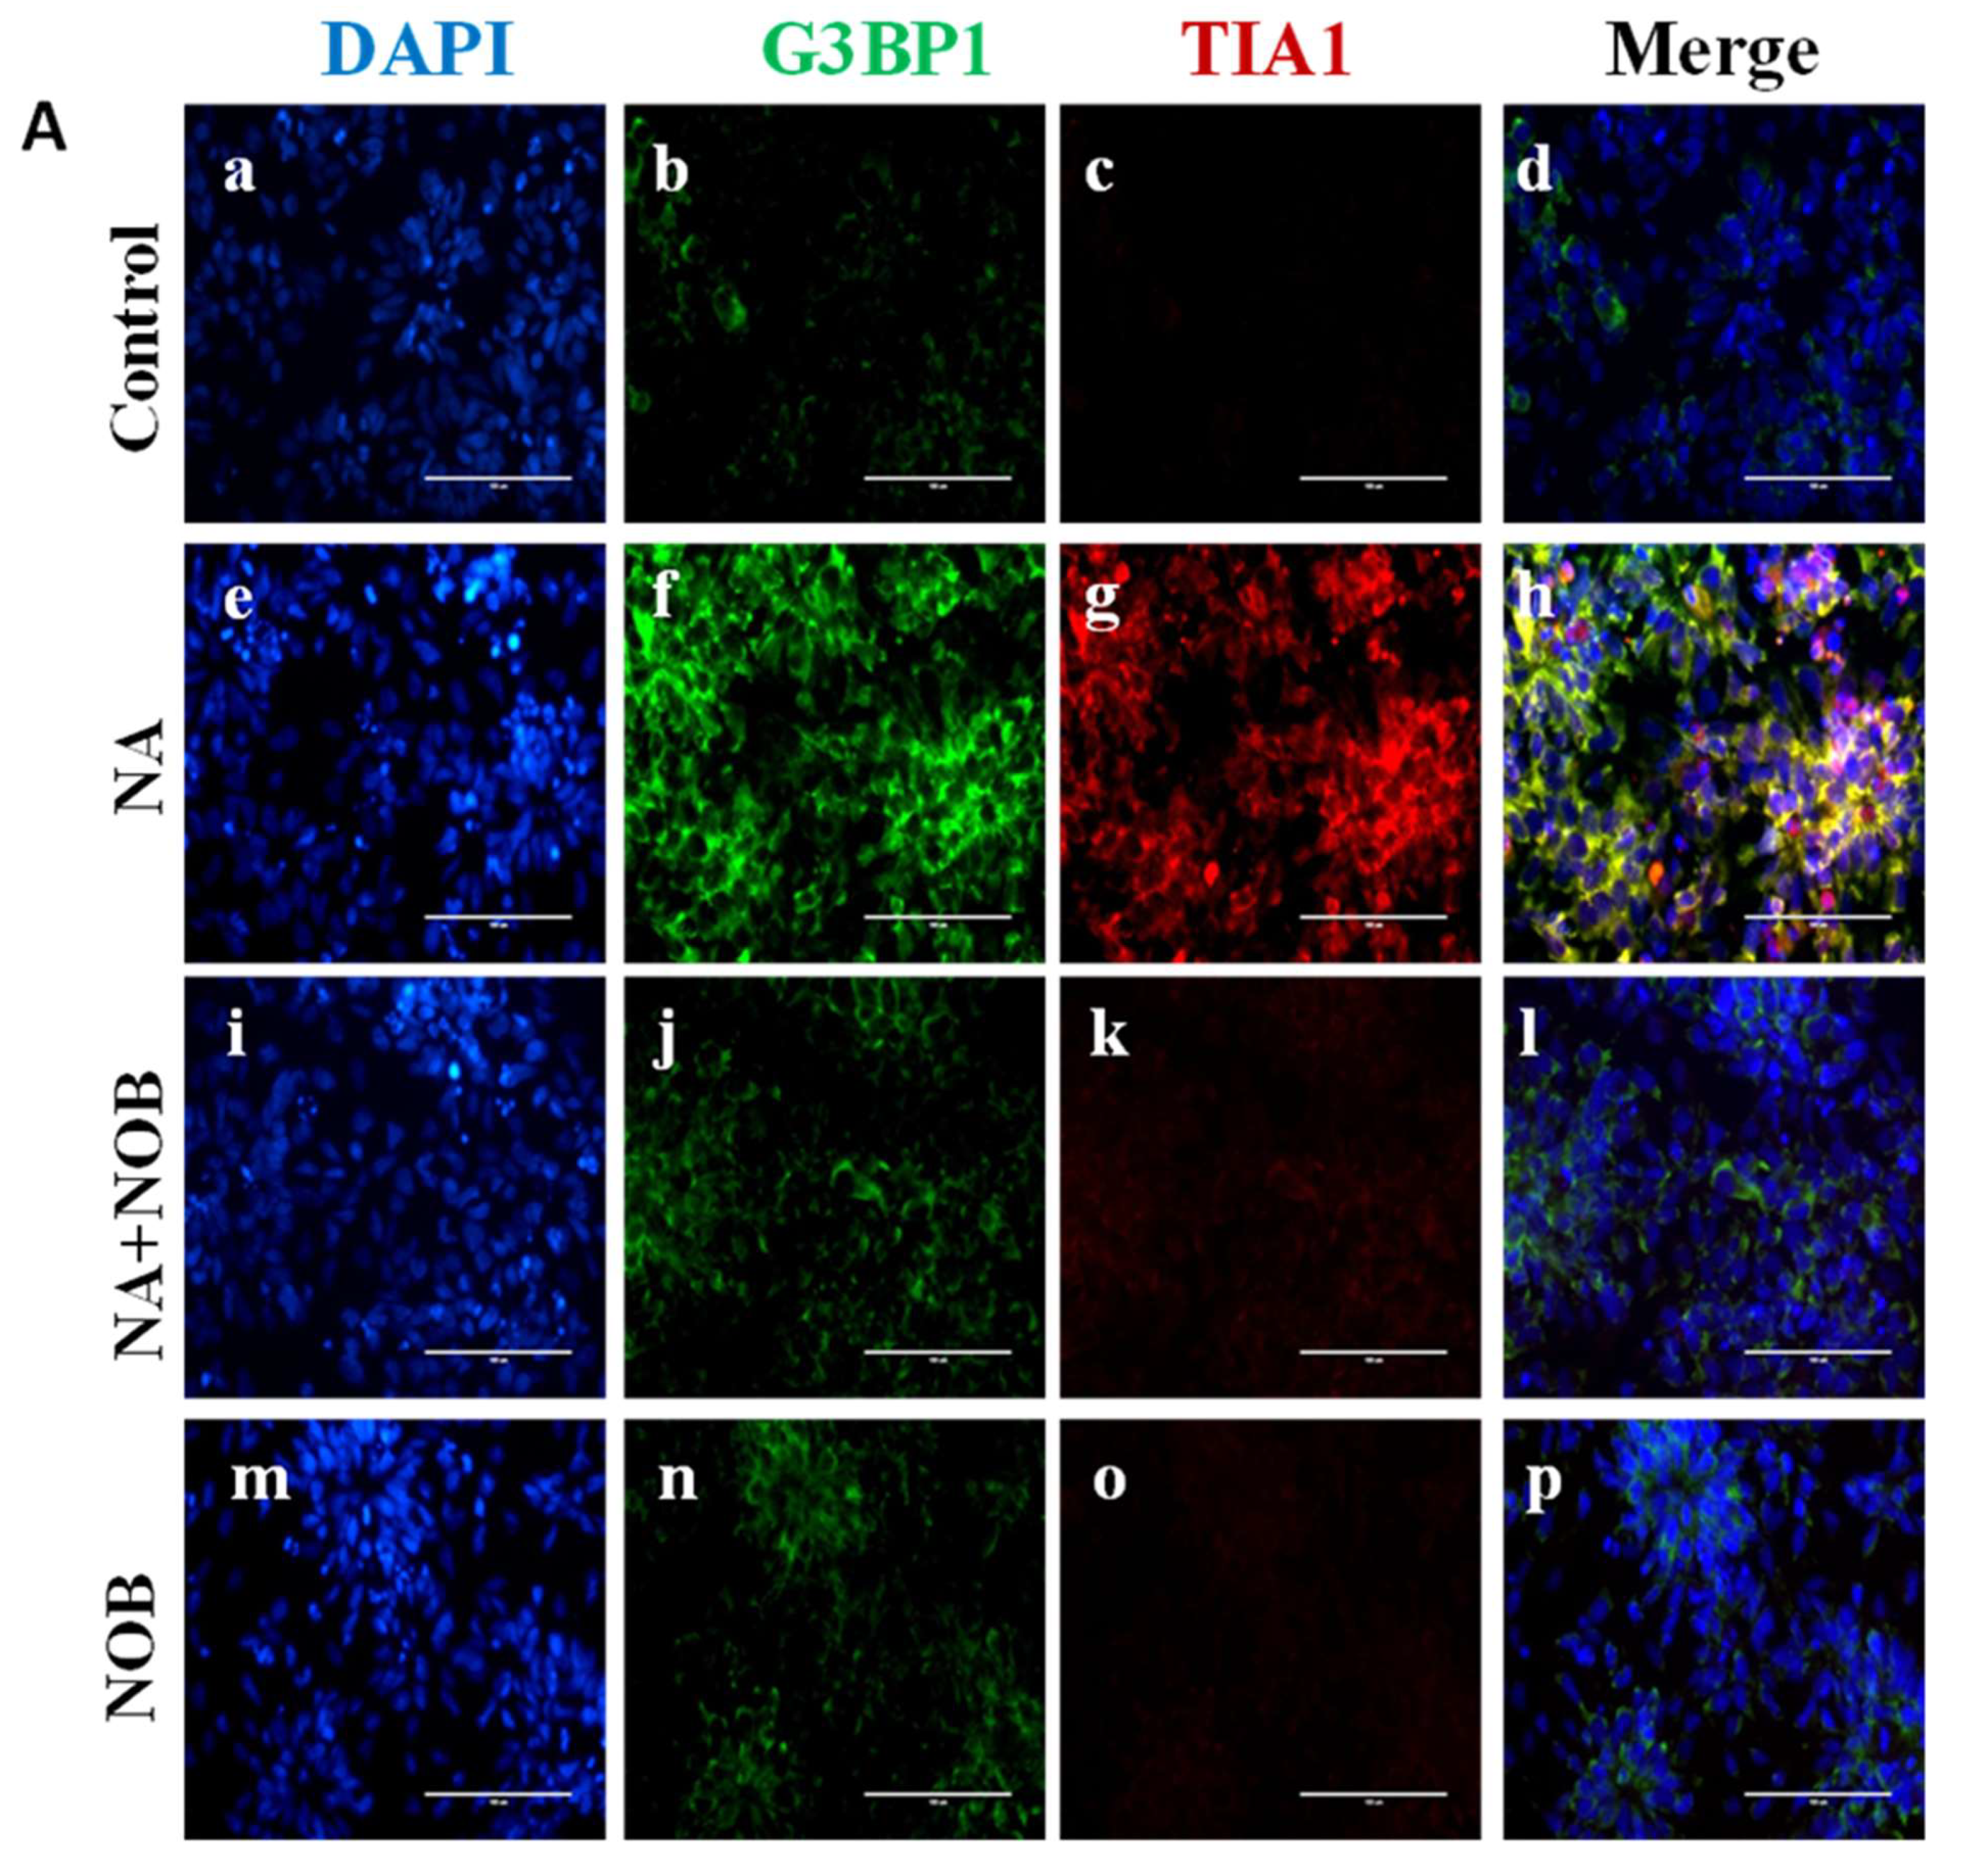
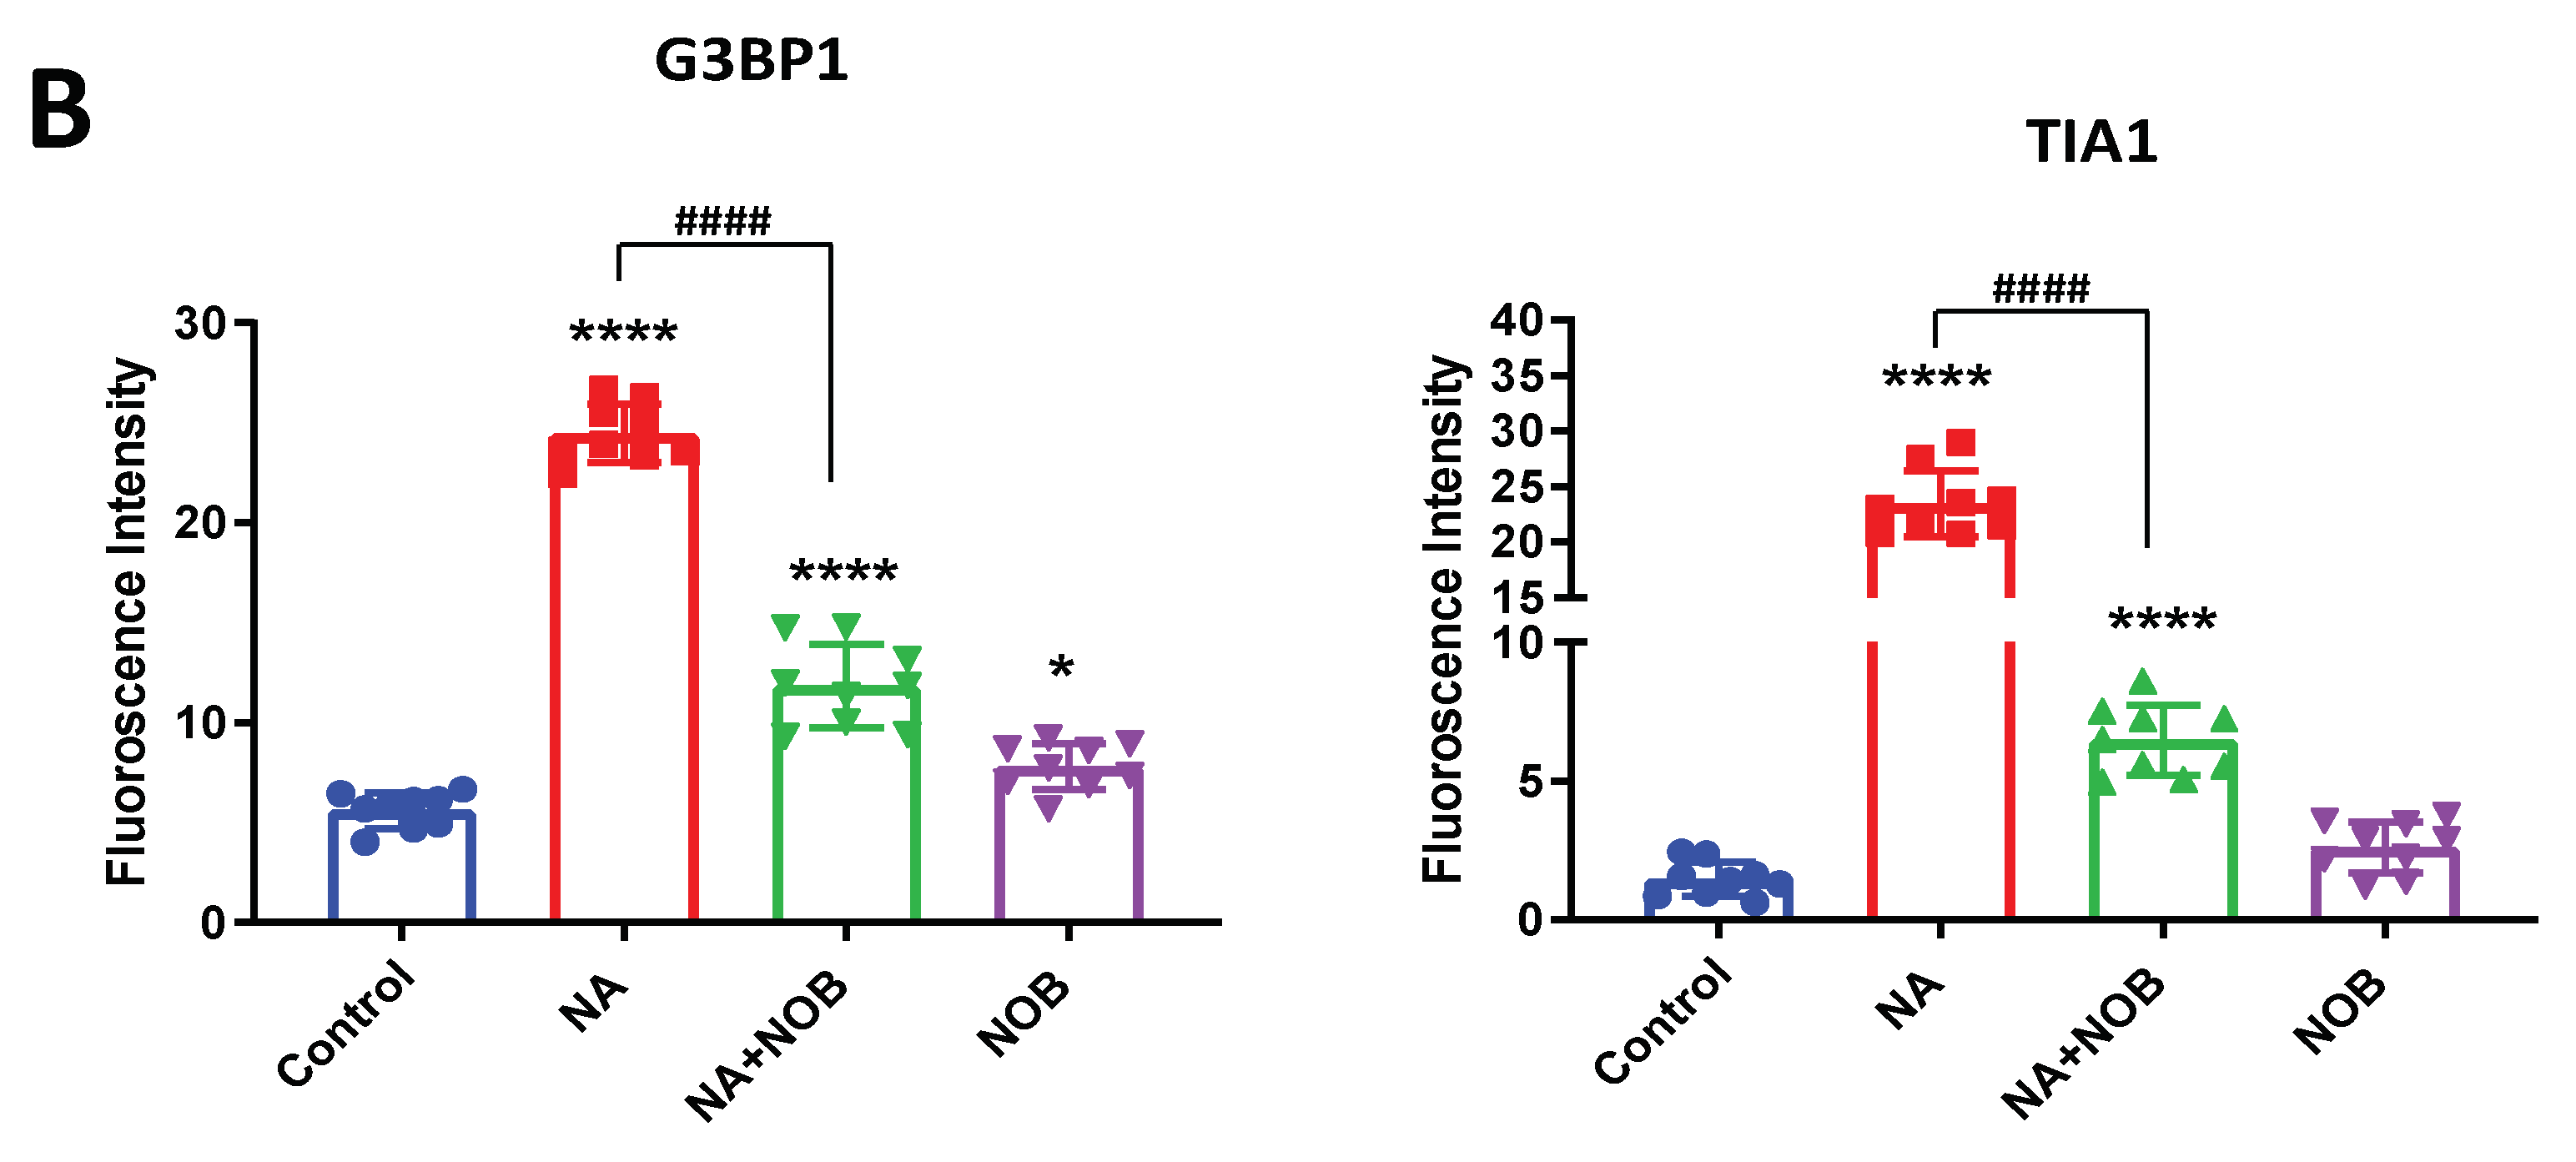
2.5. Impact of NOB on Neuronal Markers and Stress Granule Markers in Neural Progenitor Cells Exposed to NA
3. Discussion
4. Materials and Methods
4.1. Reagents and Consumables
4.2. Cell Culture
4.3. MTT Assay
4.4. Morphology of Cells and Neurite Length
4.5. ROS Generation
4.6. JC-1 Dye for Mitochondrial Membrane Potential
4.7. Immunocytochemical Analysis
4.8. Statistical Analysis
Author Contributions
Funding
Institutional Review Board Statement
Informed Consent Statement
Data Availability Statement
Acknowledgments
Conflicts of Interest
References
- World Health Organization. Preventing Disease through Healthy Environments: Exposure to Arsenic: A Major Public Health Concern; World Health Organization: Geneva, Switzerland, 2019. [Google Scholar]
- Keune, K.; Mass, J.; Meirer, F.; Pottasch, C.; van Loon, A.; Hull, A.; Church, J.; Pouyet, E.; Cotte, M.; Mehta, A. Tracking the transformation and transport of arsenic sulfide pigments in paints: Synchrotron-based X-ray micro-analyses. J. Anal. At. Spectrom. 2015, 30, 813–827. [Google Scholar] [CrossRef] [Green Version]
- Mandal, B.K.; Suzuki, K.T. Arsenic round the world: A review. Talanta 2002, 58, 201–235. [Google Scholar] [CrossRef]
- Ahmad, S.A.; Khan, M.H.; Haque, M. Arsenic contamination in groundwater in Bangladesh: Implications and challenges for healthcare policy. Risk Manag. Healthc. Policy 2018, 11, 251. [Google Scholar] [CrossRef] [PubMed] [Green Version]
- Schuhmacher–Wolz, U.; Dieter, H.H.; Klein, D.; Schneider, K. Oral exposure to inorganic arsenic: Evaluation of its carcinogenic and non-carcinogenic effects. Crit. Rev. Toxicol. 2009, 39, 271–298. [Google Scholar] [CrossRef]
- Powers, M.; Sanchez, T.R.; Grau-Perez, M.; Yeh, F.; Francesconi, K.A.; Goessler, W.; George, C.M.; Heaney, C.; Best, L.G.; Umans, J.G.; et al. Low-moderate arsenic exposure and respiratory in American Indian communities in the Strong Heart Study. Environ. Health 2019, 18, 1–12. [Google Scholar] [CrossRef] [Green Version]
- Rodrigues, E.G.; Bellinger, D.C.; Valeri, L.; Hasan, M.O.S.I.; Quamruzzaman, Q.; Golam, M.; Kile, M.L.; Christiani, D.C.; Wright, R.O.; Mazumdar, M. Neurodevelopmental outcomes among 2-to 3-year-old children in Bangladesh with elevated blood lead and exposure to arsenic and manganese in drinking water. Environ. Health 2016, 15, 1–9. [Google Scholar] [CrossRef] [PubMed] [Green Version]
- Gong, G.; O’Bryant, S.E. The arsenic exposure hypothesis for Alzheimer disease. Alzheimer Dis. Assoc. Disord. 2010, 24, 311–316. [Google Scholar] [CrossRef]
- Tsuji, J.S.; Garry, M.R.; Perez, V.; Chang, E.T. Low-level arsenic exposure and developmental neurotoxicity in children: A systematic review and risk assessment. Toxicology 2015, 337, 91–107. [Google Scholar] [CrossRef]
- Sarkar, S.; Mukherjee, S.; Chattopadhyay, A.; Bhattacharya, S. Low dose of arsenic trioxide triggers oxidative stress in zebrafish brain: Expression of antioxidant genes. Ecotoxicol. Environ. Saf. 2014, 107, 1–8. [Google Scholar] [CrossRef]
- García-Chávez, E.; Segura, B.; Merchant, H.; Jiménez, I.; Del Razo, L.M. Functional and morphological effects of repeated sodium arsenite exposure on rat peripheral sensory nerves. J. Neurol. Sci. 2007, 258, 104–110. [Google Scholar] [CrossRef]
- Garza-Lombó, C.; Posadas, Y.; Quintanar, L.; Gonsebatt, M.E.; Franco, R. Neurotoxicity linked to dysfunctional metal ion homeostasis and xenobiotic metal exposure: Redox signaling and oxidative stress. Antioxidants Redox Signal. 2018, 28, 1669–1703. [Google Scholar] [CrossRef] [PubMed] [Green Version]
- Srivastava, P.; Dhuriya, Y.K.; Kumar, V.; Srivastava, A.; Gupta, R.; Shukla, R.K.; Yadav, R.S.; Dwivedi, H.N.; Pant, A.B.; Khanna, V.K. PI3K/Akt/GSK3β induced CREB activation ameliorates arsenic mediated alterations in NMDA receptors and associated signaling in rat hippocampus: Neuroprotective role of curcumin. Neurotoxicology 2018, 67, 190–205. [Google Scholar] [CrossRef] [PubMed]
- Sharma, A.; Kshetrimayum, C.; Sadhu, H.G.; Kumar, S. Arsenic-induced oxidative stress, cholinesterase activity in the brain of Swiss albino mice, and its amelioration by antioxidants Vitamin E and Coenzyme Q10. Environ. Sci. Pollut. Res. 2018, 25, 23946–23953. [Google Scholar] [CrossRef]
- Salim, S. Oxidative stress and the central nervous system. J. Pharmacol. Exp. Ther. 2017, 360, 201–205. [Google Scholar] [CrossRef]
- Shila, S.; Kokilavani, V.; Subathra, M.; Panneerselvam, C. Brain regional responses in antioxidant system to α-lipoic acid in arsenic intoxicated rat. Toxicology 2005, 210, 25–36. [Google Scholar] [CrossRef] [PubMed]
- Mateju, D.; Franzmann, T.M.; Patel, A.; Kopach, A.; Boczek, E.E.; Maharana, S.; Lee, H.O.; Carra, S.; Hyman, A.A.; Alberti, S. An aberrant phase transition of stress granules triggered by misfolded protein and prevented by chaperone function. EMBO J. 2017, 36, 1669–1687. [Google Scholar] [CrossRef] [PubMed]
- Protter, D.S.; Parker, R. Principles and properties of stress granules. Trends Cell Biol. 2016, 26, 668–679. [Google Scholar] [CrossRef] [Green Version]
- Wei, S.C.; Fattet, L.; Tsai, J.H.; Guo, Y.; Pai, V.H.; Majeski, H.E.; Chen, A.C.; Sah, R.L.; Taylor, S.S.; Engler, A.; et al. Matrix stiffness drives epithelial–mesenchymal transition and tumour metastasis through a TWIST1–G3BP2 mechanotransduction pathway. Nat. Cell Biol. 2015, 17, 678–688. [Google Scholar] [CrossRef]
- Panas, M.D.; Ivanov, P.; Anderson, P. Mechanistic insights into mammalian stress granule dynamics. J. Cell Biol. 2016, 215, 313–323. [Google Scholar] [CrossRef]
- Omidifar, N.; Nili-Ahmadabadi, A.; Nakhostin-Ansari, A.; Lankarani, K.B.; Moghadami, M.; Mousavi, S.M.; Hashemi, S.A.; Gholami, A.; Shokripour, M.; Ebrahimi, Z. The modulatory potential of herbal antioxidants against oxidative stress and heavy metal pollution: Plants against environmental oxidative stress. Environ. Sci. Pollut. Res. 2021, 28, 61908–61918. [Google Scholar] [CrossRef]
- Youn, K.; Lee, S.; Jun, M. Discovery of nobiletin from citrus peel as a potent inhibitor of β-amyloid peptide toxicity. Nutrients 2019, 11, 2648. [Google Scholar] [CrossRef] [PubMed] [Green Version]
- Wang, M.; Meng, D.; Zhang, P.; Wang, X.; Du, G.; Brennan, C.; Li, S.; Ho, C.-T.; Zhao, H. Antioxidant protection of nobiletin, 5-demethylnobiletin, tangeretin, and 5-demethyltangeretin from citrus peel in Saccharomyces cerevisiae. J. Agric. Food Chem. 2018, 66, 3155–3160. [Google Scholar] [CrossRef]
- Zhang, L.; Zhang, X.; Zhang, C.; Bai, X.; Zhang, J.; Zhao, X.; Chen, L.; Wang, L.; Zhu, C.; Cui, L.; et al. Nobiletin promotes antioxidant and anti-inflammatory responses and elicits protection against ischemic stroke in vivo. Brain Res. 2016, 1636, 130–141. [Google Scholar] [CrossRef]
- Nakajima, A.; Yamakuni, T.; Haraguchi, M.; Omae, N.; Song, S.-Y.; Kato, C.; Nakagawasai, O.; Tadano, T.; Yokosuka, A.; Mimaki, Y.; et al. Nobiletin, a citrus flavonoid that improves memory impairment, rescues bulbectomy-induced cholinergic neurodegeneration in mice. J. Pharmacol. Sci. 2007, 105, 122–126. [Google Scholar] [CrossRef] [PubMed] [Green Version]
- Nakajima, A.; Aoyama, Y.; Shin, E.-J.; Nam, Y.; Kim, H.-C.; Nagai, T.; Yokosuka, A.; Mimaki, Y.; Yokoi, T.; Ohizumi, Y.; et al. Nobiletin, a citrus flavonoid, improves cognitive impairment and reduces soluble Aβ levels in a triple transgenic mouse model of Alzheimer’s disease (3XTg-AD). Behav. Brain Res. 2015, 289, 69–77. [Google Scholar] [CrossRef] [PubMed]
- Onozuka, H.; Nakajima, A.; Matsuzaki, K.; Shin, R.-W.; Ogino, K.; Saigusa, D.; Tetsu, N.; Yokosuka, A.; Sashida, Y.; Mimaki, Y.; et al. Nobiletin, a citrus flavonoid, improves memory impairment and Aβ pathology in a transgenic mouse model of Alzheimer’s disease. J. Pharmacol. Exp. Ther. 2008, 326, 739–744. [Google Scholar] [CrossRef]
- Nakajima, A.; Aoyama, Y.; Nguyen, T.-T.L.; Shin, E.-J.; Kim, H.-C.; Yamada, S.; Nakai, T.; Nagai, T.; Yokosuka, A.; Mimaki, Y.; et al. Nobiletin, a citrus flavonoid, ameliorates cognitive impairment, oxidative burden, and hyperphosphorylation of tau in senescence-accelerated mouse. Behav. Brain Res. 2013, 250, 351–360. [Google Scholar] [CrossRef]
- Lu, Y.-H.; Su, M.-Y.; Huang, H.-Y.; Yuan, C.-G. Protective effects of the citrus flavanones to PC12 cells against cytotoxicity induced by hydrogen peroxide. Neurosci. Lett. 2010, 484, 6–11. [Google Scholar] [CrossRef]
- Cho, H.W.; Jung, S.Y.; Lee, G.H.; Cho, J.H.; Choi, J.H. Neuroprotective effect of Citrus unshiu immature peel and nobiletin inhibiting hydrogen peroxide-induced oxidative stress in HT22 murine hippocampal neuronal cells. Pharmacogn. Mag. 2015, 11, S284. [Google Scholar] [CrossRef] [Green Version]
- Masjosthusmann, S.; Siebert, C.; Hübenthal, U.; Bendt, F.; Baumann, J.; Fritsche, E. Arsenite interrupts neurodevelopmental processes of human and rat neural progenitor cells: The role of reactive oxygen species and species-specific antioxidative defense. Chemosphere 2019, 235, 447–456. [Google Scholar] [CrossRef]
- Tyler, C.R.; Allan, A.M. Adult hippocampal neurogenesis and mRNA expression are altered by perinatal arsenic exposure in mice and restored by brief exposure to enrichment. PLoS ONE 2013, 8, e73720. [Google Scholar] [CrossRef] [PubMed] [Green Version]
- Marchetto, M.C.; Carromeu, C.; Acab, A.; Yu, D.; Yeo, G.W.; Mu, Y.; Chen, G.; Gage, F.H.; Muotri, A.R. A model for neural development and treatment of Rett syndrome using human induced pluripotent stem cells. Cell 2010, 143, 527–539. [Google Scholar] [CrossRef] [PubMed] [Green Version]
- He, J.; Zhu, G.; Wang, G.; Zhang, F. Oxidative stress and neuroinflammation potentiate each other to promote progression of dopamine neurodegeneration. Oxidative Med. Cell. Longev. 2020, 2020, 6137521. [Google Scholar] [CrossRef] [PubMed]
- Khatoon, R.; Pahuja, M.; Parvez, S. Cross talk between mitochondria and other targets in Alzheimer’s disease. J. Environ. Pathol. Toxicol. Oncol. 2020, 39, 261–279. [Google Scholar] [CrossRef]
- Lourou, N.; Gavriilidis, M.; Kontoyiannis, D. Lessons from studying the AU-rich elements in chronic inflammation and autoimmunity. J. Autoimmun. 2019, 104, 102334. [Google Scholar] [CrossRef]
- Sidibé, H.; Dubinski, A.; Vande Velde, C. The multi-functional RNA-binding protein G3BP1 and its potential implication in neurodegenerative disease. J. Neurochem. 2021, 157, 944–962. [Google Scholar] [CrossRef]
- Sidibé, H.; Vande Velde, C. RNA granules and their role in neurodegenerative diseases. In The Biology of mRNA: Structure and Function; Springer: Berlin/Heidelberg, Germany, 2019; Volume 1203, pp. 195–245. [Google Scholar]
- De Felice, F.G.; Wasilewska-Sampaio, A.P.; Barbosa, A.C.A.; Gomes, F.C.; Ferreira, S.T. Cyclic AMP enhancers and Aβ oligomerization blockers as potential therapeutic agents in Alzheimer’s disease. Curr. Alzheimer Res. 2007, 4, 263–271. [Google Scholar]
- Braidy, N.; Behzad, S.; Habtemariam, S.; Ahmed, T.; Daglia, M.; Mohammad Nabavi, S.; Sobarzo-Sanchez, E.; Fazel Nabavi, S. Neuroprotective effects of citrus fruit-derived flavonoids, nobiletin and tangeretin in Alzheimer’s and Parkinson’s disease. CNS Neurol. Disord.-Drug Targets 2017, 16, 387–397. [Google Scholar] [CrossRef]
- Shimazu, R.; Anada, M.; Miyaguchi, A.; Nomi, Y.; Matsumoto, H. Evaluation of Blood–Brain Barrier Permeability of Polyphenols, Anthocyanins, and Their Metabolites. J. Agric. Food Chem. 2021, 69, 11676–11686. [Google Scholar] [CrossRef]
- Kazak, F.; Akalın, P.P.; Yarım, G.F.; Başpınar, N.; Özdemir, Ö.; Ateş, M.B.; Altuğ, M.E.; Deveci, M.Z.Y. Protective effects of nobiletin on cisplatin induced neurotoxicity in rats. Int. J. Neurosci. 2021, 1–7. [Google Scholar] [CrossRef]
- Blake, J.A.; Ziman, M. Pax genes: Regulators of lineage specification and progenitor cell maintenance. Development 2014, 141, 737–751. [Google Scholar] [CrossRef] [PubMed] [Green Version]
- Semrau, S.; Goldmann, J.E.; Soumillon, M.; Mikkelsen, T.S.; Jaenisch, R.; Van Oudenaarden, A. Dynamics of lineage commitment revealed by single-cell transcriptomics of differentiating embryonic stem cells. Nat. Commun. 2017, 8, 1–16. [Google Scholar] [CrossRef] [PubMed] [Green Version]
- Duan, D.; Fu, Y.; Paxinos, G.; Watson, C. Spatiotemporal expression patterns of Pax6 in the brain of embryonic, newborn, and adult mice. Anat. Embryol. 2013, 218, 353–372. [Google Scholar] [CrossRef] [PubMed] [Green Version]
- López, J.M.; Morona, R.; Moreno, N.; Lozano, D.; Jimenez, S.; González, A. Pax6 expression highlights regional organization in the adult brain of lungfishes, the closest living relatives of land vertebrates. J. Comp. Neurol. 2020, 528, 139–163. [Google Scholar] [CrossRef] [Green Version]
- Avila, J.; Lucas, J.J.; Perez, M.; Hernandez, F. Role of tau protein in both physiological and pathological conditions. Physiol. Rev. 2004, 84, 361–384. [Google Scholar] [CrossRef]
- Witte, H.; Bradke, F. The role of the cytoskeleton during neuronal polarization. Curr. Opin. Neurobiol. 2008, 18, 479–487. [Google Scholar] [CrossRef]
- Grimes, C.A.; Jope, R.S. The multifaceted roles of glycogen synthase kinase 3β in cellular signaling. Prog. Neurobiol. 2001, 65, 391–426. [Google Scholar] [CrossRef]
- Plumb, J.A. Cell sensitivity assays: The MTT assay. In Cancer Cell Culture; Springer: Berlin/Heidelberg, Germany, 2004; pp. 165–169. [Google Scholar]


Publisher’s Note: MDPI stays neutral with regard to jurisdictional claims in published maps and institutional affiliations. |
© 2022 by the authors. Licensee MDPI, Basel, Switzerland. This article is an open access article distributed under the terms and conditions of the Creative Commons Attribution (CC BY) license (https://creativecommons.org/licenses/by/4.0/).
Share and Cite
Jahan, S.; Ansari, U.A.; Siddiqui, A.J.; Iqbal, D.; Khan, J.; Banawas, S.; Alshehri, B.; Alshahrani, M.M.; Alsagaby, S.A.; Redhu, N.S.; et al. Nobiletin Ameliorates Cellular Damage and Stress Response and Restores Neuronal Identity Altered by Sodium Arsenate Exposure in Human iPSCs-Derived hNPCs. Pharmaceuticals 2022, 15, 593. https://doi.org/10.3390/ph15050593
Jahan S, Ansari UA, Siddiqui AJ, Iqbal D, Khan J, Banawas S, Alshehri B, Alshahrani MM, Alsagaby SA, Redhu NS, et al. Nobiletin Ameliorates Cellular Damage and Stress Response and Restores Neuronal Identity Altered by Sodium Arsenate Exposure in Human iPSCs-Derived hNPCs. Pharmaceuticals. 2022; 15(5):593. https://doi.org/10.3390/ph15050593
Chicago/Turabian StyleJahan, Sadaf, Uzair Ahmad Ansari, Arif Jamal Siddiqui, Danish Iqbal, Johra Khan, Saeed Banawas, Bader Alshehri, Mohammed Merae Alshahrani, Suliman A. Alsagaby, Neeru Singh Redhu, and et al. 2022. "Nobiletin Ameliorates Cellular Damage and Stress Response and Restores Neuronal Identity Altered by Sodium Arsenate Exposure in Human iPSCs-Derived hNPCs" Pharmaceuticals 15, no. 5: 593. https://doi.org/10.3390/ph15050593
APA StyleJahan, S., Ansari, U. A., Siddiqui, A. J., Iqbal, D., Khan, J., Banawas, S., Alshehri, B., Alshahrani, M. M., Alsagaby, S. A., Redhu, N. S., & Pant, A. B. (2022). Nobiletin Ameliorates Cellular Damage and Stress Response and Restores Neuronal Identity Altered by Sodium Arsenate Exposure in Human iPSCs-Derived hNPCs. Pharmaceuticals, 15(5), 593. https://doi.org/10.3390/ph15050593