Article

D11-Mediated Inhibition of Protein Kinase CK2 Impairs HIF-1α-Mediated Signaling in Human Glioblastoma Cells

Department of Biochemistry and Molecular Biology, University of Southern Denmark, 5230 Odense, Denmark
*
Author to whom correspondence should be addressed.
Pharmaceuticals 2017, 10(1), 5; https://doi.org/10.3390/ph10010005
Submission received: 1 November 2016 / Revised: 13 December 2016 / Accepted: 22 December 2016 / Published: 1 January 2017

Abstract

:
Compelling evidence indicates that protein kinase CK2 plays an important role in many steps of cancer initiation and progression, therefore, the development of effective and cell-permeable inhibitors targeting this kinase has become an important objective for the treatment of a variety of cancer types including glioblastoma. We have recently identified 1,3-dichloro-6-[(E)-((4-methoxyphenyl)imino)methyl]dibenzo(b,d)furan-2,7-diol (D11) as a potent and selective inhibitor of protein kinase CK2. In this study, we have further characterized this compound and demonstrated that it suppresses CK2 kinase activity by mixed type inhibition (KI 7.7 nM, KI′ 42 nM). Incubation of glioblastoma cells with D11 induces cell death and upon hypoxia the compound leads to HIF-1α destabilization. The analysis of differential mRNA expression related to human hypoxia signaling pathway revealed that D11-mediated inhibition of CK2 caused strong down-regulation of genes associated with the hypoxia response including ANGPTL4, CA9, IGFBP3, MMP9, SLC2A1 and VEGFA. Taken together, the results reported here support the notion that including D11 in future treatment regimens might turn out to be a promising strategy to target tumor hypoxia to overcome resistance to radio- and chemotherapy.

1. Introduction

Glioblastoma is the most common primary tumor of the central nervous system and one of the most lethal types of human cancer. Patients with newly diagnosed glioblastoma have a median survival of approximately one year and respond poorly to all treatment modalities [1,2]. A comprehensive characterization of over 200 samples from patients diagnosed with glioblastoma has provided a detailed map of the many genomic and transcriptional alterations that occur in this type of malignancy and that contribute to its aggressive character [3,4,5]. Overexpression of the epidermal growth factor receptor (EGFR), which is linked to aberrant phosphoinositide 3-kinase (PI3K/AKT) pathway, is among the most frequent aberrations. However, cancer genomic studies have revealed that multiple components of the aforementioned pathway are frequently targeted by germline or somatic mutations contributing to tumor resistance to both radiotherapy and chemotherapy [5]. In this respect, glioblastoma has one of the highest incidence rates of phosphatase and tensin homolog (PTEN) mutation that has been strongly associated with a selective advantage for tumor expansion [6]. Loss of PTEN expression results in hyperactivation of the pro-survival PI3K/AKT pathway and increased resistance to apoptosis [7].
All tumors require active angiogenesis for expansion and glioblastoma is a highly vascularized type of cancer exhibiting increased expression of many pro-angiogenic genes such as vascular endothelial growth factor (VEGF) and fibroblast growth factor (FGF) [8]. Despite the extended vascularization, glioblastoma is highly heterogeneous and dominated by areas with low oxygen supply and compromised vascular integrity [9].
One of the major events in hypoxia adaptation is the induction of the hypoxia inducible factor 1 (HIF-1α) a transcription factor that regulates multiple intracellular processes including glycolysis, angiogenesis, immortalization, tissue invasion and metastasis, genetic instability and cell death (reviewed in [10]). From a therapeutic standpoint, hypoxia, genomic and tumor-tissue heterogeneity are a major clinical hurdle emphasizing the importance to set up tailored therapeutic strategies able to tackle the heterogeneous nature of brain cancer. Up-regulation of HIF-1α leads to a rapid response in hypoxic cells. Thus, identification of compounds able to block HIF-1α or its target genes for inhibiting tumor growth has become a top priority in many research laboratories.
We have recently identified 1,3-dichloro-6-[(E)-((4-methoxyphenyl)imino)methyl]dibenzo-(b,d)furan-2,7-diol (hereafter referred to as D11) as a potent and selective inhibitor of protein kinase CK2 [11,12]. CK2 is a highly conserved and constitutively active serine/threonine protein kinase whose expression levels have been found invariably elevated in highly proliferating cells. CK2 is implicated in multiple cellular functions as well as in cell transformation and tumorigenesis [13,14,15,16,17]. Recent data from our laboratory have demonstrated that D11 treatment induces apoptosis in brain and pancreatic cancer cells through a mechanism involving down-regulation of the PI3K/AKT and NF-κB signaling cascades [12]. Interestingly, inhibition of CK2 has been shown to decrease HIF-1α activity under hypoxia through elevated p53 expression levels [18].
Since the high incidence of PTEN mutation observed in glioblastoma cells has been strongly associated with stimulation of HIF-1α-mediated gene expression and increased apoptotic resistance [6], we investigated whether D11-mediated cell death induction was accompanied by destabilization and/or inhibition of HIF-1α transcription factor and, if so, how does D11 influence the expression of genes regulated by HIF-1α under hypoxic conditions. Results shown in this study suggest that D11 may exert anti-tumor activity by negatively affecting cellular pathways that are normally up-regulated under low oxygen tension and warrant in vivo studies for endorsing its efficacy in the treatment of multi-drug resistant human cancers.

2. Results

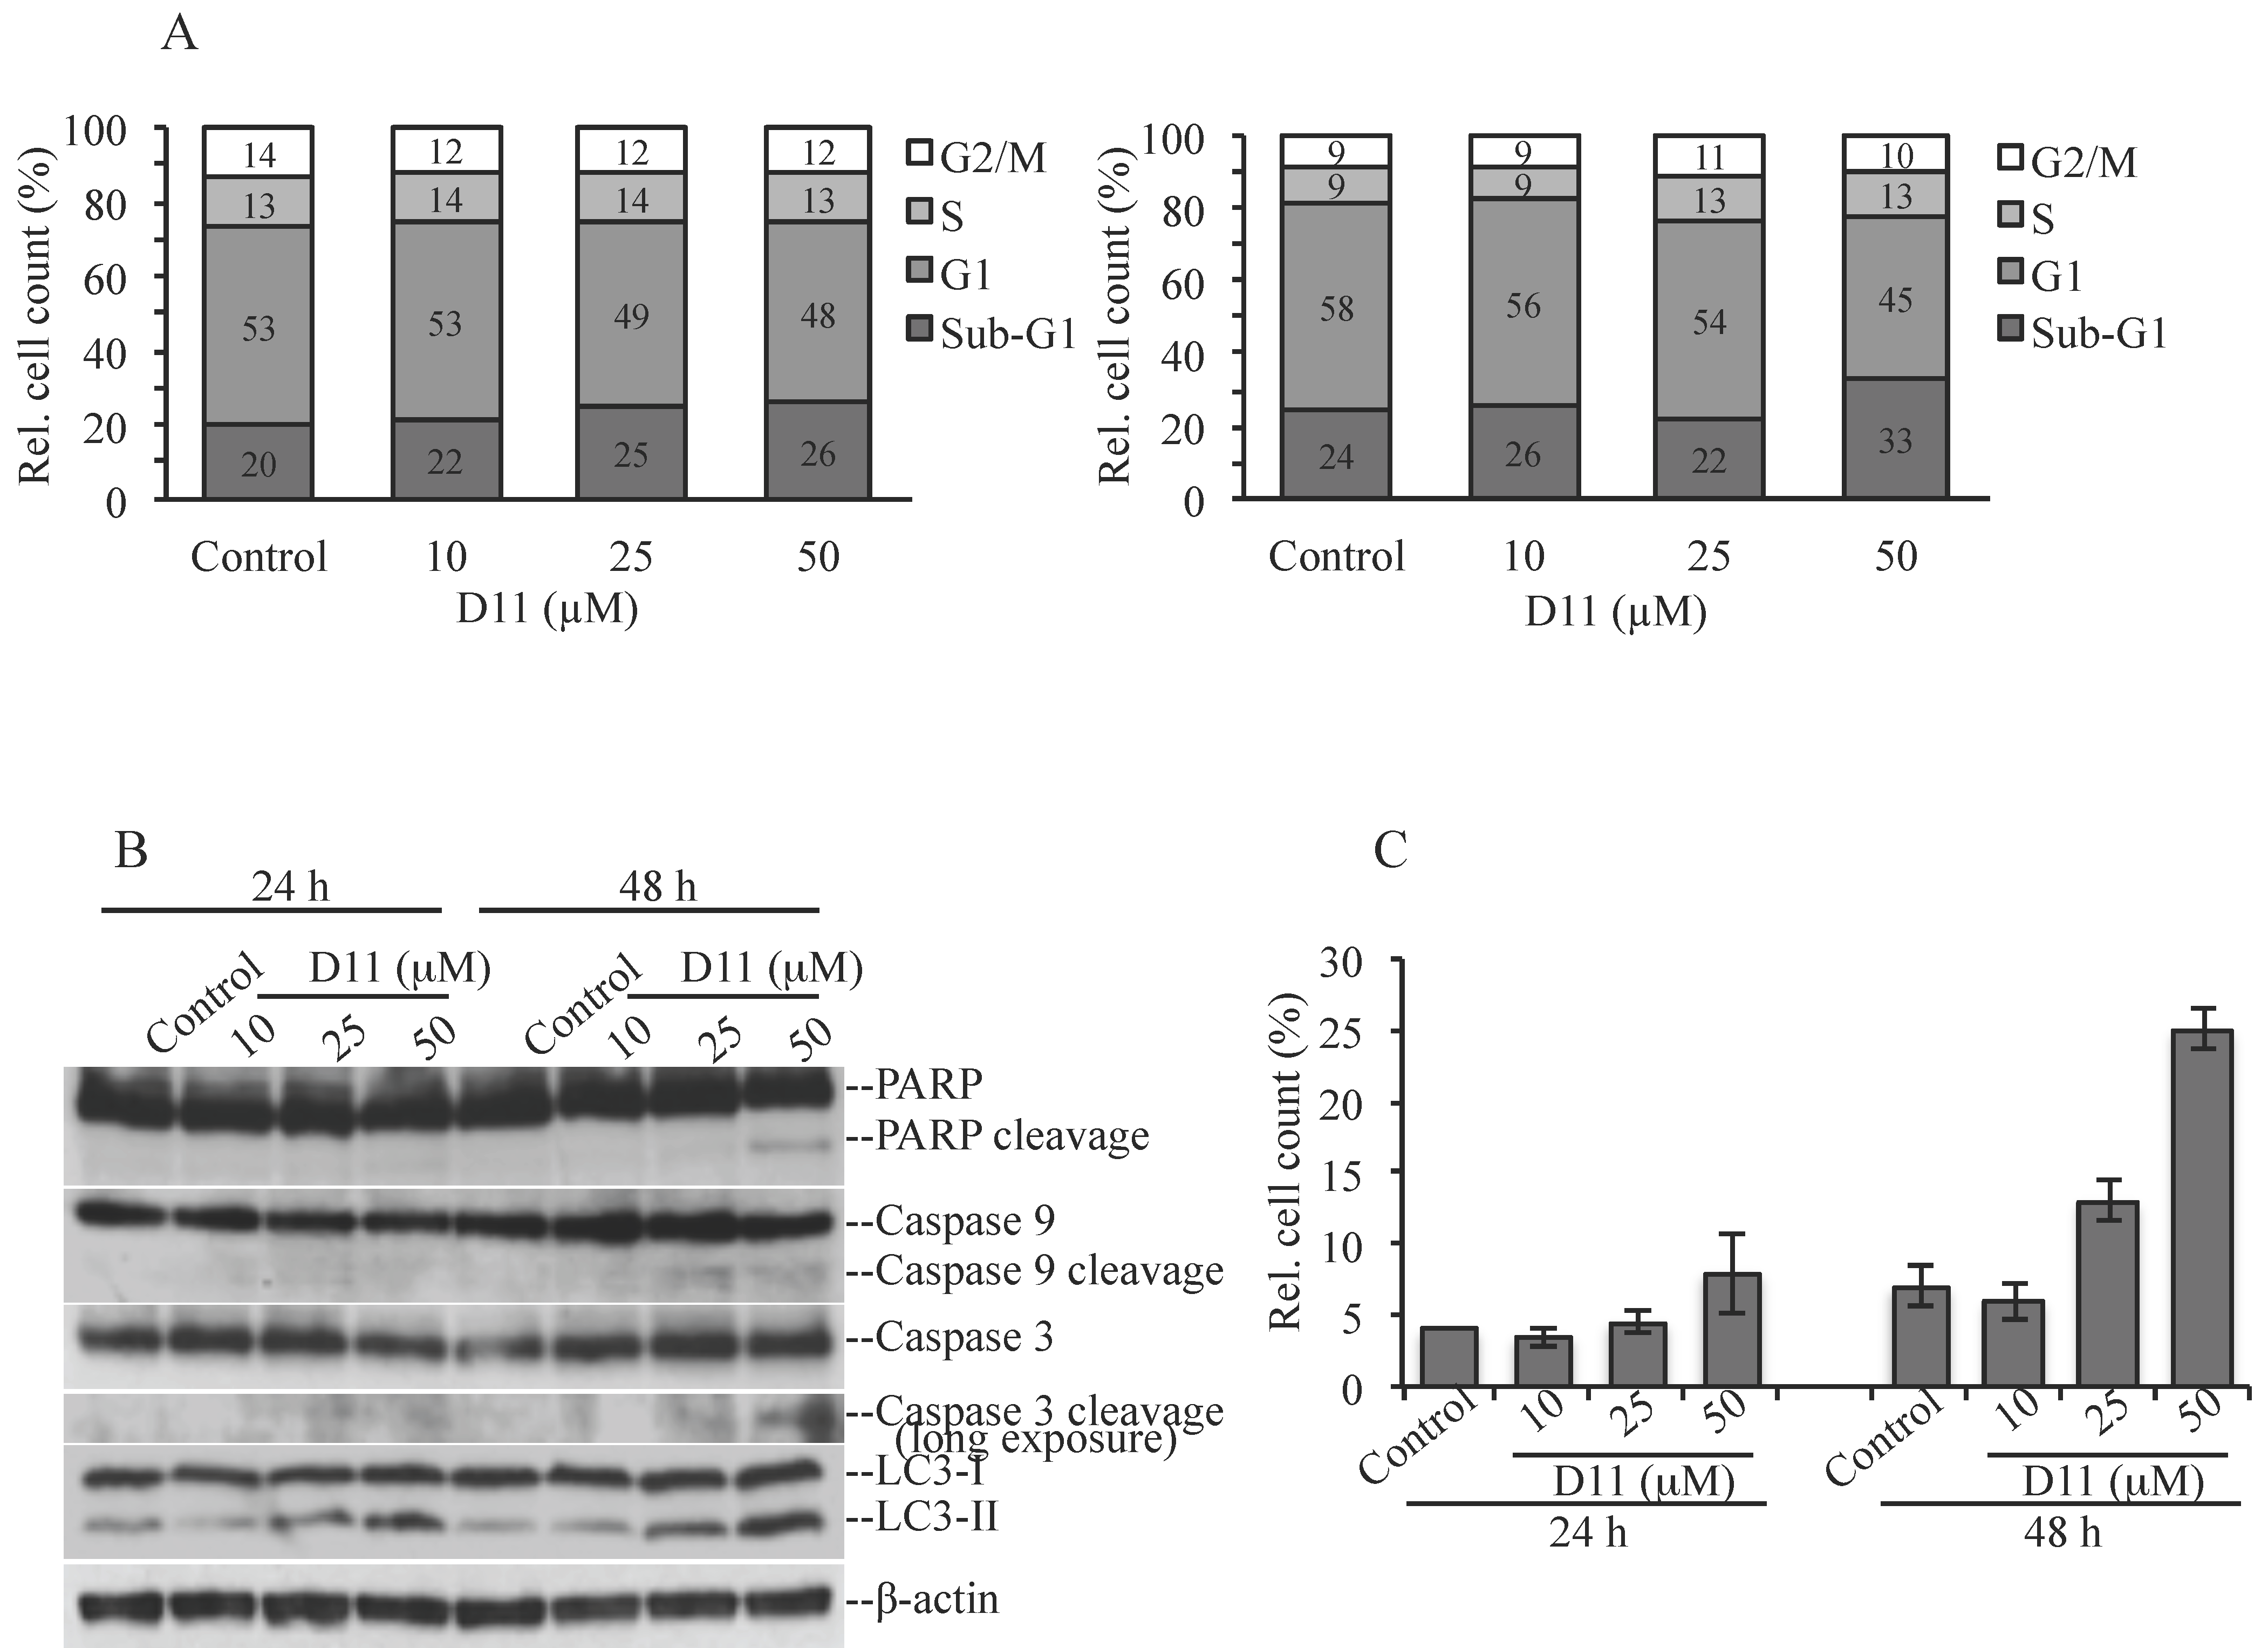
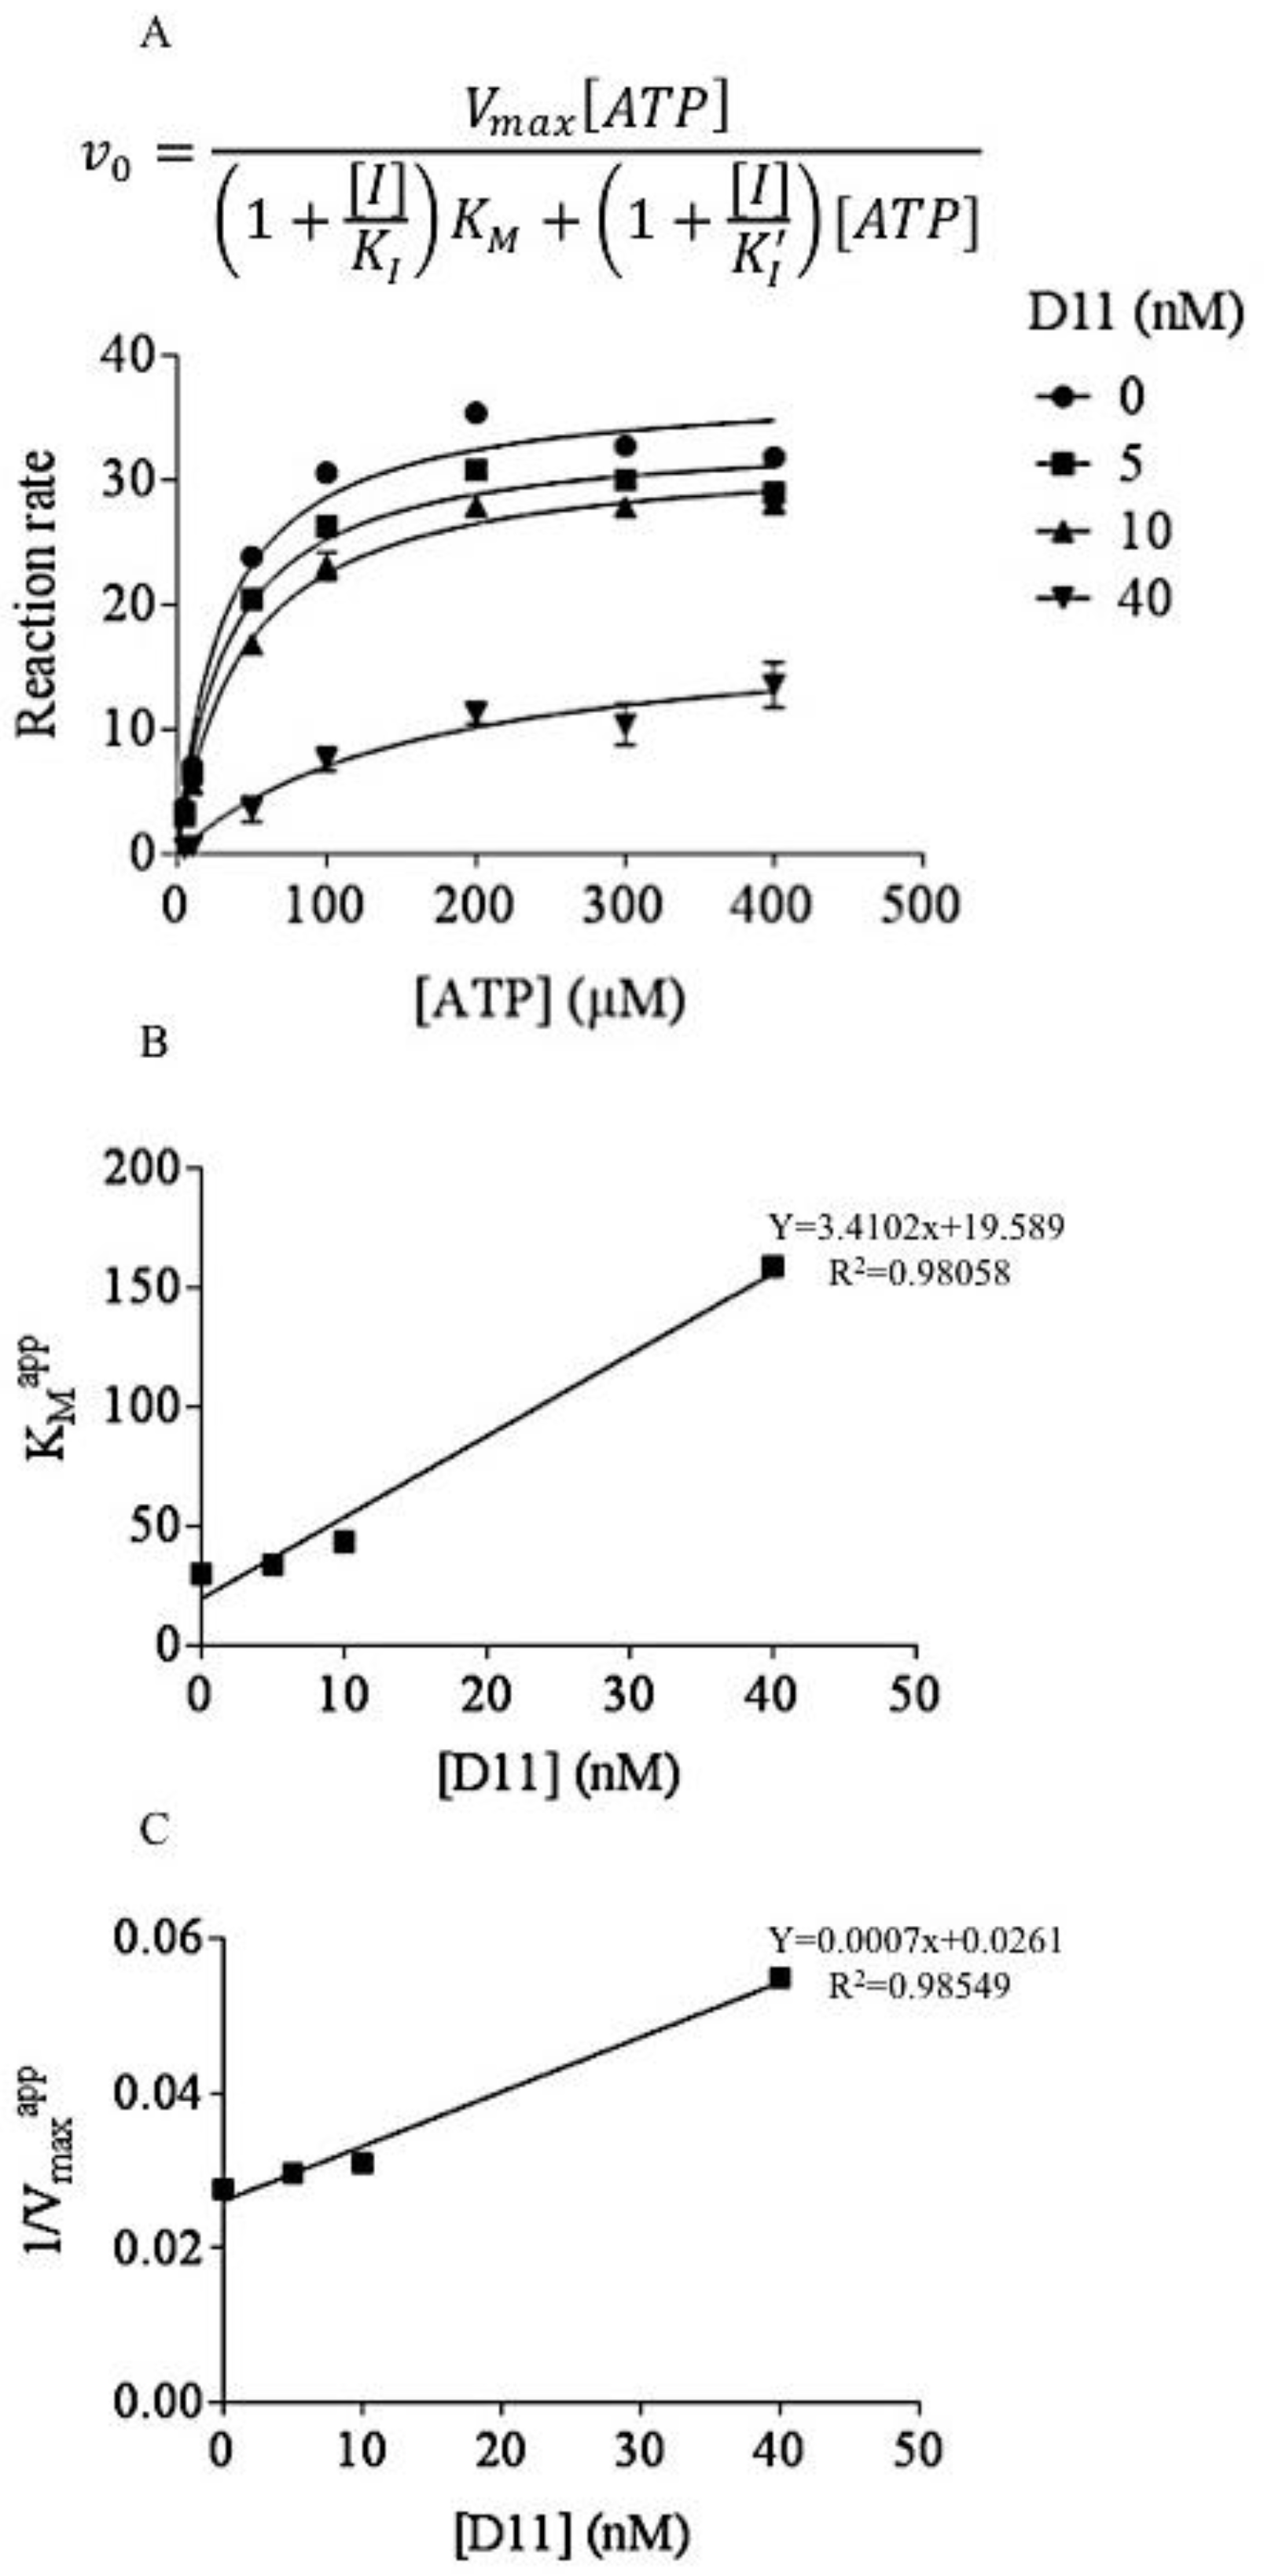
2.1. D11 is A CK2 Inhibitor That Leads to Cell Death in Glioblastoma Cells

D11 was identified employing the catalytic α-subunit of protein kinase CK2 following a screening of a small-molecule compound library of the Diversity Set III under the drug discovery and therapeutic program (DTP) of the National Cancer Institute (NCI, Rockville, MD, USA, [11]). Kinetic measurements revealed that this compound inhibits the catalytic activity of both CK2α and CK2 holoenzyme in the low nM range [11]. Furthermore, the screening of 354 protein kinases revealed that D11 is a selective inhibitor of CK2. By setting the threshold for inhibition to >98%, only three protein kinases were found inhibited to an extent observed with CK2 [11].
In this study, we carried out experiments in order to further characterize the type of inhibition exerted by D11 on CK2. Interestingly, increasing concentrations of co-substrate (i.e., ATP) tested with three different concentrations of inhibitor, respectively, resulted in decreased apparent maximum velocity (Vappmax) and increased apparent KM (KappM) values suggesting a linear mixed-type inhibition against ATP as can be seen from the Michaelis-Menten plots (Figure 1A). Non-linear least-squares fits of the curves in Figure 1A to rectangular hyperbolas were used to determine the apparent KM and Vmax values resulting from the effect of different concentrations of inhibitor. From the estimated apparent KM and Vmax values we created re-plots for the determination of KI (dissociation constant for binding of D11 to the free enzyme, 7.7 nM, Figure 1B) and KI′ (dissociation constant for binding of D11 to the enzyme-substrate complex, 42 nM, Figure 1C).
We previously showed that viability of the human glioblastoma cell line U-87 MG decreased by 50% following treatment with 25 μM D11 for 24 h [12]. Here, we carried out a cell cycle analysis by flow cytometry and asked the question whether D11 treatment induced cell death (Figure 2). Cells were treated with increasing concentrations of D11 for 24 h (Figure 2A, left bar graph) and 48 h (Figure 2A, right bar graph), respectively. As compared to control experiments, cells were not significantly affected by treatment with 50 μM D11 for 24 h (Figure 2A, left bar graph). However, incubation of cells with 50 μM D11 for 48 h was accompanied by a modest increase in the percentage of cells in sub-G1 phase indicative of cells that have undergone DNA degradation (Figure 2A, right bar graph). Next, Western blot analysis was carried out in order to determine the type of cell death. As shown in Figure 2B, treatment with 50 μM D11 for 48 h was necessary for inducing cleavage of full-length PARP, caspase 9 and caspase 3. However, a shorter incubation time (i.e., 24 h) was sufficient to induce increased LC3-II signal as compared to control cells suggesting induction of autophagy, in a time and concentration-dependent manner. The staining of cells with acridine orange (Figure 2C), a vital dye, which accumulates in acidic compartments emitting red fluorescence indicative of autophagic vacuoles formation, further confirmed results reported above.

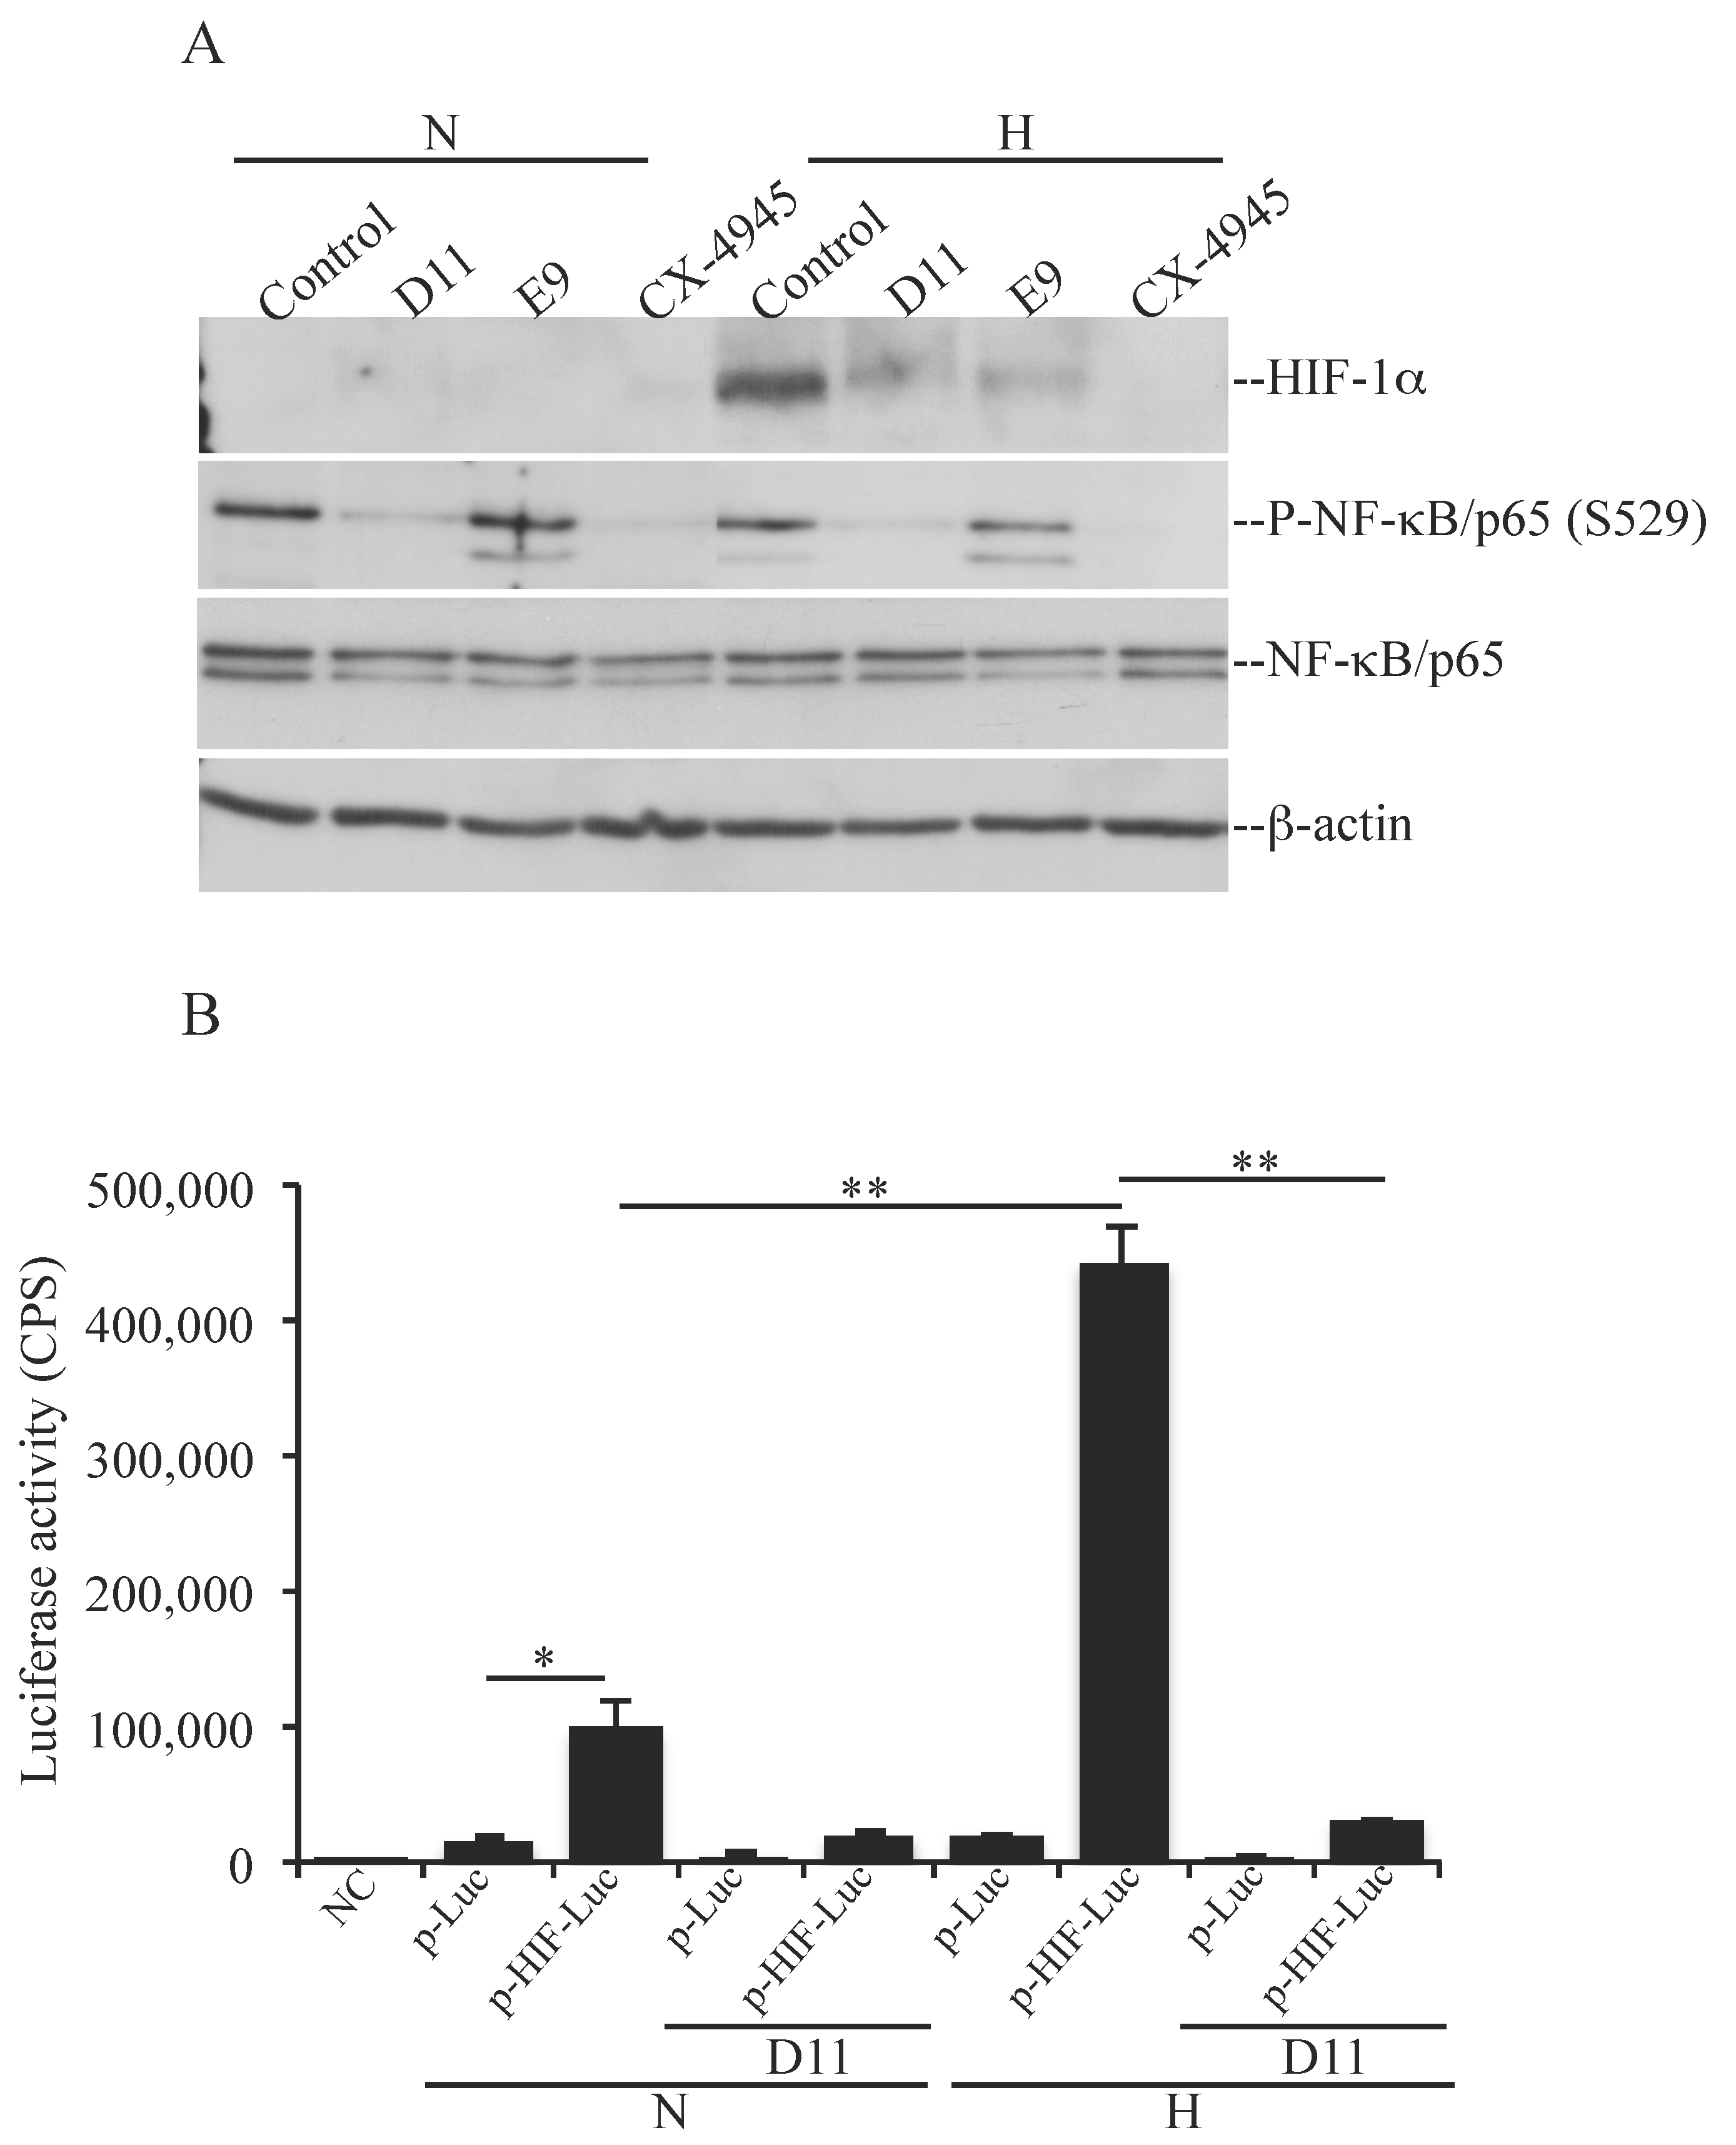
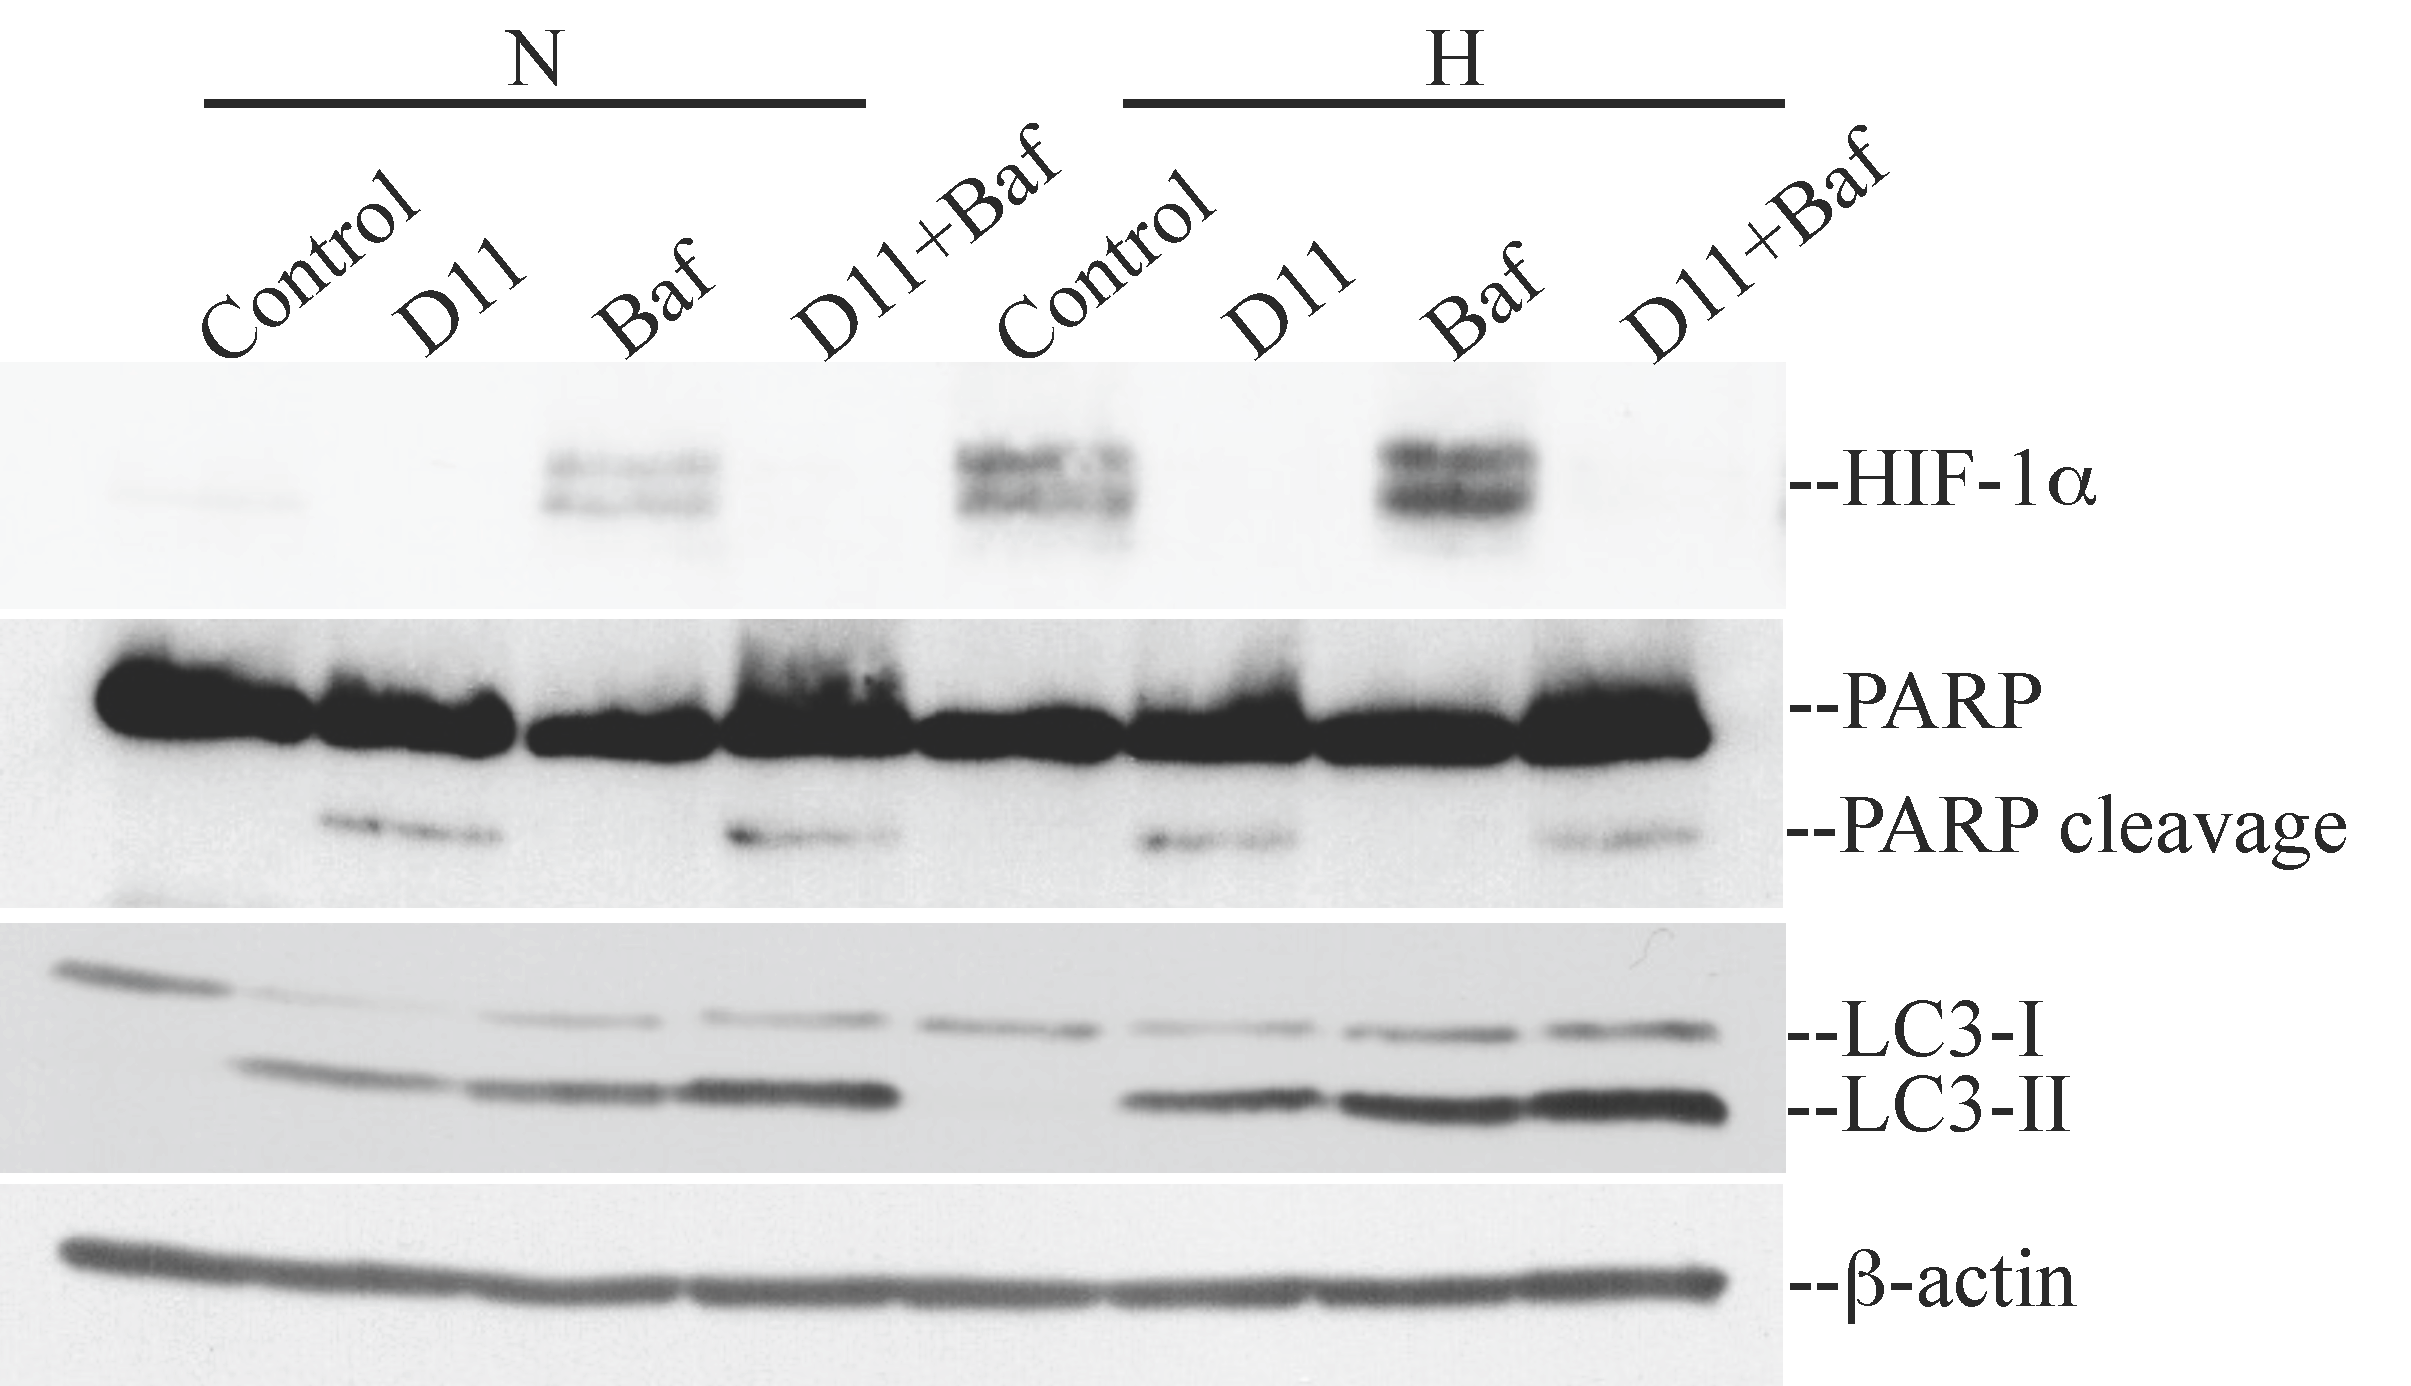
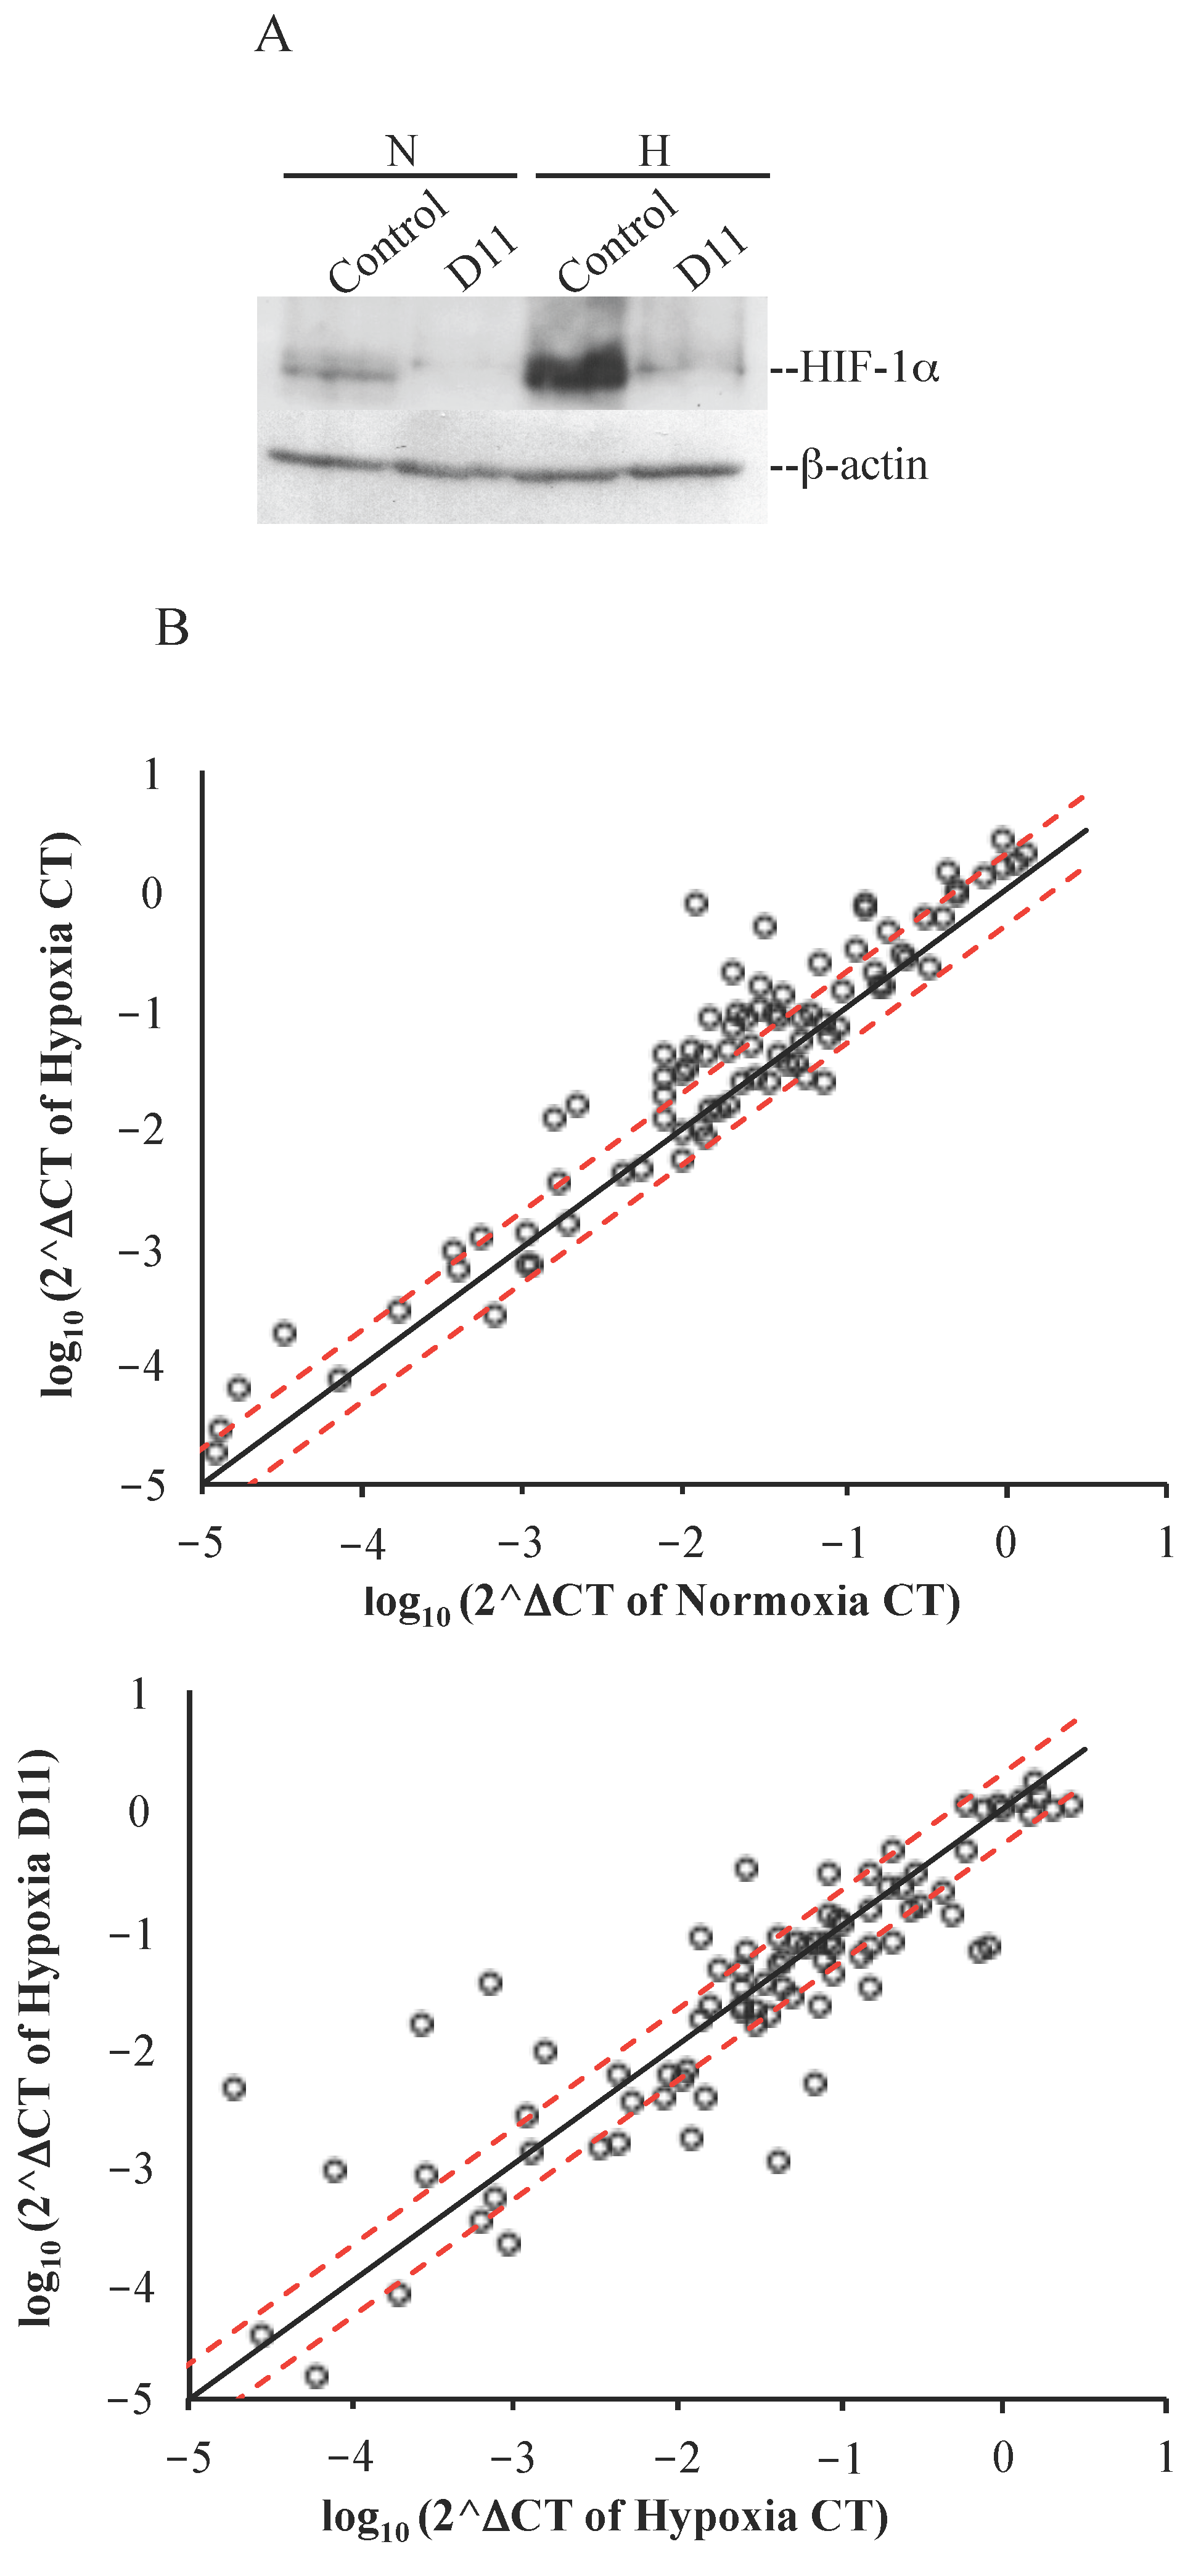
2.2. D11 Treatment Abolishes HIF-1α Transcriptional Activity and Results in Increased Activation of Autophagy under Hypoxia in Glioblastoma Cells

HIF-1 is a heterodimeric transcription factor consisting of two subunits; i.e., HIF-1β, which is constitutively expressed, and HIF-1α whose expression is regulated by oxygen levels. Stabilization of HIF-1α occurs under hypoxic conditions and leads to translocation into the nucleus where it induces the transcription of numerous genes as part to the hypoxia response (reviewed in [10]). Tumor suppressor genes encoding proteins such as the Von Hippel-Lindau (VHL) and PTEN have been reported to inhibit HIF-1α function. In particular, PTEN has been demonstrated to inhibit HIF-1α stabilization by antagonizing the PI3K pathway [6,19,20]. As U-87 MG cells contain mutant PTEN [21], we asked whether D11-mediated inhibition of CK2 resulted in HIF-1α destabilization and if this event had implications for the activation of cell death. To accomplish this, we compared the levels of expression of HIF-1α in cells treated with vehicle (0.1% DMSO), D11 or other known CK2 inhibitors under normoxia and hypoxia, respectively (Figure 3A). Under hypoxic conditions, U-87 MG cells showed induction of HIF-1α. Moreover, treatment with the indicated compounds resulted in inhibition of endogenous CK2 to various extents as indicated by decreased phosphorylation of NF-κB/p65 at S529 a known CK2 phosphorylation site [22]. Results shown in Figure 3A indicate that cell incubation with D11, E9 or CX-4945 resulted in destabilization of HIF-1α indicated by the reduced HIF-1α protein band intensity as compared to control experiments. Next, we analyzed whether D11 affected HIF-1α transcriptional activity employing a Luciferase reporter assay (Figure 3B).
Cells were transfected with p-HIF1-Luc reporter vector able to express firefly luciferase under the control of a HIF-1-response element (p-HIF-Luc). As a negative control, cells were transfected with a vector lacking the specific response element (p-Luc). The transcription activity of HIF-1α increased dramatically under hypoxic conditions (i.e., 443128 CPS) as compared to its activity under normoxia (i.e., 98746 CPS). Upon treatment with 50 μM D11 for 24 h, luciferase activity induced by HIF-1α stabilization was drastically reduced (i.e., 31917 CPS) under hypoxia supporting the notion that D11 impairs the transcriptional activity of HIF-1α. In order to determine whether destabilization of HIF-1α had an influence on cell death, cells were incubated with D11 under normoxia and hypoxia, respectively. As shown in Figure 4, the exposure of cells to hypoxia did not result in higher PARP cleavage, however, it resulted in higher levels of autophagy induction as compared to cells grown under normoxia. Experiments carried out in the absence or presence of bafilomycin A1, which blocks fusion of autophagosomes with lysosomes, revealed that D11 treatment leads to enhanced autophagic flux indicated by a further increase in LC3-II levels in the presence of bafilomycin A1.

2.3. Cell Incubation with D11 Results in Altered Gene Expression Profile Induced by Hypoxia

Stabilization of HIF-1α in the absence of oxygen stimulates the expression of numerous hypoxia-response genes that promote the survival of cancer cells in an unfavorable environment. In order to investigate differential mRNA expression in glioblastoma cells resulting from D11 treatment under hypoxic conditions, we analyzed the expression of 84 genes that respond to low oxygen levels using the human hypoxia-signaling pathway RT2 Profiler PCR array. Cells were grown under normoxic or hypoxic conditions for 24 h and incubated either with vehicle (0.1% DMSO) or 50 μM D11 for the same length of time. Based on scatter plot analysis (Figure 5B, upper plot), a number of known HIF-1α-target genes were found up-regulated in control cells in response to hypoxia (CTH vs. CTN, fold-change ≥ 2, Table 1). In particular, the strongest up-regulation was observed in the case of angiopoietin-like 4 (ANGPTL4), Bcl2/adenovirus E1B 19 kDa interacting protein 3 (BNIP3), carbonic anhydrase IX (CA9), DNA-damage-inducible transcript 4 (DDIT4), coagulation factor III (F3), insulin-like growth factor binding protein 3 (IGFBP3), lysyl oxidase (LOX), matrix metallopeptidase 9 (MMP9), N-myc downstream regulated 1 (NDRG1), solute carrier family 2 member 1 (SLC2A1) and vascular endothelial growth factor A (VEGFA). In contrast, when we analyzed the genes that showed differential expression under hypoxic conditions and looked at their up- or down-regulation in response to D11 treatment (i.e., D11H vs. CTH), we noticed that most of them failed to become up-regulated or appeared to be partially down-regulated (Figure 5B, lower plot and Table 1). However, strong down-regulation was observed in the case of F3, 6-phosphofructo-2-kinase/fructose-2,6-bisphosphatase 4 (PFKFB4), solute carrier family 16 member 3 (SLC16A3) and VEGFA (Table 1). HIF-1α protein expression levels increased under hypoxic conditions (Figure 5A). Conversely, consisting with data reported earlier [23,24], up-regulation of HIF-1α was not accompanied by a change in its mRNA levels in cells exposed to hypoxia as compared to cells incubated under normoxia. Interestingly, D11 treatment resulted in decreased expression of HIF-1α protein but not mRNA levels under hypoxia (results not shown) suggesting alternative D11-mediated mechanisms of regulation of HIF-1α.

3. Discussion

Hypoxia is a critical condition for many types of cancers because it signals adaptation of cells to an anaerobic environment achieved by induction of gene expression. Limited oxygen diffusion is frequently observed in the glioma microenvironment and it has been associated with poor prognosis, increased metastasis, angiogenesis and resistance to radio- and chemotherapy. The stabilization of HIF-1α transcription factor is one of the most critical events occurring under hypoxia, as it is the primary factor responsible for many of the effects observed in aggressive tumors. Hence, it is not surprising that HIF-1α has become an important target for drug development in recent years as blocking HIF-1α activity would help starve growing tumors of oxygen and nutrients.
Our in vitro data show that treatment of cells with D11, a small-molecule inhibitor of protein kinase CK2, results in destabilization of HIF-1α protein under hypoxic conditions. Similar results were also reported in the case of other CK2 inhibitors (i.e., E9, CX-4945 and quercetin, [25]). It has been demonstrated that HIF-1α mRNA levels do not vary under hypoxic conditions [23,24]. Accordingly, the analysis of gene expression data did not reveal any significant differences in the expression of HIF-1α in cells growing under normoxia or exposed to hypoxia in the absence and presence of D11, respectively, suggesting that regulation of HIF-1α expression occurs at the post-translational level. Apart from CK2 inhibitors, other compounds can induce HIF-1α destabilization. The small molecule inhibitor YC-1 [3-(-5′-hydroxymethyl-2′-uryl)-1-benzylindazole] was shown to reduce HIF-1α levels and xenograft growth of various human tumors through mechanisms yet to be elucidated [26]. Under hypoxic conditions, HIF-1α stability is dependent on its interaction with the chaperone HSP-90 and cell incubation with the HSP-90 inhibitor 17-allylamino-17-demethoxygeldanamycin (17-AAG) has been shown to induce HIF-1α degradation in a VHL-independent manner [27,28,29].
The activity of chaperone proteins is dependent on their interaction with co-chaperone proteins and co-activators [30]. Compelling evidence has indicated that CK2-mediated phosphorylation of the co-chaperone CDC37 is essential for stabilization of HSP-90-CDC37 heterocomplex and its interaction with client protein kinases (reviewed in [31]). Hence, HIF-1α degradation observed in cells incubated with D11 under hypoxia might result from disruption of HSP-90-CDC37 interaction as cell treatment with this inhibitor has been reported to reduce CDC37 phosphorylation [11] and destabilize HSP-90-CDC37 heterocomplex [12].
Induction of autophagy was found significantly enhanced in U-87 MG cells following incubation with D11 for 24 and 48 h, respectively. At presence, it is not possible to assert whether induction of autophagy constitutes a stress adaptation conferring cytoprotection or an alternative cell death mechanism. However, the fact that PARP cleavage becomes visible after 48 h of incubation with D11 does not exclude that autophagy might develop as a primary response to stress stimuli in the first 24 h of incubation with the inhibitor and triggers apoptosis to kill cancer cells following a longer incubation time. This sequence of events has been shown to occur in the case of CD4/CXCR4-expressing T cells after binding of HIV-1 envelope proteins [32].
The hypoxic response includes the induction of a variety of pro-angiogenic genes. Specifically, the gene expression analysis identified strong up-regulation of ADM, ANGPTL4 and VEGFA (Table 1). Conversely, the expression of these genes was found down-regulated in cells treated with D11 under hypoxia suggesting that D11 antagonizes the transcription of pro-angiogenesis genes through mechanisms that may be dependent or not on HIF-1α expression status.
Under hypoxic conditions, cells use glycolysis as a primary mechanism of ATP production. This metabolic switch is encouraged by stabilization of HIF-1α, which induces the expression of genes involved in metabolic adaptation including glucose uptake and the glycolytic pathway. Indeed, the expression of several of the genes involved in glucose metabolism (i.e., HK1 and -2, GLUT1 and -3, GYS1, LDHA, PDK1, PFKFB3 and -4) was found up-regulated under hypoxia and marginally or largely down-regulated when cells were additionally treated with D11 (Table 1). This suggests that D11 treatment severely deprives cancer cells of oxygen and nutrient supply by suppressing the oxygen-independent metabolic pathway.
There is ample evidence that changes in metabolic activity observed in cancer cells influence the intracellular pH. Glycolysis is thought to be the major mechanism responsible for lowering the pH. Evidence indicates that the activity of carbonic anhydrase (CA9), which converts carbon dioxide and water to carbonic acid, is strongly induced in hypoxia contributing to low pH of the tumor. High expression levels of CA9 have been associated with poor prognosis [33]. Our results are consistent with previous studies investigating gene expression in response to hypoxia. Accordingly, the expression of CA9 was found largely up-regulated under hypoxia (i.e., 10.768 fold-change as compared to CTN), however, treatment of cells with D11 resulted in a −2.924 fold-change of CA9 with respect to CTH suggesting that D11 compromises another important adaptation of tumor cells which seems to be essential for promoting tumor invasion. In this respect, it has been shown that many proteases are activated under acidic conditions promoting tumor invasion of surrounding tissue [34].
N-myc downstream-regulated gene 1 (NDRG1) is a member of the NDRG gene family, which is expressed ubiquitously in tissues in response to various stress conditions including cellular differentiation, tumor progression and metastasis, DNA damage and hypoxia. Expression of NDRG1 in response to low oxygen concentrations is HIF-1α-regulated, as induction of NDRG1 does not occur in HIF-1α−/− mouse embryo fibroblasts. However, an increase in intracellular Ca2+ seems to be sufficient to induce NDRG1 mRNA expression in HIF-1α-deficient cells under hypoxia (reviewed in [35]). A number of research groups have shown that NDRG1 over-expression decreases tumor growth, reduces invasion and suppresses metastasis [36,37]. However, Salnikow et al., demonstrated that NDRG1 expression is dramatically increased in aggressive prostate cancer cells [38]. In our study, NDGR1 expression was found elevated (15.150 fold-change) under hypoxia while additional incubation with D11 resulted in a −3.6 fold-change (Table 1). There appears no clear connection in the effect of Ca2+ and HIF-1α on NDRG1 induction in cancer cells. Hence, it is likely that when oxygen levels decrease, NDRG1 induction is linked to intracellular mechanisms somewhat unrelated to metastasis and cell growth yet to be elucidated.
Finally, analysis of the gene expression array also revealed that two hypoxia-responsive genes involved in cell adhesion, invasion and vascular remodeling (i.e., ANKRD37 and MMP9) were found largely down-regulated in D11 treated cells. Suppression of ANKRD37 and MMP9 expression may explain, at least in part, D11-mediated impaired migration of glioblastoma and pancreatic cancer cells reported previously [12] and indicates that treatment of glioblastoma cells with this compound compromises cell migration and invasion by suppressing the expression of proteins that are crucial in the metastatic process.

4. Materials and Methods

4.1. Cell Culture and Hypoxia

The human glioblastoma cell line U-87 MG was purchased from the American Type Culture Collection (ATCC, Rockville, MD, USA) and cultivated at 37 °C under a 5% CO2 atmosphere in Dulbecco’s modified Eagle’s medium (DMEM, Invitrogen, Taastrup, Denmark) supplemented with 10% fetal bovine serum (FBS, Biochrom AG, Berlin, Germany). Cells were treated with 4-[(E)-(fluoren-9-ylidenehydrazinylidene)-methyl] benzoic acid (referred to as E9, [25]), D11 (both from DTP, NIH/NCI, Rockville, MD, USA) or CX-4945 (Selleck Chemicals, Houston, TX, USA) as indicated in the figure legends. Hypoxia (1% O2) experiments were carried out according to [39]. Where indicated, cells were treated with 100 nM bafilomycin A1 (Sigma-Aldrich, Brøndby, Denmark) for 6 h.

4.2. Radioactive Kinase Assay

The kinase activity of human recombinant CK2α1−3352β2 was determined in the presence of the CK2 synthetic peptide RRRADDSDDDDD (100 μM), increasing concentrations of ATP (i.e., 5, 10, 50, 100, 200, 300 and 400 μM) and inhibitor as indicated in the figure legends and essentially as described elsewhere [40]. Kinetic parameters (i.e., KM and Vmax) were calculated using GraphPad Prism version 6.0 computer software (GraphPad Software Inc., San Diego, CA, USA) based on the Michaelis-Menten plots. KI values were determined from the re-plots where apparent KM values and apparent Vmax values were plotted against inhibitor concentration, respectively.

4.3. Cell Cycle Analysis by Flow Cytometry

Propidium iodide staining of cells and flow cytometry analysis were performed essentially as previously described [41]. Autophagy was analyzed by staining cells with 1 μg/mL acridine orange (Sigma-Aldrich) for 15 min prior harvesting by trypsinization and flow cytometry analysis.

4.4. Preparation of Whole Cell Lysate, Western Blot Analysis and Antibodies

Western blot analysis of whole cell lysate was performed as reported in [41]. The following primary antibodies were employed in the study: rabbit monoclonal anti-NF-κB/RelA and rabbit monoclonal anti-LC3 (both from Cell Signaling Technology, Beverly, MA, USA); mouse monoclonal anti-β-actin (Sigma-Aldrich); rabbit polyclonal anti-phospho-NF-κB/p65 (S529, Abcam, Cambridge, MA, USA); mouse monoclonal anti-PARP and mouse monoclonal anti-HIF-1α (both from BD Biosciences, San Jose, CA, USA).

4.5. Luciferase Reporter Assay

Determination of the transcriptional activity of HIF-1α was carried out with whole cell lysate (10 μg) from cells transfected with a luciferase reporter vector (Panomics, Affymetrix, Santa Clara, CA, USA) carrying a control sequence or HIF-1α consensus element. Transfection of cells was performed with Lipofectamine 2000 according to the manufacturer’s (Invitrogen) guidelines. After 24 h from transfection, cells were added 50 μM D11 for additional 24 h before harvesting. Cells were grown under normoxia or hypoxia in the last 24 h of incubation time as indicated in the figure legends. Determination of luciferase activity was performed employing the Luciferase Assay System kit (Promega, Stockholm, Sweden) according to the manufacturer’s recommendations. Luminescence was measured with a Perkin Elmer Victor Light 1420 luminescence counter (Perkin Elmer, San Diego, CA, USA).

4.6. Gene Expression Analysis by Quantitative RT-PCR Array

Total RNA samples preparation from cells treated as described in the figure legends was carried out by phenol-chloroform extraction and subsequent silica-membrane-based purification in combination with on-column DNAse digestion with the miRNeasy kit (Qiagen, Hilden, Germany) following the manufacturer’s instructions. RNA integrity was assessed by agarose gel analysis. The cDNA was prepared using the RT2 First strand kit (Qiagen). The expression analysis of 84 genes associated with hypoxia was carried out with the Qiagen RT2 Profiler PCR array according to the manufacturer’s guidelines in 96-well plates with a StepOnePlusTM real-time cycler (Applied Biosystems, Nærum, Denmark). Data were normalized to five housekeeping genes included in the kit. Normalized data were analyzed using the ΔΔCt method with the equation ΔΔCt = ΔCt (experimental sample group) − ΔCt (control group), and the fold-change was calculated based on ΔΔCt with 2−ΔΔCt for positive changes or with −1/2−ΔΔCt for negative changes [42,43].

4.7. Statistical Analysis

Statistical significance of differences between means of two groups was determined by the two-tailed t-test (student’s t-test). The levels of significance are indicated in the figure legends.

5. Conclusions

Hypoxic adaptation is a frequently occurring event in tumor growth and it is associated to a more invasive phenotype and resistance to conventional treatment. This has been unequivocally demonstrated in the case of brain cancer. Hence, the identification of new therapeutic strategies targeting HIF-1α represents an attractive alternative option to the current treatment modalities. Our data show that incubation of glioblastoma cells with D11 results in rapid HIF-1α destabilization and impaired transcriptional activity. Gene expression analysis show that reduced HIF-1α expression in response to D11 treatment is accompanied by down-regulation of genes involved in angiogenesis, glucose metabolism, pH regulation, cell adhesion and invasion. Collectively, these results suggest that the combination of D11, or more potent derivatives, with existing treatments may prove to be an effective strategy in the clinics for the cure of brain cancer in the future.

Acknowledgments

The authors wish to thank Olaf-Georg Issinger (University of Southern Denmark) for critically reading the manuscript and Lars Folke Olsen (University of Southern Denmark) for fruitful discussions and assisting with the kinetic analysis. We thank the Drug Synthesis and Chemistry Branch, Developmental Therapeutics Program, National Cancer Institute, USA, for providing us with vialed samples and the Danish Council for Independent Research-Natural Sciences (Grant 1323-00212A to Barbara Guerra).

Author Contributions

Susanne Schaefer performed a large part of the experiments and contributed to the data analysis. Tina H. Svenstrup carried out part of the kinetic analysis and Mette Fischer performed part of the experiments involving cell cycle and Western blot analysis. Barbara Guerra conceived the study, contributed to the data analysis and wrote the manuscript.

Conflicts of Interest

The authors declare no conflict of interest.

References

  1. Louis, D.N.; Ohgaki, H.; Wiestler, O.D.; Cavenee, W.K.; Burger, P.C.; Jouvet, A.; Scheithauer, B.W.; Kleihues, P. The 2007 WHO classification of tumours of the central nervous system. Acta Neuropathol. 2007, 114, 97–109. [Google Scholar] [CrossRef] [PubMed] [Green Version]
  2. Louis, D.N.; Perry, A.; Reifenberger, G.; von Deimling, A.; Figarella-Branger, D.; Cavenee, W.K.; Ohgaki, H.; Wiestler, O.D.; Kleihues, P.; Ellison, D.W. The 2016 World Health Organization Classification of Tumors of the Central Nervous System: A summary. Acta Neuropathol. 2016, 131, 803–820. [Google Scholar] [CrossRef] [PubMed]
  3. Cancer Genome Atlas Research Network. Comprehensive genomic characterization defines human glioblastoma genes and core pathways. Nature 2008, 455, 1061–1068. [Google Scholar]
  4. Verhaak, R.G.W.; Hoadley, K.A.; Purdom, E.; Wang, V.; Qi, Y.; Wilkerson, M.D.; Miller, C.R.; Ding, L.; Golub, T.; Mesirov, J.P.; et al. Integrated genomic analysis identifies clinically relevant subtypes of glioblastoma characterized by abnormalities in PDGFRA, IDH1, EGFR, and NF1. Cancer Cell 2010, 17, 98–110. [Google Scholar] [CrossRef] [PubMed]
  5. Brennan, C.W.; Verhaak, R.G.W.; McKenna, A.; Campos, B.; Noushmehr, H.; Salama, S.R.; Zheng, S.; Chakravarty, D.; Sanborn, J.Z.; Berman, S.H.; et al. The somatic genomic landscape of glioblastoma. Cell 2013, 155, 462–477. [Google Scholar] [CrossRef] [PubMed]
  6. Zundel, W.; Schindler, C.; Haas-Kogan, D.; Koong, A.; Kaper, F.; Chen, E.; Gottschalk, A.R.; Ryan, H.E.; Johnson, R.S.; Jefferson, A.B.; et al. Loss of PTEN facilitates HIF-1-mediated gene expression. Genes Dev. 2000, 14, 391–396. [Google Scholar] [PubMed]
  7. Haas-Kogan, D.; Shalev, N.; Wong, M.; Mills, G.; Yount, G.; Stokoe, D. Protein kinase B (PKB/Akt) activity is elevated in glioblastoma cells due to mutation of the tumor suppressor PTEN/MMAC. Curr. Biol. 1998, 8, 1195–1198. [Google Scholar] [CrossRef]
  8. Wesseling, P.; Ruiter, D.J.; Burger, P.C. Angiogenesis in brain tumors; pathobiological and clinical aspects. J. Neurooncol. 1997, 32, 253–265. [Google Scholar] [CrossRef] [PubMed]
  9. Rong, Y.; Durden, D.L.; Van Meir, E.G.; Brat, D.J. “Pseudopalisading” necrosis in glioblastoma: A familiar morphologic feature that links vascular pathology, hypoxia, and angiogenesis. J. Neuropathol. Exp. Neurol. 2006, 65, 529–539. [Google Scholar] [CrossRef] [PubMed]
  10. Harris, A.L. Hypoxia-a key regulatory factor in tumour growth. Nat. Rev. Cancer 2002, 2, 38–47. [Google Scholar] [CrossRef] [PubMed]
  11. Guerra, B.; Hochscherf, J.; Jensen, N.B.; Issinger, O.-G. Identification of a novel potent, selective and cell permeable inhibitor of protein kinase CK2 from the NIH/NCI Diversity Set Library. Mol. Cell. Biochem. 2015, 406, 151–161. [Google Scholar] [CrossRef] [PubMed]
  12. Guerra, B.; Fischer, M.; Schaefer, S.; Issinger, O.-G. The kinase inhibitor D11 induces caspase-mediated cell death in cancer cells resistant to chemotherapeutic treatment. J. Exp. Clin. Cancer Res. 2015, 34, 125. [Google Scholar] [CrossRef] [PubMed] [Green Version]
  13. Guerra, B.; Issinger, O.-G. Protein kinase CK2 and its role in cellular proliferation, development and pathology. Electrophoresis 1999, 20, 391–408. [Google Scholar] [CrossRef]
  14. Guerra, B.; Issinger, O.-G. Protein kinase CK2 in human diseases. Curr. Med. Chem. 2008, 15, 1870–1886. [Google Scholar] [CrossRef] [PubMed]
  15. Duncan, J.S.; Litchfield, D.W. Too much of a good thing: The role of protein kinase CK2 in tumorigenesis and prospects for therapeutic inhibition of CK2. Biochim. Biophys. Acta 2008, 1784, 33–47. [Google Scholar] [CrossRef] [PubMed]
  16. Trembley, J.H.; Wang, G.; Unger, G.; Slaton, J.; Ahmed, K. Protein kinase CK2 in health and disease: CK2: A key player in cancer biology. Cell. Mol. Life Sci. 2009, 66, 1858–1867. [Google Scholar] [CrossRef] [PubMed]
  17. Ruzzene, M.; Pinna, L.A. Addiction to protein kinase CK2: A common denominator of diverse cancer cells? Biochim. Biophys. Acta 2010, 1804, 499–504. [Google Scholar] [CrossRef] [PubMed]
  18. Hubert, A.; Paris, S.; Piret, J.-P.; Ninane, N.; Raes, M.; Michiels, C. Casein kinase 2 inhibition decreases hypoxia-inducible factor-1 activity under hypoxia through elevated p53 protein level. J. Cell. Sci. 2006, 119, 3351–3362. [Google Scholar] [CrossRef] [PubMed]
  19. Mazure, N.M.; Chen, E.Y.; Laderoute, K.R.; Giaccia, A.J. Induction of vascular endothelial growth factor by hypoxia is modulated by a phosphatidylinositol 3-kinase/Akt signaling pathway in Ha-ras-transformed cells through a hypoxia inducible factor-1 transcriptional element. Blood 1997, 90, 3322–3331. [Google Scholar] [PubMed]
  20. Jiang, B.H.; Jiang, G.; Zheng, J.Z.; Lu, Z.; Hunter, T.; Vogt, P.K. Phosphatidylinositol 3-kinase signaling controls levels of hypoxia-inducible factor 1. Cell Growth Differ. 2001, 12, 363–369. [Google Scholar] [PubMed]
  21. Pore, N.; Liu, S.; Haas-Kogan, D.A.; O’Rourke, D.M.; Maity, A. PTEN mutation and epidermal growth factor receptor activation regulate vascular endothelial growth factor (VEGF) mRNA expression in human glioblastoma cells by transactivating the proximal VEGF promoter. Cancer Res. 2003, 63, 236–241. [Google Scholar] [PubMed]
  22. Wang, D.; Westerheide, S.D.; Hanson, J.L.; Baldwin, A.S. Tumor necrosis factor α-induced phosphorylation of RelA/p65 on Ser529 is controlled by casein kinase II. J. Biol. Chem. 2000, 275, 32592–32597. [Google Scholar] [CrossRef] [PubMed]
  23. Wenger, R.H.; Kvietikova, I.; Rolfs, A.; Gassmann, M.; Marti, H.H. Hypoxia-inducible factor-1 α is regulated at the post-mRNA level. Kidney Int. 1997, 51, 560–563. [Google Scholar] [CrossRef] [PubMed]
  24. Huang, L.E.; Gu, J.; Schau, M.; Bunn, H.F. Regulation of hypoxia-inducible factor 1α is mediated by an O2-dependent degradation domain via the ubiquitin-proteasome pathway. Proc. Natl. Acad. Sci. USA 1998, 95, 7987–7992. [Google Scholar] [CrossRef] [PubMed]
  25. Guerra, B.; Rasmussen, T.D.L.; Schnitzler, A.; Jensen, H.H.; Boldyreff, B.S.; Miyata, Y.; Marcussen, N.; Niefind, K.; Issinger, O.-G. Protein kinase CK2 inhibition is associated with the destabilization of HIF-1α in human cancer cells. Cancer Lett. 2015, 356, 751–761. [Google Scholar] [CrossRef] [PubMed]
  26. Yeo, E.-J.; Chun, Y.-S.; Cho, Y.-S.; Kim, J.; Lee, J.-C.; Kim, M.-S.; Park, J.-W. YC-1: A potential anticancer drug targeting hypoxia-inducible factor 1. J. Natl. Cancer Inst. 2003, 95, 516–525. [Google Scholar] [CrossRef] [PubMed]
  27. Isaacs, J.S.; Jung, Y.-J.; Mimnaugh, E.G.; Martinez, A.; Cuttitta, F.; Neckers, L.M. Hsp90 regulates a von Hippel Lindau-independent hypoxia-inducible factor 1α-degradative pathway. J. Biol. Chem. 2002, 277, 29936–29944. [Google Scholar] [CrossRef] [PubMed]
  28. Mabjeesh, N.J.; Post, D.E.; Willard, M.T.; Kaur, B.; Van Meir, E.G.; Simons, J.W.; Zhong, H. Geldanamycin induces degradation of hypoxia-inducible factor 1α protein via the proteosome pathway in prostate cancer cells. Cancer Res. 2002, 62, 2478–2482. [Google Scholar] [PubMed]
  29. Zagzag, D.; Nomura, M.; Friedlander, D.R.; Blanco, C.Y.; Gagner, J.-P.; Nomura, N.; Newcomb, E.W. Geldanamycin inhibits migration of glioma cells in vitro: A potential role for hypoxia-inducible factor (HIF-1α) in glioma cell invasion. J. Cell. Physiol. 2003, 196, 394–402. [Google Scholar] [CrossRef] [PubMed]
  30. Zuehlke, A.; Johnson, J.L. Hsp90 and co-chaperones twist the functions of diverse client proteins. Biopolymers 2010, 93, 211–217. [Google Scholar] [CrossRef] [PubMed]
  31. Miyata, Y. Protein kinase CK2 in health and disease: CK2: The kinase controlling the Hsp90 chaperone machinery. Cell. Mol. Life Sci. 2009, 66, 1840–1849. [Google Scholar] [CrossRef] [PubMed]
  32. Espert, L.; Denizot, M.; Grimaldi, M.; Robert-Hebmann, V.; Gay, B.; Varbanov, M.; Codogno, P.; Biard-Piechaczyk, M. Autophagy is involved in T cell death after binding of HIV-1 envelope proteins to CXCR4. J. Clin. Investig. 2006, 116, 2161–2172. [Google Scholar] [CrossRef] [PubMed]
  33. Wykoff, C.C.; Beasley, N.; Watson, P.H.; Campo, L.; Chia, S.K.; English, R.; Pastorek, J.; Sly, W.S.; Ratcliffe, P.; Harris, A.L. Expression of the hypoxia-inducible and tumor-associated carbonic anhydrases in ductal carcinoma in situ of the breast. Am. J. Pathol. 2001, 158, 1011–1019. [Google Scholar] [CrossRef]
  34. Verma, S.; Dixit, R.; Pandey, K.C. Cysteine Proteases: Modes of Activation and Future Prospects as Pharmacological Targets. Front. Pharmacol. 2016, 7, 107. [Google Scholar] [CrossRef] [PubMed]
  35. Ellen, T.P.; Ke, Q.; Zhang, P.; Costa, M. NDRG1, a growth and cancer related gene: Regulation of gene expression and function in normal and disease states. Carcinogenesis 2008, 29, 2–8. [Google Scholar] [CrossRef] [PubMed]
  36. Guan, R.J.; Ford, H.L.; Fu, Y.; Li, Y.; Shaw, L.M.; Pardee, A.B. Drg-1 as a differentiation-related, putative metastatic suppressor gene in human colon cancer. Cancer Res. 2000, 60, 749–755. [Google Scholar] [PubMed]
  37. Bandyopadhyay, S.; Pai, S.K.; Gross, S.C.; Hirota, S.; Hosobe, S.; Miura, K.; Saito, K.; Commes, T.; Hayashi, S.; Watabe, M.; et al. The Drg-1 gene suppresses tumor metastasis in prostate cancer. Cancer Res. 2003, 63, 1731–1736. [Google Scholar] [PubMed]
  38. Salnikow, K.; Costa, M.; Figg, W.D.; Blagosklonny, M.V. Hyperinducibility of hypoxia-responsive genes without p53/p21-dependent checkpoint in aggressive prostate cancer. Cancer Res. 2000, 60, 5630–5634. [Google Scholar] [PubMed]
  39. Guerra, B.; Iwabuchi, K.; Issinger, O.-G. Protein kinase CK2 is required for the recruitment of 53BP1 to sites of DNA double-strand break induced by radiomimetic drugs. Cancer Lett. 2014, 345, 115–123. [Google Scholar] [CrossRef] [PubMed]
  40. Sandholt, I.S.; Olsen, B.B.; Guerra, B.; Issinger, O.-G. Resorufin: A lead for a new protein kinase CK2 inhibitor. Anticancer Drugs 2009, 20, 238–248. [Google Scholar] [CrossRef] [PubMed]
  41. Yde, C.W.; Olsen, B.B.; Meek, D.; Watanabe, N.; Guerra, B. The regulatory beta-subunit of protein kinase CK2 regulates cell-cycle progression at the onset of mitosis. Oncogene 2008, 27, 4986–4997. [Google Scholar] [CrossRef] [PubMed] [Green Version]
  42. Livak, K.J.; Schmittgen, T.D. Analysis of relative gene expression data using real-time quantitative PCR and the 2(-Delta Delta C(T)) Method. Methods 2001, 25, 402–408. [Google Scholar] [CrossRef] [PubMed]
  43. Schmittgen, T.D.; Livak, K.J. Analyzing real-time PCR data by the comparative C(T) method. Nat. Protoc. 2008, 3, 1101–1108. [Google Scholar] [CrossRef] [PubMed]
Figure 1. Kinetic mechanisms of CK2 inhibition. (A) Michaelis-Menten curves showing how velocity varies over a range of substrate concentrations for three different concentrations of inhibitor. The velocity equation relative to the hyperbolic curves of the graph for mixed inhibition is shown above the plots. I: inhibitor (D11), KI: dissociation constant for binding of inhibitor to free enzyme, KI′: dissociation constant for binding of inhibitor to substrate-bound enzyme. (B) Apparent KM (KMapp) re-plotted against varying concentrations of inhibitor (used for the calculation of KI). (C) Reciprocal apparent Vmax (1/Vmaxapp) re-plotted against varying concentrations of inhibitor (employed for the calculation of KI′). The reaction rate is expressed in pmol/min/ng. Experiments were repeated three times.
Pharmaceuticals 10 00005 g001
Figure 2. Anti-proliferative effects of D11 in human glioblastoma cells. (A) Flow cytometry analysis of cells vehicle-treated (Control, 0.1% DMSO) or incubated with increasing concentrations of D11 for 24 h (left bar graph) and 48 h (right bar graph), respectively. The relative amount of cells in the various phases of the cell cycle is shown in percentage. (B) Cells were treated as described above. Whole cell lysate was analyzed by western blot employing antibodies directed against the indicated proteins. β-actin detection was carried out as control for equal loading. (C) Flow cytometry analysis of cells treated as described in (A) stained with acridine orange for the determination of autophagic vacuoles formation. Number of red-positive cells is expressed in percentage. Experiments were performed three times obtaining similar results.
Pharmaceuticals 10 00005 g002
Figure 3. Stabilization and transcriptional activity of HIF-1α under hypoxia is impaired in cells treated with D11. (A) U-87 MG cells were treated with vehicle (Control), 50 μM D11, 50 μM E9 or 20 μM CX-4945 for 24 h under normoxia (N) and hypoxia (H), respectively. Whole cell lysate from cells treated as shown in the figure was subjected to western blot analysis and the expression and phosphorylation levels of the indicated proteins were analyzed. β-actin detection was used as loading control. Experiments were performed three times obtaining similar results. (B) Cells were transfected with a control plasmid (p-Luc) or a plasmid containing HIF-1α response element (p-HIF-Luc). 24 h from transfection, cells were added vehicle (0.1% DMSO) or 50 μM D11 and incubated under normoxic (N) or hypoxic (H) condition for the subsequent 24 h. HIF-1α transcriptional activity was analyzed employing a luciferase reporter gene assay. HIF-1α activity was measured testing the ability of the transcription factor to bind the HIF-1α response element that controls the expression of the luciferase reporter gene. HIF-1α transcription activity is expressed in counts/s (CPS). Experiments were repeated twice in triplicates obtaining similar results. * p < 0.005, ** p < 0.0001.
Pharmaceuticals 10 00005 g003
Figure 4. D11-mediated destabilization of HIF-1α under hypoxia is accompanied by higher levels of autophagy. Cells were incubated with 0.1% DMSO, 50 μM D11 alone or in combination with 100 nM bafilomycin A1 (Baf) under normoxia and hypoxia, respectively. Cells were treated with D11 for 24 h while bafilomycin A1 was added in the last 6 h of incubation time. Proteins were visualized by probing the western blot membranes with antibodies against the indicated proteins.
Pharmaceuticals 10 00005 g004
Figure 5. Genes differentially expressed in response to hypoxia and D11 treatment. (A) Western blot analysis of whole cell lysate from cells incubated with 0.1% DMSO or 50 μM D11 for 24 h under normoxia and hypoxia, respectively. Western blot membranes were employed for the detection of HIF-1α and β-actin expression levels, respectively. (B) Scatter plot of changes of expression of genes in glioblastoma cells. Upper panel: changes of gene expression between cells incubated under normoxia (control) and cells incubated under hypoxia for 24 h. Lower panel: changes of gene expression in the presence or absence of D11 under hypoxic conditions. The fold regulation cut-off (red dashed line) was set on 2.
Pharmaceuticals 10 00005 g005
Table 1. Gene expression analysis.
ProteinGene SymbolFold-ChangeFold-Change
CTH vs. CTND11H vs. CTH
AdrenomedullinADM4.3581.226
Angiopoietin-like 4ANGPTL47.646−7.888
Ankyrin repeat domain 37ANKRD372.880−2.106
Basic helix-loop-helix family member e40BHLHE403.229−2.275
Bloom syndrome, RecQ helicase-likeBLM−1.904−1.549
Bcl2 interacting protein 3BNIP35.9841.282
Bcl2 interacting protein 3-likeBNIP3L3.364−1.058
Carbonic anhydrase IXCA910.768−2.924
Cyclin G2CCNG23.3672.445
DNA-damage-inducible transcript 4DDIT47.233−4.314
Egl nine homolog 1 (C. elegans)EGLN11.953−2.032
Early growth response 1EGR1−2.47454.951
ErythropoietinEPO2.1501.275
ERO1-like (S. cerevisiae)ERO1A2.033−1.566
Coagulation factor IIIF35.802−41.328
Glucan branching enzyme 1GBE12.523−2.082
Glycogen synthaseGYS12.051−2.645
Hypoxia inducible factor 3 α subunitHIF3A3.719−3.992
Hexokinase 2HK23.1521.100
Insulin-like growth factor binding protein 3IGFBP367.054−11.170
Lactate dehydrogenase ALDHA2.602−2.361
Lectin, galactoside-binding, soluble, 3LGALS32.363−2.141
Lysyl oxidaseLOX5.199−4.730
Macrophage migration inhibitory factorMIF1.986−1.040
Matrix Metallopeptidase 9MMP96.044−2.535
MAX interactor 1MXI14.017−1.462
N-myc downstream-regulated 1NDRG115.150−3.611
Ornithine decarboxylase 1ODC1−2.23111.551
Prolyl 4-hydroxylase, α 1P4HA13.3621.053
Pyruvate dehydrogenase kinasePDK12.946−1.522
6-phosphofructo-2-kinase/fructose-2,6-bisphosphatase 3PFKFB32.3941.146
6-phosphofructo-2-kinase/fructose-2,6-bisphosphatase 4PFKFB43.304−14.057
Phosphofructokinase, liverPFKL2.452−2.309
Placental growth factorPGF2.2422.089
Phosphoglycerate kinase 1PGK13.159−1.581
Plasminogen activator, urokinasePLAU−2.9261.674
Serpin peptidase inhibitor, clade E member 1SERPINE11.9111.744
Solute carrier family 16 member 3SLC16A32.454−4.346
Solute carrier family 2 member 1 (GLUT1)SLC2A15.890−1.162
Solute carrier family 2 member 3 (GLUT 3)SLC2A32.4622.460
Thioredoxin interacting proteinTXNIP3.4221.559
Vascular endothelial growth factor AVEGFA5.367−11.028
CTH: control cells (vehicle-treated) grown under hypoxia, CTN: control cells (vehicle-treated) grown under normoxia, D11H: D11-treated cells under hypoxia.

