3.1. Effective Recording Range
As outlined in
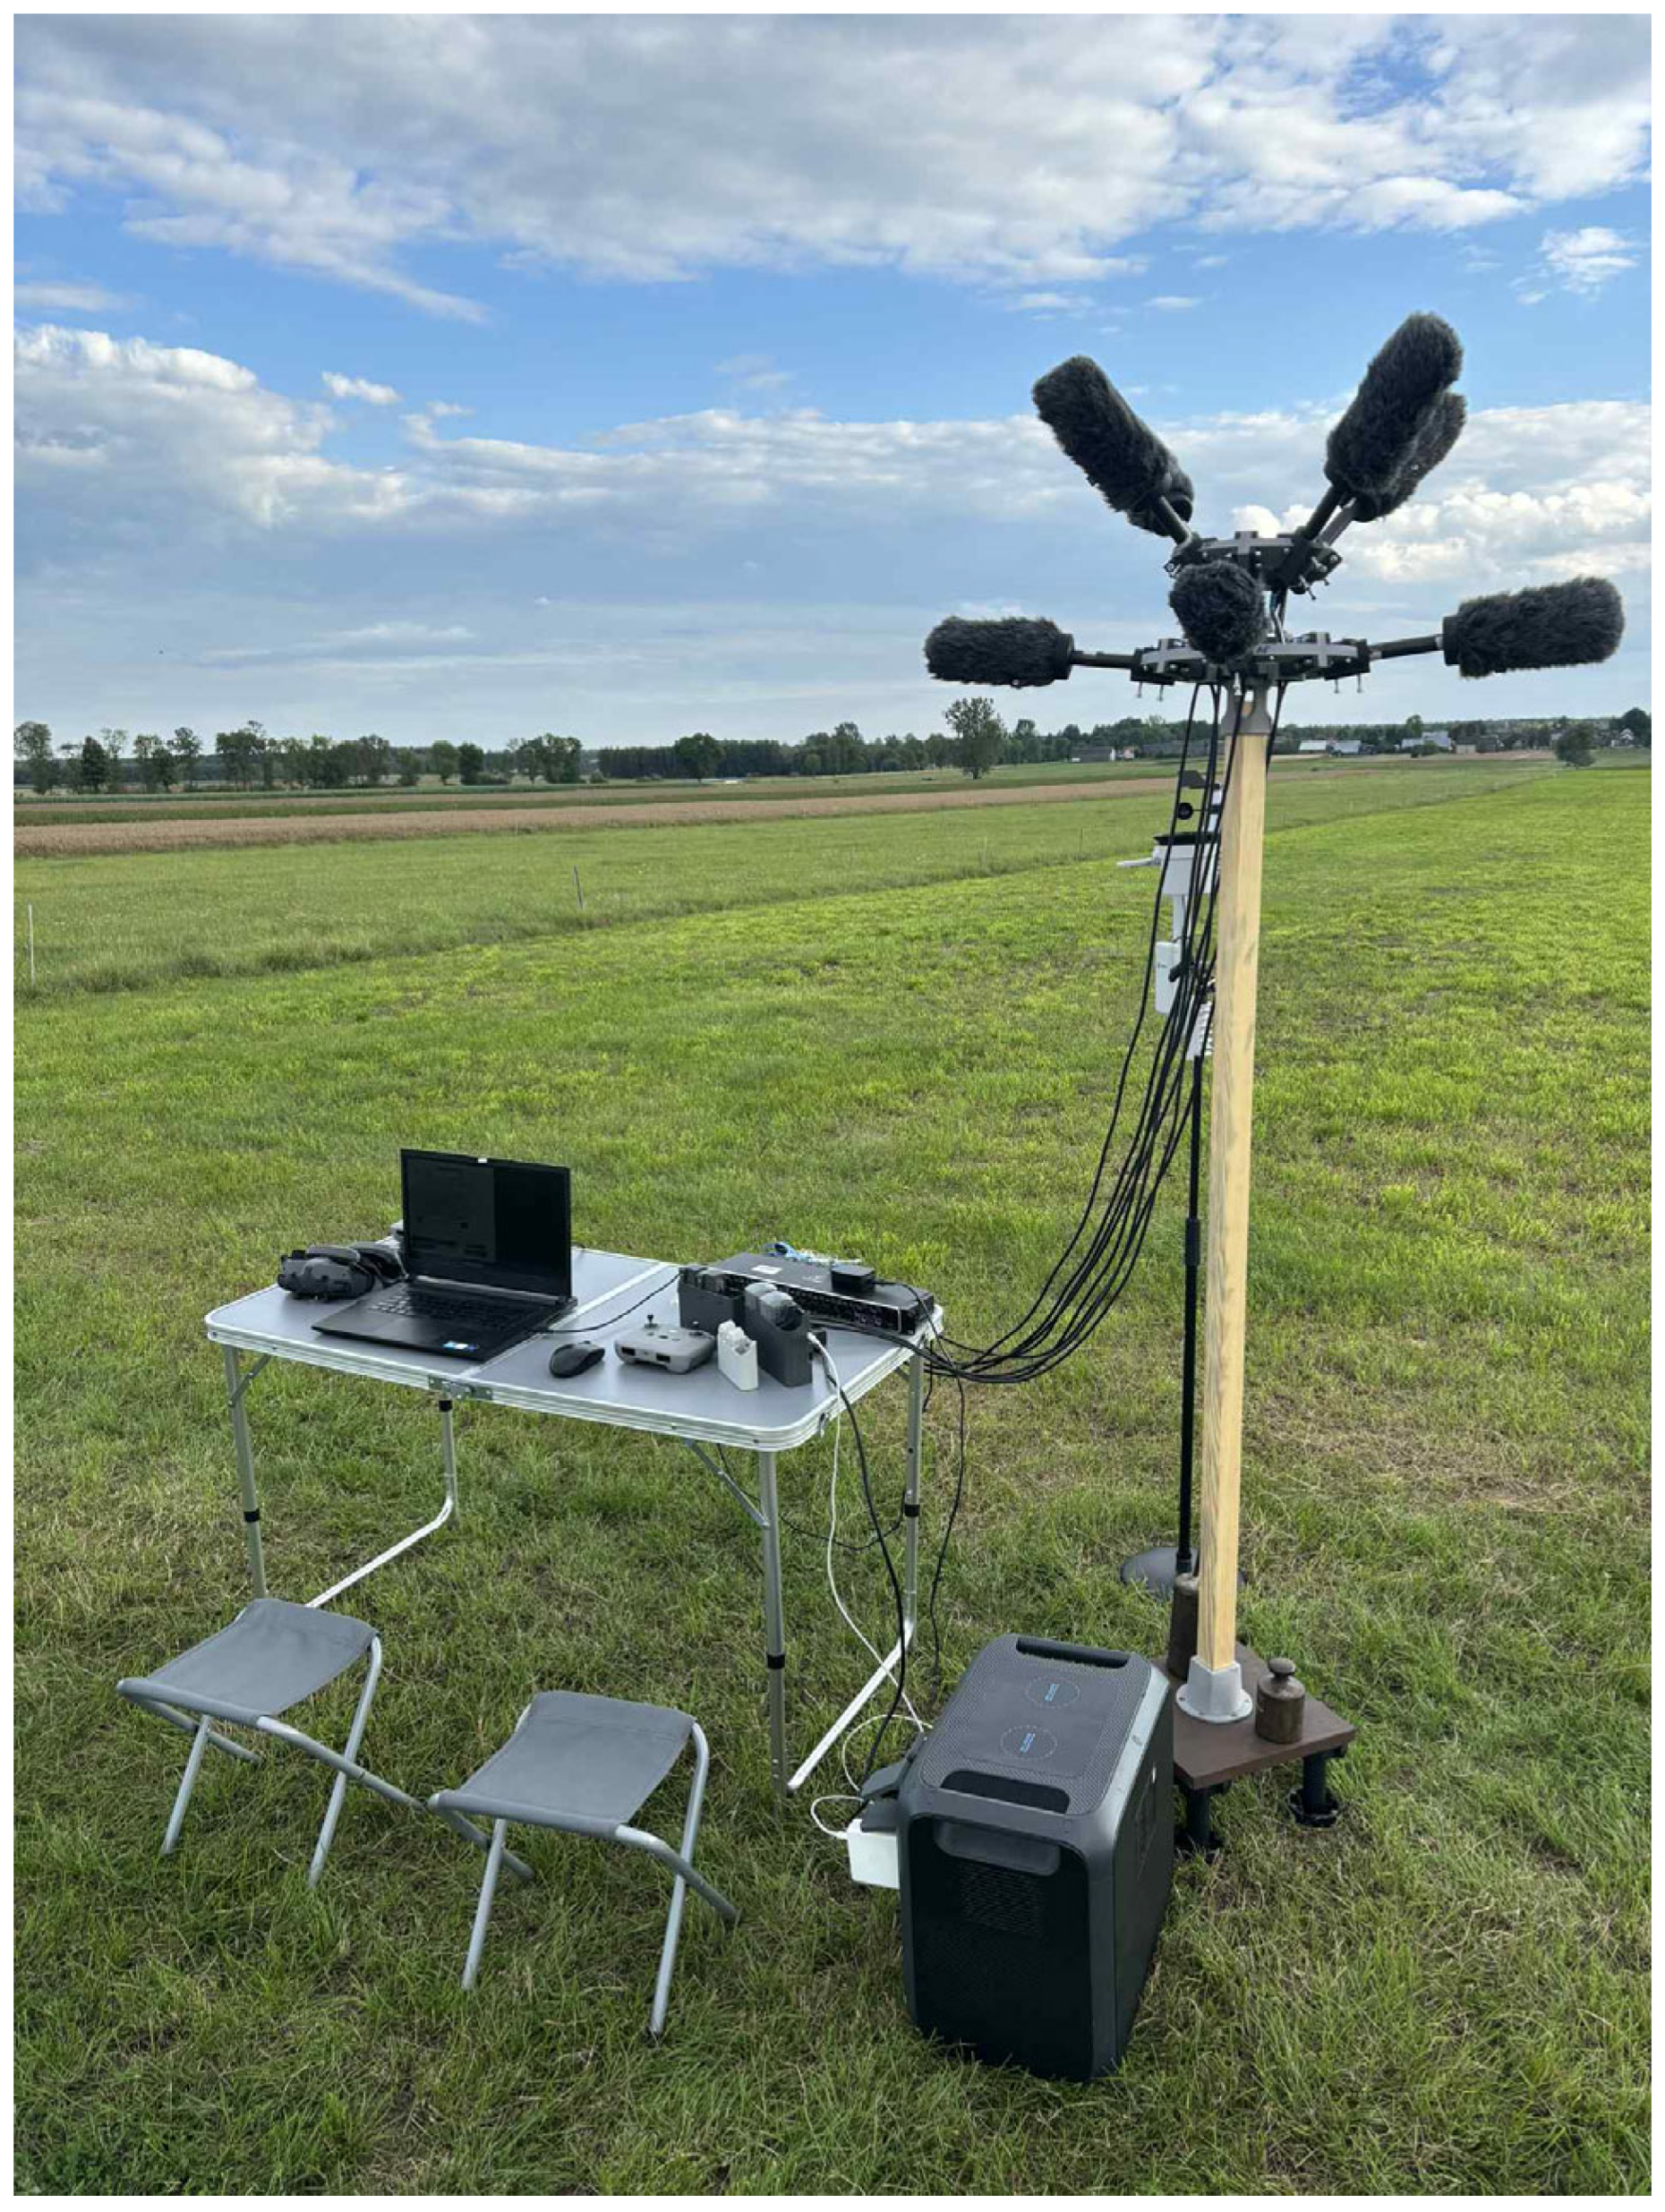
Section 2.2, the effective recording range of each microphone configuration was assessed using a standardized 1 kHz sine wave emitted from a calibrated loudspeaker at increasing distances. This setup provided a controlled and repeatable baseline for evaluating range detection performance across devices, under realistic outdoor conditions and varying wind intensities. Detection performance was assessed solely as a function of distance (on-axis) using an SNR ≥ 3 dB threshold. No beamforming or off-axis configurations were used.
To ensure meaningful comparison across microphones with different sensitivities and directional properties, all recordings were filtered in the 950–1050 Hz band, corresponding to the 1 kHz calibration tone used in range tests. This narrow band was selected instead of standardized octave or one-third-octave filters to maintain strict spectral focus and reduce overlap with unrelated tonal components or environmental noise, thereby improving repeatability under outdoor conditions. The analysis prioritized relative signal prominence over absolute SPL by computing signal-to-noise ratio values with respect to each microphone’s average background level. The following performance metrics were derived for each configuration:
Average background noise level, expressed in SPL and computed in the same narrow band as the test tone (950–1050 Hz) from background-only recordings taken at the exact locations and time windows as the signal. Levels are referenced to each microphone’s 1 m recording to remove simple gain differences.
Mean signal-to-noise ratio, obtained at each distance as the ratio between the band-pass–filtered tone segment and the distance-matched background segment (both 950–1050 Hz), then averaged across all measured distances up to the test limit (or until the detection threshold is crossed).
Detection range, defined as the distance at which the band-limited SNR first drops below 3 dB; when this occurs between sampled points, the reported distance is linearly interpolated between the two nearest measurements.
Attenuation slope, the rate at which the band-limited signal level decreases with logarithmic distance (dB/decade), estimated from a straight-line fit over valid points up to the detection limit and referenced to the microphone’s own 1 m level.
Together, these metrics offer a coherent basis for comparing microphone performance across different environmental conditions.
The first scenario focused exclusively on direction C (203° SSW) and included data from two measurement sessions conducted on July 5 and July 12, 2025, under different wind intensities. The first session represented calm conditions, while the second introduced moderate wind exposure.
Table 4 presents the extracted performance metrics for each configuration.
The results in
Table 4 demonstrate the measurable influence of wind on outdoor acoustic detection, even after targeted bandpass filtering of the 1 kHz test signal. Although the use of narrowband analysis significantly reduced the masking effect of low-frequency wind noise, stronger wind conditions during session two still resulted in a systematic increase of background noise levels—by approximately 5–7 dB—compared to calm conditions.
This increase in ambient noise level resulted in a corresponding decrease in the average signal-to-noise ratio and a reduction in detection range across all microphone configurations. The findings confirm that, despite frequency-selective filtering, wind remains a significant factor in outdoor acoustic measurements, particularly through its impact on turbulence and microphone self-noise.
To assess how performance varies with source direction under similar wind conditions, the following scenario introduces multi-azimuth testing.
Table 5 presents results from session 3, conducted under high wind exposure.
Despite a prevailing SSW wind direction, corresponding to direction C, the observed detection ranges were influenced not only by microphone shielding but also by spatial orientation relative to both wind and anthropogenic noise sources. The highest detection distances were generally observed in directions A and C, suggesting that wind gusts did not originate from a constant direction but fluctuated within a southwest sector during the session.
Importantly, direction C was not only aligned with the prevailing wind but also oriented along a road adjacent to the measurement site, which likely facilitated the propagation of environmental noise, such as distant traffic. This effect was especially evident for the parabolic microphone, whose directional gain amplified not only the target sine wave, but also wind-induced noise and roadway sounds arriving from the same axis. As a result, it exhibited notably elevated background SPLs and reduced SNR in this orientation.
In contrast, direction B—perpendicular to the road and oriented more crosswind—showed the lowest detection ranges across most configurations. These observations highlight the compound influence of wind alignment, source directionality, and the propagation of environmental noise. The effectiveness of wind protection is also apparent: microphones equipped with WS6 or DeadCat windscreens consistently maintained higher SNRs and longer detection ranges compared to their unshielded counterparts. Additionally, the parabolic dish—despite its directional sensitivity—offered some passive shielding from lateral wind exposure, contributing to improved performance in directions less aligned with the wind.
To isolate the effect of spatial orientation under minimal wind interference, a final measurement session was conducted under calm weather conditions (session 4). This scenario enabled the evaluation of directional sensitivity and ambient noise exposure across all configurations, eliminating the confounding influence of strong wind. The results for all three directions are summarized in
Table 6.
Under low wind conditions (mean 1 m/s), the differences in detection performance were primarily influenced by microphone orientation and environmental background sources, rather than by wind-induced turbulence. Direction A consistently yielded the lowest background noise level and highest SNR values, likely due to minimal external interference and favorable propagation conditions. In contrast, direction B—pointing toward nearby road infrastructure—showed the highest background noise levels and the shortest detection ranges across most configurations. Direction C, despite elevated ambient noise levels, maintained comparable detection ranges to A, suggesting efficient signal propagation along the road axis. These results confirm that even under calm conditions, spatial orientation and landscape features can significantly modulate effective microphone range.
The results across all test scenarios reveal several consistent trends in microphone performance under varying wind conditions and spatial orientations. Most notably, detection ranges were substantially more extended in the direction opposite to the road. In contrast, measurements along or toward the road exhibited pronounced reductions in both SNR and effective range. This underscores the compound effect of environmental noise propagation and source alignment.
Wind presence emerged as a dominant limiting factor. Even moderate gusts resulted in elevated background noise and reduced detection distances across all devices. Wind protection solutions—such as the WS6 and DeadCat windshields—did not notably affect signal attenuation under calm conditions but proved highly beneficial under wind exposure, improving both SNR and detection range.
To provide a global view of performance consistency across all test conditions,
Table 7 summarizes the inter-session mean ± standard deviation of key acoustic metrics for each microphone configuration. These aggregated values reflect combined variability due to wind, direction, and session-specific factors.
The aggregated results indicate that directional microphones equipped with windshields (NTG-2 + WS6 or DeadCat) and the parabolic NTG-2 consistently achieved the highest mean SNRs (≈10–11 dB) and the longest detection ranges (≈85–95 m), confirming their superior resilience to environmental variability. In contrast, the omnidirectional Behringer B-2 and the compact Mozos VMic exhibited both lower average SNRs and larger inter-session deviations, reflecting higher sensitivity to wind and ambient noise fluctuations. Overall, the inter-session standard deviations (typically 2–3 dB for SNR and 40–45 m for range) quantify the natural variability observed across outdoor sessions under changing wind and background noise conditions, thereby strengthening the statistical validity of the comparison.
To verify that range and SNR estimates were not biased by saturation, we audited every recording for clipping, treating any sample with normalized magnitude ∣x∣ ≥ 0.999 (≈−0.01 dBFS) as effectively full scale. The 0.999 guard band—slightly below unity—captures hard-limited peaks that can appear just under 1.0 after PCM-to-float conversion or rounding, avoiding false negatives. We aggregated the rates per microphone and session (
Figure 5). Clipping emerged primarily as a wind-driven transient, being negligible in calm sessions (1 and 4). It concentrated on the high-wind, multi-azimuth session 3. Headroom tracked shielding and front-end design—windshielded cardioids (NTG-2 + WS6/DeadCat) stayed at or below ~1% across sessions; the parabolic NTG-2 showed occasional moderate overload in gusts; bare NTG-2 and Mozos VMic were most susceptible; large-diaphragm Behringers (B-1/B-2) were near zero. Overall rates were small relative to total sample counts, indicating that the reported detection ranges and SNRs are not artifacts of clipping.
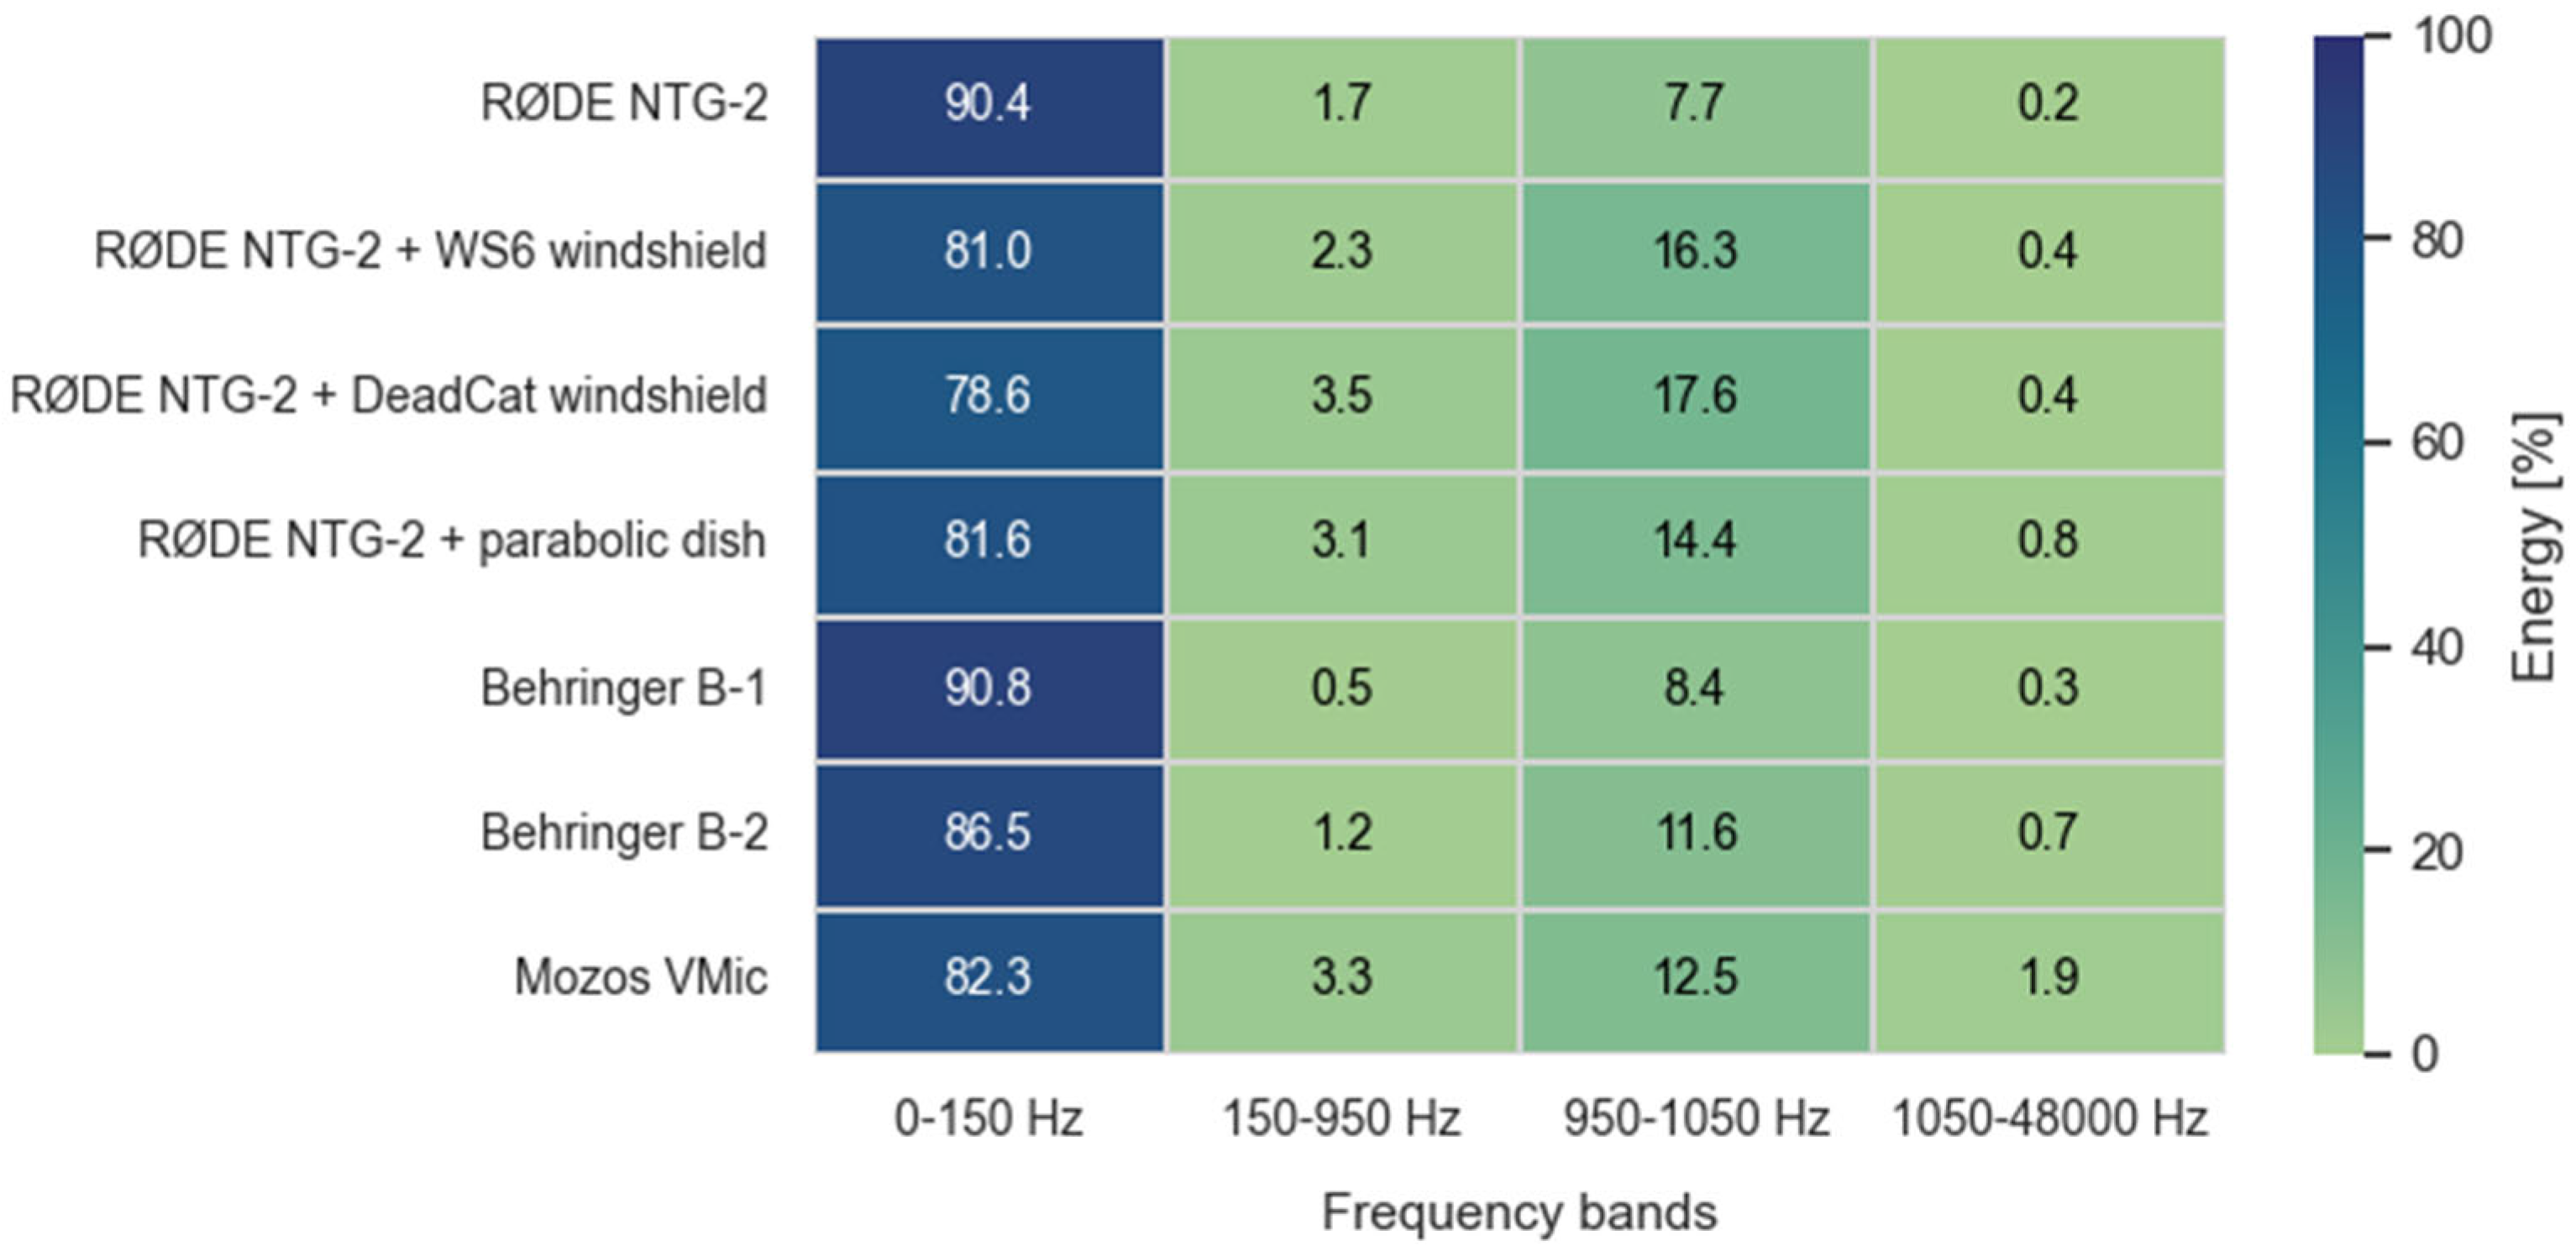
The spectral distribution of energy across key frequency bands offers further insight into how microphones respond to wind-induced noise and signal content. Energy in each frequency band was obtained by summing the squared FFT magnitudes across all bins within the band and expressing the result as a percentage of the total broadband energy (0–48 kHz). The unequal bandwidths were selected to isolate wind-dominated (<150 Hz), transitional (150–950 Hz), signal (950–1050 Hz), and high-frequency (>1050 Hz) regions.
Figure 6 and
Figure 7 illustrate the average energy distribution across these frequency regions under low and high-wind conditions, respectively.
Under calm conditions, most energy is concentrated in the 950–1050 Hz band, corresponding to the test signal, with minimal low-frequency interference. However, under high wind exposure, unshielded microphones (e.g., bare NTG-2) exhibit strong energy components below 150 Hz—characteristic of wind-induced turbulence.
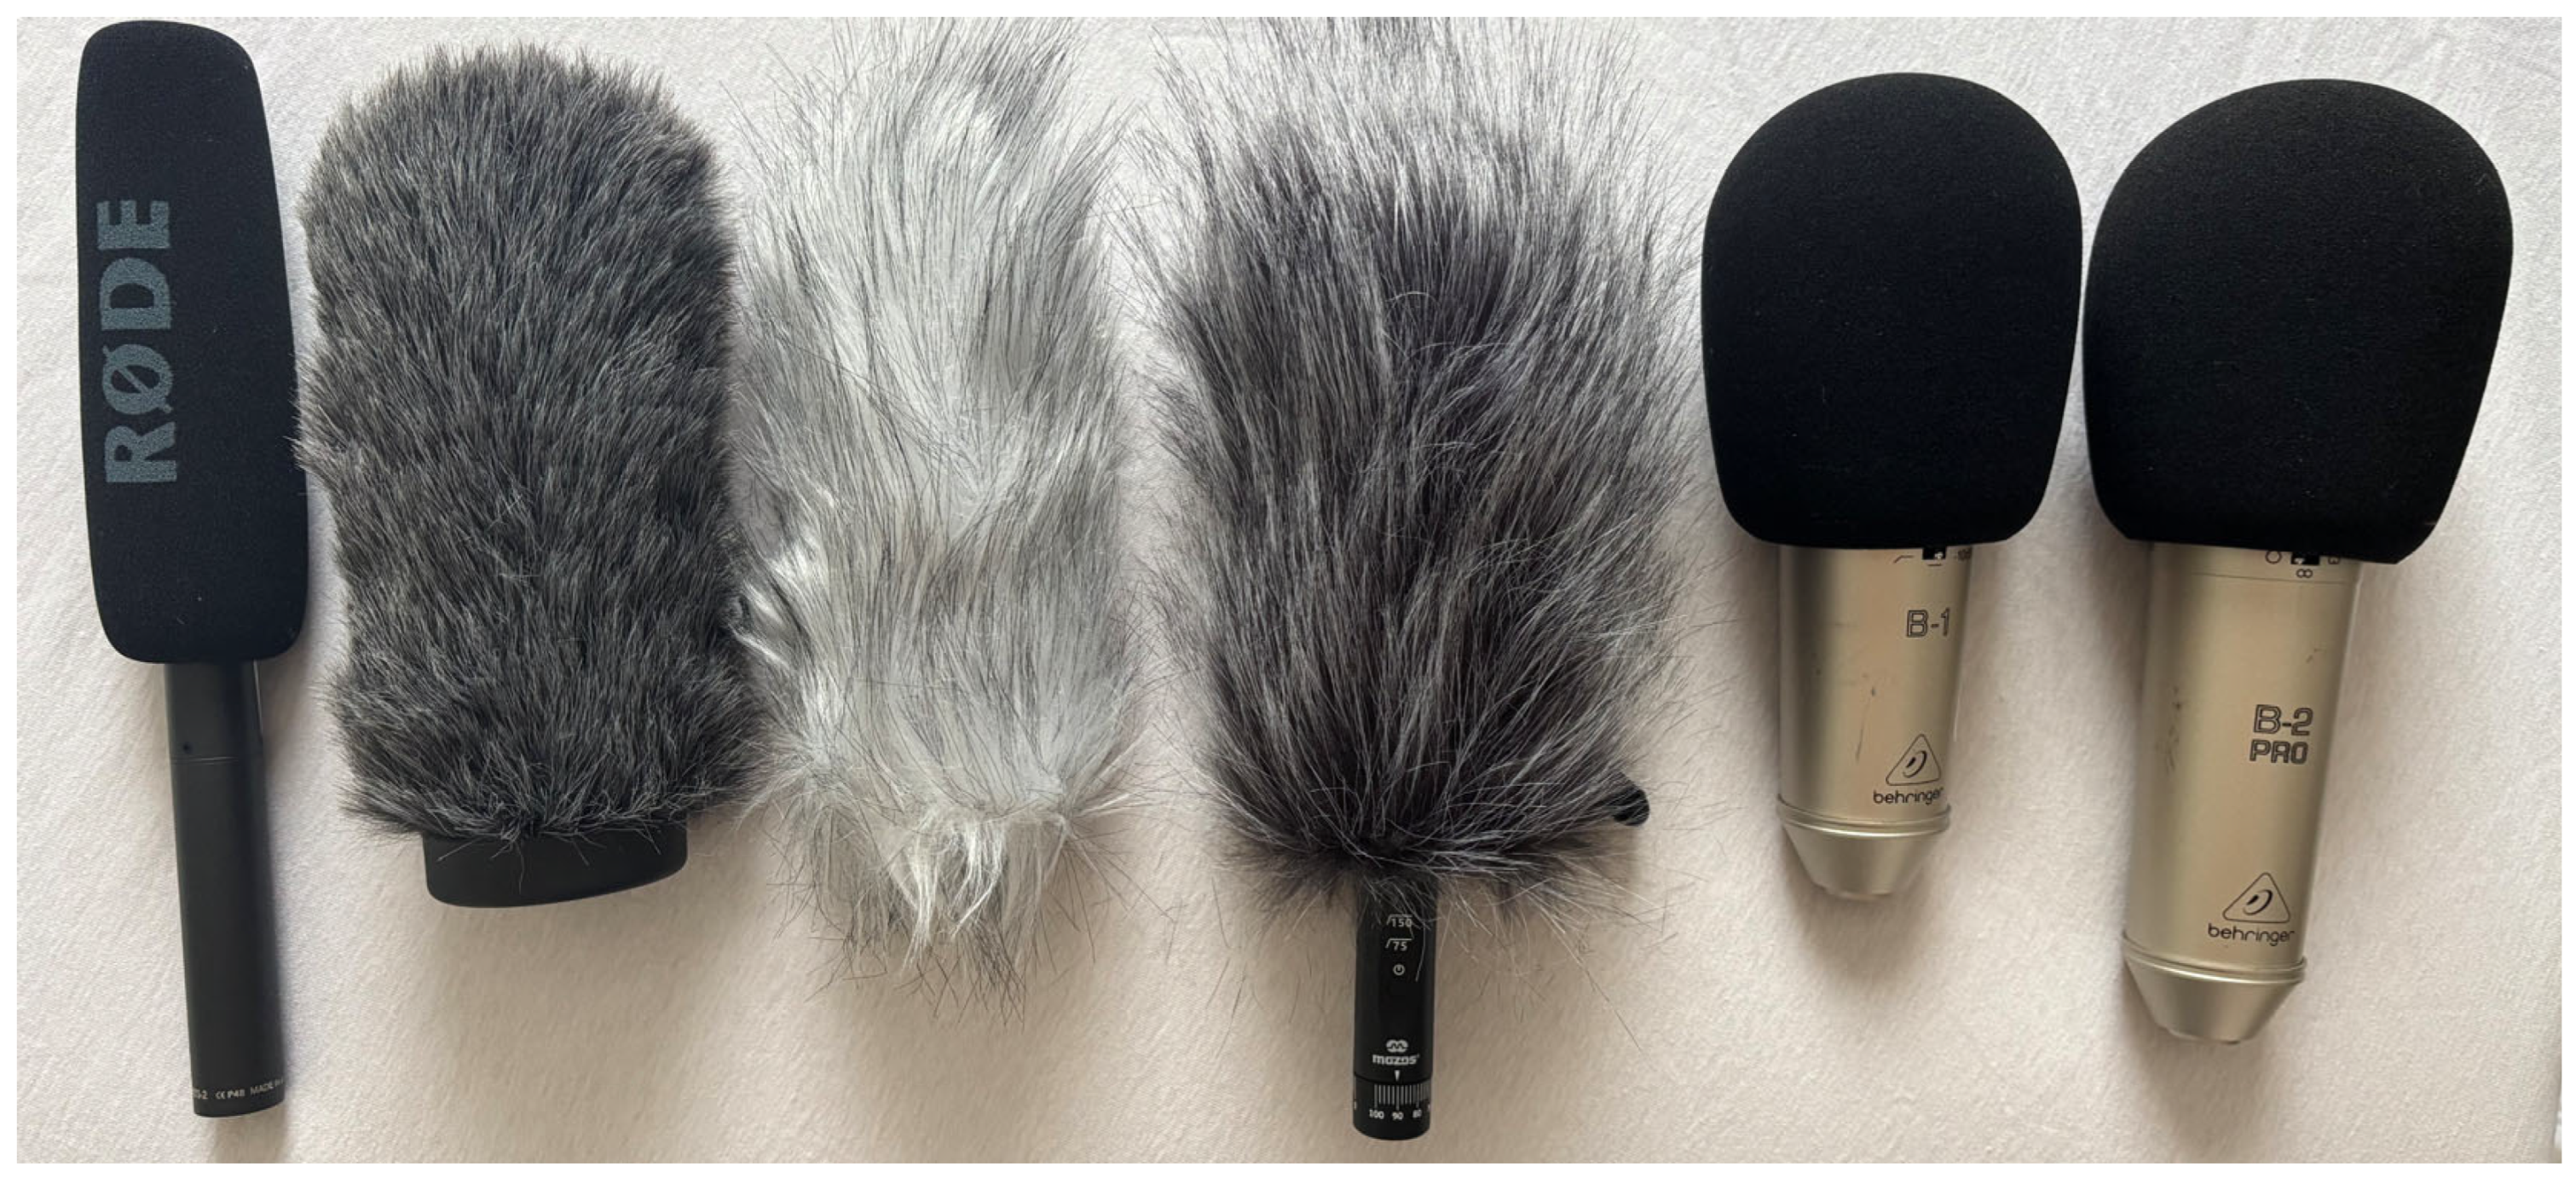
In contrast, configurations using WS6 or DeadCat windscreens show marked suppression of low-frequency energy while preserving the main tone’s prominence. The parabolic dish similarly improves signal focus, although its broadband gain also slightly increases the capture of higher-frequency energy. These spectral effects are consistent with its overall performance: the parabolic dish configuration consistently delivered the highest or near-highest detection ranges across all test scenarios, typically outperforming standard directional microphones. While the reflector amplified both the target signal and ambient noise—especially in the presence of wind or distant background sources—it nevertheless resulted in systematically elevated SNR values. This indicates that its directional gain effectively favored on-axis sound capture, enhancing signal clarity even when absolute range improvements were modest. Among the tested devices without advanced wind protection, the Behringer B-1 exhibited notably resilient performance. Despite being equipped only with a basic foam windscreen, it maintained relatively high SNRs and detection ranges-potentially due to its capsule geometry or internal acoustic damping, which limited wind-induced interference. In contrast, the Behringer B-2, which features an omnidirectional pickup pattern, consistently demonstrated reduced detection capability and lower SNR values across all scenarios.
The Mozos VMic exhibited the highest susceptibility to ambient and wind-related noise, despite being fitted with both foam and fur windshields. One practical limitation stems from its two-channel output, which reduces the number of microphones that can be simultaneously connected to a multi-channel audio interface—thereby constraining experimental setups. Additionally, the presence of a manual gain control introduces variability in output level, complicating reproducible calibration. Although the gain was set to maximum for range testing, the microphone’s overall performance remained limited, likely due to internal design factors such as preamplifier quality or capsule sensitivity, rather than shielding alone.
Attenuation slopes provided additional insight into how different configurations affected the propagation and perceived loss of signal strength over distance. Steeper slopes (up to −20 dB/decade) were typically observed under calm conditions and in directions free from primary noise sources, reflecting a more idealized, free-field decay of sound pressure. Conversely, shallower slopes (e.g., −13 dB/decade or less) emerged more frequently in windy conditions or when microphones faced dominant background sources, where elevated noise masked the decay curve and reduced the effective contrast between the signal and background. Notably, the parabolic reflector consistently exhibited the flattest slopes across scenarios—indicating that its directional gain not only amplified the target signal but also helped preserve its level across longer distances.
3.2. Spectral Analysis of UAV Acoustic Signatures
Beyond range metrics, this section examines how each microphone captures UAV-specific tonal content relative to its own background noise. In particular, microphones with a lower low-frequency noise floor (0–300 Hz) and stronger mid-band tonal excess (i.e., energy integrated over a harmonic comb anchored at blade passage frequency) tend to sustain higher SNR with distance. Accordingly, the results in this section should broadly align with the detection-range ordering reported in
Section 3.1, except under wind-dominated conditions or unfavorable source–array orientations. These trends are closely linked to the spectral structure of UAV noise. Small multirotor UAVs emit complex acoustic signatures composed of both tonal components and broadband noise. These sounds are primarily generated by the rotation of propellers and brushless electric motors, and their characteristics vary depending on drone size, structural geometry, and flight dynamics. Even during steady hovering, UAVs produce non-stationary emissions due to continuous feedback-driven adjustments in motor RPM to maintain stability.
The acoustic characteristics of such drones are shaped not only by their operational parameters but also by their physical configuration. Quadcopter designs typically feature four identical propulsion units (motors and propellers) mounted symmetrically, which results in predictable harmonic structures. These include strong periodic components related to the blade passage frequency, as well as higher-order harmonics from each motor–propeller unit. The BPF corresponds to the rate at which propeller blades pass a fixed point in space and can be expressed by the following equation:
where
N is the number of blades per propeller and
RPM is the rotation speed in revolutions per minute. This frequency typically dominates the tonal content of the UAV’s acoustic signature and determines the spacing between successive harmonics. Due to the rigid and symmetrical layout, these harmonics are often more narrowly distributed and stable compared to those found in organic sound sources, such as human speech.
Additionally, structural vibrations, airflow interactions, and subtle differences in motor loading introduce further modulation components, which give rise to subharmonics and spectral variations. While drone maneuvers or accelerations can cause momentary shifts in the spectral content, even in static flight, the combination of mechanical precision and aerodynamic effects results in a rich yet structured acoustic profile characteristic of multirotor UAVs.
To illustrate these spectral characteristics in practice,
Figure 8 presents spectrograms of three UAV models-DJI Air 3, DJI Neo, and DJI Avata 2-recorded during hovering at a distance of 1 meter using the RØDE NTG-2. While the figure shows results obtained with this microphone, identical tonal components and frequency structures were consistently observed across all other tested microphones. The spectrograms varied in terms of signal strength and wind-related noise, depending on the microphone type and shielding, but the underlying frequency content remained unchanged. The RØDE NTG-2 results were selected for illustration due to their clarity and representativeness.
These examples illustrate the broadband nature of UAV emissions, the presence of tonal bands associated with motor and propeller harmonics, and the variations in spectral energy concentration among different types of drones. All spectrograms are expressed in decibels relative to full scale per hertz (dBFS/Hz), where 0 dBFS corresponds to the maximum representable digital amplitude of the recorder.
The spectrograms in
Figure 8 reveal that all three UAVs generate broadband acoustic emissions, with energy concentrated predominantly in the lower frequency range, below 2 kHz. However, apparent differences can be observed across models. The DJI Air 3 exhibits stable tonal bands with harmonics spaced at regular intervals, suggesting consistent motor speed and minimal vibrational interference. The DJI Neo, in contrast, presents a more fragmented spectral pattern, characterized by irregular harmonic spacing and increased high-frequency content, which may indicate unstable hovering or fluctuating rotor speeds. Notably, the harmonic components for this model, although lower in energy, extend up to approximately 15 kHz, indicating a broader spectral footprint compared to the other UAVs. Meanwhile, DJI Avata 2 concentrates most of its acoustic energy in the lowest frequency bands and shows fewer distinct harmonic structures.
To quantify UAV-specific content, we estimated one-sided power spectral densities (PSDs) using the Welch method from 30 s hover segments for each microphone and from an immediately adjacent background noise segment recorded with the same geometry (Hann window; segment length, N = 32,768 samples; 50% overlap). This parameterization was chosen after exploratory testing of alternative settings (4096–65,384 samples, 25–75% overlap) and provides an optimal trade-off between frequency resolution (~2.93 Hz) and temporal stability under variable wind conditions. Shorter windows degraded harmonic separation and increased PSD variance, while longer ones improved resolution at the expense of robustness to transient background fluctuations. The selected configuration ensured that UAV-specific tonal peaks remained well resolved while minimizing sensitivity to non-stationary ambient noise. The following metric was computed separately for each microphone:
where
PSDUAV(f) and
PSDbg(f) denote the Welch PSDs of the UAV and background noise segments, respectively, values > 0 dB indicate excess acoustic energy attributable to the UAV. Candidate tonal components were then located on
ΔPSDm(f) after light Gaussian smoothing (σ ≈ 20 Hz). Peaks were required to have a minimum prominence of 6 dB. For each detected peak, the tonal band was defined by the two -6 dB crossings of
ΔPSDm(f) around the peak.
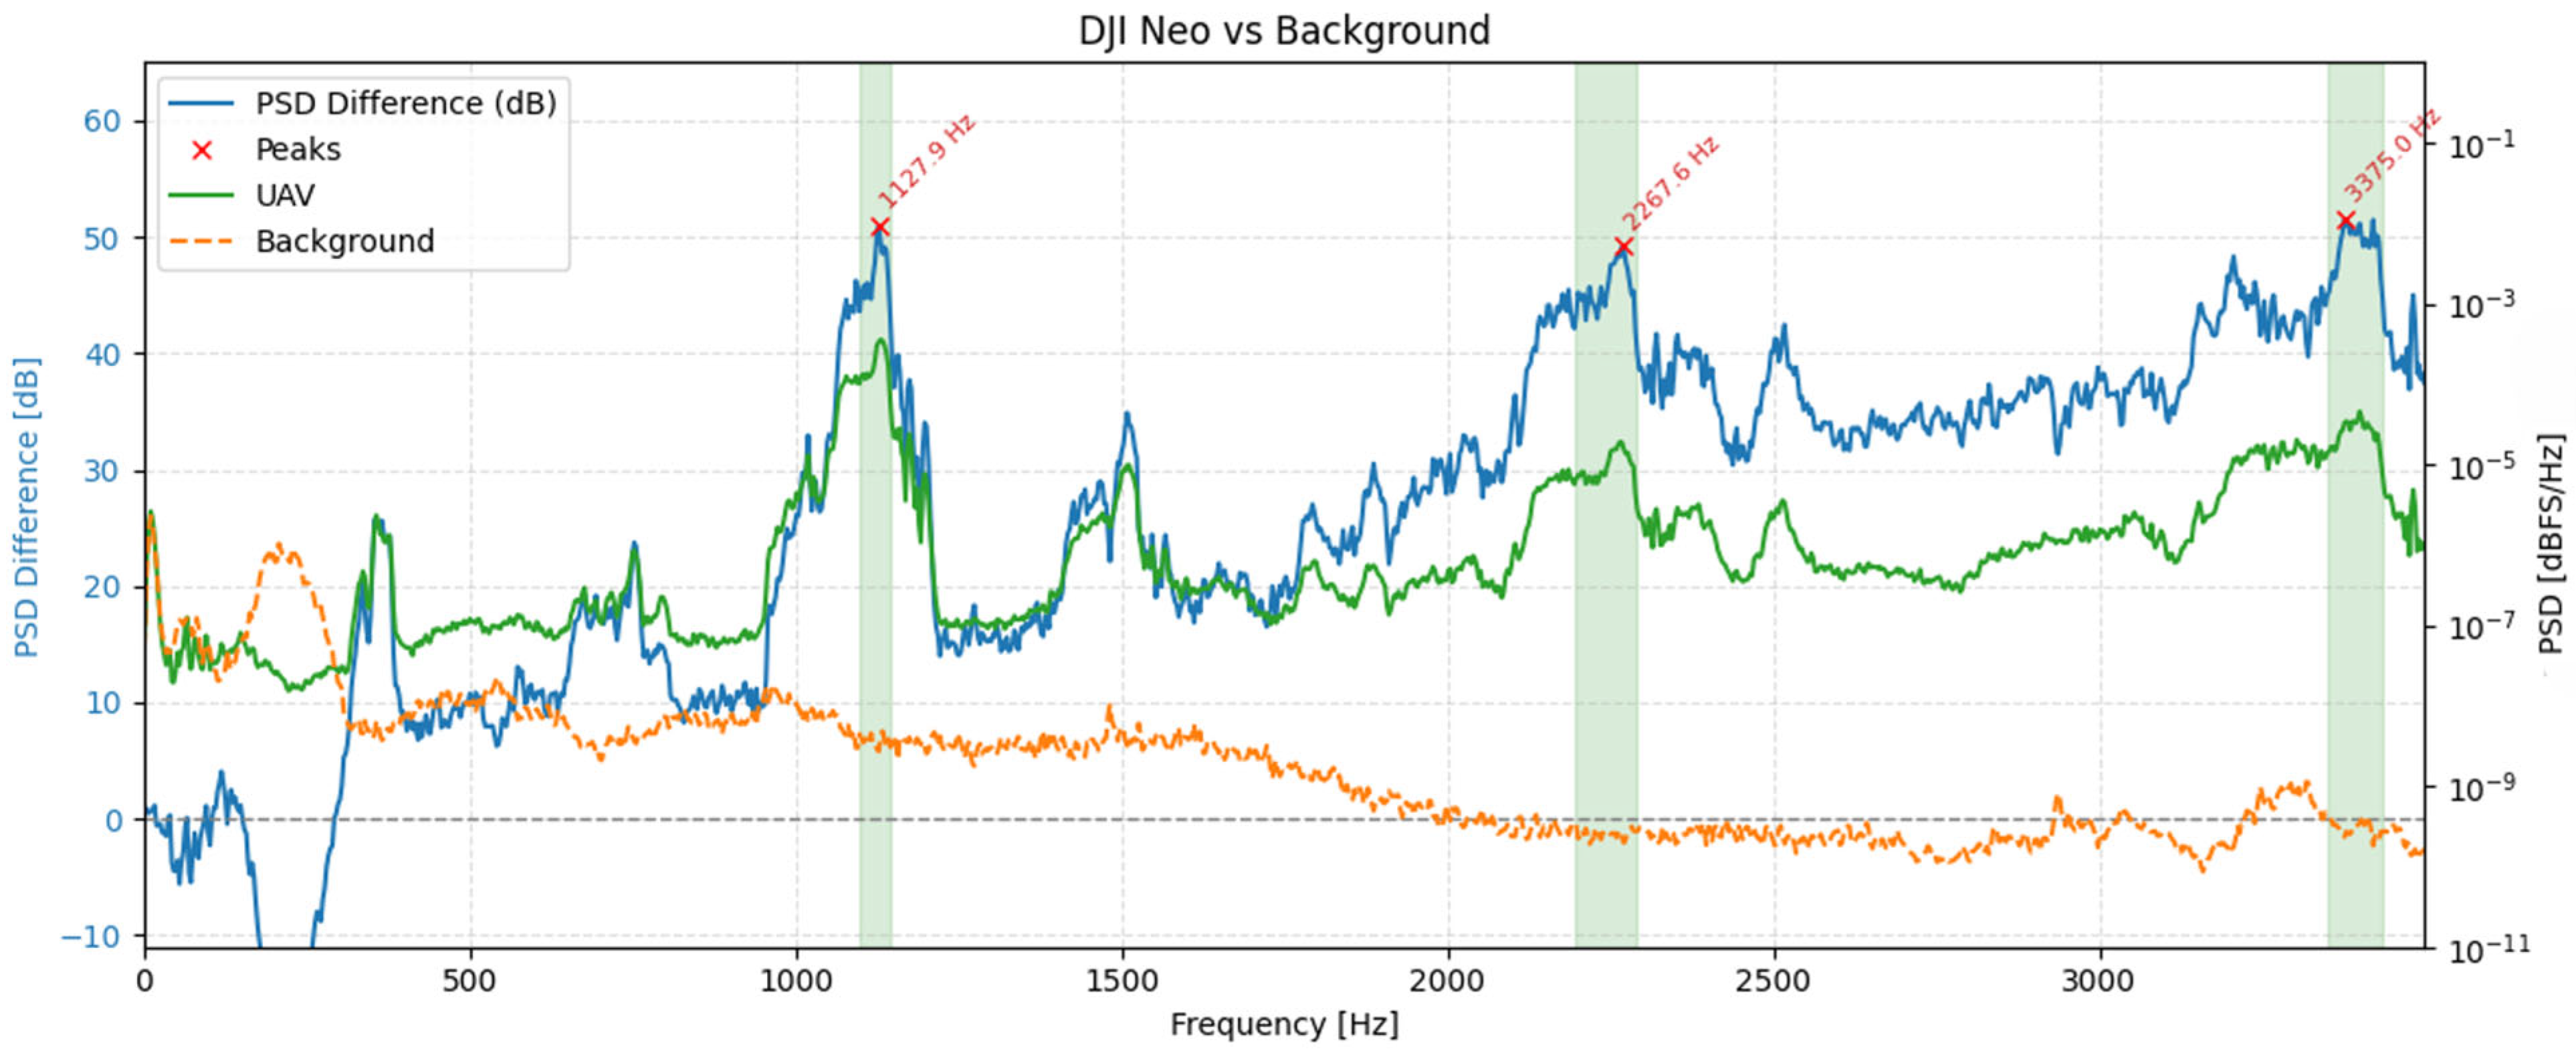
Figure 9,
Figure 10 and
Figure 11 show, for each platform, the UAV (green) and background (orange) PSDs together with the differential spectrum
ΔPSDm(f) (blue). Red markers denote peaks selected by the ≥ 6 dB prominence criterion, and shaded regions indicate the automatically derived ±6 dB tonal bands. These plots highlight frequency ranges where UAV energy rises above the background noise.
The spectral profiles of the three UAV platforms reveal distinct yet structurally consistent acoustic patterns. For the DJI Air 3, two separate families of harmonic peaks can be observed: one aligned around ~170 Hz and its integer multiples, and another originating near ~144 Hz. This dual-harmonic structure likely stems from slight speed differences between rotor pairs, suggesting desynchronization or intentionally varied RPMs for control stability. In contrast, the DJI Avata 2 exhibits fewer discrete peaks but broader spectral regions centered near ~724 Hz, 1450 Hz, and 2177 Hz. These wider bands may reflect overlapping contributions from multiple rotors operating at close but non-identical frequencies, or the influence of modulated motor loads and frame dynamics. DJI Neo presents the most broadband character, with dominant wide peaks at ~1128 Hz, 2268 Hz, and 3375 Hz. The absence of narrow, harmonically spaced tones suggests greater spectral overlap or frequency modulation across rotors. Despite these differences, all UAVs exhibit tonal components with clearly elevated power above background noise levels, confirming the presence of UAV-specific acoustic signatures.
While
Figure 9,
Figure 10 and
Figure 11 visually highlight the locations of UAV tonal components, they also represent quantitative results, as numerical spectral metrics were computed for each case. For every UAV-microphone pair and for each recorded distance, we compare the UAV segment with a time-adjacent background segment of identical geometry and compute three complementary metrics:
Harmonic SNR [dB]–the ratio of UAV to background spectral power integrated only within narrow bands centered at integer multiples of the blade-pass frequency
. The set of bands is anchored at
estimated from the 1 m recording (through cepstral analysis) and spaced at its harmonics; each band spans ±8% of its center frequency to tolerate small RPM fluctuations. It is calculated by the following expression:
where
PSDUAV(f) and
PSDBG(f) are the one-sided Welch
PSDs and
BH denotes the union of all harmonic windows:
with
p = 0.08. This metric isolates UAV-specific tonal energy while de-emphasizing broadband clutter.
Wideband SNR [dB]–computed analogously, but integrated over the full analysis range [0, Fmax] with Fmax = 48 kHz, reflecting overall prominence of UAV sound without harmonic priors.
LF floor [dB]–the median background noise level in the low-frequency (LF) band (0–300 Hz), representative of wind/handling/flow noise.
For each UAV-microphone pair, the metrics were averaged across all available distances (1–50 m) to avoid undue influence of any single range point. Results are reported separately for each UAV to preserve platform-specific spectral characteristics.
On DJI Air 3 (
Table 8), harmonic SNRs cluster tightly around modest values across all NTG-2 configurations, indicating relatively weak tonal structure for this platform. Adding WS6 or DeadCat primarily improves wideband SNR by a few decibels and lowers the LF floor by a similar margin, consistent with better suppression of wind-borne noise. The parabolic dish delivers a low LF floor comparable to the large-diaphragm Behringer microphones, while the Mozos VMic exhibits the highest LF floor and the lowest wideband SNR.
For DJI Avata 2 (
Table 9), harmonic energy is markedly stronger: harmonic SNR rises into the mid-teens and above for most microphones. Windshields again boost wideband SNR relative to the bare NTG-2 without materially changing the harmonic SNR ordering. Large-diaphragm condensers achieve the quietest LF floors, reflecting good immunity to low-frequency contamination during hover.
DJI Neo (
Table 10) shows the most pronounced tonal signature. The harmonic SNR is highest for the WS6 and parabolic configurations, with the bare NTG-2 trailing slightly; the wideband SNR follows the same pattern. LF floors lie in the −70 to −78 dB range, with Behringer microphones again among the quietest at low frequencies.
Across platforms, three patterns emerge. First, harmonic SNR—the most relevant figure for tonal detectors—shows only minor differences between NTG-2 variants on Air 3 and Avata 2, but clear gains for WS6/parabola on Neo. Second, wideband SNR benefits consistently from WS6 (and, to a lesser extent, DeadCat), indicating that overall signal prominence in mixed noise is often limited by the LF background noise rather than by the capsule’s ability to capture tones. Third, microphones with inherently lower LF floors (parabolic and large-diaphragm condensers) are advantaged whenever wind/flow noise dominates.
