Article

Intensity Noise Suppression in Photonic Detector Systems for Spectroscopic Applications

1
Aerospace Information Research Institute, Chinese Academy of Sciences, Beijing 100094, China
2
School of Optoelectronics, University of Chinese Academy of Sciences, Beijing 100049, China
*
Author to whom correspondence should be addressed.
Sensors 2025, 25(22), 6932; https://doi.org/10.3390/s25226932 (registering DOI)
Submission received: 15 October 2025 / Revised: 7 November 2025 / Accepted: 11 November 2025 / Published: 13 November 2025
(This article belongs to the Section Optical Sensors)

Abstract

Spectral measurement technology has found extensive applications across a diverse range of fields, including chemical analysis, environmental monitoring, precise measurement, and laser frequency stabilization. However, the accuracy of spectral measurement results is often constrained by the power noise and frequency jitter inherent in the light source. In contrast to the traditional differential amplification method for acquiring spectral signals, our study introduces a novel approach. By employing a power correction quotient, we effectively suppress common-mode noise. Additionally, we introduce a novel composite differential method that, in theory, is capable of performing closed-loop processing on spectral signals to stabilize the laser frequency. This innovative method not only constructs a stable laser source but also yields high-quality spectral signals simultaneously. In an experiment involving iodine molecule absorption spectroscopy, the algorithm we propose demonstrated remarkable efficacy in mitigating distortions caused by modulated signals and significantly enhanced the signal-to-noise ratio. This algorithm is versatile and can be applied to the signal processing of any spectral signal sensor that employs dual-path light.

1. Introduction

Spectral measurement technology is widely used in various applications, such as optical frequency domain reflectometry (OFDR) [1], frequency stabilization [2,3], environmental monitoring [4,5], material analysis [6], interferometry metrology, and other fields [7] due to its advantages of high precision, intuitive data presentation, and wide wavelength range.
However, the wavelength and output power of lasers are prone to severe drift. This drift originates from the material properties of the lasers, which are influenced by various factors such as current [8], temperature [9], etc. Consequently, it’s impossible to obtain a stable laser output for a free-running mode laser, which often exhibits wavelength shifts of several picometers over long periods.
For lasers, a stabilization system based on iodine molecular saturation absorption is well-known. This system leverages the inherent stability of iodine molecular natural absorption lines to achieve high long-term stability. G. R. Hanes et al. were the first to use saturated absorption spectroscopy (SAS) of iodine vapor to enhance laser stability, achieving the short-term stability of 10−9 and the long-term stability of 10−10 [10]. More recently, Shogo Matsunaga et al. proposed a numerical simulation model and utilized saturation spectroscopy to calculate the interaction-length dependence of frequency stability [3]. Despite significant advancements in laser frequency stabilization technology that have mitigated wavelength drift issues, current methods still exhibit certain limitations. Frequency stabilization methods based on molecular absorption lines offer superior long-term stability and can eliminate Doppler background noise using the third harmonic method. However, these methods often suffer from low signal intensity. Moreover, for Distributed Feedback (DFB) lasers or Distributed Bragg Reflector (DBR) lasers, electric factors such as injection current and piezoelectric transducer (PZT) voltage can cause significant changes in wavelength and power [11]. These changes are highly detrimental to sensors that rely on scanning spectroscopy to acquire information.
Consequently, the development of anti-interference algorithms has garnered significant attention. Traditional algorithms rely on frequency jitter and the phase of demodulated signals to qualitatively determine the offset frequency relative to the reference frequency. However, this approach is inherently inaccurate due to the presence of Doppler background noise. To address this limitation, demodulation algorithms based on higher harmonics were subsequently developed. These algorithms utilize third, fifth, and seventh harmonics to achieve steeper slopes [12,13]. While higher-order harmonics effectively filter out background noise, they also result in exponentially decreasing signal strength and narrower linear regions. Moreover, these algorithms are not only highly sensitive to external environmental factors but also to power noise introduced by the light source itself. Recently, a noise-immune cavity-enhanced optical heterodyne molecular spectroscopy (NICE-OHMS) algorithm has been proposed, yet it still faces certain limitations [14]. H. Xie et al. integrated visible light-infrared reflectance spectroscopy with machine learning (ML) algorithms to enable rapid detection of iron ore grades, thereby satisfying the demands of mining production [15]. Nonetheless, the model was intricate and necessitated a training dataset. W. He et al. introduced an automatic overlapping peak decomposition algorithm [16] that relies on signal smoothing, iterative sharpening, and peak fitting. However, the study did not address the power noise intrinsic to the light source itself. K. Ozawa et al. developed a local adaptive smoothing method [17], which is capable of preserving sharp peaks and reducing signal distortion. However, this method is ineffective for removing modulation noise.
In this study, we theoretically examined third-harmonic frequency stabilization technology anchored in molecular absorption lines, closely examining how power modulation noise (PMN) from the laser source and the second harmonic in the modulation signal affect the process. Drawing on this examination, we devised an anti-interference frequency stabilization signal algorithm that employs a composite differentiation method. We validated the efficacy of this algorithm via a frequency stabilization setup featuring a 633 nm semiconductor laser diode. The algorithm successfully eradicated power noise during the spectral scanning phase in the laser frequency stabilization setup, which operates on the iodine molecule absorption spectrum principle. It adeptly reconstructed the spectral signal and tripled the frequency locking range.

2. Methods

2.1. Frequency Stabilization System Based on SAS

Given that a molecular gas sample exhibits a Maxwell–Boltzmann velocity distribution, when a monochromatic laser beam at frequency ω traverses an iodine cell, the Doppler-shifted laser frequency in the moving molecular frame becomes ω = ω ± k v z . Significant absorption contributions from molecules occur only when this shifted frequency lies within the homogeneous broadening linewidth γ, centered at the stationary molecule’s absorption frequency ω 0 . At ω 0 , a characteristic dip, termed the Lamb dip, emerges in the absorption curve due to the reduced number of contributing particles, leading to minimal output power. Concurrently, when a weaker laser beam passes through the iodine cell in the opposite direction, Lamb peaks appear on the Doppler-broadened absorption line, thereby forming the saturation absorption spectrum. Prior research has demonstrated that incorporating saturation absorption spectra enhances spectral resolution and subsequently boosts the signal-to-noise ratio (SNR) of the frequency stabilization signal [18].
To mitigate Doppler background effects, light source modulation and frequency stabilization based on the third harmonic of the power signal are commonly employed. However, when the frequency of a semiconductor laser is modulated via current, PMN is simultaneously introduced in the output power. Moreover, the modulation signal is typically not a pure sine wave but contains higher harmonics, with the second harmonic having the most pronounced impact, thereby causing modulation harmonic noise (MHN).
The experimental setup for a 633 nm semiconductor laser is depicted in Figure 1. The laser emits 20 mW of power with a 1 mm beam diameter. To ensure precise alignment of the detection and saturation light within the iodine cell, the setup maintains parallelism within 0.01° and keeps eccentricity below 10 μm. The light power signal, after being amplified by detectors with an 80 kV/W gain factor, is processed by an algorithm to generate a frequency stabilization signal. To produce a differential signal and eliminate Doppler background noise, the laser current is modulated with a 10 kHz sine wave at 10 mA amplitude. To reduce environmental interference, the laser chip is equipped with dual thermoelectric coolers (TECs), maintaining temperature fluctuations below 1 mK. The laser is driven by a constant current source with 0.3 μA resolution and stability exceeding 5 ppm over 24 h. The acquisition card operates at a 10 MSa/s sampling rate. The iodine cell is kept at a constant temperature of 70 °C.
After traversing the isolator, 1% of the laser energy is diverted to the frequency stabilization system (highlighted in the green box) via a 1 × 2 optical coupler, while the remaining 99% is designated for output. The incident beam’s energy ratio between polarized and non-polarized light is then fine-tuned using a fiber optical coupler (FOC), a half-wave plate (HWP), and a polarization beam splitter (PBS). Around 20 mW of the transmitted light is employed to detect the iodine molecule absorption spectrum, while the reflected light is rerouted by another PBS. The 20 mW of reflected light that passes through the polarizer (POL) and beam splitter (BS) serves as the reference light, and the residual light is channeled back as saturated light to the iodine cells. Two photodetectors (PDs) capture the transmitted light signals, which are then collected by the Field Programmable Gate Array (FPGA) and subsequently processed by the upper computer software. The programmable logic controller (PLC) dispatches commands to the relevant actuators, which can compensate for wavelength drift.

2.1.1. Laser Power Modulation Noise

For a single-mode semiconductor laser, it is assumed that both the probe light and the reference light are modulated simultaneously by a sinusoidal signal at the angular frequency Ω m . The transmittance α of the gas molecule absorption cell is a function of the laser wavelength. The power expressions for the probe light P p   and the reference light P r are given as follows:
P p = P 1 + P 1 m sin Ω m t α λ t ,
P r = P 2 + P 2 m sin Ω m t + φ ,
λ t = λ 0 + δ λ t + Δ λ sin Ω m t ,
where P n ( n = 1 ,   2 ) is the light power, λ 0 is the initial wavelength, δ(λ) represents the wavelength noise of the light source itself, Δ λ   denotes the amplitude of the wavelength modulation signal, t represents time, and the phase difference φ could be corrected to 0. By calculating the Taylor expansion of the power difference signal at point λ = λ 0 and using the Prosthaphaeresis Formula, also considering that the modulation coefficient K I P (current-to-power) and K I λ (current-to-wavelength) are approximately constant, their ratio can be defined as K P λ , the ideal signal corresponding to the third harmonics can be derived as
P 3 t h , D C = K P λ λ 0 t λ t h Δ λ 3 24 d 3 α d λ 3 λ 0 Δ λ 5 384 d 5 α d λ 5 λ 0 + sin 3 Ω m t ,
P 3 t h , A C = K P λ Δ λ 3 8 d 2 α d λ 2 λ 0 5 Δ λ 5 384 d 4 α d λ 4 λ 0 + sin 3 Ω m t .
where P 3 t h represents the third harmonic component of power, and the subscripts DC and AC indicate the direct current and alternating current, respectively, λ t h is the central wavelength of the laser corresponding to the threshold current.
Clearly, the third harmonic amplitude combines the second derivative of α λ t with its third derivative. This combination is disadvantageous for feedback, as it introduces a zero-position offset that compromises the precision of frequency stabilization. Moreover, it affects the magnitude of the frequency deviation signal, resulting in feedback errors. Even under ideal conditions, random fluctuations in the light source can induce feedback errors, which are evident in the λ 0 t term. Near the reference wavelength λ 0 t the magnitudes of the zero-position offset error ϵ λ and the feedback error ϵ P can be expressed, respectively, as
ε λ = c v 0 + 10 4.2622 γ 1.9998 c v 0 .
ε P = P 3 t h , A C K P λ Δ λ 3 8 d 2 α d λ 2 λ 0 ,
where c is the speed of light, v 0 = c λ 0 is the frequency of the laser, γ represents laser linewidth. When v 0 is fixed, ϵ λ only depends on γ .
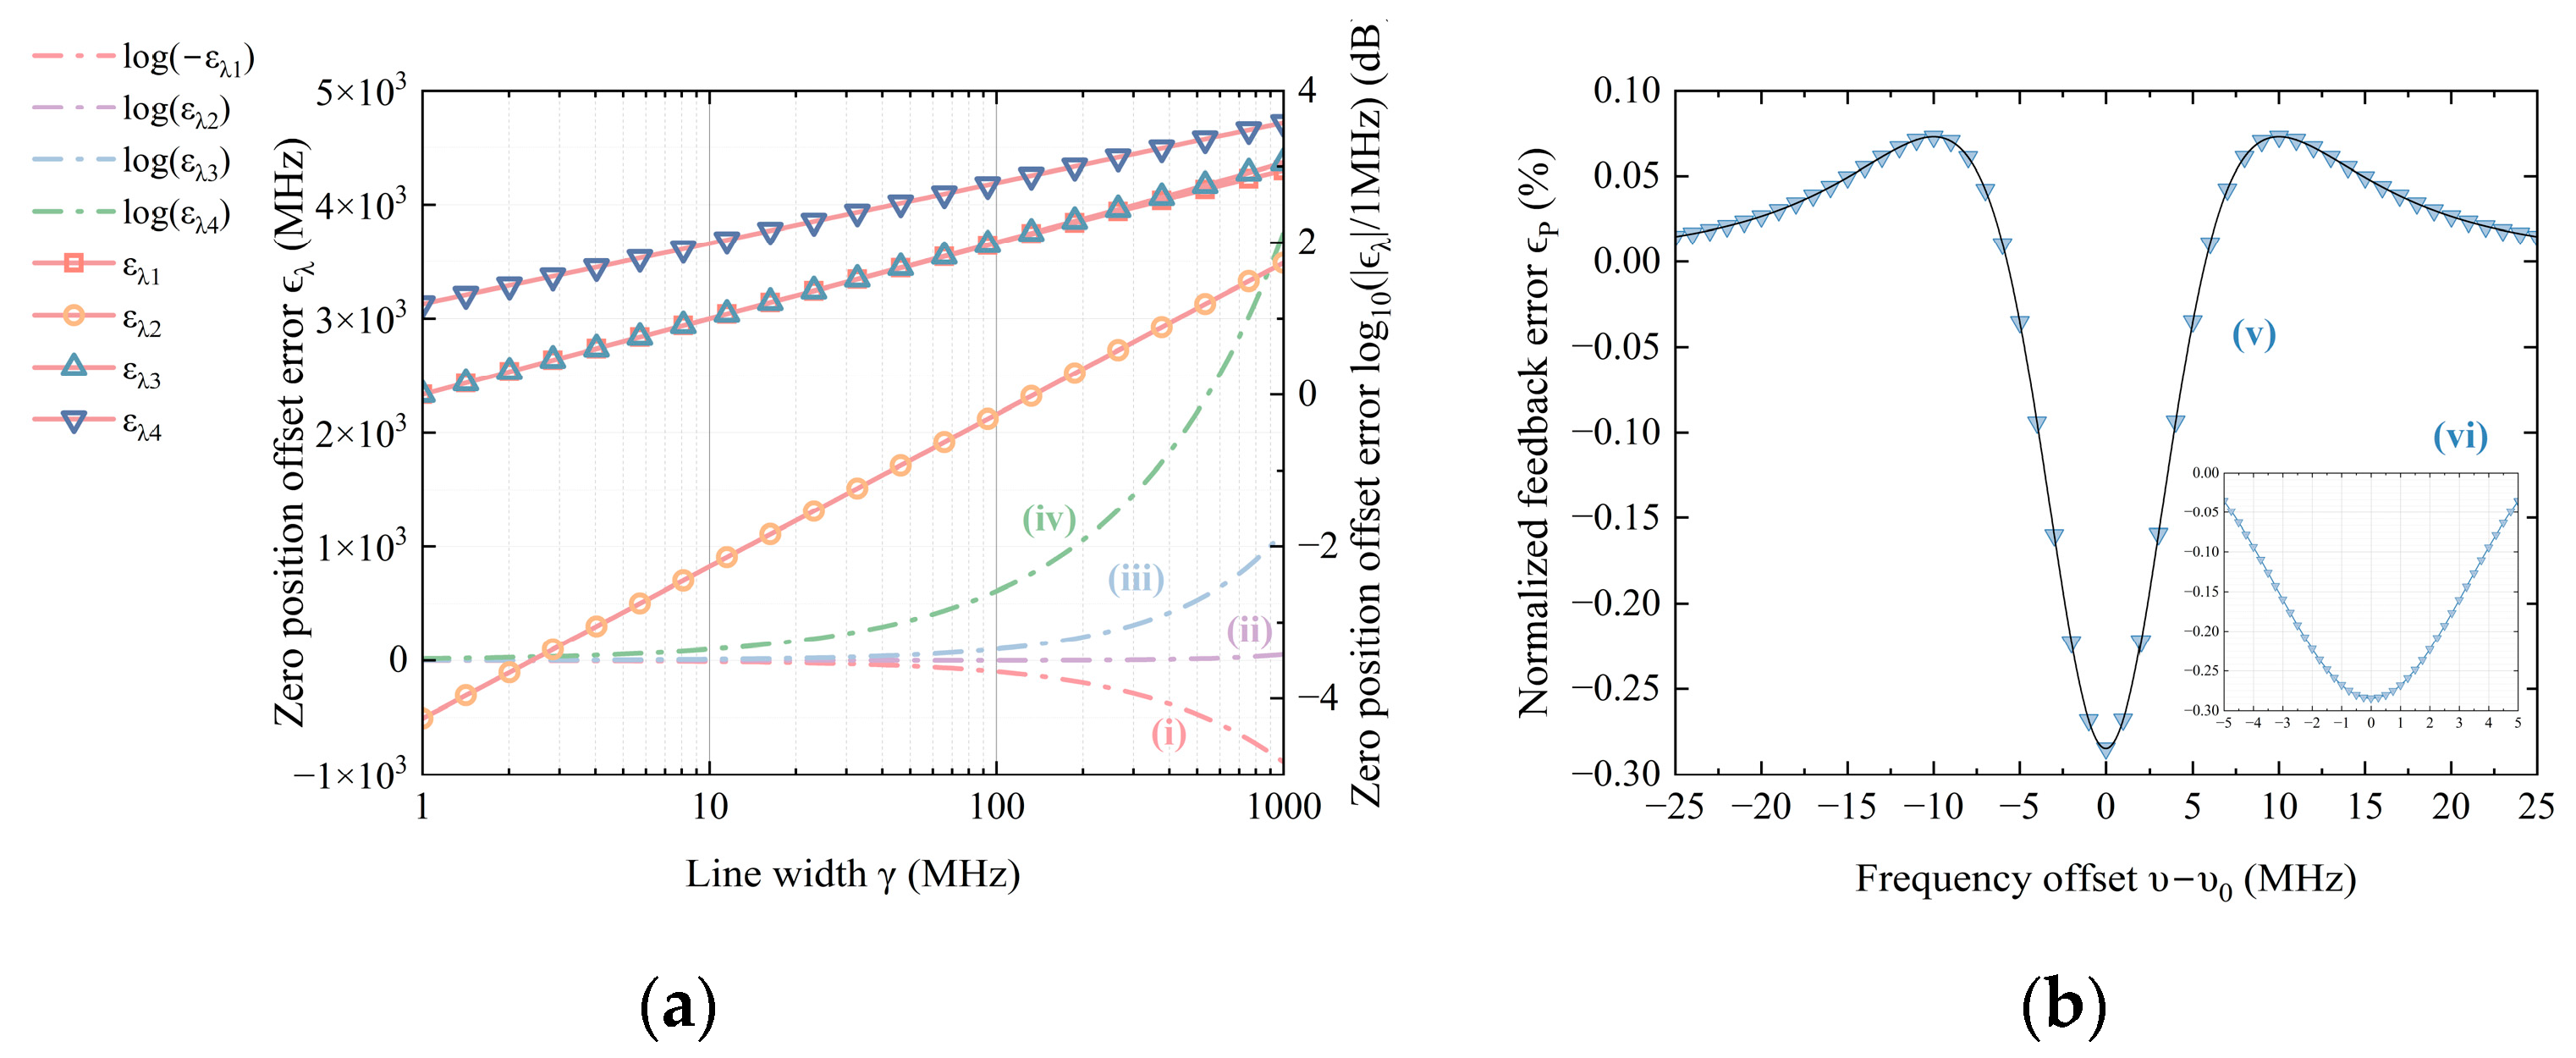
For a semiconductor laser with a line width on the order of MHz, and given parameters λ 0 = 633 nm, λ t h = 633.006 nm, c = 3   ×   10 8 m/s, and γ = 10 MHz, the numerical solutions for ϵ λ and ϵ P as functions of λ 0 and γ were computed using Equations (4)–(7). The simulation results are depicted in Figure 2. To better illustrate the trends, Figure 2a employs both logarithmic (right vertical-axis) and linear (left vertical-axis) coordinates. The signal, resembling a dispersion curve with multiple zeros, yields multiple solutions. Curves (i), (ii), (iii), and (iv) represent the zero-position error. However, only the zeros near the central linear region are meaningful, making curve (ii) the most relevant. In the logarithmic coordinate, ϵ λ clearly increases as a power function of γ with an exponent of approximately 2, determined by the least squares method. Figure 2b shows the feedback error relative to frequency at γ = 10 MHz, along with a partial enlargement. The error magnitude is an even function, positively correlated with frequency deviation. For analytical simplicity, the wavelength modulation amplitude is set to unity, and the feedback error is normalized by dividing by the peak value of the ideal signal. Near the center frequency, the feedback error reaches a maximum of −0.3%, tapering to 0 at the linear region’s edge.

2.1.2. Laser Modulation Harmonic Noise

Owing to the constraints of discretization sampling and the influence of nonlinear loads, digital sinusoidal signals invariably encompass higher harmonics, with the second harmonic being the most prominent. Employing an impure sinusoidal wave for modulation infuses phase and amplitude discrepancies into the frequency stabilization signal.
The output powers incorporating the fundamental and nth harmonic waves with amplitude of B can be depicted as follows
Δ P h a r λ = P 0 2 P 0 2 α λ 0 + d α d λ λ 0 Δ n t + 1 2 ! d 2 α d λ 2 λ 0 Δ n 2 t + + 1 3 ! d 3 α d λ 3 λ 0 Δ n 3 t + ,
Δ n t = Δ λ sin Ω m t + B sin n Ω m t ,
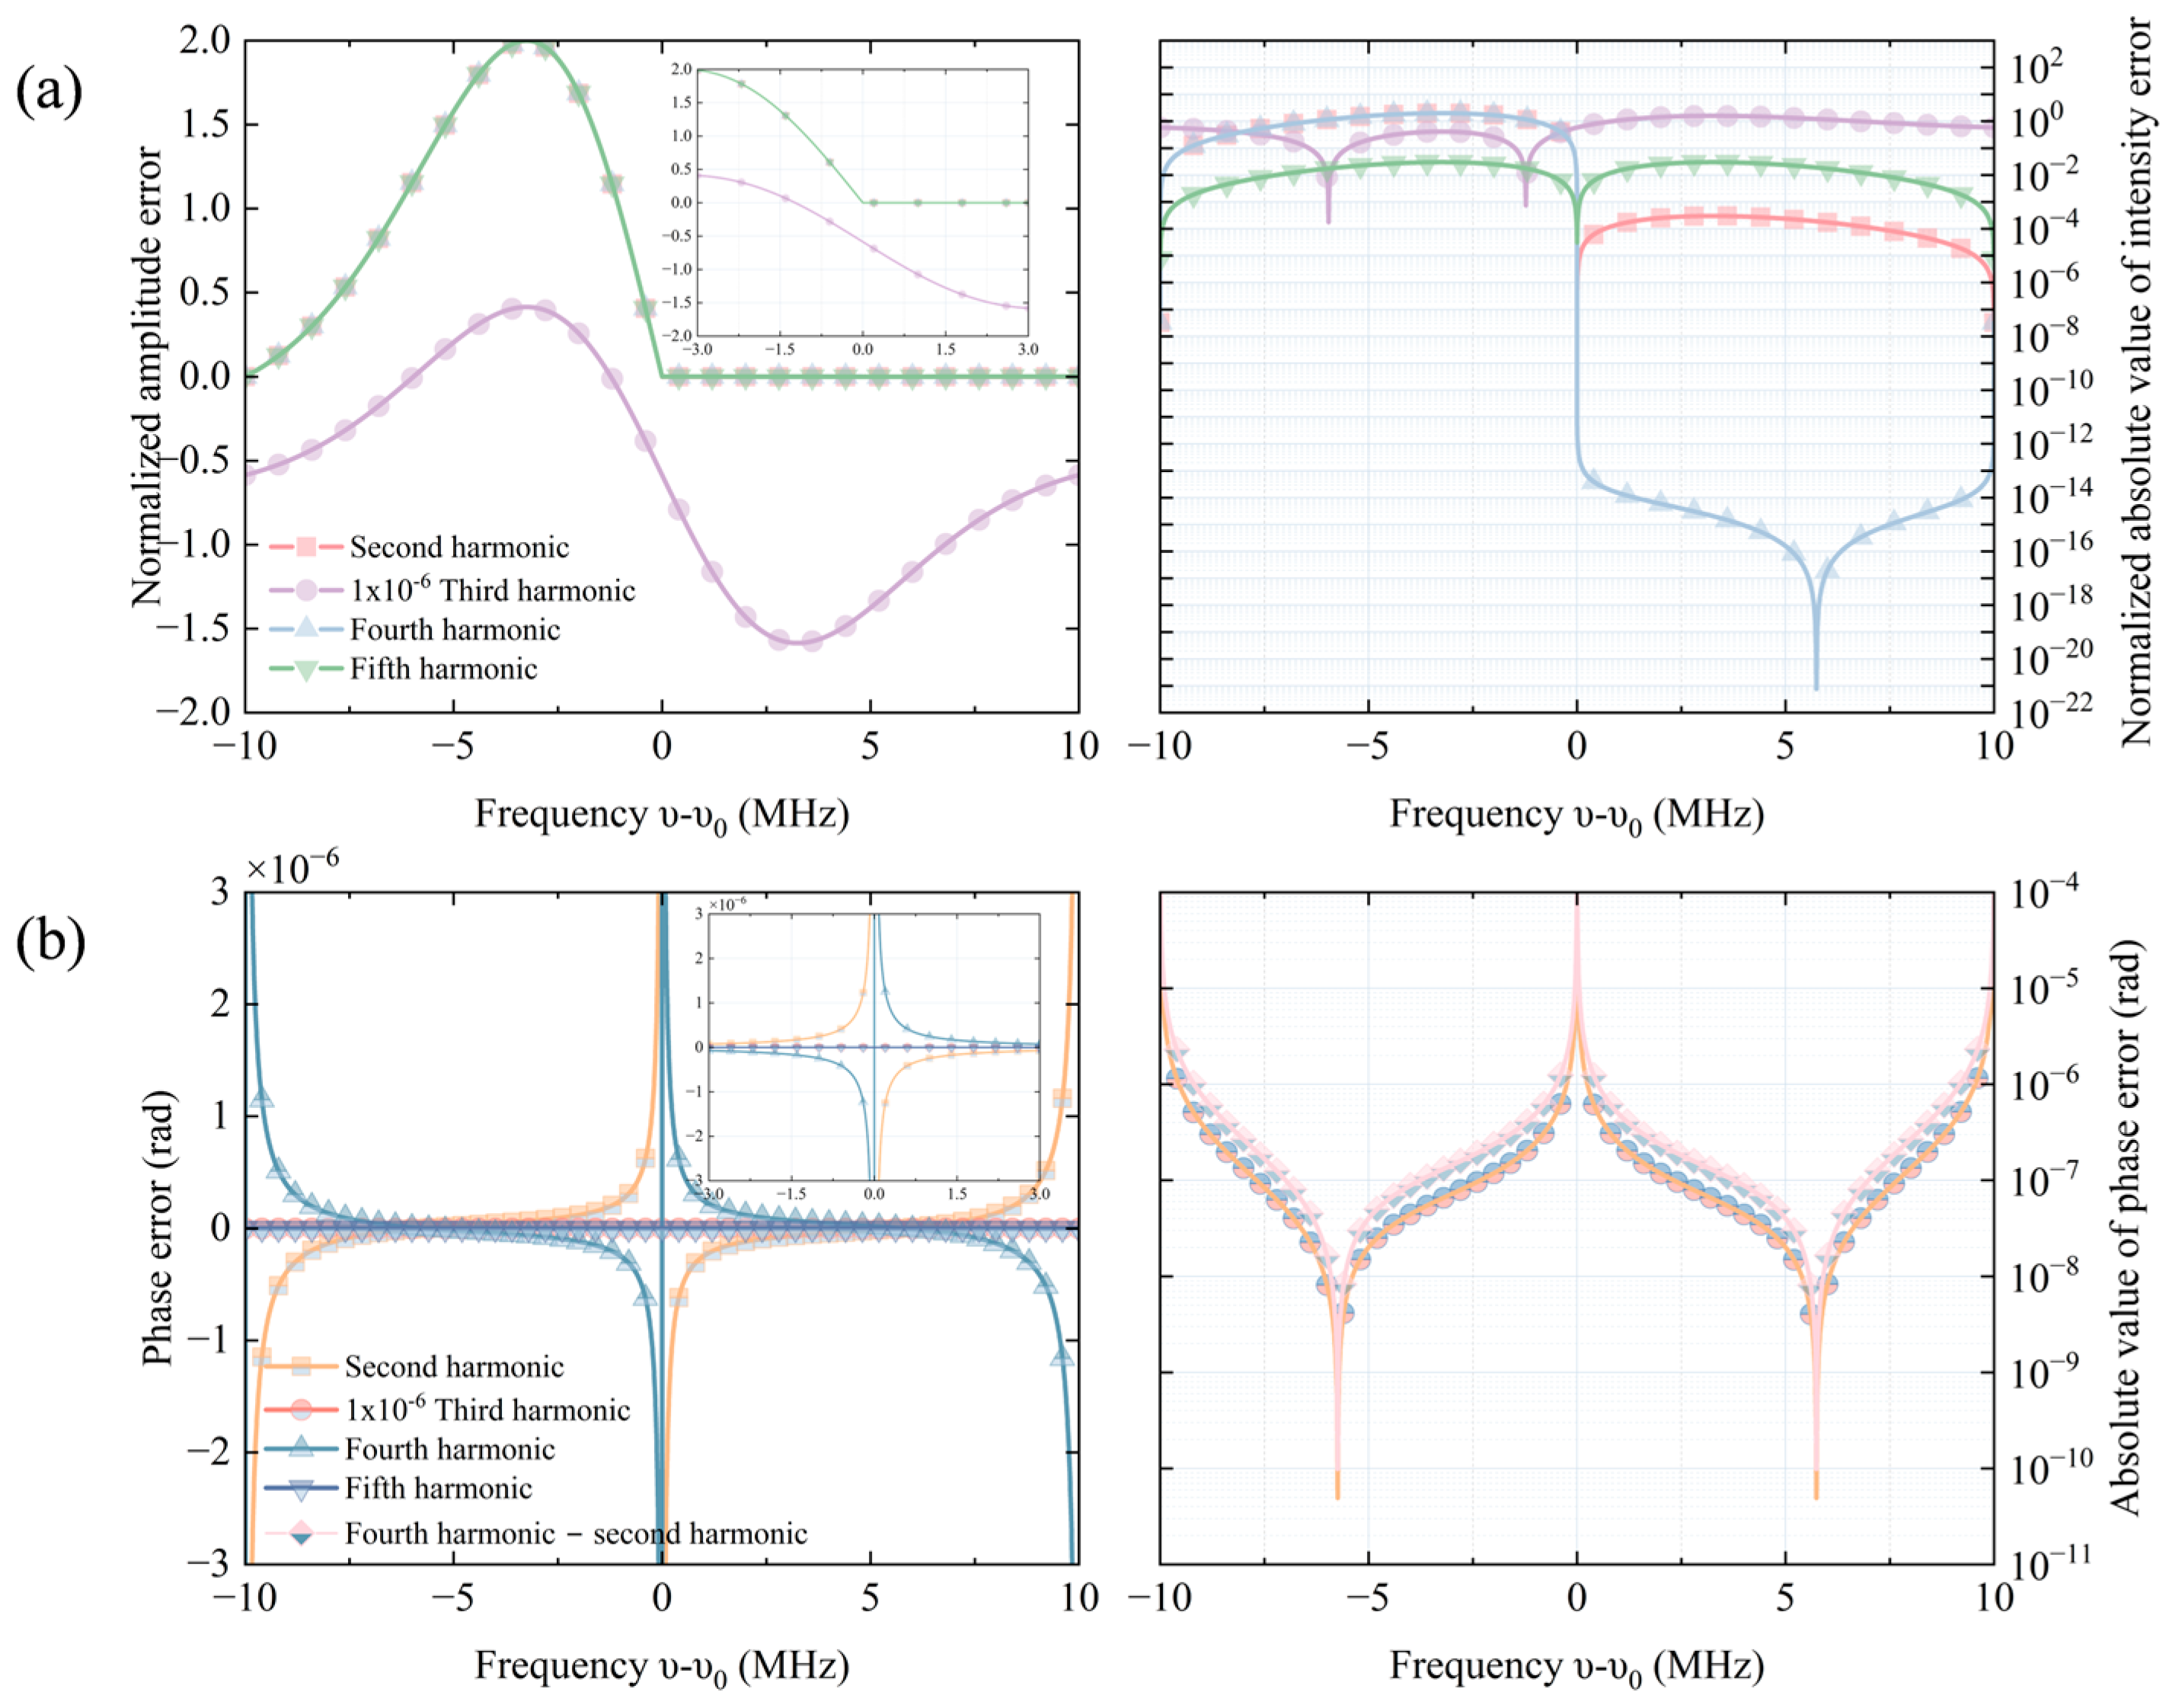
When considering only the first term of the Taylor expansion, harmonics of order higher than 5 are negligible in terms of error contribution to the solution. Figure 3 illustrates the impact of harmonics of various orders with γ = 10 MHz. Regarding amplitude error, the third harmonic has a significantly greater effect on the solution (by about six orders of magnitude) compared to other harmonics, even if its amplitude is only 1% of the fundamental wave. As depicted in Figure 3a, the influence of harmonics on signal intensity is asymmetrical. In the positive frequency deviation interval, the amplitudes of noise introduced by harmonics and the original signal are both positive. However, in the negative frequency deviation interval, the situation differs, leading to more zeros in the signal, which appear as sharp inflection points under logarithmic coordinates. For phase error, only even-order harmonics introduce additional phase errors, as shown in the partial enlargement of Figure 3b. The phase errors introduced by the second and fourth harmonics are so close that distinguishing between them requires a detailed comparison, as illustrated in Figure 3b. At the reference frequency, the phase exhibits a sharp change on the order of 10−4, then steeply drops to 10−10, and subsequently increases back to 10−4.
In practice, the harmonics in electrical signal will be effective depressed after passing through harmonic filter [19], so it’s reasonable to only consider second harmonic in following analysis. Considering only the first term in the Taylor expansion, and using trigonometry formulas, we can calculate the amplitude error Δ P 3 t h and phase error Δ ϕ of the signal as
Δ P 3 t h = Δ λ 3 48 P 0 d 3 α d λ 3 λ 0 1 3 B 2 d 3 α d λ 3 λ 0 2 + 24 Δ λ B d 2 α d λ 2 λ 0 2 ,
Δ ϕ = arctan 24 B d 2 α d λ 2 λ 0 1 3 B 2 Δ λ d 3 α d λ 3 λ 0 .
Additionally, we investigated the impact of the second harmonic under varying harmonic suppression ratio (HSR), with the simulation results presented in Figure 4. As illustrated in Figure 4a, the amplitude error swiftly diminishes as the HSR increases. Interestingly, the peak amplitude error migrates toward the negative frequency deviation as the HSR rises. However, once the HSR surpasses −20 dB, further reductions in the maximum intensity error become less pronounced, a trend observed at other error points as well. Thus, excessively high HSRs are not necessarily advantageous. Similarly, the phase error is most pronounced around the center frequency, as depicted in Figure 4b. Notably, the phase error experiences a near π shift at −10 dB but drops to 10−3 at −20 dB. When the HSR is below −20 dB, the phase error escalates with increasing frequency deviation. Conversely, when the HSR exceeds −20 dB, the phase error remains nearly constant across all frequency deviations, barring abrupt change points.

2.2. Anti-Interference Algorithm

To suppress the inconsistency between the reference light and the detection light power, the instability of the light source power, and the influence of the harmonics of the modulation signal, the correction of the power ratio is adopted to cancel out the common-mode power fluctuations. For convenience, the power of the detection light and the reference light are abbreviated as the DC term and the AC term as follows
P det = P 1 D C + P 1 A C sin Ω m t ,
P r e f = P 2 D C + P 2 A C sin Ω m t ,
the corrected power quotient can be written as
P Q c a l = P det P r e f P 2 D C + P 2 A C P 1 A C P 1 D C P 2 A C P 1 A C .
Theoretically, the value of this formula tends to 1, corresponding to the spectral signal intensity when there is no absorption by iodine molecules.
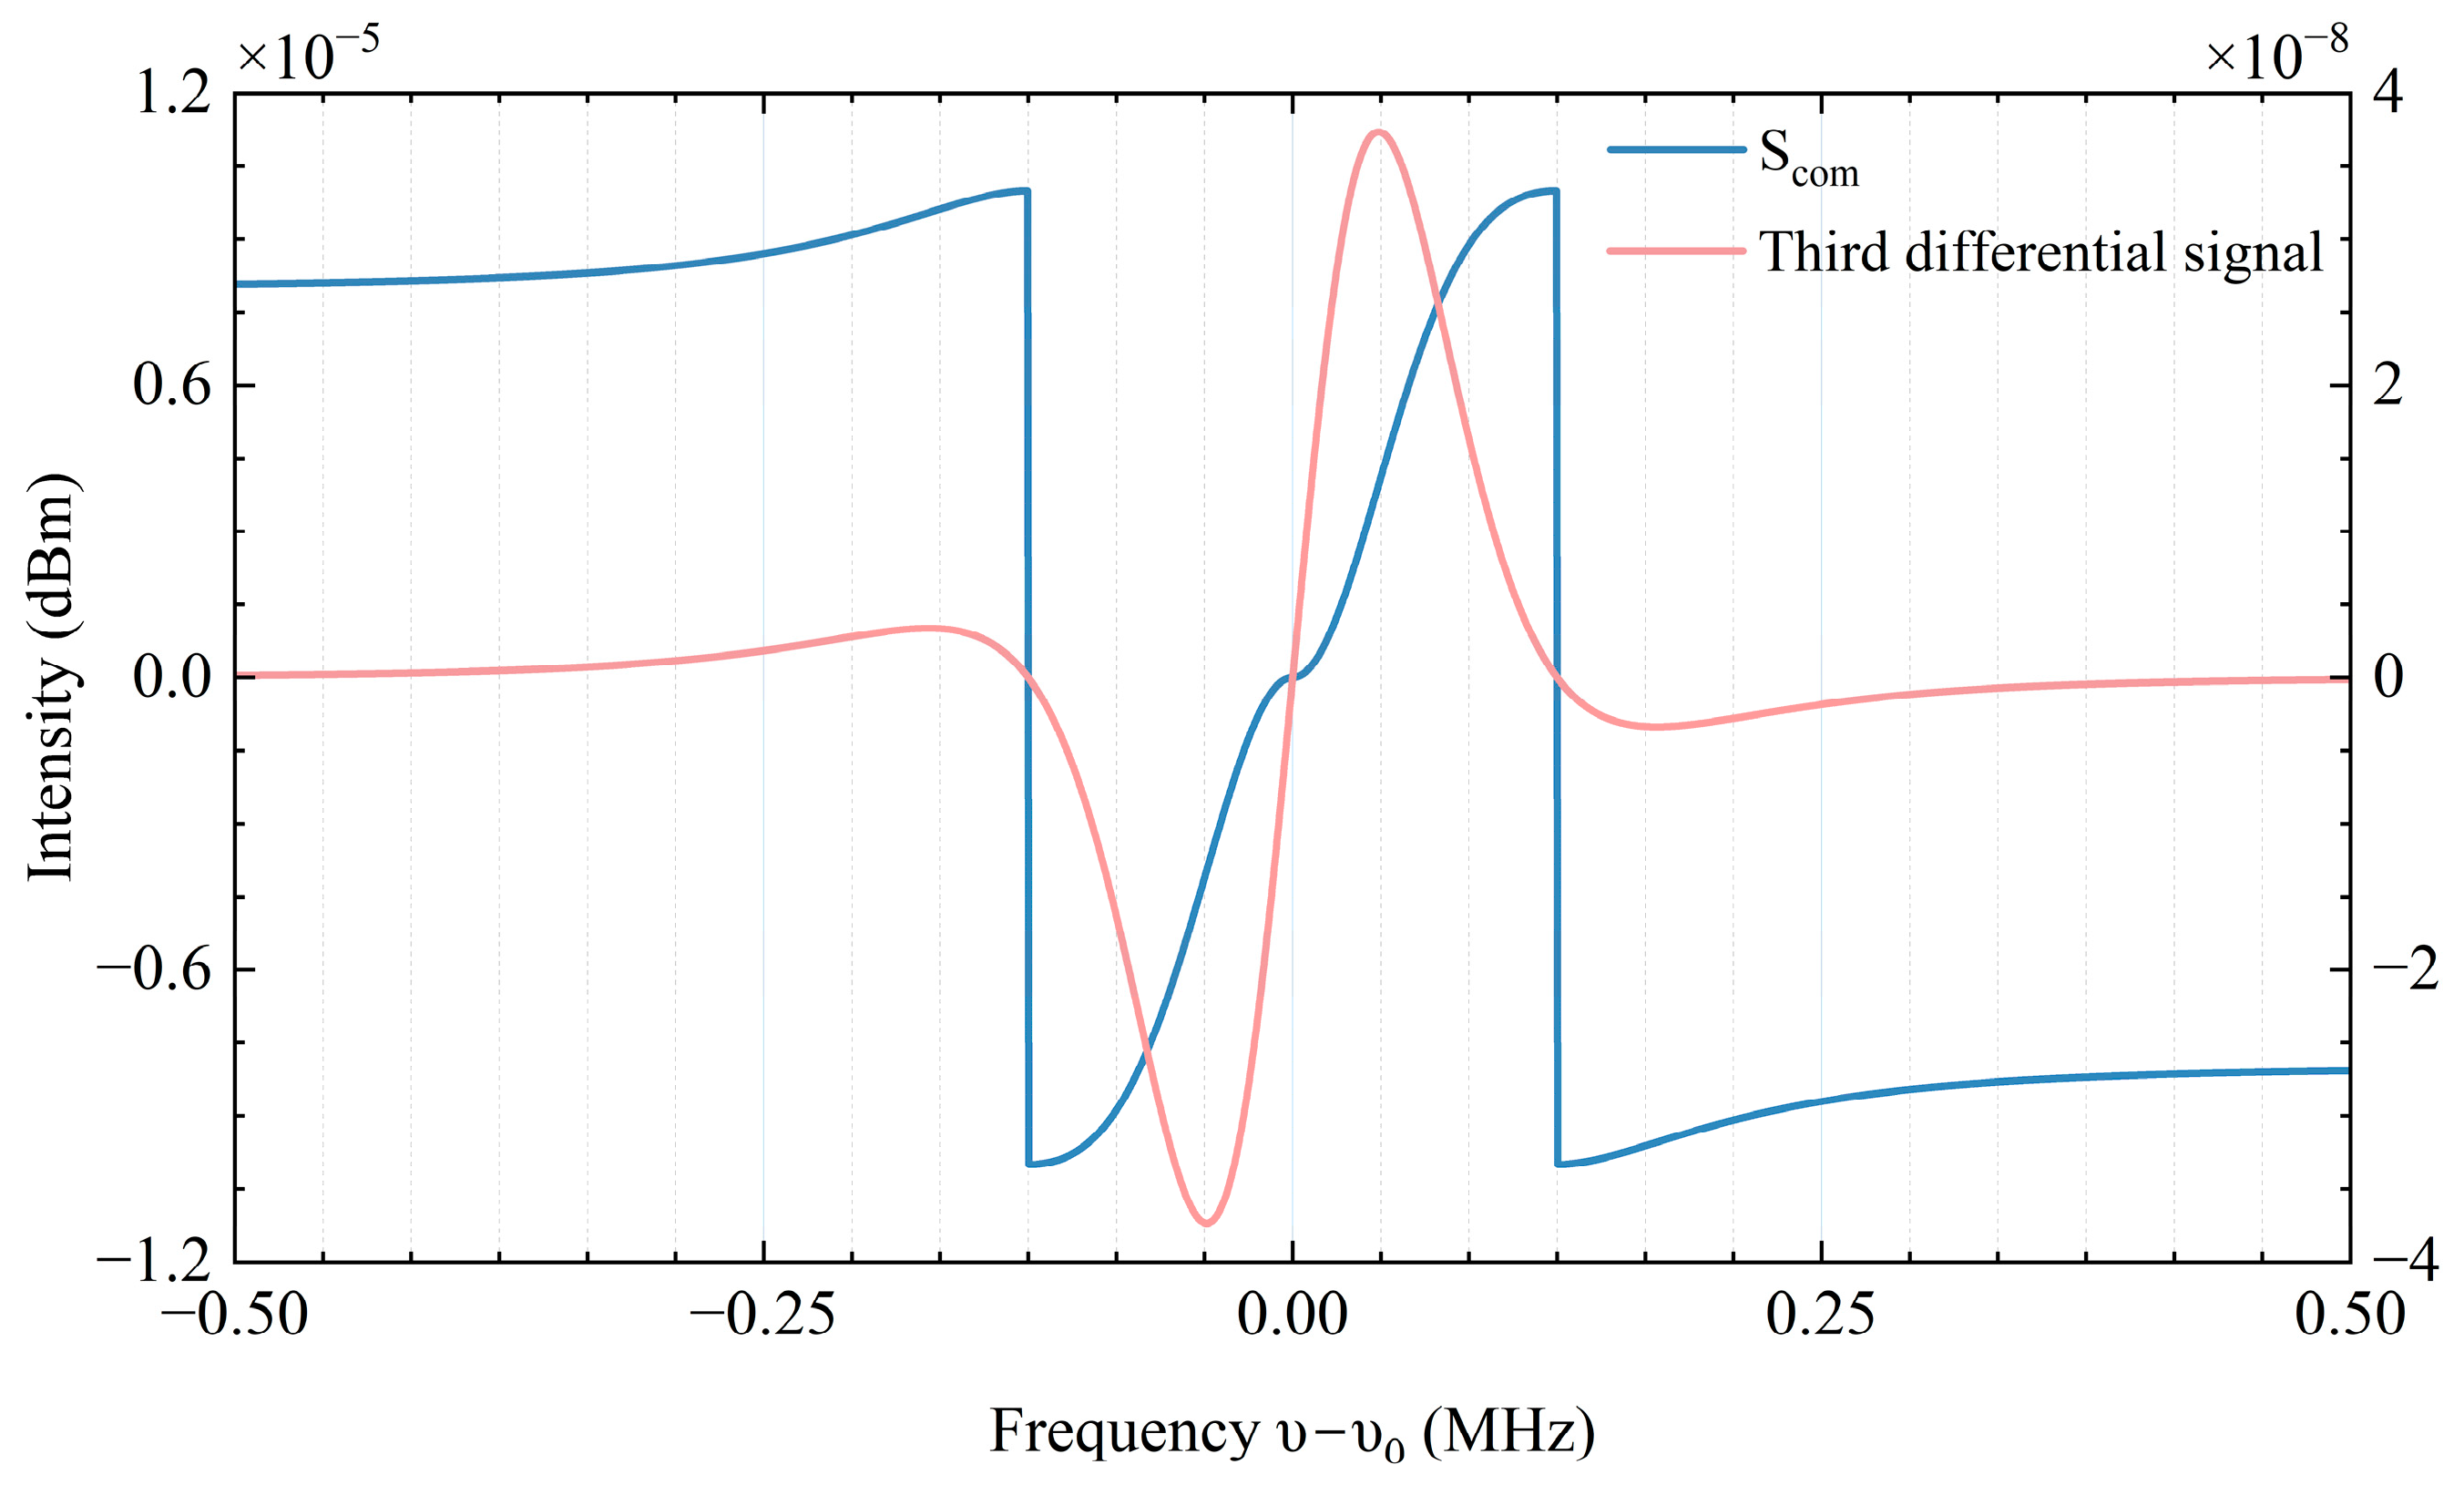
Furthermore, in order to expand the frequency locking range and enhance the signal strength, we employ the composite differential signal S c o m as the error signal.
S c o m = d i f f P Q c a l , 2 2 H d i f f P Q c a l , 3 1 .
where H() represents the unit step function, and diff(f, n) is a function for calculating the nth derivative of f. This signal not only significantly enhances the intensity of the signal but also eliminates the Doppler background noise.
Based on the corrected model of Wallard [18], we can derive the ratio of linear-region width (RLW) and the ratio of linear-region intensity range (RLI) between S c o m and traditional error third differential signal expressions as follows
R L W = 2 γ 2 1 0.8 γ = 3.077 ,
R L I = 5 2 0.8 4 γ 96 0.8 0.8 0.8 = 0.1981 γ .
Anti-interference frequency stabilization algorithm (Algorithm 1) based on compound differential (Pseudo-code)
Algorithm 1. Anti-interference frequency stabilization algorithm
1 Input: Dual optical power intensity signal Pp, Pr.
2 Preprocessing: Outlier detection, denoising.
3 Initialization: Initialize the operating current, TEC working temperature, and PZT
4       voltage via the host computer. Search the absorption peak position.
5 Convergence condition: The amount of feedback is smaller than the linear region
6 Loop:
7 For time > 0 do
8 Fit out the DC and AC components of Pdet and Pref;
9 Calculate PQcal;
10 Solve the frequency deviation amount through Scom;
11 End
12 Output: Update PZT voltage U = U + δU.

3. Results

The experimental schematic diagram is shown in Figure 1, and the equipment and parameters used are listed in Table 1.
When the semiconductor laser is modulated by current, both its wavelength and power change. Figure 5 shows the surfaces of partial wavelength and power measured by the authors as a function of current and voltage. The wavelength was measured by a Bristol 671 series wavelength meter with an accuracy of 0.75 ppm, while the power was measured using a Thorlabs S120C probe with a resolution of 1 nW. Within the single-mode range of the laser, the wavelength exhibits an approximately linear relationship with the current, as does the power.
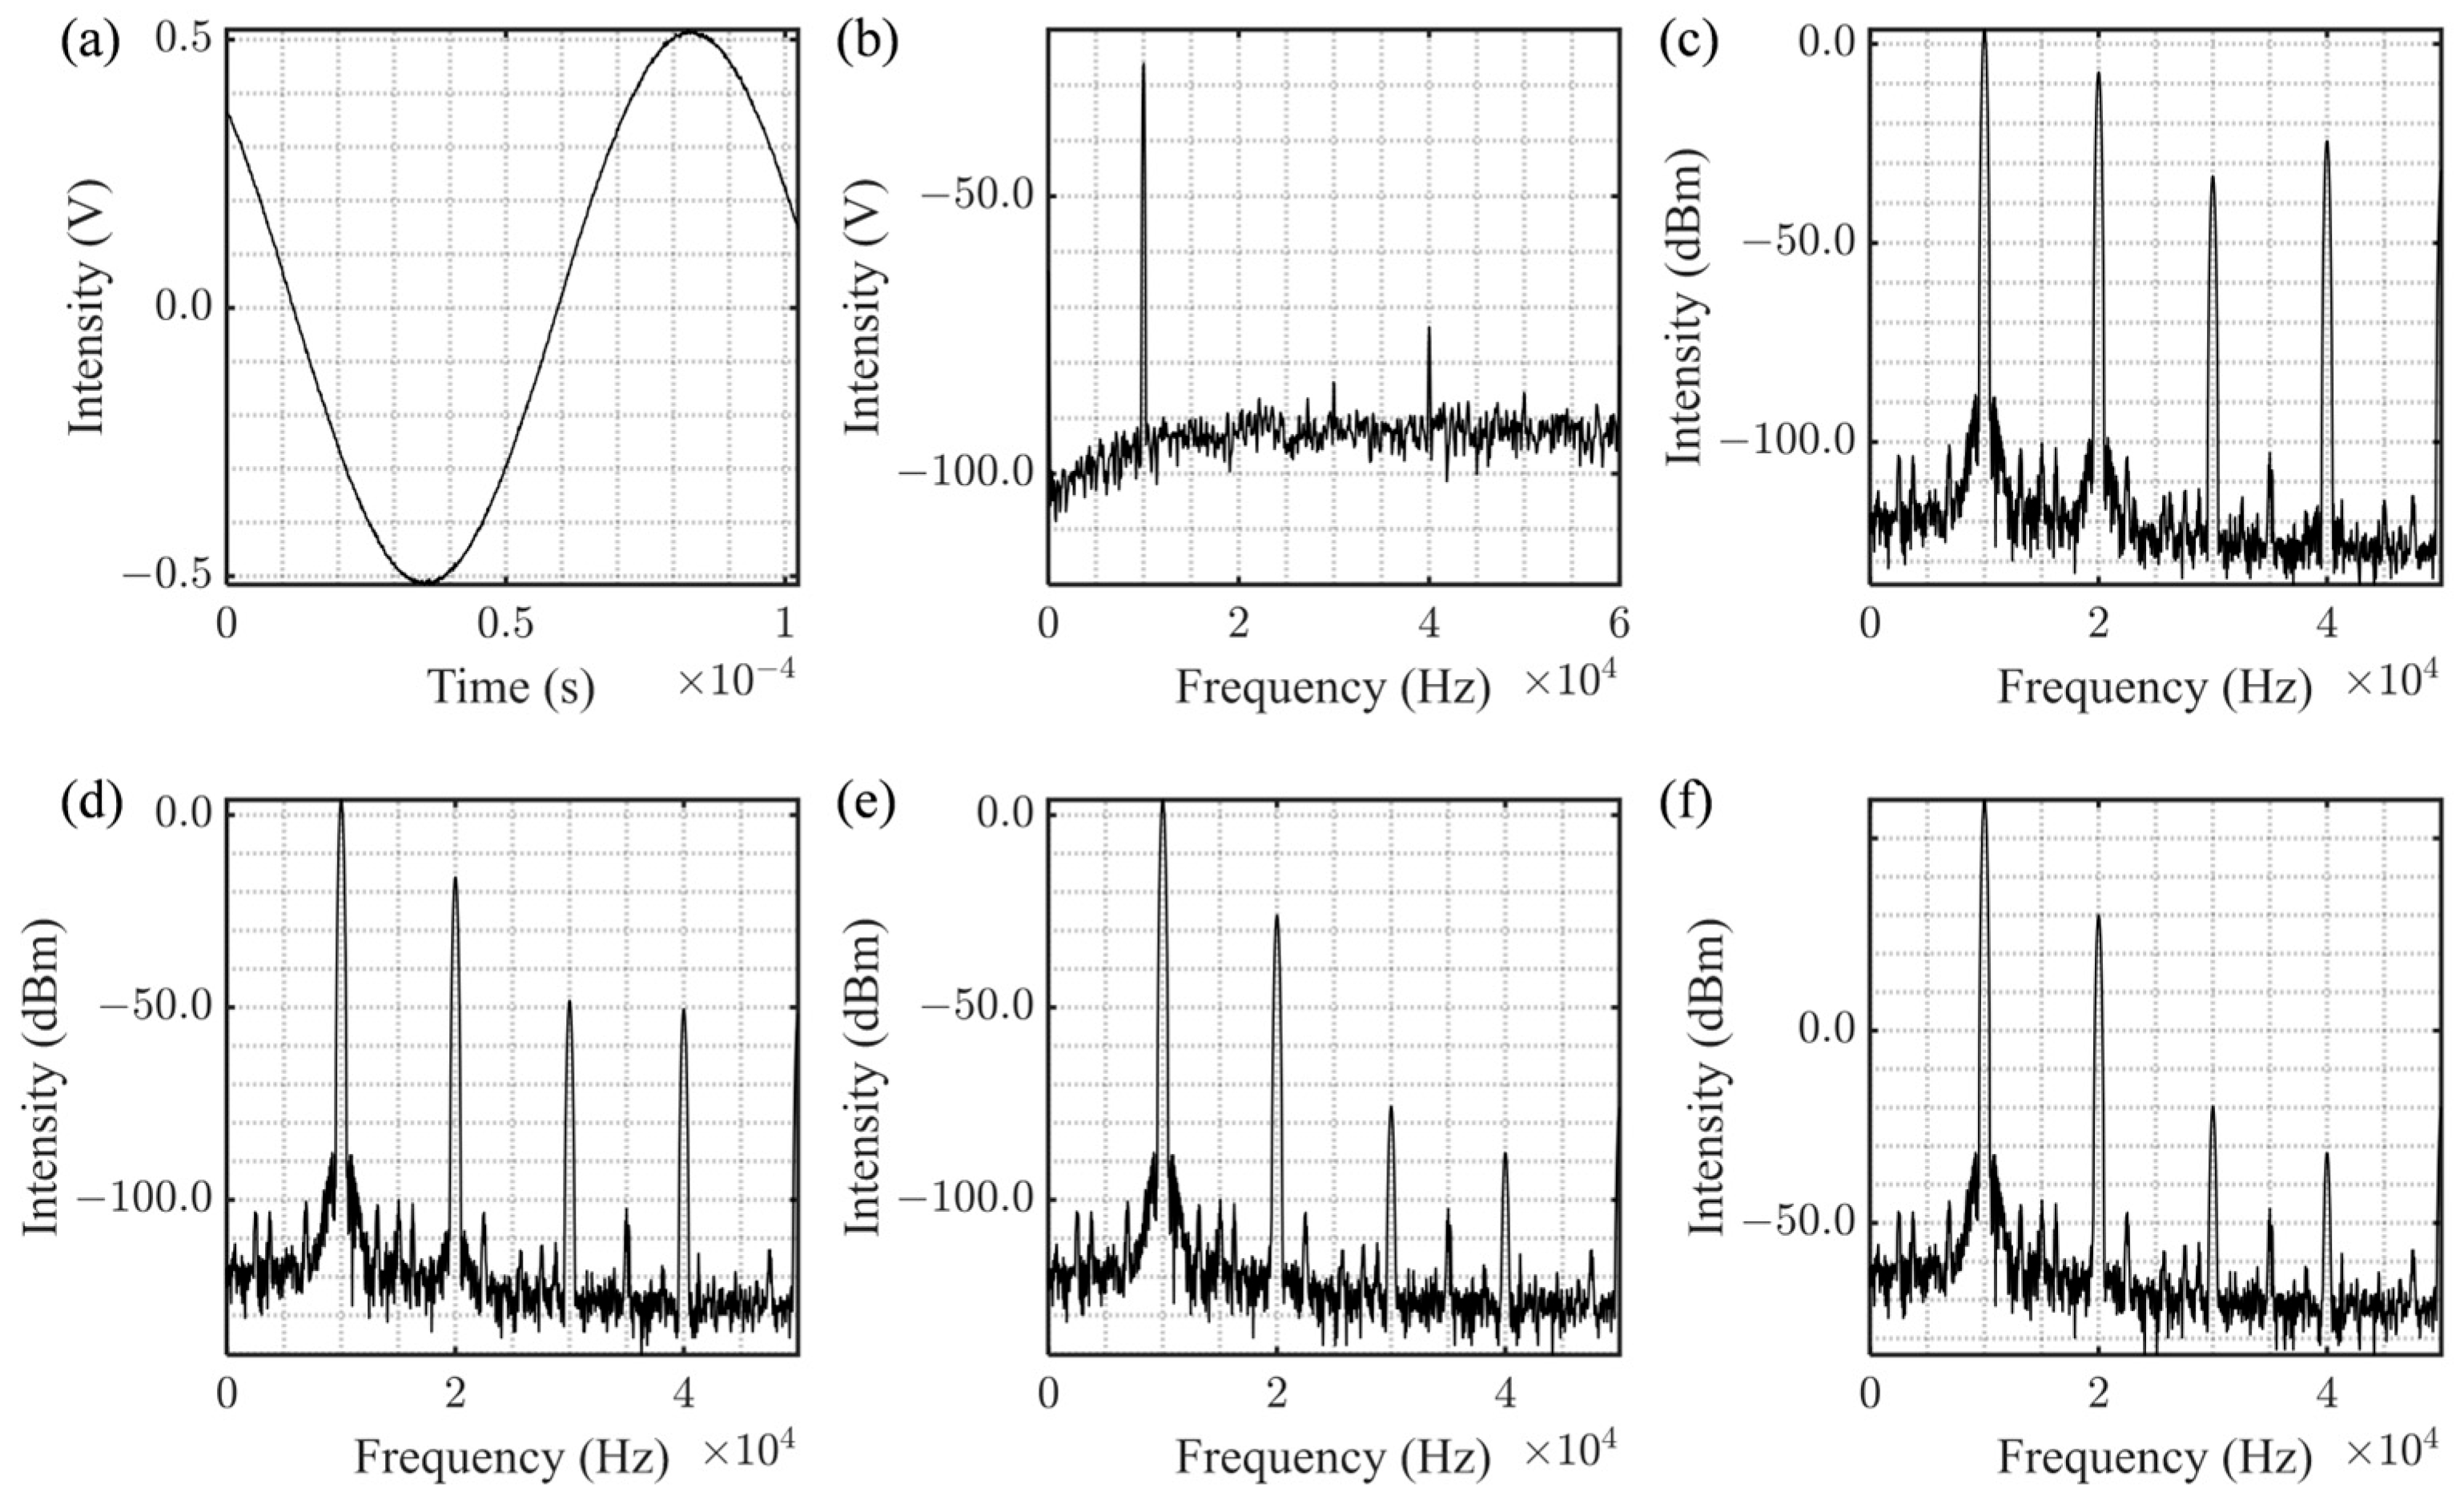
A sine wave signal produced by a signal generator is employed to modulate the constant current source, with specific data illustrated in Figure 6. Figure 6a,b depict the time-domain and frequency-domain representations of the modulated signal, respectively. In the frequency domain, prominent harmonics are evident. By fine-tuning the amplitude of the frequency-doubled signal component, a signal with a peak-to-peak voltage (Vpp) of 1 V and varying harmonic suppression ratios is created. The corresponding spectrum diagrams are shown in Figure 6c–e, with suppression ratios of 10 dB, 20 dB, and 30 dB, respectively. Figure 6f displays a Vpp of 2 V; however, the spectrum shows no significant difference from that in Figure 6e, suggesting that the harmonic suppression ratio is not evidently correlated with the signal amplitude.
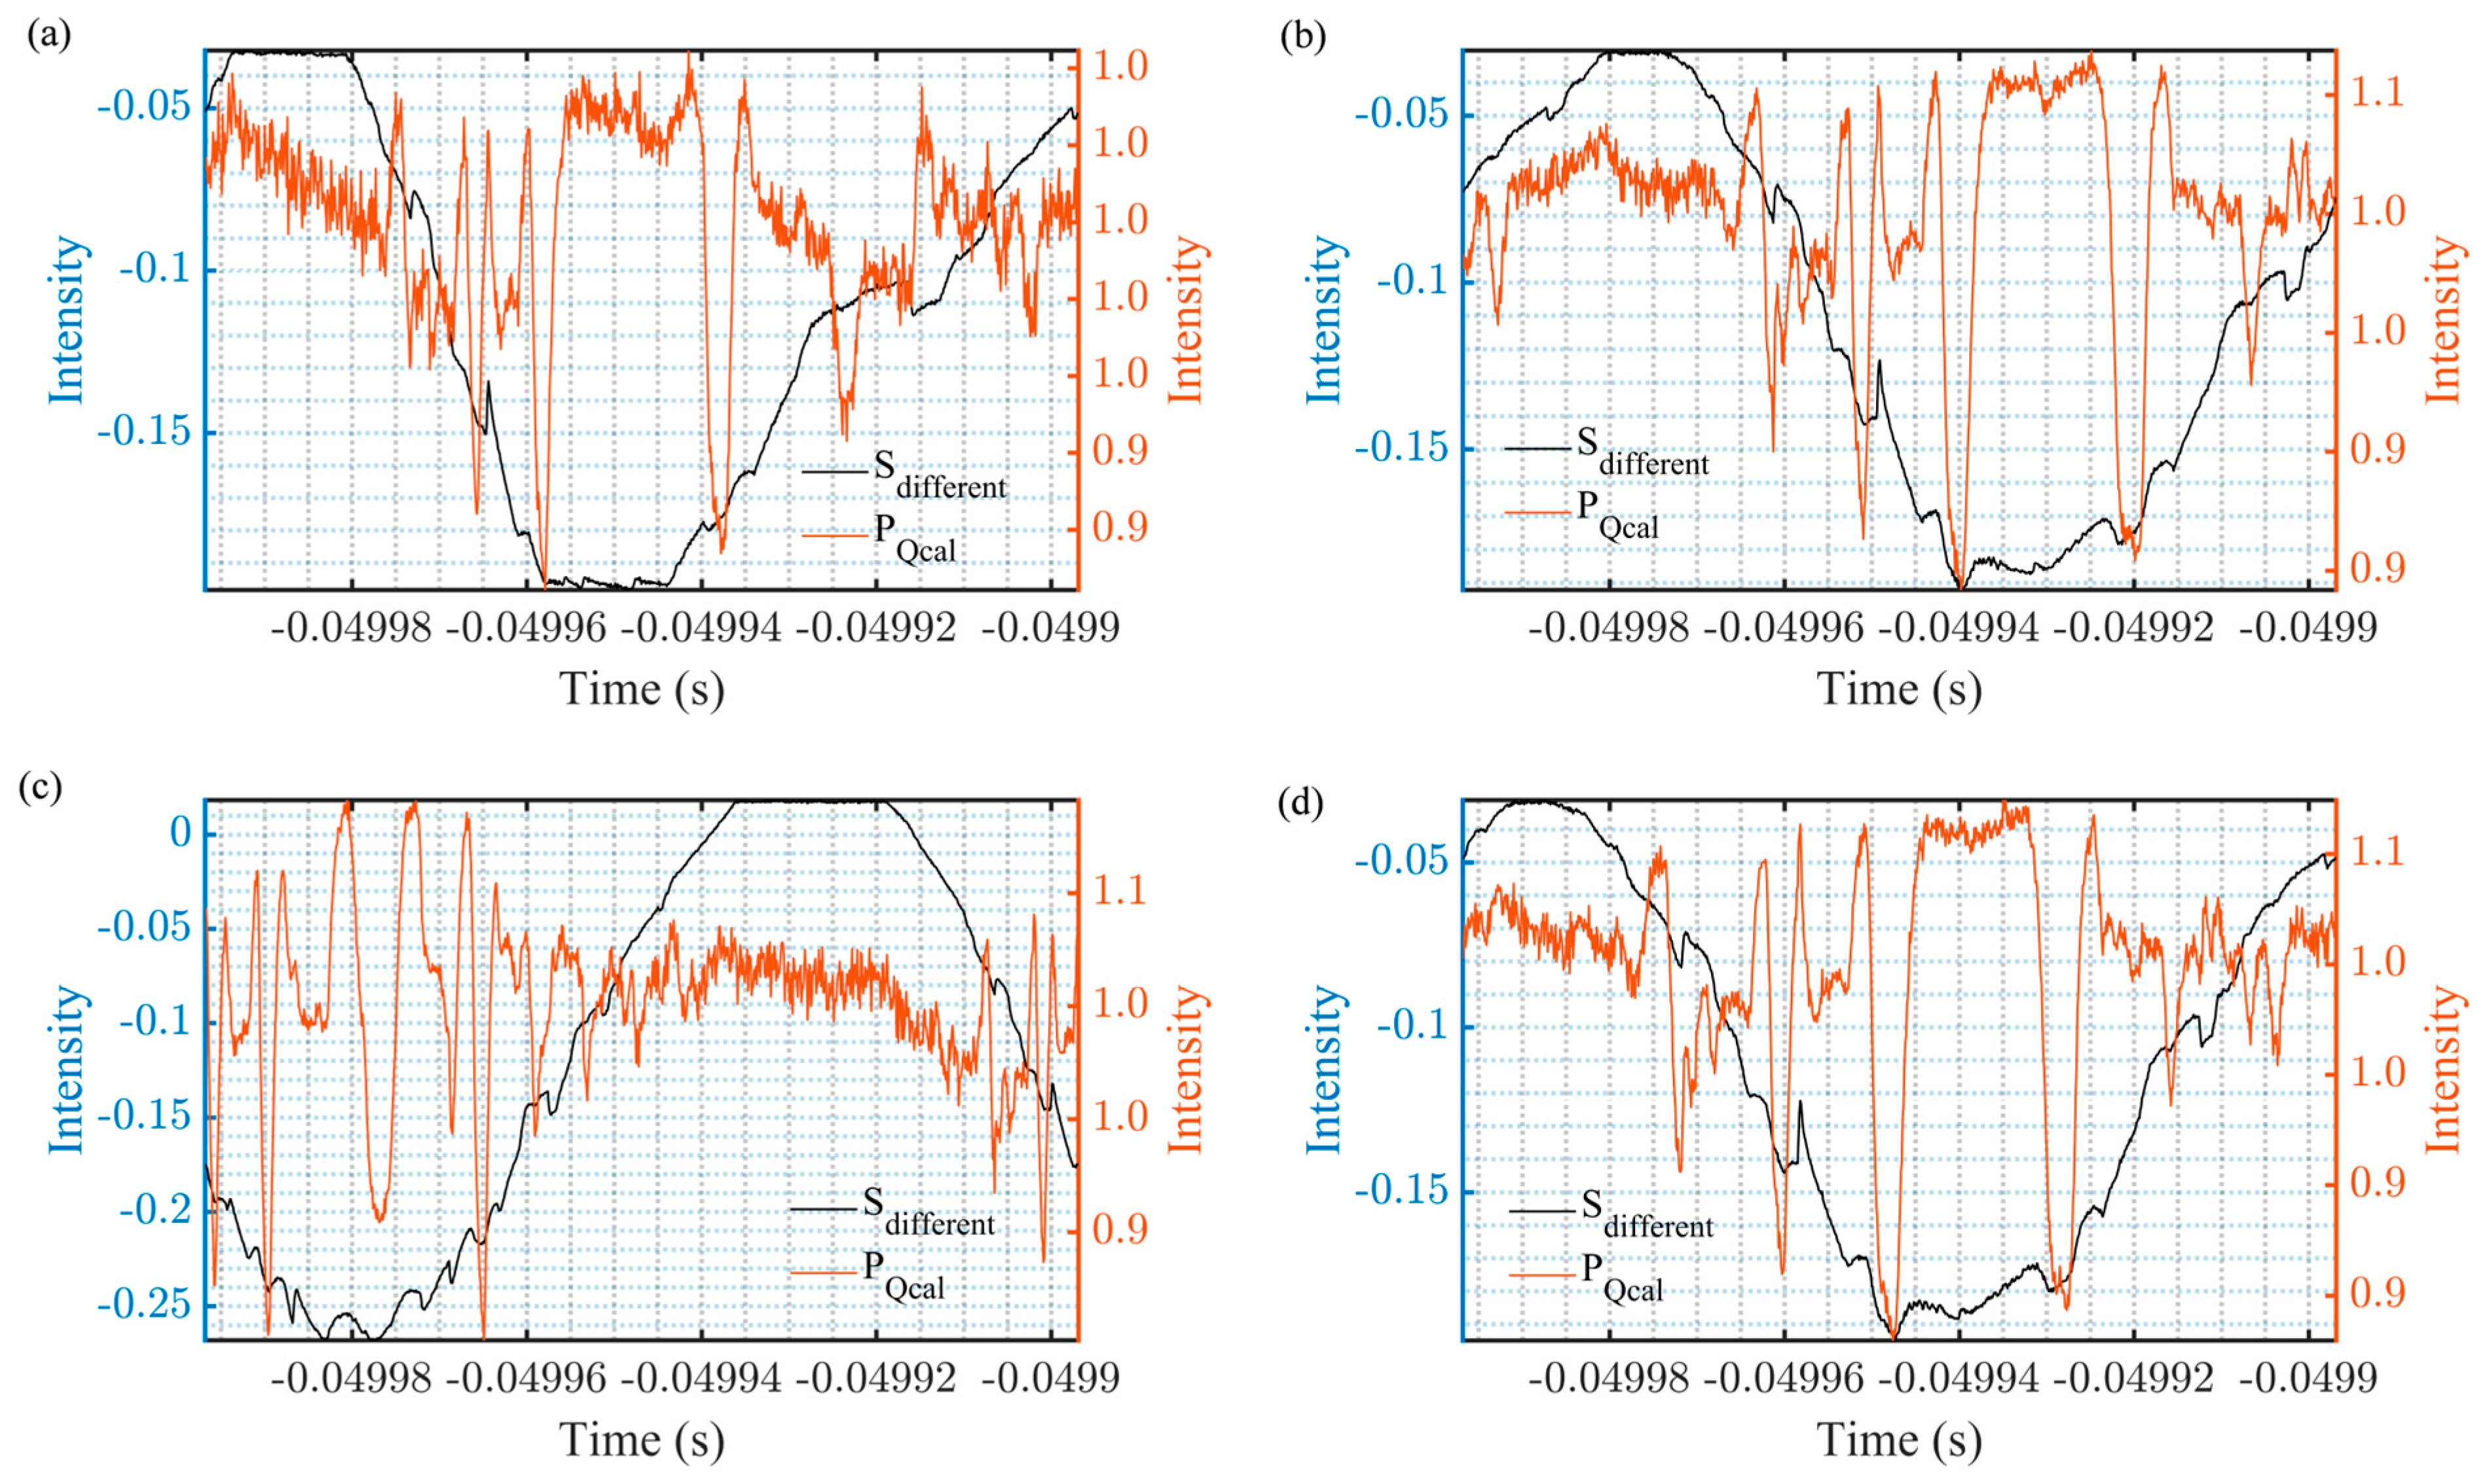
The effectiveness of spectral signal restoration under various harmonic suppression ratios was evaluated using the corrected power quotient method and compared with the traditional difference demodulation method. The results are presented in Figure 7, where the conditions labeled (a–d) correspond to (c–f) in Figure 6. It is evident that the traditional difference solution exhibits significant residual sinusoidal amplitude, with the absorption signal being barely discernible. In contrast, the improved algorithm we propose yields a stable signal, which closely approximates 1 in the absence of iodine molecule absorption. At absorption wavelengths, the signal features are sharply defined, and the SNR is markedly superior to that achieved by the conventional differential algorithm.
We also conducted a preliminary assessment of the feasibility of employing the composite differentiation algorithm. As depicted in Figure 8, the error signal curves at various frequencies reveal that, in comparison to the traditional cubic differentiation error signal, the signal introduced in this study exhibits a broader monotonic interval. This indicates a more extensive frequency locking range. Additionally, the slope at the stable point (zero point) is less sensitive, and the signal demonstrates robust linear performance even at positions with significant frequency deviations.

4. Discussions

This section delves into the limitations of balanced detection and NICE-OHMS in the contexts examined.
The coherent optical balanced detector, which includes two symmetrical photodiodes, a differential amplifier, and a beam splitter, functions based on coherent mixing and differential processing. The signal and local oscillator (reference) lights are divided into two paths by the beam splitter and directed into the photodiodes. Due to the π   phase difference from the beam splitter, the light paths create opposite-phase interference patterns on the detector surface, generating photocurrents of equal magnitude but opposite direction. The differential amplifier then subtracts these signals to produce a differential signal that contains only phase and frequency information. When considering the power noise of the light source itself, the final demodulated voltage signal obtained is
U 2 P 1 D C P 2 D C + P 1 D C P 2 A C + P 2 D C P 1 A C sin Ω m t + P 1 A C P 2 A C sin 2 Ω m t .
Clearly, the balanced detection signal now contains interference from the modulated signal, making it impossible to directly recover the power variations of the probe signal.
NICE-OHMS is a powerful technique for detecting molecular compounds in the gas phase. It combines frequency modulation spectroscopy (FMS) to reduce noise and cavity enhancement to prolong the interaction length between light and the sample [20]. The FMS signal is obtained by demodulating the detector signal at the modulation frequency at a given detection phase θ f m . Because the power of the semiconductor laser is not constant during FMS, the DC signal expanded into a Bessel series ( J m β ) must be corrected to
S T f m v d , θ f m = η f m P 0 D C + P 0 A C sin Ω m t + θ 0 J 0 β J 1 β × ϕ 1 v d 2 ϕ 0 v d + ϕ 1 v d cos θ f m + δ 1 v d δ 1 v d sin θ f m .
where the phase of the electric field is modulated at a radio frequency v m , with an amplitude β , δ j ν c and ϕ j   ν c are the amplitude attenuation and the optical phase shift of the electrical field, ν d =   v 0 v c   is the detuning of the laser frequency from the transition center frequency   v 0 , P 0 is the optical power incident on the detector and   η f m is an instrumentation factor, θ f m is detection phase. Evidently, the presence of the same-frequency component in the power leads to the generation of additional signals, such as the double frequency, upon demodulation, thereby yielding erroneous information.
Moreover, ensuring consistent intensities between the detection light and the reference light poses a significant challenge. Additionally, applying NICE-OHMS technology with an FP cavity in environmental detection scenarios is fraught with difficulties. Therefore, we conclude that while balanced detection can suppress common-mode noise introduced by environmental interference, it cannot eliminate the power noise introduced by the light source due to modulation. NICE-OHMS can enhance resistance to environmental noise by capitalizing on the characteristics of the FP cavity when the light source power remains constant, but it is not suitable for the specific scenario outlined in this paper. Furthermore, balanced detection necessitates the use of a low-pass filter to eliminate AC components, a process that typically results in the loss of target information. As illustrated in Figure 9, low-pass filtering leads to the attenuation of most high-frequency spectral components.

5. Conclusions

This study has developed a signal processing method and a feedback control method based on spectral signal sensing. Utilizing the corrected power quotient, the processing method exhibits insensitivity to power noise and achieves a substantial enhancement in the signal-to-noise ratio. The research offers significant guidance for spectral signal sensing analysis and monitoring in engineering applications. Additionally, while the feedback control method discussed in this text has theoretical advantages such as a wide locking range and good linearity, further work is required for verification.

Author Contributions

Validation, Y.W.; Data curation, Y.W.; Writing—original draft, Y.W.; Writing—review & editing, K.M., Z.W. and W.Z. All authors have read and agreed to the published version of the manuscript.

Funding

Project supported by Youth Innovation Promotion Association, CAS (Grant No. 2023132).

Data Availability Statement

The data related to this study can be requested from the corresponding author.

Conflicts of Interest

The authors declare no conflicts of interest.

Abbreviations

The following abbreviations are used in this manuscript:
BSBeam Splitter
CCCCurrent Control Circuit
DBRDistributed Bragg Reflector
DFBDistributed Feedback
FOCFiber Optical Coupler
FPGAField Programmable Gate Array
FMSFrequency Modulation Spectroscopy
HWPHalf-wave Plate
HSRHarmonic Suppression Ratio
MHNModulation harmonic noise
NICE-OHMSNoise-Immune Cavity-Enhanced Optical Heterodyne Molecular Spectroscopy
VppPeak-to-peak Voltage
PDPhotodetector
PZTPiezoelectric Transducer
PBSPolarization Beam Splitter
POLPolarizer
PMNPower Modulation Noise
PLCProgrammable Logic Controller
PCCPZT Control Circuit
RLIRatio of Linear-region Intensity Range
RLWRatio of Linear-Region Width
SASSaturated Absorption Spectroscopy
SNRSignal-to-Noise Ratio
TCCTemperature Control Circuit
TECThermoelectric Cooler

References

  1. Yao, Z.; Mauldin, T.; Xu, Z.; Hefferman, G.; Wei, T. Breaking limitations of fiber identification in traditional OFDR systems via compensation of initial optical frequency instability. Opt. Lett. 2020, 45, 6086–6089. [Google Scholar] [CrossRef] [PubMed]
  2. Ji, W.; Wang, B.; Hu, Y.; Cui, X.; Xu, P.; Jiang, X.; Dai, H.; Chen, Y. Characterization of the Pound-Drever-Hall Feedback Loop in an Ultra-Stable Laser System. In Proceedings of the CLEO 2024, Charlotte, NC, USA, 5–10 May 2024. [Google Scholar] [CrossRef]
  3. Matsunaga, S.; Kato, R.; Yoshiki, M.; Akamatsu, D.; Hong, F. Analysis of the interaction-length dependence of frequency stability in an iodine-stabilized Nd:YAG laser. Appl. Opt. 2024, 63, 2078–2085. [Google Scholar] [CrossRef] [PubMed]
  4. Jiao, T.; Kou, S.; Ma, L.; Cheong, K.; Ren, W. Extending Sensing Range by Physics Constraints in Multiband-Multiline Absorption Spectroscopy for Flame Measurement. Sensors 2025, 25, 2317. [Google Scholar] [CrossRef] [PubMed]
  5. Kuang, H.; Zhong, X.; Wei, J.; Xing, F.; Hai, Z. Research on Dynamic Temperature at Outlet of Centrally Staged Combustor Based on TDLAS Technology. Sensors 2025, 25, 2256. [Google Scholar] [CrossRef] [PubMed]
  6. Moura, R.P.R.; Cruz, B.M.; Lilge, T.S.; Andrade, A.B.; Valerio, M.E.G.; Macedo, Z.S.; Rodrigues, J.J.; Alencar, M.A.R.C. Comparative Analysis of Spectral Broadening Techniques for Optical Temperature Sensing in Yttrium Fluoride (YF3) Doped with Neodymium. Sensors 2025, 25, 2324. [Google Scholar] [CrossRef] [PubMed]
  7. Ma, Y.; Li, Y.; Feng, J.; Zhang, K. High-power stable continuous-wave single-longitudinal-mode Nd:YVO4 laser at 1342 nm. Opt. Express 2018, 26, 1538–1546. [Google Scholar] [CrossRef] [PubMed]
  8. Ohtsu, M.; Fukada, H.; Tako, T.; Tsuchida, H. Estimation of the Ultimate Frequency Stability of Semiconductor Lasers. Jpn. J. Appl. Phys. 1983, 22, 1157–1166. [Google Scholar] [CrossRef]
  9. Ito, M.; Kimura, T. Temperature stabilization in semiconductor laser diodes. IEEE J. Quantum Electron. 1981, 17, 796–798. [Google Scholar] [CrossRef]
  10. Hanes, G.R.; Dahlstrom, C.E. Iodine hyperfine structure observed in saturated absorption at 633-nm. Appl. Phys. Lett. 1969, 14, 362. [Google Scholar] [CrossRef]
  11. Träger, F. Springer Handbook of Lasers and Optics, 2nd ed.; Springer: Berlin/Heidelberg, Germany, 2012. [Google Scholar] [CrossRef]
  12. Hu, J.; Ahola, T.; Ikonen, E.; Riski, K. Frequency shifts of iodine stabilized He-Ne lasers at higher harmonic order stabilization. IEEE Trans. Instrum. Meas. 1997, 46, 186–190. [Google Scholar] [CrossRef]
  13. Hu, J.; Riski, K.; Chartier, A.; Chartier, J.M.; Picard, S. Comparison of 127I2 stabilized He-Ne lasers at 633 nm between the MIKES and the BIPM. Metrologia 1997, 34, 417. [Google Scholar] [CrossRef]
  14. Krause, F.; Sterr, U.; Benkler, E.; Noelleke, C.; Leisching, P. Iodine-Stabilized 633 nm Diode Lasers for Metrology and Interferometry. In Proceedings of the Conference on Lasers and Electro-Optics Europe/European Quantum Electronics Conference (CLEO/Europe-EQEC), Munich, Germany, 23–27 June 2019. [Google Scholar] [CrossRef]
  15. Xie, H.; Xiao, D.; Mao, Z. Rapid Detection of Iron Ore Grades Based on Fractional-Order Derivative Spectroscopy and Machine Learning. IEEE Trans. Instrum. Meas. 2023, 72, 1–10. [Google Scholar] [CrossRef]
  16. He, W.; You, H.; Lu, Z.; Liu, Y.; Chen, Y.; Liu, Y.; Sun, C. A Novel Overlapping ME Peaks Decomposition Algorithm Based on Iterative Derivative Sharpening. IEEE Trans. Instrum. Meas. 2024, 73, 1–13. [Google Scholar] [CrossRef]
  17. Ozawa, K.; Itakura, T.; Ono, T. Locally Self-Adjustive Smoothing for Measurement Noise Reduction with Application to Automated Peak Detection. Appl. Spectrosc. 2024, 78, 825–836. [Google Scholar] [CrossRef] [PubMed]
  18. Wallard, A.J. Frequency stabilization of the helium-neon laser by saturated absorption in iodine vapour. J. Phys. E-Sci. Instrum. 1972, 5, 926. [Google Scholar] [CrossRef]
  19. Gono, T.; Vavra, L.; Krejci, P.; Jasinski, M.; Stacho, B. Harmonic Filter Design Methodology. In Proceedings of the 2024 24th International Scientific Conference on Electric Power Engineering (EPE), Kouty nad Desnou, Czech Republic, 15–17 May 2024. [Google Scholar] [CrossRef]
  20. Axner, O.; Ehlers, P.; Foltynowicz, A.; Silander, I.; Wang, J. NICE-OHMS—Frequency Modulation Cavity-Enhanced Spectroscopy—Principles and Performance; Springer: Berlin/Heidelberg, Germany, 2014; pp. 211–251. [Google Scholar] [CrossRef]
Figure 1. Experimental setup of a semiconductor laser at 633 nm. PCC: PZT Control Circuit; TCC: Temperature Control Circuit; CCC: Current Control Circuit.
Sensors 25 06932 g001
Figure 2. (a) Change in the zero-position offset error ϵ λ as a function of the line width γ in linear coordinate (dotted line), and the absolute value of ϵ λ in logarithmic coordinate (solid line). Curves (i), (ii), (iii), (iv) represent different real solutions of Equation (15). In logarithmic coordinates, the curves (i) and (iii) coincide. (b) Curves (v) is the difference between feedback signal containing PMN and ideal feedback signal @ γ = 10 MHz. Curves (vi) is a local zoom-in of the absolute value of the difference.
Sensors 25 06932 g002
Figure 3. Influence of harmonics of different order on frequency stabilization signal with γ = 10 MHz. (a) The first line illustrates the relationship between the intensity error and the frequency deviation. It also includes a local magnification diagram and the absolute value curve of the intensity error on a logarithmic scale. (b) The second line depicts the relationship between the phase error and the frequency deviation. It also includes a local magnification diagram and the absolute value curve of the phase error on a logarithmic scale.
Sensors 25 06932 g003
Figure 4. Effect of harmonic suppression ratio and frequency deviation on signal intensity error (a) and phase error (b).
Sensors 25 06932 g004
Figure 5. Wavelength–Voltage–Current surface (a); Power–Voltage–Current surface (b).
Sensors 25 06932 g005
Figure 6. Time-domain and spectrum diagram of current modulation signal. (a) Signal time-domain graph; (b) Signal spectrum diagram; Signal spectrum diagram with HSR = 10 dB (c), 20 dB (d), 30 dB (e) and 30 dB with 2 Vpp (f).
Sensors 25 06932 g006
Figure 7. Restore the fine spectrum by using the corrected power ratio with HSR = 10 dB (a), 20 dB (b), 30 dB (c) and 30 dB with 2 Vpp (d).
Sensors 25 06932 g007
Figure 8. Comparison chart of composite differential signal and traditional signal.
Sensors 25 06932 g008
Figure 9. Time-domain graph of the spectral signal (left) and its spectrum (right).
Sensors 25 06932 g009
Table 1. Table Experimental parameters settings.
EquipmentParameterBrand
Laser-LDPD-INC
Constant current source89.4 mAThorlabs LDC202C
Temperature control device10 kΩThorlabs TED200C
Detector20 dB/30 dB *Thorlabs PDA36A2
Power meter-Thorlabs PM400 & S120C
Signal generator-Moku: pro
spectrum analyzer-Moku: pro
Wavelength meter-Bristol
* Reference light (20 uW) has a 20 dB gain, and reference light (2.7 uW) has a 30 dB gain.
Disclaimer/Publisher’s Note: The statements, opinions and data contained in all publications are solely those of the individual author(s) and contributor(s) and not of MDPI and/or the editor(s). MDPI and/or the editor(s) disclaim responsibility for any injury to people or property resulting from any ideas, methods, instructions or products referred to in the content.