This section presents the experiment methods, the results, and a discussion of the proposed model.
4.1. Experimental Setup
In this research, we followed the division of training, validation, and testing sets as in the original paper [
3], using their public dataset MARS [
3], which is designed to assist in rehabilitating patients with motor disorders using the mmWave radar system. This dataset consists of 10 types of rehabilitation movements performed by four human subjects, with a total of 40,083 frames. This dataset includes the reconstruction of 19 human body joints in 3D space using a point cloud generated by the mmWave radar. The activities performed include left arm extension, right arm extension, both arm extension, left front lunge, right front lunge, squat, left side lunge, right side lunge, left leg extension, and right leg extension. Each subject performed each movement for 2 min, resulting in approximately 10,000 data frames per subject.
This data was then used for model training, validation, and testing. Data collection was conducted indoors to ensure lighting and radar signal reflection consistency. Specific conditions considered during the experiment included no strict limitations as mmWave radars are independent of lighting conditions. The subject stood at 2 m from the radar. The radar was mounted on a 1-meter-high table with a Microsoft Kinect V2 sensor (Microsoft Corp., Redmond, WA, USA). Reference data was obtained from the Kinect V2, which recorded the subject’s movements at a rate of 30 Hz.
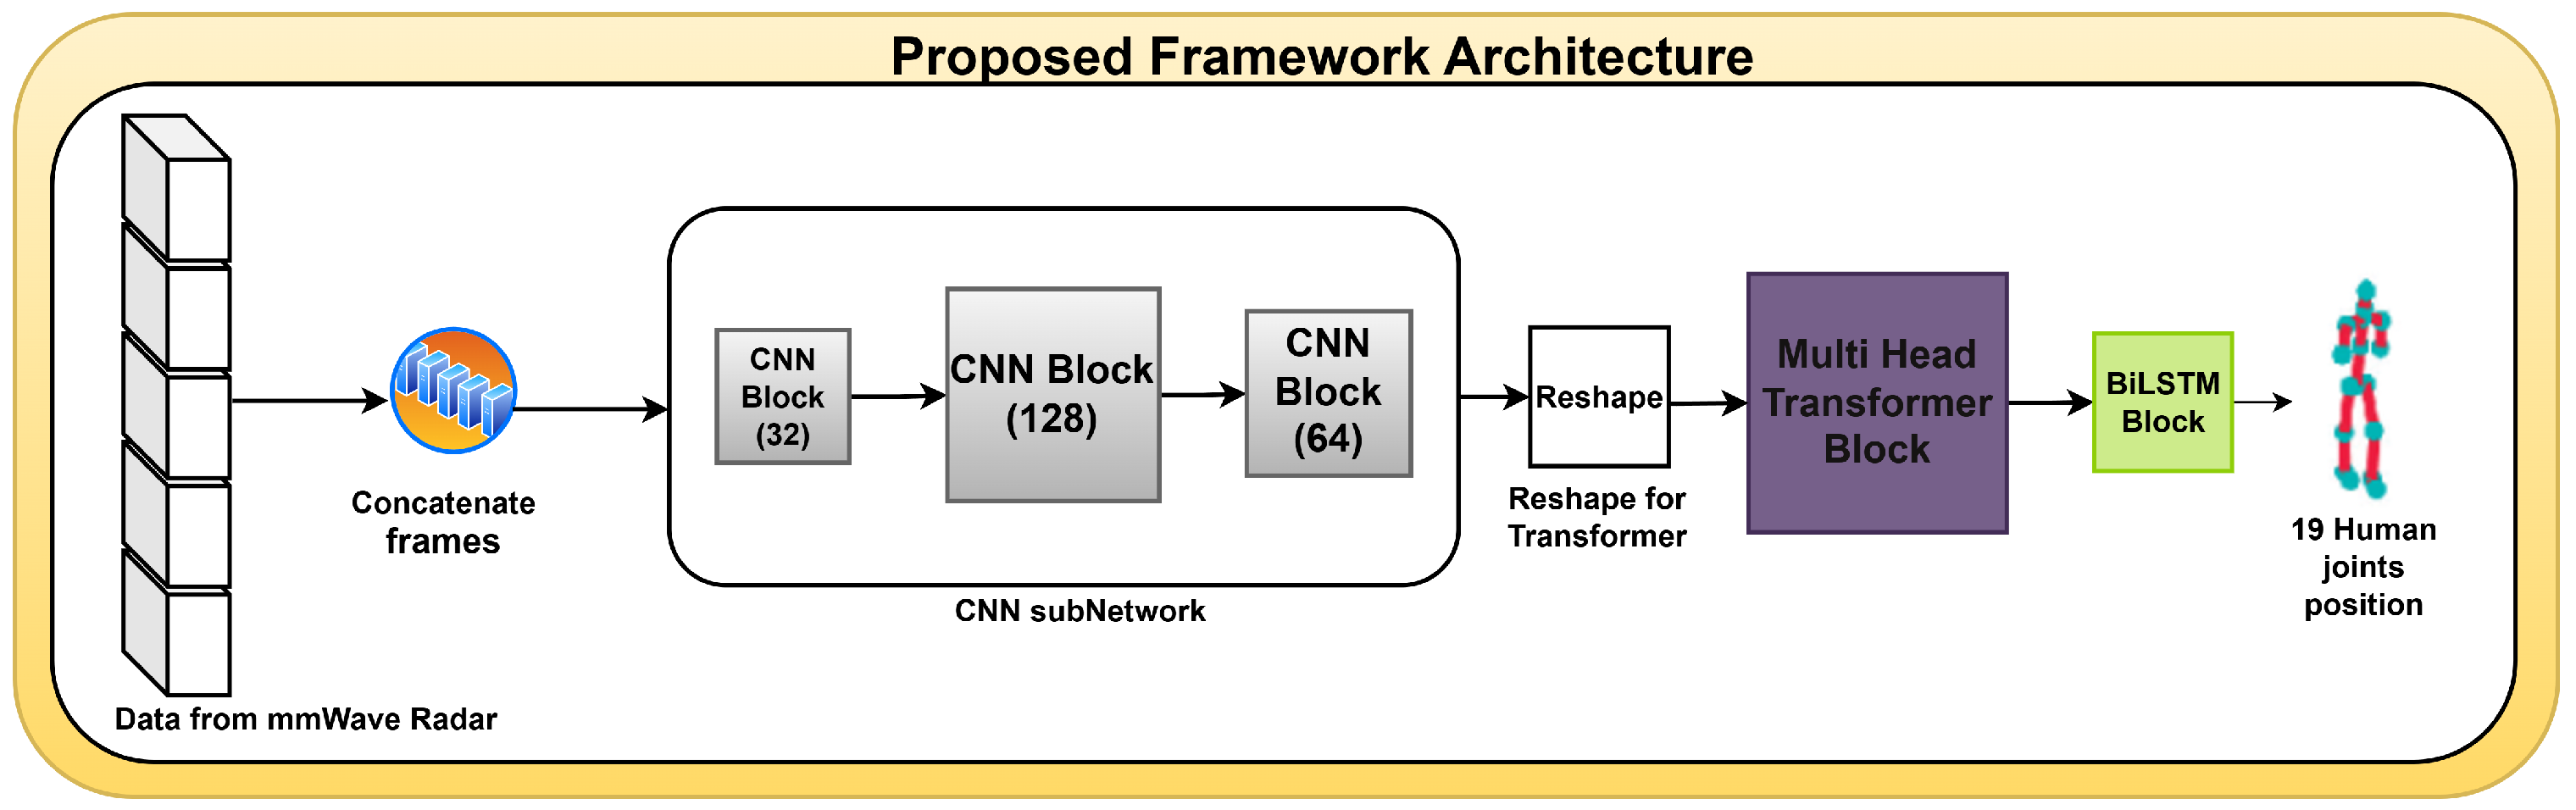
Variability in mmWave radar data affects detection accuracy due to several factors. Noise in radar data arises from signal interference, environmental materials, and impacting the generated point cloud. Occlusion occurs when body parts are obscured due to natural movements, such as arms covering the chest during squats or variations in hand positions affecting radar reflections. Additionally, sparsity in point cloud data makes mmWave radar less dense than camera-based or LiDAR methods, necessitating the concatenation of adjacent frames to enhance spatial–temporal information before processing with CNN, transformer, and Bi-LSTM. Furthermore, inter-individual movement variability, influenced by differences in height, posture, and execution of rehabilitation movements, affects data distribution. To improve generalization, the model is trained on data from multiple subjects.
The experiments were conducted using the TI IWR1443 76-81GHz model radar (Texas Instruments, Dallas, TX, USA) is available at (
https://www.ti.com/product/IWR1443 (accessed on 8 June 2024)), which produces high-quality point clouds. The radar technical details are provided in
Table 2. As shown in this table, the radar configuration includes a frequency range of 76–81 GHz, 3 transmitting antennas, and 4 receiving antennas (resulting in 12 virtual channels), a chirp bandwidth of 3.2 GHz, and a chirp duration of 32 μs. This setup enables a range resolution of 4.69 cm, a velocity resolution of 0.35 m/s, and an angular resolution of approximately 9.55°, which collectively contribute to the generation of high-quality point clouds used for human joint estimation. For the human skeleton estimation task, we initially employed an optimal number of 19 frames [
1]. The radar technical details in
Table 2 include the hardware and software configuration used in this experiment.
All experiments in this research were conducted using carefully selected parameters, as detailed in
Table 3. These parameters can be used for reproducibility of our results.
As explained in
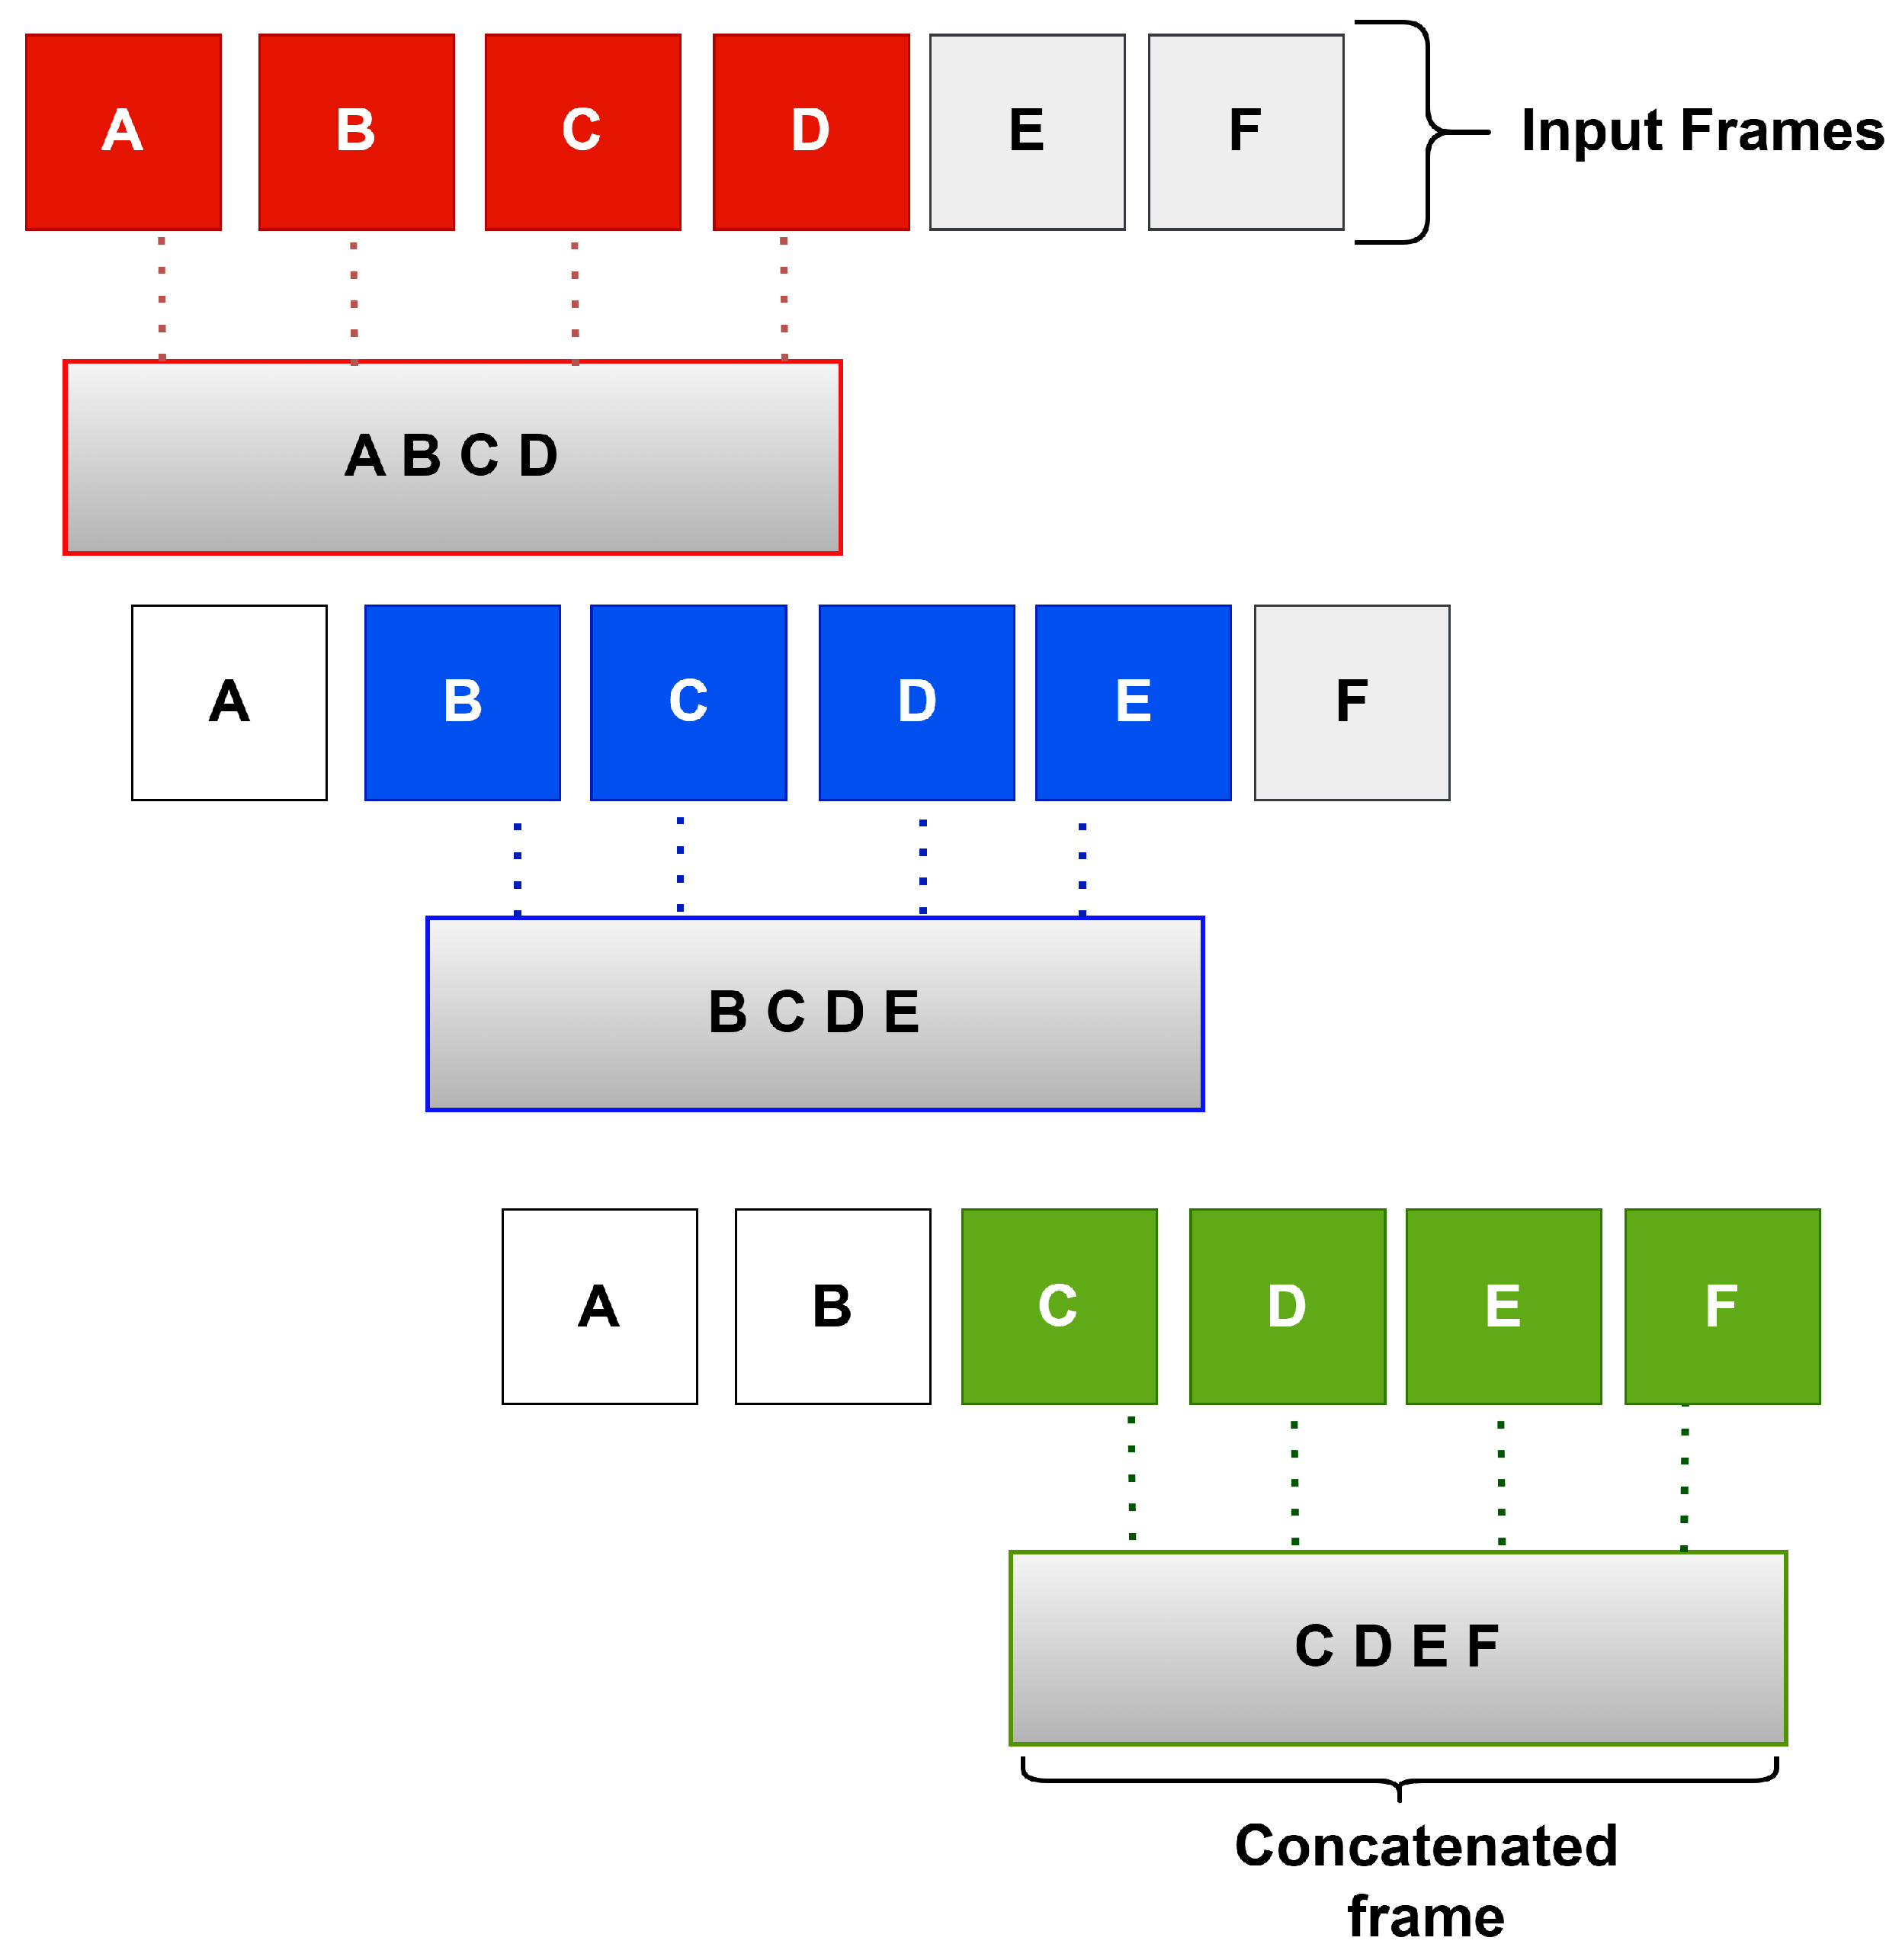
Section 3.1, this research implements an approach that combines several adjacent frames into a single more informative one. This method enhances the quality of the data before it is processed in the main blocks of the detection neural network.
After going through several experiment stages, the results were evaluated using the metrics mean absolute error (MAE) and root mean squared error (RMSE) measured for the x, y, and z coordinates of 19 joints. Moreover, the average MAE and RMSE values of the x, y, and z axes are calculated to provide overall performance information. Furthermore, the computational complexity associated with the model can be derived from the number of parameters trained during model training.
4.2. Results
As detailed in
Section 4.1, the experiment began with 19 frames, as suggested in [
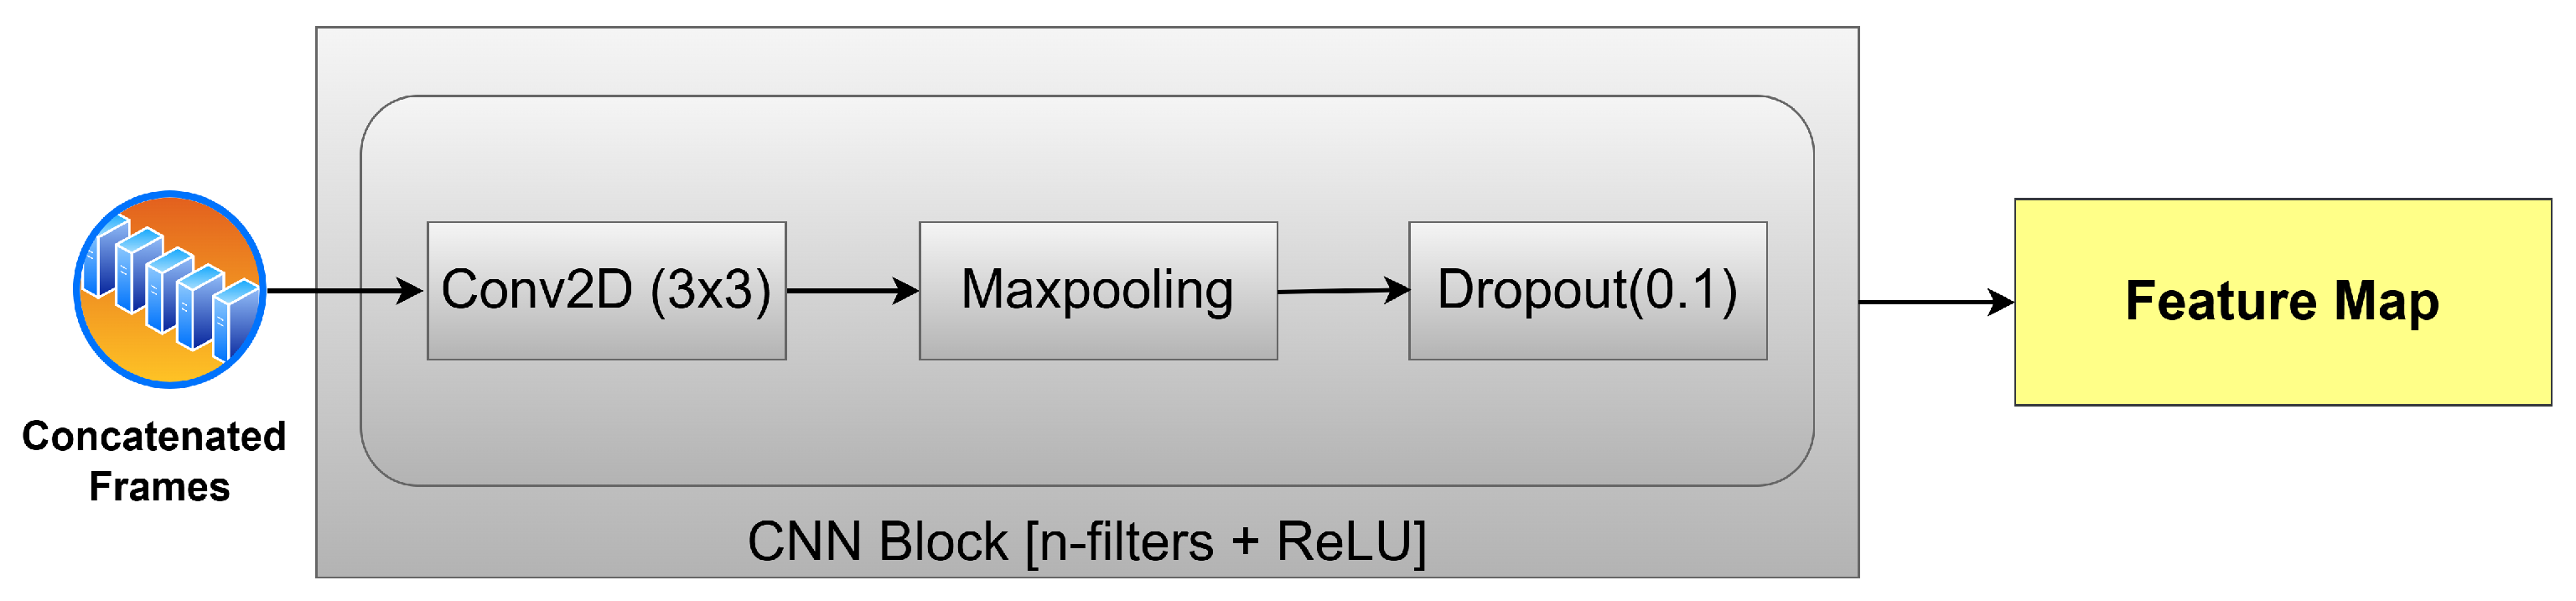
1]. The initial shape of the point cloud before entering the frame merging stage is [128, 19, 14, 14, 5], with 19 representing the initial frames, 14 × 14 the point cloud data, and 5 the channel. The dataset then undergoes the adjacent frame concatenation process, a key step before being trained in the three main blocks: CNN, transformer, and Bi-LSTM.
Table 4 displays the experimental results of four different configurations. These configurations represent the same network for different numbers of concatenated frames, referred to as
,
,
,
, and
.
As explained, we start with 19 frames for each instance, which undergo the concatenation process in which multiple consecutive frames are combined into a single one. To determine the best choice, five different experiments were carried out as shown in
Table 4. Here,
, represents a configuration without any frames concatenated.
represents combining two adjacent frames into one new frame with the shape [128, 18, 28, 14, 5], where 18 is the number of frames, 28 × 14 is feature map, and 5 is the depth.
represents combining three adjacent frames, which results in an output with the form [128, 17, 42, 14, 5]. Similarly,
represents the combination of four adjacent frames into one, and
represents the combination of five adjacent frames into one. Their respective outputs are [128, 16, 56, 14, 5] and [128, 15, 70, 14, 5].
The results of observations on the different configurations, as shown in
Table 5, show that
and
have the worst performance because they are less capable of capturing complex features when compared to models with more parameters.
and
are slightly better even though there is still the potential for overfitting. This overfitting arises from the increase in the number of parameters and the limitations of the data. The increase in parameters occurs because, as more frames are combined, the model has to learn more parameters. This makes it easier for the model to memorize the training data rather than learning generalized patterns. Furthermore, a data limitation arises because the dataset size is not large enough to balance the increase in parameters, causing the model to adapt to specific patterns in the training data. As a result, the model performs well on the training data but fails on new data.
has the best results among all the models because it provides a balance in capturing spatial and temporal patterns, making the model the best choice for estimating human joint position in scenarios that require high precision. As a result,
is treated as the optimal configuration in this research.
In addition to empirical validation, the choice of is theoretically supported by the temporal resolution of the radar system. The MARS radar operates at 30 Hz, meaning each frame captures approximately 33 milliseconds of motion. By concatenating four consecutive frames, the network observes around 133 ms of temporal context, sufficient to capture micro-motion such as limb lifts or subtle joint displacements. Furthermore, since the dataset uses overlapping windows to generate training samples, increasing n beyond 4 introduces substantial redundancy. For example, with , each sample shares four out of five frames with the previous one (80% overlap), reducing sample diversity and leading to higher inter-sample correlation. This makes it more difficult for the model to generalize and learn robust spatiotemporal features. Therefore, is not only optimal empirically but also theoretically justified based on radar sampling characteristics and the dataset construction strategy.
Table 6 shows the MAE and RMSE values from the experimental results of
to detect the positions of 19 human joints. The MAE and RMSE values of all 19 joint points are in the range of 1~4 cm, with the exception being the left and right wrists. The average MAE values are 1.94, 1.62, and 1.76 cm for the
x,
y, and
z axes, respectively. Similarly, the average RMSE values for the
x,
y, and
z axes are 3.28, 2.39, and 3.07 cm, respectively. This outperforms, by a large margin, the the method proposed in [
3] and noticeably outperforms the method proposed in [
1]. The average joint values are smaller than 4 cm. Moreover, our experimental results can reduce the MAE and RMSE values in the right and left wrist joints, where previous research in [
3] was unable to detect them accurately.
As previously indicated, the architecture of our model (for
as well as other configurations) is given in
Table 1. Our neural network was designed to capture patterns both locally and globally. Local pattern identification refers to the process of identifying spatial and short-term temporal relationships in the data. This process is conducted via the CNN and transformer blocks. The global pattern identification refers to the process of identifying long-term temporal relationships in the data (between non-adjacent frames) via the LSTM sub-network.
Figure 7 shows the MAE per epoch for the method proposed in [
3]. The results show that the training MAE starts at high values, as expected, and decreases gradually with every epoch. However, this behavior is not observed for the validation set, where the MAE does not seem to drop significantly until later epochs (i.e., after 80 epochs). Nonetheless, it fluctuates remarkably even for later epochs. Similar behavior is observed for the RMSE shown in
Figure 8, where the training RMSE decreases consistently, whereas the validation one fluctuates until around epoch 70. This behavior may be attributed to the high number of trainable parameters and the architecture of the model proposed in [
3], which likely contributes to overfitting, whereby the model learns specific patterns in the training set that do not generalize to unseen data, such as the validation data.
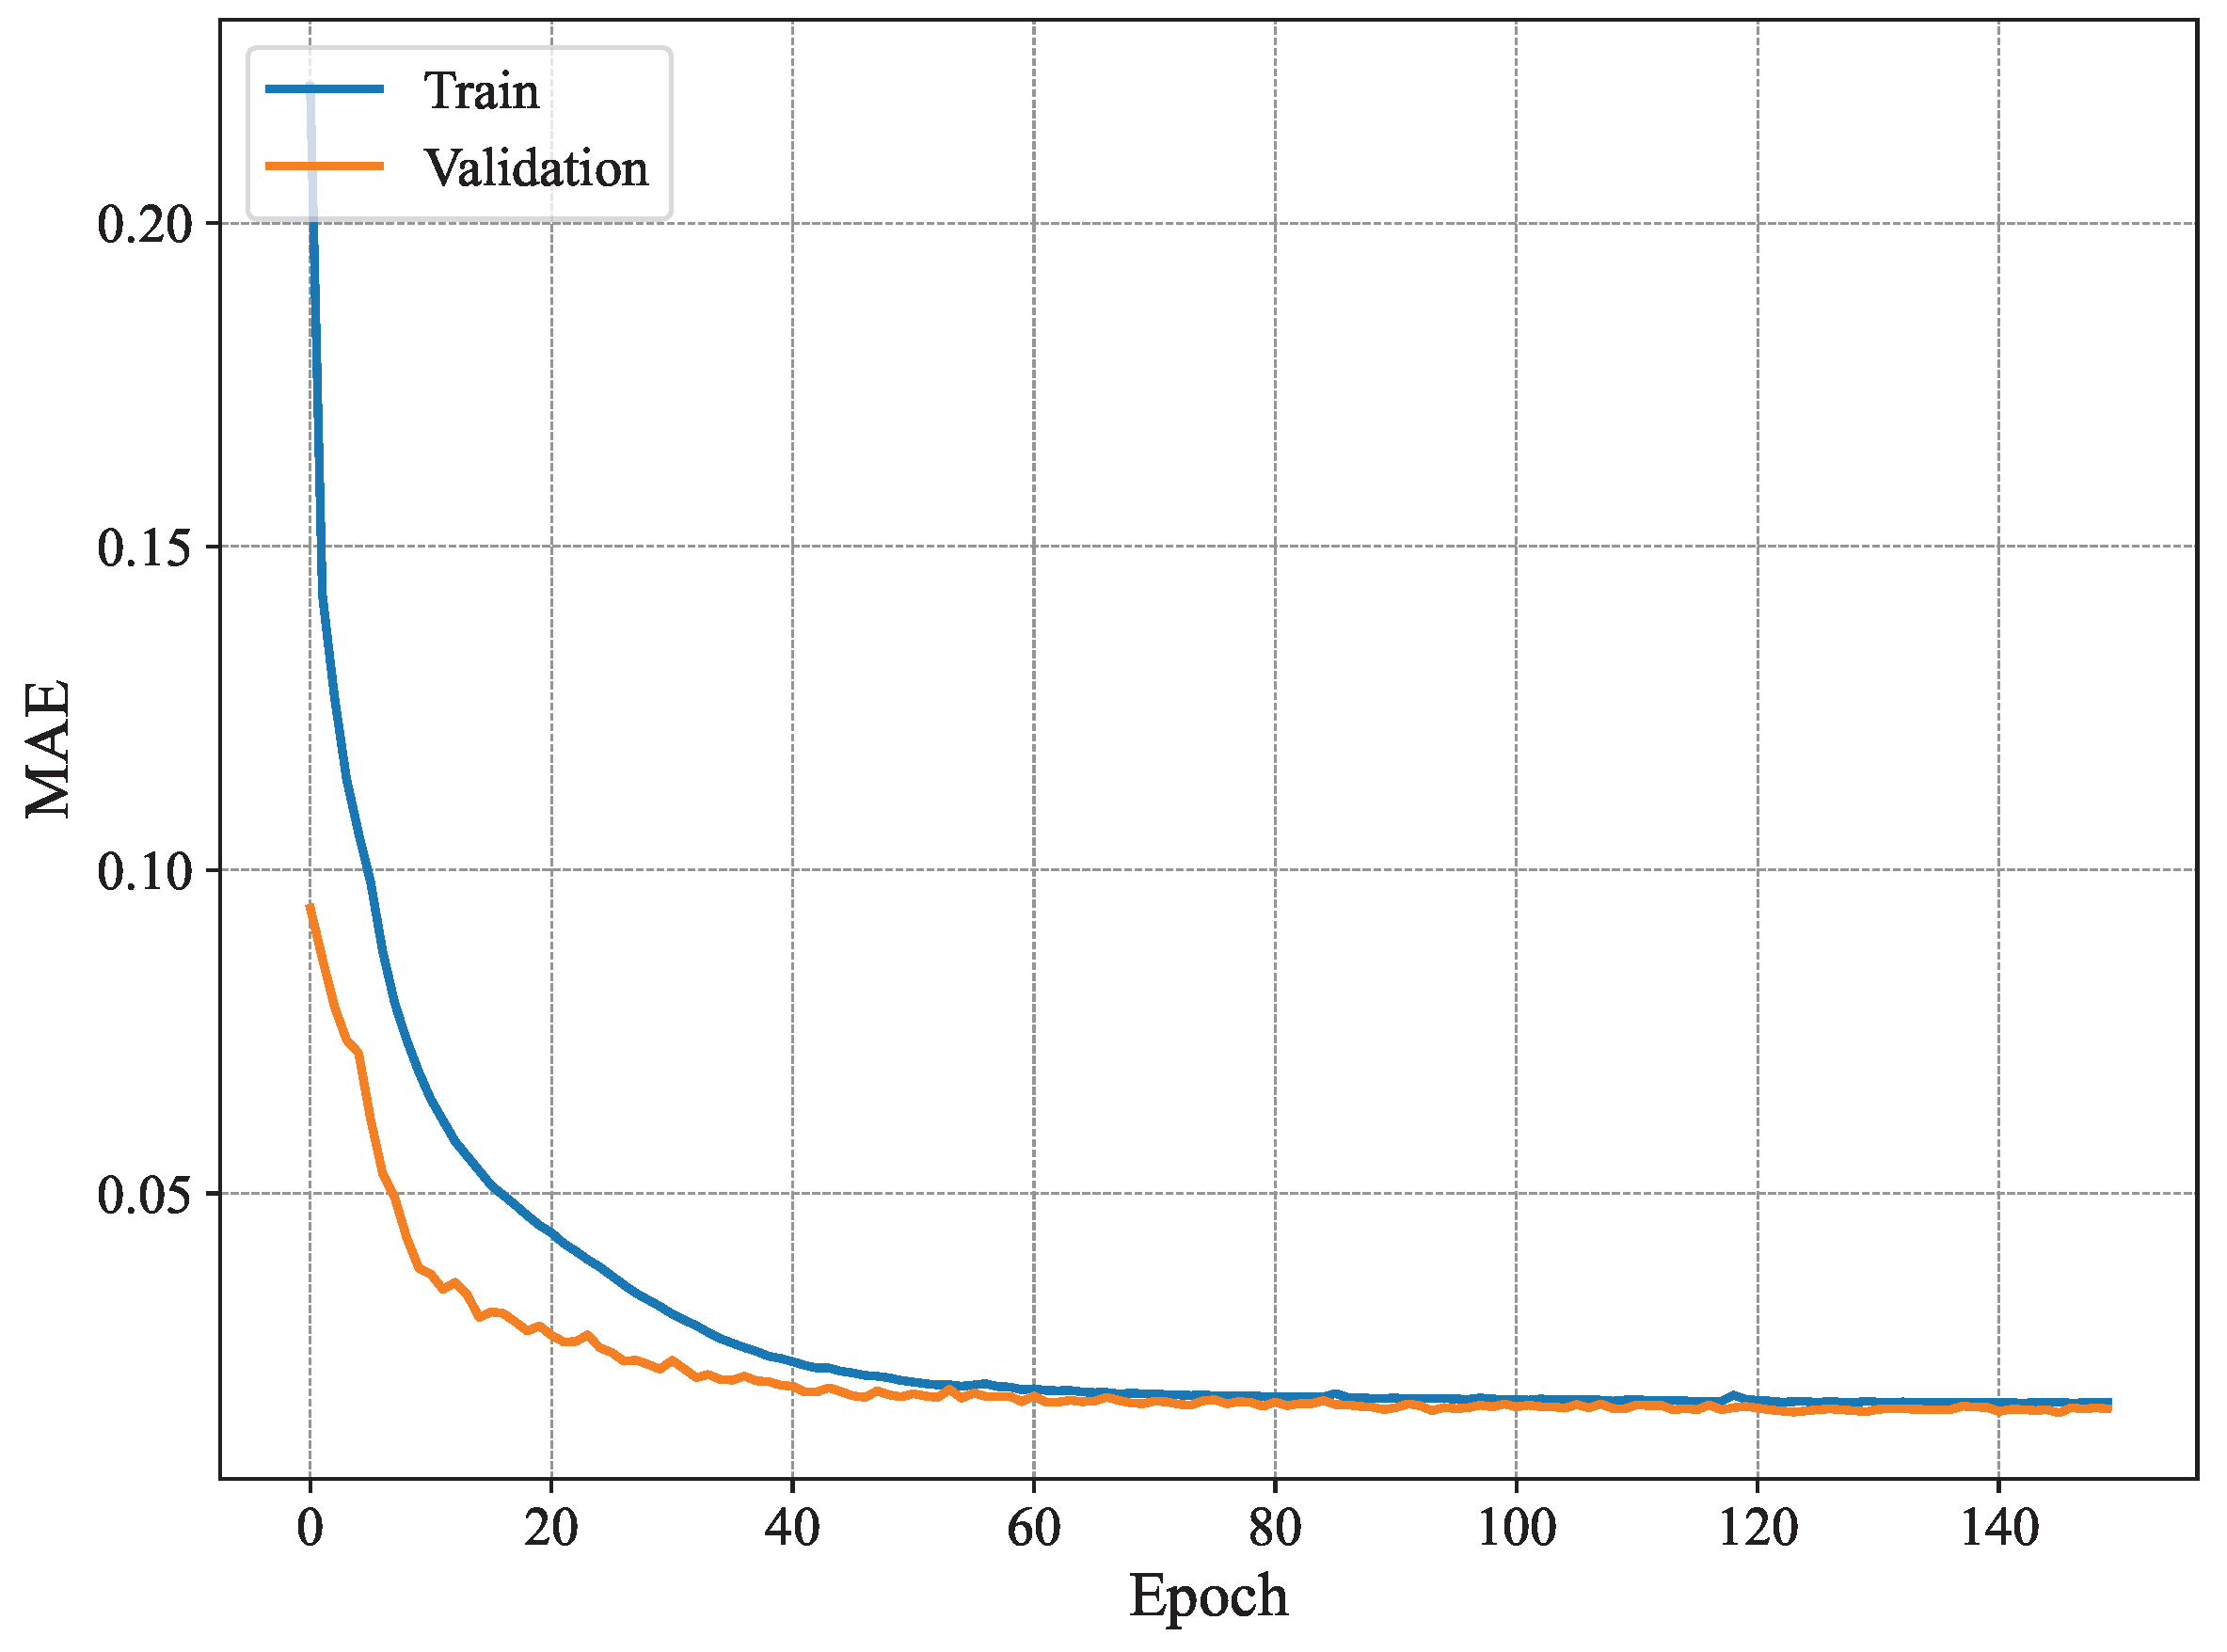
Figure 9 shows the MAE per epoch for our proposed method using
. As can be seen, our model is more stable than the conventional method [
3] and exhibits typical good learning behavior where both the training and validation estimation MAE decrease consistently to converge towards similar values. Starting from epoch 60 or so, the model seems to have converged, and the MAE remains within the same value range until the end of the training. Compared to the results presented in
Figure 7, the training behavior of our system model is much better as it does not exhibit any signs of overfitting, namely the fluctuations in validation estimation MAE and the difference in performance between the training and validation curves. Furthermore,
Figure 10 shows the RMSE of our proposed model with
. The results show similar patterns to those of the MAE, where the model converges slowly until it reaches good performance around epoch 60. The increase in stability is a key difference between the model proposed in [
3] and our model for
of our proposed model. There has been a reduction in overfitting, and model generalization has increased. Our model offers a good option for handling temporal data and reducing fluctuations often occurring in validation data. Our model is more effective for time-dependent data, such as radar data, for human joint detection.
Next, the experimental results of
are compared with the conventional methods [
1,
3,
15,
17].
Table 7 and
Table 8 show the estimation accuracy of human joint locations using these five models (i.e., ours and the conventional ones). The model in our experiment shows significant improvement in estimation accuracy when compared with [
3]. Our proposed model reduces the MAE by 4.1 cm, which indicates a substantial increase in model performance. This can be attributed to the concatenation of adjacent frames, which allowed producing new frames that are more informative. Furthermore, the layers of the transformer block preserve spatiotemporal information, transforming into comprehensive features for the Bi-LSTM to predict the positions of the different joints with high accuracy. This research produces a robust model for the task of human skeleton estimation. Our research model effectively reduces estimation errors and proves to be better in handling frames.
We performed statistical tests to evaluate the significance of the MAE and RMSE values in the proposed and conventional models. We employed paired
t-tests and
p-values and examined both. We compared the two values for the proposed model with those of the conventional method.
Table 9 shows the results of the
t-tests and the
p-values for MAE.
The proposed model demonstrates significant improvement compared to MARS [
3] and mmPose [
17] (
p < 0.05), indicating that this model is statistically more accurate in estimating joint positions than those methods. There is no significant difference compared to CNN+Bi-LSTM [
1] (
p > 0.05), which indicates that the performance of this model is comparable to CNN+Bi-LSTM. The improvement compared to mRI [
15] is almost significant (
p ), which means the proposed model is likely better. However, the statistical test is not enough to confirm this difference with certainty.
Table 10 shows the
t-test results and
p-values for RMSE on the conventional model for comparison with the proposed model.
The most significant difference was seen in mmPose [
17] (
p = 0.019), indicating that the proposed model is statistically superior in reducing joint position estimation errors compared to mmPose [
17]. This model is also better than MARS [
3] (
p = 0.038), indicating that this difference is statistically significant (
p < 0.05). The improvement compared to CNN+Bi-LSTM [
1] (
p = 0.194) and mRI [
15] (
p = 0.075) is not significant, which means that, although the RMSE of this model is lower, the difference is not statistically strong enough to conclude an absolute advantage over these methods.
We also include confidence intervals (CIs) for the reported metrics to indicate the reliability of the results. Based on the experimental results of 95% CIs for MAE and RMSE, we can analyze how stable and reliable the proposed model is compared to the baseline method.
Table 11 shows the CI results of the conventional and proposed models.
The proposed model has the best performance because it has the lowest MAE and RMSE and the smallest CI. The CNN+Bi-LSTM model [
1] is quite close to the performance of the proposed model but still has higher variability. Moreover, MARS [
3] and mmPose [
17] have very high variability, showing inconsistent and less reliable results.
Next, a detailed comparison of inference time was conducted to determine the computational efficiency. In the context of neural networks such as CNN, LSTM, or transformer, inference time refers to the duration from when data enters the model until the model produces a result. The experiments contain accuracy and computational costs that will be used for analysis.
Table 12 compares the inference time and accuracy in the proposed and conventional models.
Based on the comparison results in
Table 12, it can be concluded that the proposed model has the highest accuracy of 98.77%, outperforming CNN+BiLSTM [
1] and MARS [
3]. However, this increase in accuracy must be paid for with a longer inference time, which is 0.28 ms per sample, compared to CNN + BiLSTM [
1] and MARS [
3]. MARS [
3] and CNN+BiLSTM [
1] have low inference times due to their simpler architecture. The proposed model has the longest inference time due to the complexity of the architecture, such as the implementation of a transformer, multiple layers, and concatenating adjacent frames, which increases computation.
To demonstrate the generalizability of the data, the proposed model is tested on unseen activities. In the next step, we implement the Leave One Subject Out (LOSO) method in experiments to test the model in unseen subjects to show generalization outside the dataset [
3]. Four subjects participated in our experiments. Therefore, to appropriately implement LOSO, we run four rounds. During each of them, three subjects’ data are used for training, and the remaining data are used for testing. This aims to measure the generalizability of the model to new subjects. In this test, we employed the proposed model and conventional models such as MARS [
3] and CNN+Bi-LSTM [
1].
Table 13 shows the experimental results regarding MARS [
3] for the LOSO method.
The performance of the MARS model [
3] has relatively high errors, both in terms of MAE and RMSE. The highest overall average error was found when testing Subj_2. MARS models [
3] tend to be less able to generalize to untrained subjects, resulting in significant errors.
Table 14 shows the accuracy of the CNN + Bi-LSTM model [
1] regarding unseen subjects in the LOSO framework. The performance of this model is significantly improved compared to MARS [
3]. The highest error occurred when testing Subj_2 and the lowest when testing Subj_3. CNN+Bi-LSTM [
1] shows better temporal and spatial sequence learning ability than MARS [
3] but still has room for improvement in accurate estimation in all three axes (
).
Table 15 shows the evaluation of the proposed model (
n = 4) using the LOSO protocol for the joint estimation. This model shows the best results compared to the other two models. The average MAE is 2.06–4.12 cm, and the RMSE is 2.46–5.90 cm. The best results were obtained when testing Subj_2. The proposed model can capture spatial and temporal relationships very well and shows strong generalization to previously unseen subjects. The small error values demonstrate the superiority of this model architecture in handling mmWave radar data for joint point estimation.
In addition, we evaluated unseen activities with the Leave Some Activities Out (LSAO) method regarding the proposed approach. LSAO aims to test the model’s generalization ability to activities not seen during training. We split the dataset into five subsets, where each subset includes some activities exclusively. We then proceeded to train different models using different subsets. We run four rounds, where, in each round, four of the five subsets are used for training, and the remaining one is used for testing. By performing five rounds, five models are created on some activities and evaluated on others. This allows us to properly evaluate the proposed method on unseen activities.
Table 16 shows the experimental results using the LSAO method on the proposed model. The average MAE and RMSE were stable and low overall, indicating that the model generalized well to unseen activities (i.e., activities that were not encountered during training). Low MAE and RMSE values for the
x-axis mean the model is very stable in recognizing horizontal changes. The
y-axis (depth) shows the highest MAE and RMSE in all rounds. This is common in mmWave radars as the depth axis is often more prone to distortion or low resolution in estimation. Furthermore, dynamic body orientation towards the sensor (depth) and lack of variation in activity data on the
y axis during training further degrade the detection along this axis. For the
z-axis, performance is more stable and consistent. Round 3 appears to have the most representative and generalizable combination of testing activities from the training data. It can be seen that, in some rounds, the model is able to adapt well to unseen activities.
Table 17 provides a detailed ablation study based on the MAE and RMSE values for joint estimation across the
x,
y, and
z axes and the average over all the axes. The analysis reveals the individual contribution of each architectural component, CNN, transformer, and Bi-LSTM, toward the model’s spatial estimation accuracy.
The proposed model, which includes all three components (CNN + transformer + Bi-LSTM), achieves the best overall performance with the lowest average error (MAE: 1.77 cm; RMSE: 2.92 cm). When a GRU replaces the Bi-LSTM, the average error increases slightly to 1.84 cm MAE, suggesting that Bi-LSTM provides stronger temporal modeling capabilities, although GRU remains a reasonable alternative.
Removing the transformer leads to further degradation (MAE: 2.07 cm), indicating its critical role in capturing temporal dependencies via attention mechanisms. Removing the Bi-LSTM entirely yields a similar drop (MAE: 2.30 cm), reaffirming the importance of sequential modeling. In contrast, removing the CNN results in the highest overall error (MAE: 3.66 cm; RMSE: 5.76 cm) due to the model’s inability to extract meaningful spatial features early on.
Axis-specific trends show that the x- and z-axes produce lower errors. At the same time, the y-axis often has slightly higher values across configurations, possibly reflecting the radar’s lower depth resolution. These results confirm that each component contributes complementarily to the spatial and temporal learning process and justify the architectural choices made in the proposed model.
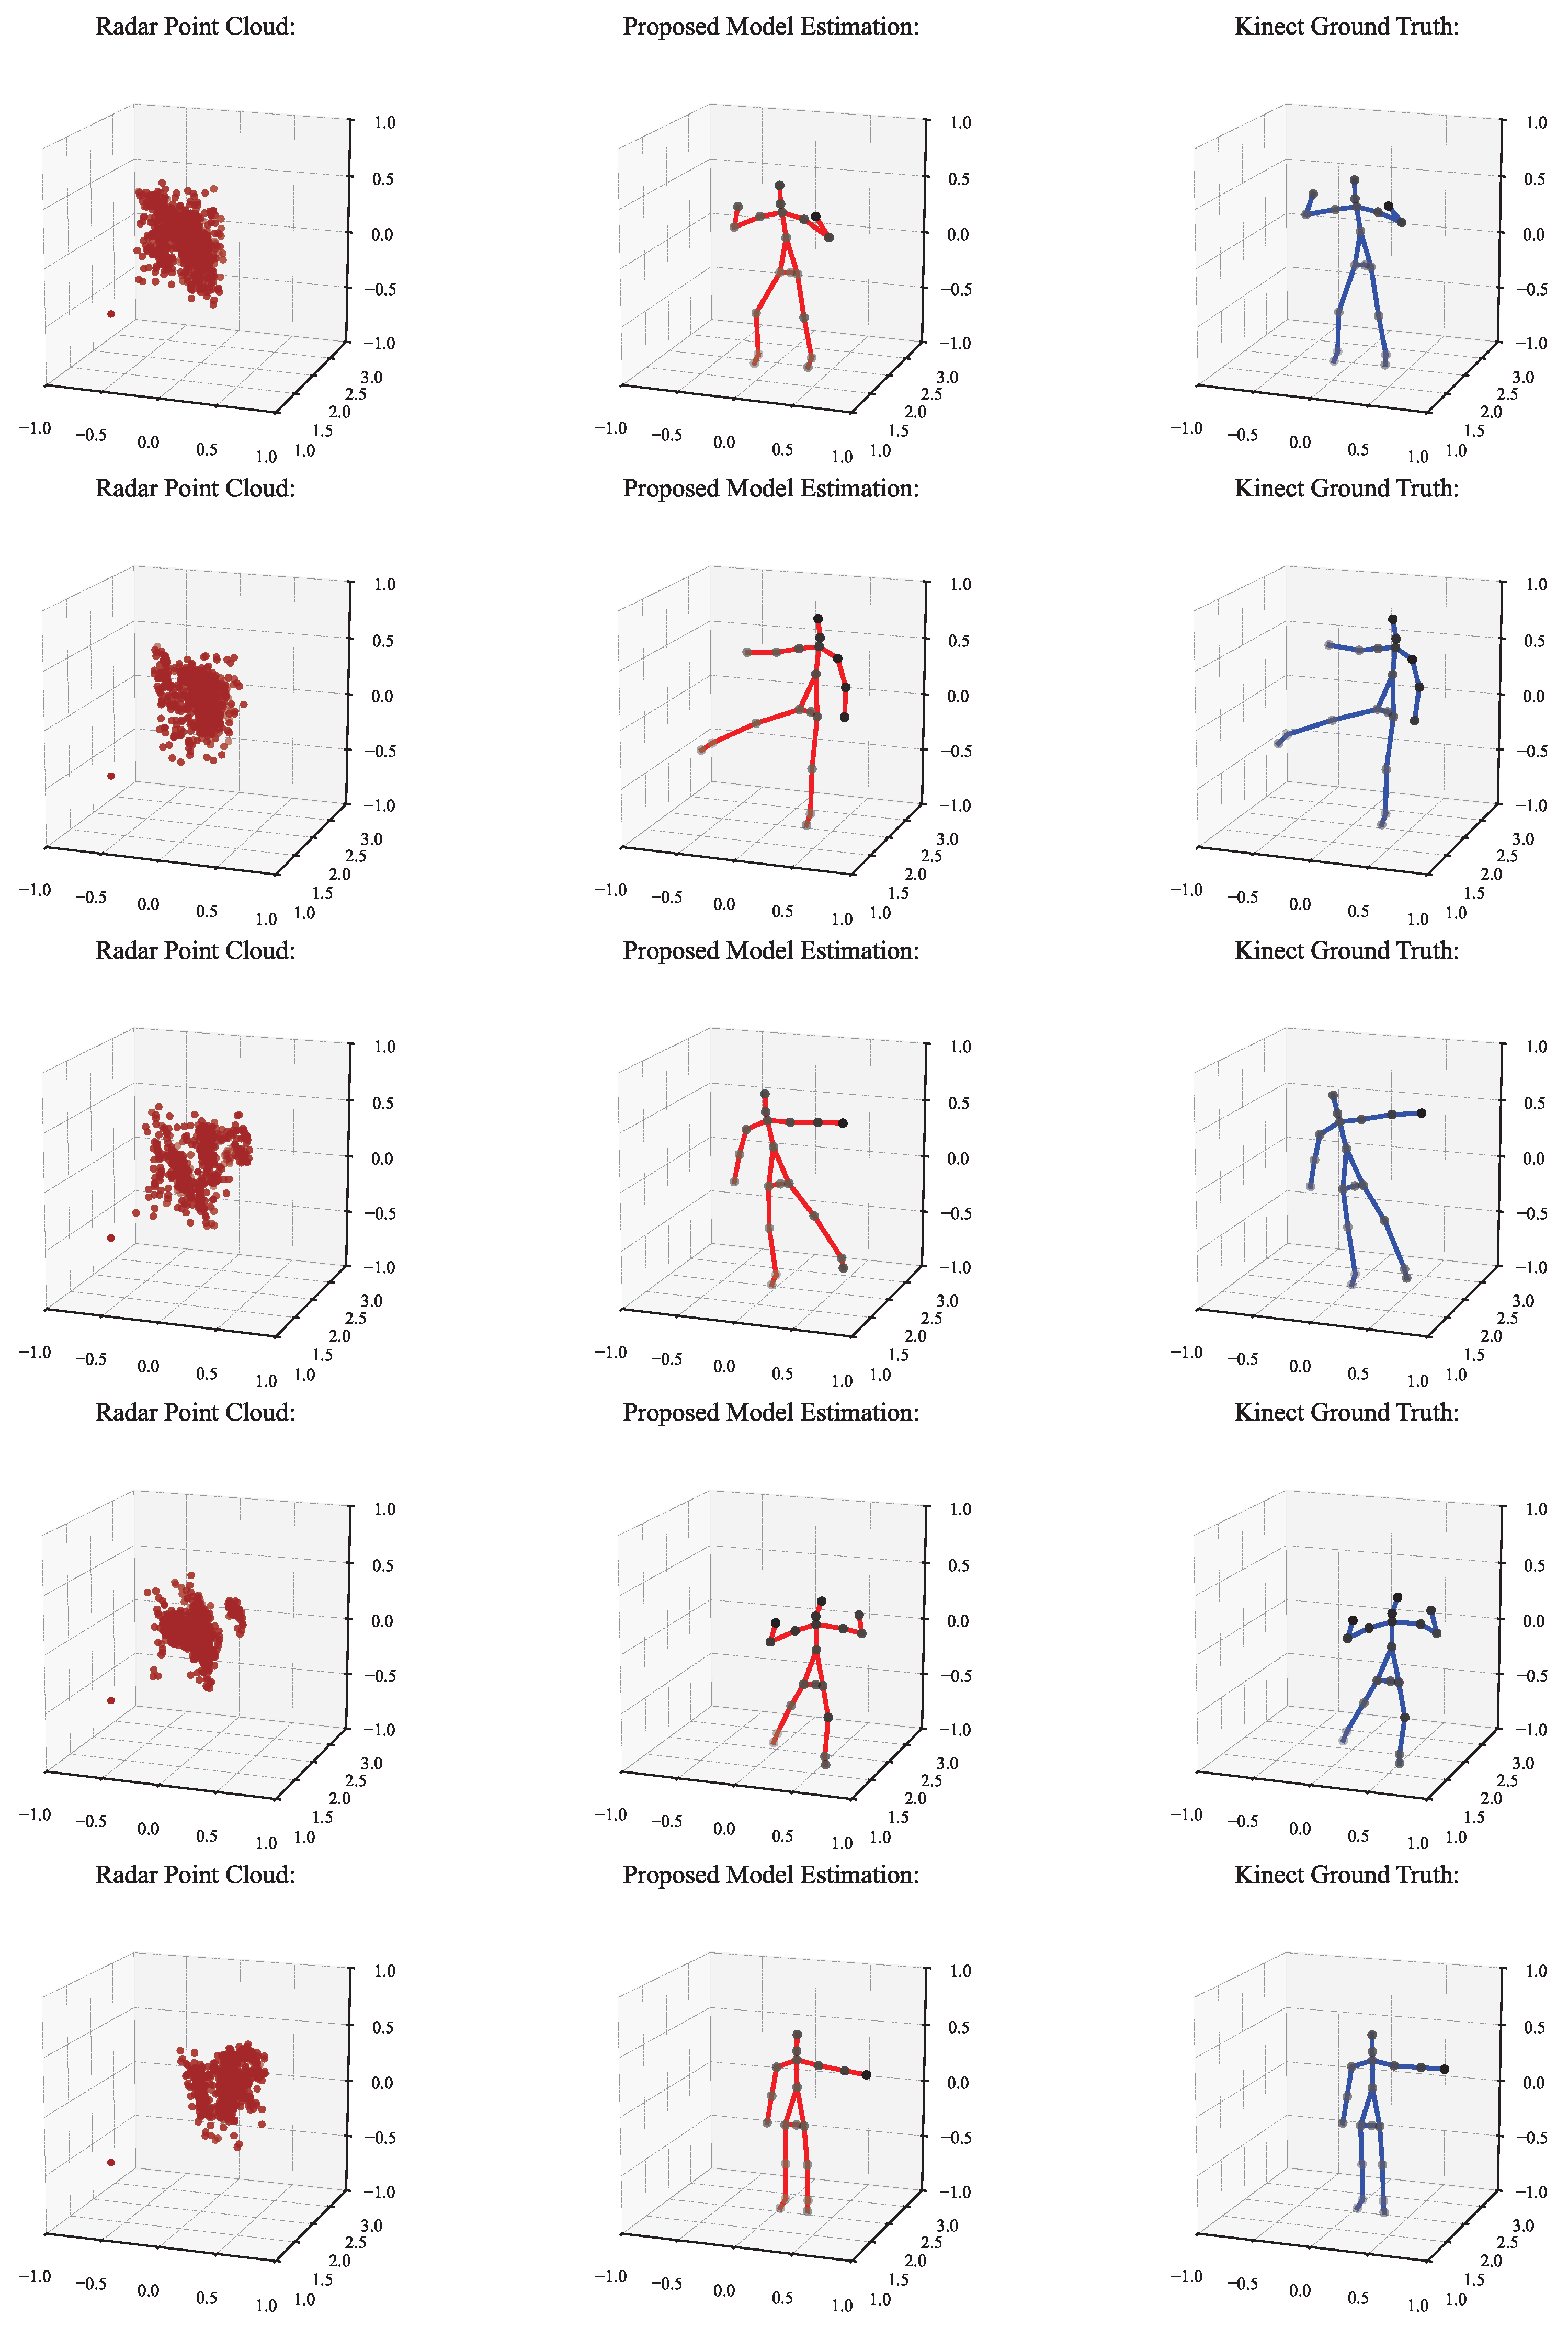
Figure 11 illustrates the qualitative results of the proposed skeleton estimation framework. Each row in the figure corresponds to a representative frame sampled from a sequence. From left to right, the subfigures show (a) the input radar point cloud, (b) the predicted human skeleton obtained from our model, and (c) the ground-truth skeleton derived from the Kinect sensor. The visual comparison shows that the predicted joints align closely with the reference joint locations in different poses, indicating that the model can learn accurate spatial representations from the sparse radar data. This visual evidence complements the quantitative results in
Table 6,
Table 7 and
Table 8 and confirms the robustness of our method in capturing complex limb configurations, such as lunges and extensions.
To complement the quantitative evaluation,
Figure 12 and
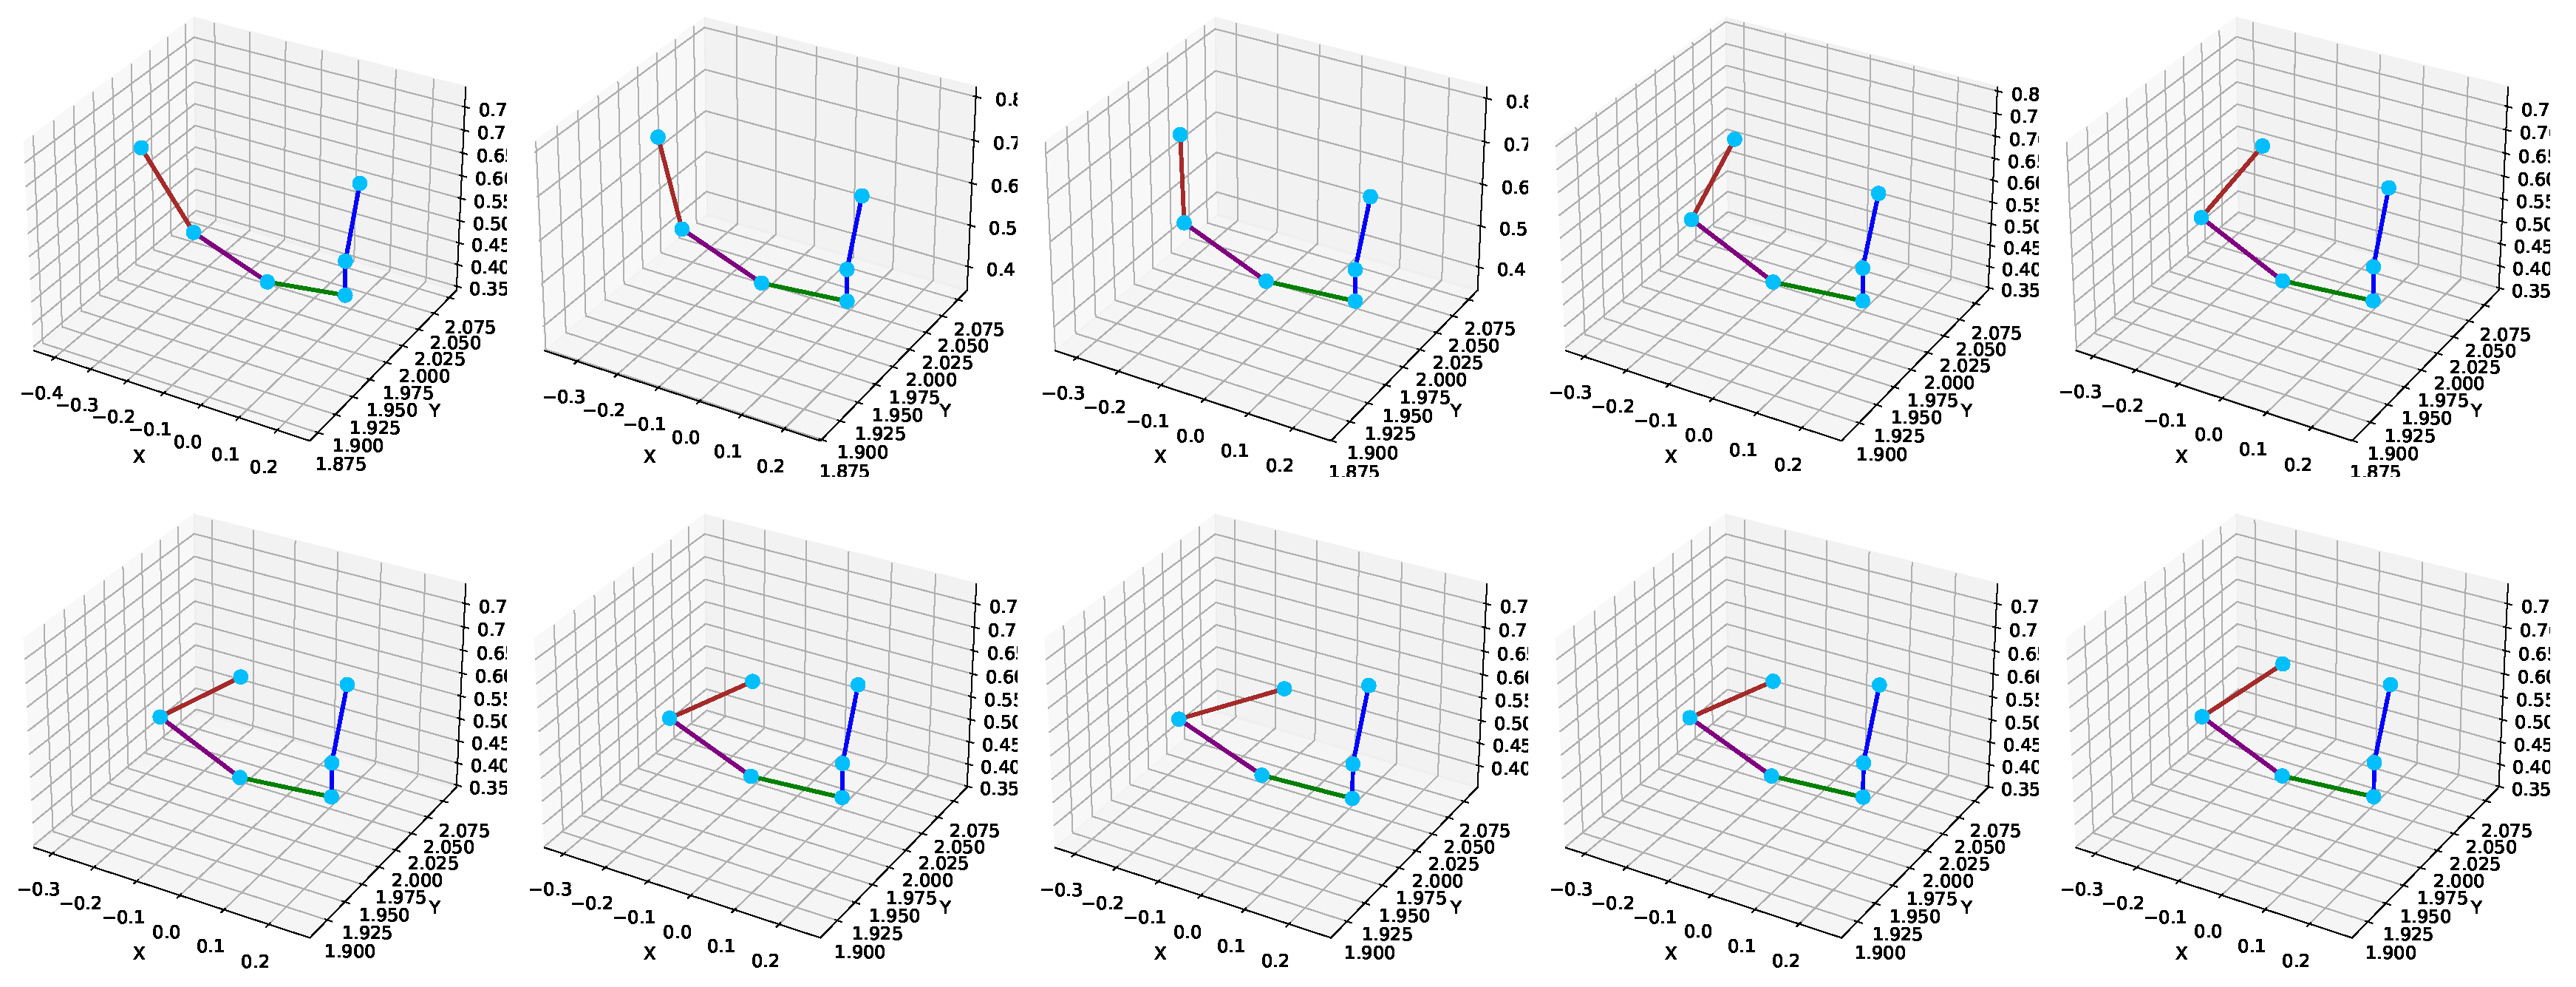
Figure 13 provide visual evidence of the model’s ability to maintain accurate and consistent joint estimations across time.
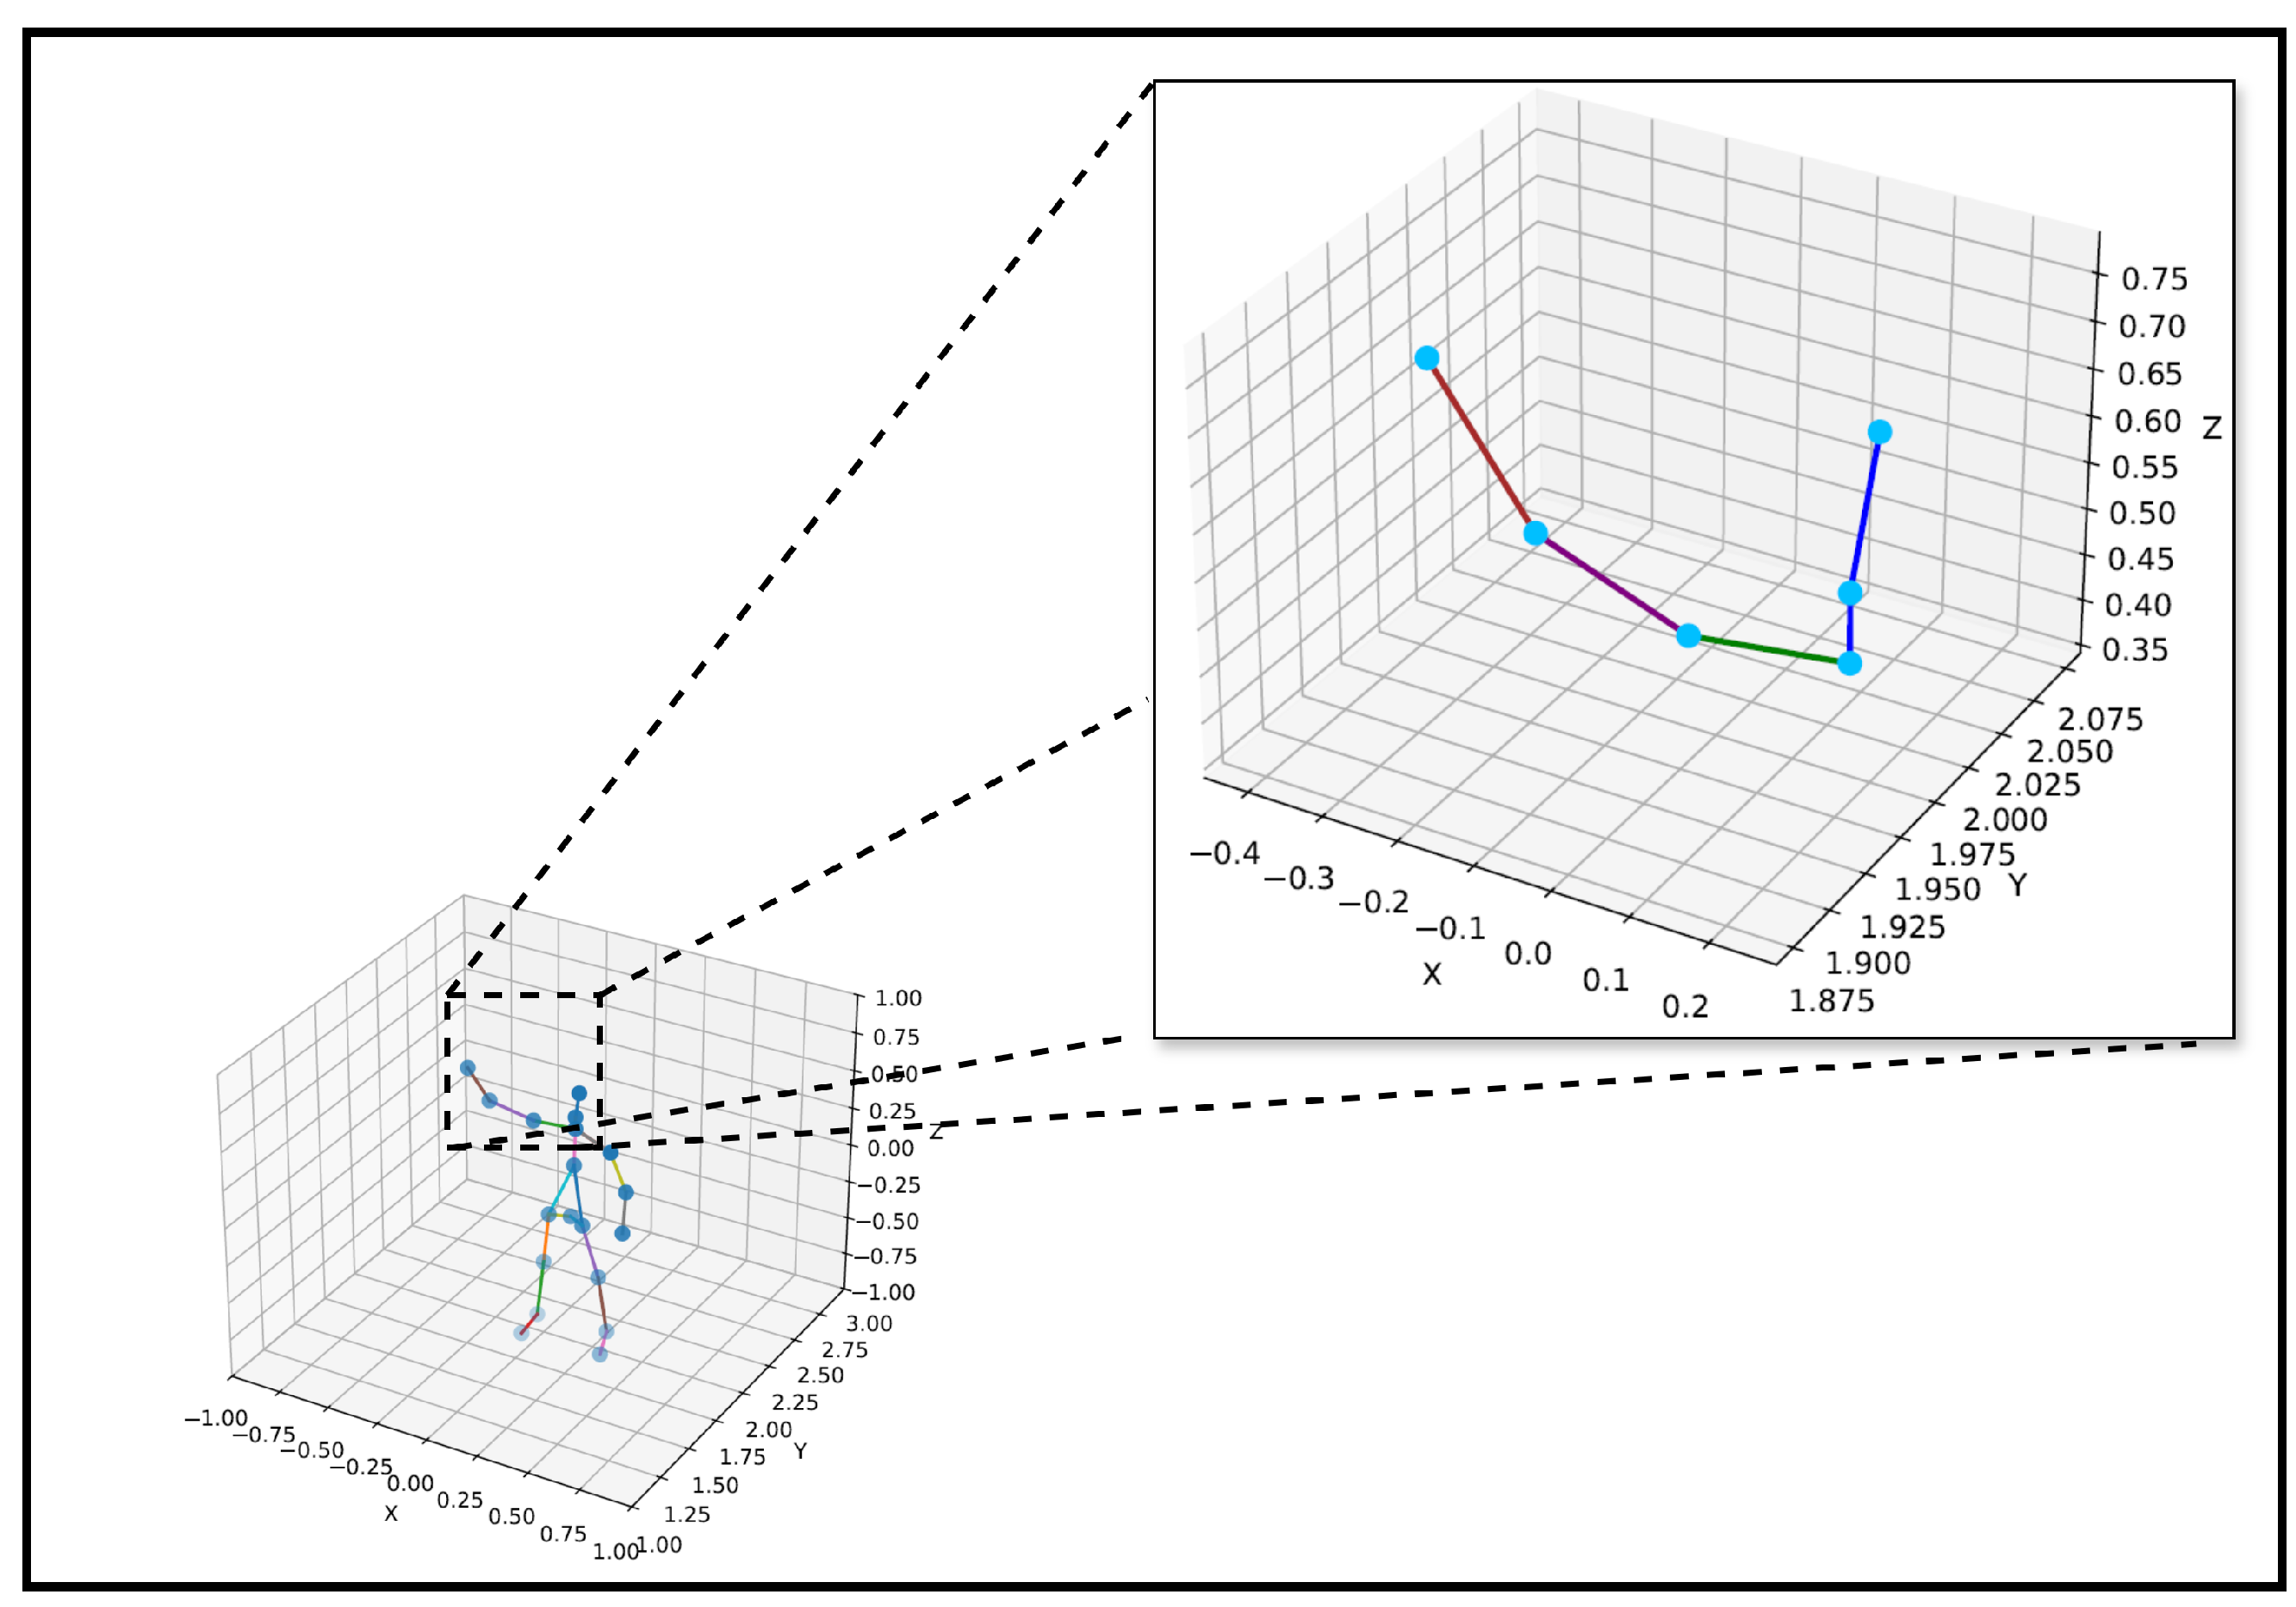
Figure 12 presents a detailed inset visualization of the predicted right upper limb skeleton over multiple frames, showing the spatial continuity of joints, such as the right shoulder, right elbow, and right wrist. The skeleton shape is preserved across frames, demonstrating the model’s spatial stability and robustness under temporal variation.
Different colors are used to indicate specific joint connections to enhance the interpretability of the visualization in
Figure 12. The blue lines represent the connections from the neck to the head, spine, and shoulder. The green line connects the spine shoulder to the right shoulder, the purple line denotes the connection from the right shoulder to the right elbow, and the brown line connects the right elbow to the right wrist. The joints are marked as cyan dots to ensure clear visibility of their spatial positions.
Figure 13 uses a similar color-coding scheme to maintain visual consistency across visualizations.
In addition,
Figure 13 displays time-series plots of joint coordinates corresponding to key upper body joints, including the right wrist, right elbow, right shoulder, neck, and head. These plots compare the predicted trajectories with ground-truth positions from the Kinect sensor. The curves exhibit smooth and consistent movement patterns that closely follow the ground truth. This visual alignment supports the temporal reliability of the proposed model, particularly in capturing complex articulations of the right upper limb.
To provide a more detailed understanding of model behavior across different types of motion,
Table 18 presents the joint MAE and RMSE values for four representative activities: left upper limb extension (LUL), right side lung (RSL), right front lung (RFL), and left side lung (LSL). These activities were selected to reflect diverse body parts’ engagements, including unilateral upper limb movement and dynamic lower limb motion. The results indicate that the model achieves lower localization errors for the proximal joints, such as the base of the spine and the mid of the spine, in all activities. In contrast, distal joints, particularly the wrists and ankles, tend to exhibit higher errors, especially during complex motions, such as RFL and LSL. For example, the right ankle shows an MAE exceeding 2.0 cm in the right front lung, suggesting greater difficulty regarding estimation during low-limb activity.
Table 19 summarizes the average MAE and RMSE values across all the joints for each of the ten activities in the dataset. The results show variability in estimation performance across different activities, with Activity 1 yielding the lowest average error (MAE = 0.91 cm; RMSE = 1.05 cm), while Activities 4, 5, and 6 produce higher errors (MAE > 2.0 cm). These results concisely overview the model’s performance consistency across various movement types and highlight specific activity cases where joint estimation is more challenging.
4.3. Discussion
This research presents a novel framework for detecting human joint positions that provides benefits in accuracy and computational complexity. The combination of CNN, transformer, and Bi-LSTM components in one workflow shows synergy in effectively extracting spatial and temporal features.
To overcome the inherent shortcomings of mmWave radar data, namely sparsity and lack of consistency, the concatenation of adjacent frames plays a key role in enriching the point cloud data. By concatenating frames into a new and more informative frame, the model improves the quality of feature extraction in both the spatial and temporal domains. As demonstrated by the stable learning curve in , this approach improves the detection accuracy and accelerates the model convergence. These results validate that this preprocessing step reduces noise artifacts and enhances signal relevance.
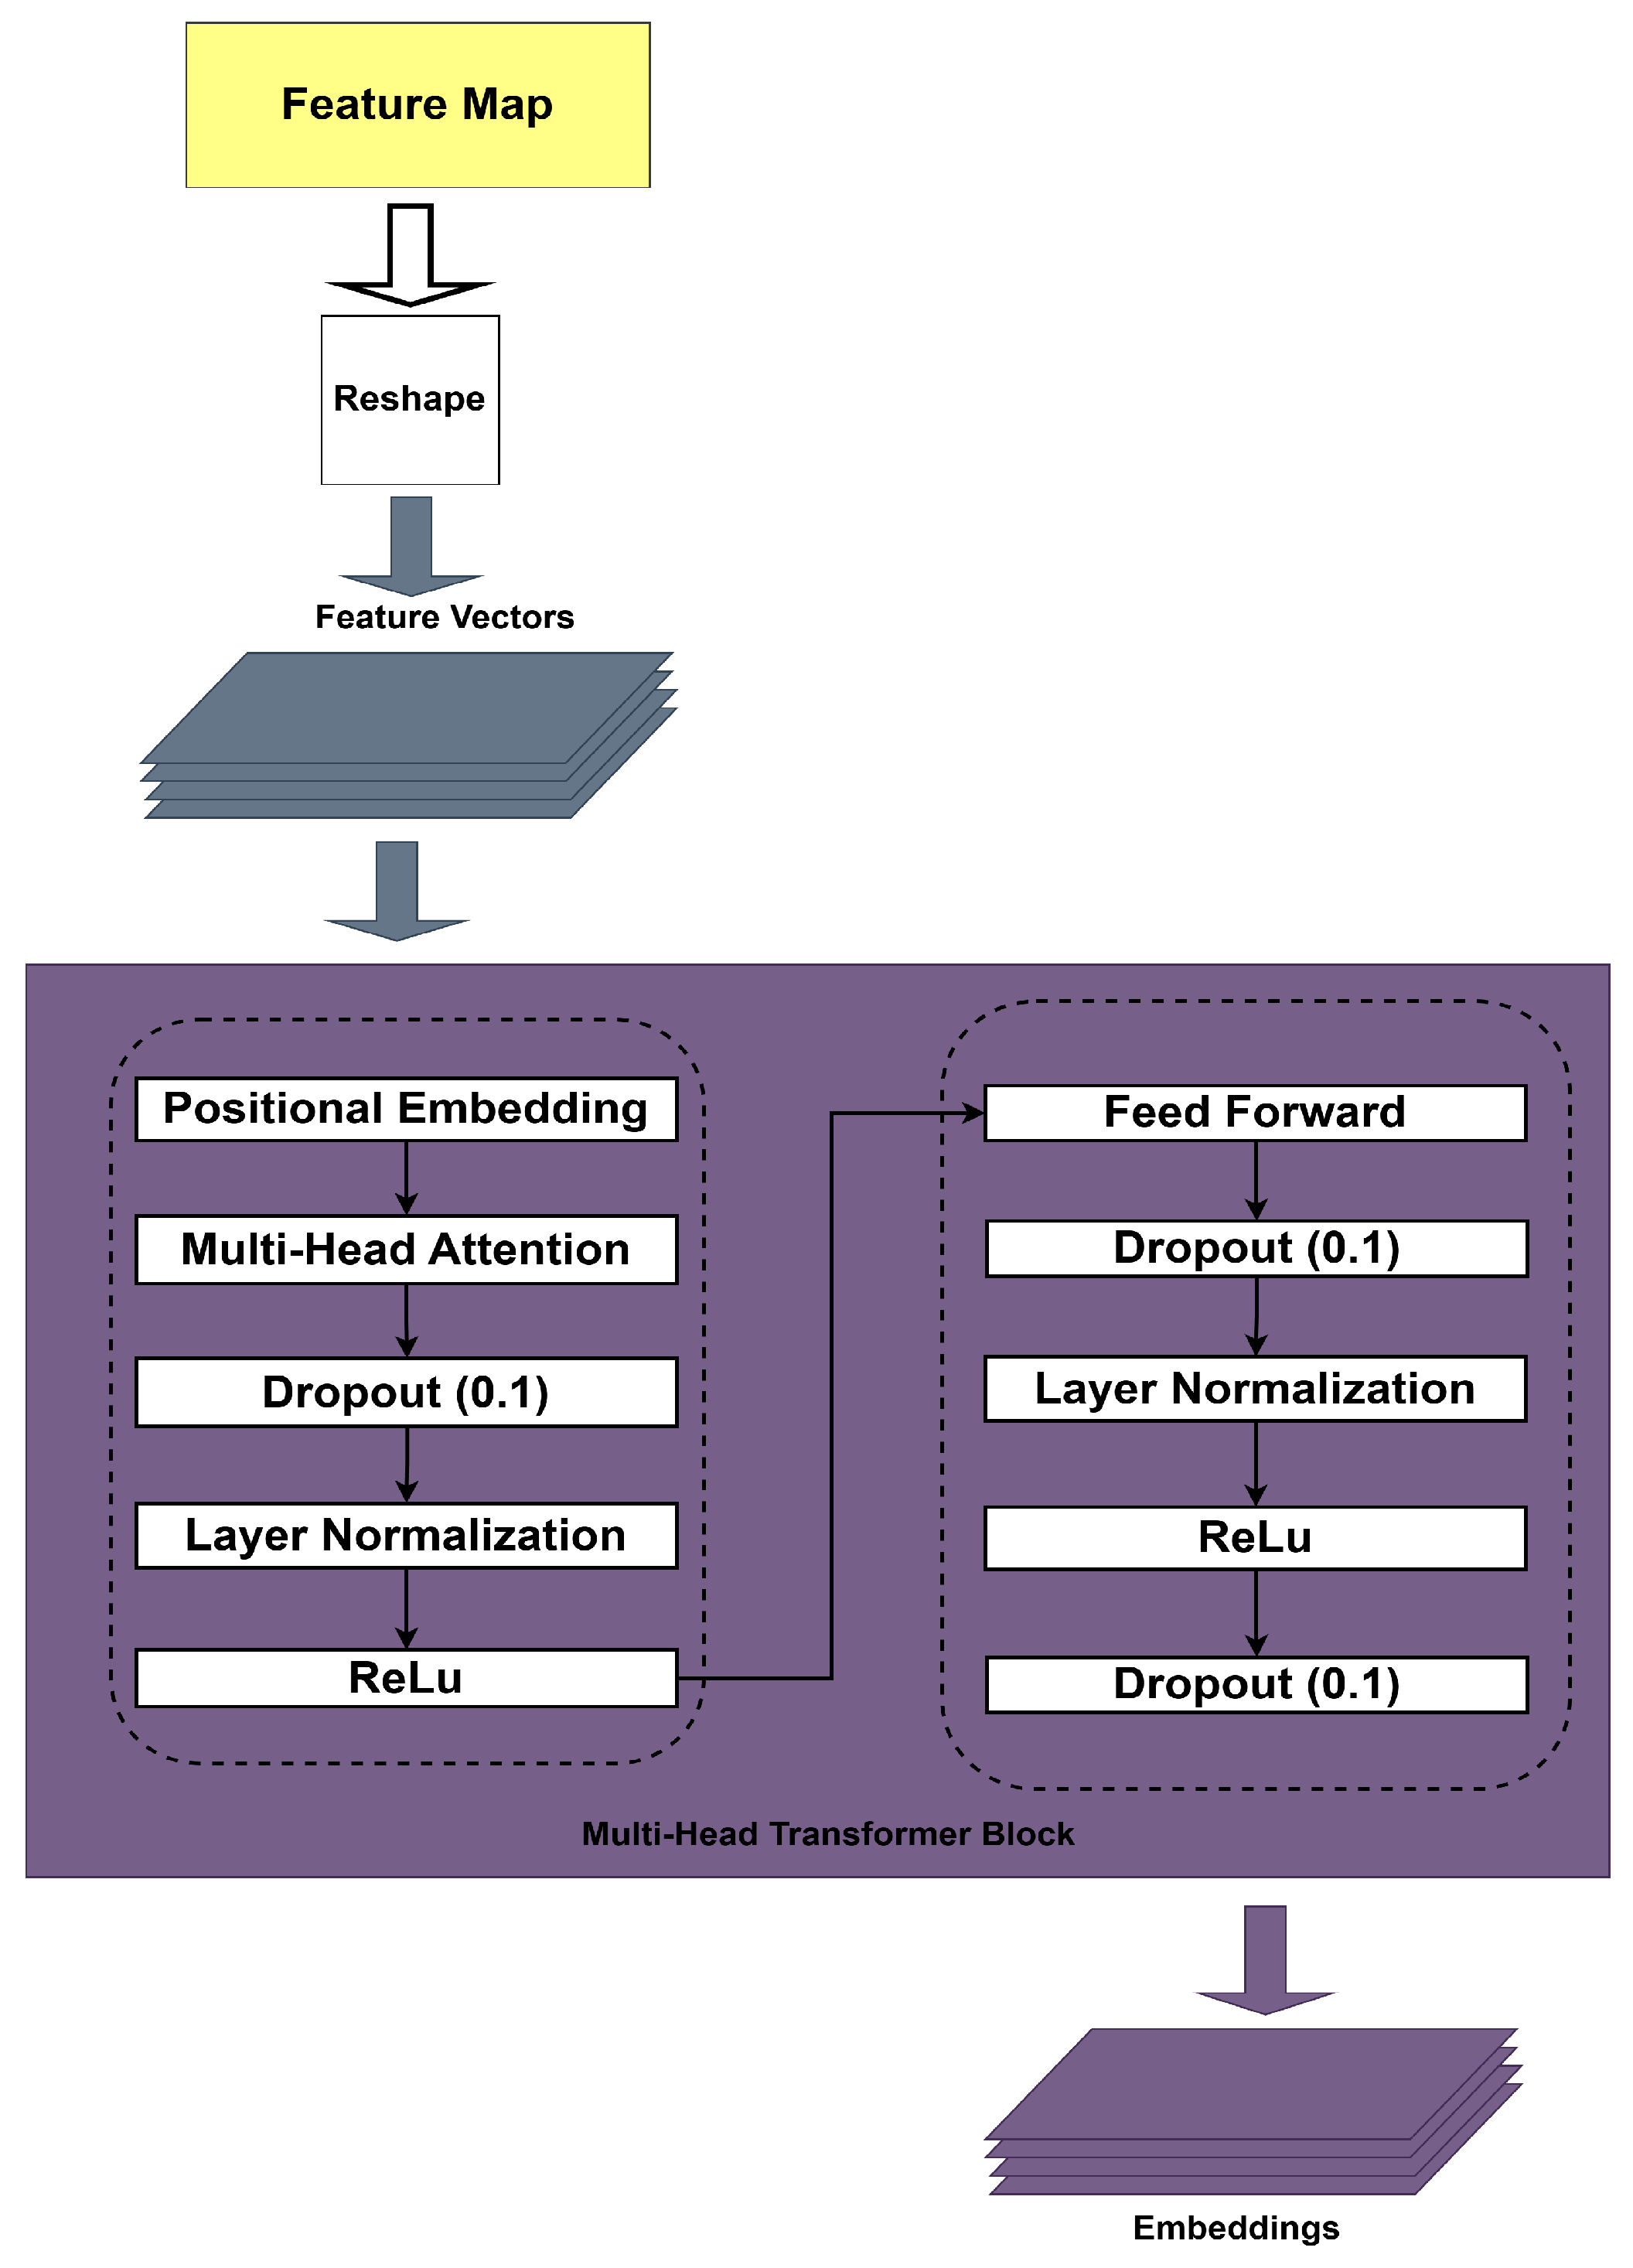
We split the processing into local and global processing. Global processing provides a broader understanding of the patterns and relationships across the entire dataset, which is important for understanding context and long-term dependencies and ensuring accurate predictions of joint positions. Transformer and Bi-LSTM blocks capture temporal data dependencies at different scales. This dual temporal processing flow ensures accurate joint position estimation, even in complex motion scenarios.
From several configurations, was selected as the optimal choice among the tested models as it offers good balance between feature complexity and computational load.
This research demonstrates significant performance improvements compared to conventional models such as MARS [
3] and mmPose [
17]. Unlike Shi et al. [
1], who employed a multi-frame fusion approach to enhance point cloud density, our method concatenates adjacent frames to directly build a temporally and spatially more informative representation. By integrating a CNN, transformer, and Bi-LSTM, our model effectively captures spatiotemporal dependencies and robustly handles sparse radar point clouds. Specifically, our approach reduces the MAE by an average of 4.1 cm compared to the method proposed in [
3]. It shows superior generalization by achieving lower RMSE values for training and validation sets.
This advantage is also proven through the paired
t-test (
Table 9 and
Table 10), which shows that the difference in results between the proposed model and MARS [
3] and mmPose [
17] is statistically significant (
p < 0.05). Although the comparison with CNN+Bi-LSTM [
1] and mRI [
15] is not statistically significant (
p > 0.05), our model results still show lower error and better result stability. Even when compared with the quite competitive CNN+Bi-LSTM, our model still shows clear accuracy improvement and result stability, as evidenced by the 95% confidence intervals in
Table 11, namely MAE ± CI = 1.77 ± 0.40 cm and RMSE ± CI = 2.91 ± 1.16 cm.
Furthermore, although the
p-value for mRI [
15] approaches the significance threshold (
p ), the observed absolute difference in MAE (4.26 cm vs. 1.77 cm) reflects a moderate to large effect size. This suggests that our model’s improvement is statistically relevant in some instances and practically meaningful for high-precision applications such as rehabilitation or clinical assessment.
In terms of computational efficiency, the inference time analysis in
Table 12 shows that the proposed model has an average inference time of 0.28 ms per sample, which is higher than MARS [
3] and CNN+Bi-LSTM [
1]. This inference time increases due to the complexity of the architecture, especially the use of transformers and the frame merging process.
While the proposed model introduces additional architectural complexity, its average inference time remains practical for real-time use. As shown in
Table 12, the model achieves an inference time of 0.28 ms per sample, which is well below typical real-time thresholds (e.g., 30–50 ms for visual feedback systems). Additionally, deployment on resource-constrained edge devices could benefit from standard optimization techniques, such as model pruning, quantization, and architectural simplification, to reduce the memory and compute demands without compromising real-time performance. The MARS model [
3] was previously shown to operate with a latency of 64–105 μs per frame. Given that our model still provides substantial timing margin relative to sensor acquisition rates such as Kinect V2 (30 Hz = 33.3 ms) or mmWave radar (10 Hz = 100 ms), the observed accuracy improvement is justified by the acceptable increase in inference latency. Therefore, our model remains suitable for the real-time rehabilitation and deployment of monitoring systems.
In addition, to evaluate the generalization ability, the model was tested using the LOSO method, where one subject was used for testing and three others for training. The results from this scenario show that the model maintains its accuracy even when faced with data from subjects it has never seen before.
Apart from testing generalization using the LOSO approach, this research also evaluates the model’s ability to deal with more complex scenarios using the LSAO approach. The experimental results using the LSAO approach show that, despite a slight decrease in accuracy compared to the LOSO scenario, the proposed model still shows good robustness to changes in activity distribution. The decreases in MAE and RMSE are not too drastic, indicating that the model architecture, especially the frame concatenation and the application of transformer and Bi-LSTM, plays an important role in maintaining stable performance even when new activities are introduced during testing.
Although the MARS dataset primarily consists of dynamic rehabilitation movements, static human poses are inherently present within the sequences. These occur during natural pauses between transitions from one motion to another, such as when a subject temporarily stands still or holds a position before continuing to the next activity. As a result, the model is implicitly exposed to static pose patterns during training and evaluation. In these static intervals, frame-to-frame variation is minimal, and the concatenation of adjacent frames yields denser and more stable point clouds. This reduced temporal fluctuation likely enhances the accuracy of spatial feature extraction and joint localization, even in the absence of motion. Therefore, while not explicitly evaluated as a separate category, the model can generalize to static pose scenarios based on its exposure to such conditions within the dataset.
While the evaluation of the MARS dataset demonstrates strong performance and robustness, we acknowledge that testing on a single dataset may limit generalizability. As part of future work, we plan to collect a new radar dataset under diverse environmental settings and hardware configurations. This will allow for cross-dataset validation and the opportunity to assess the ecological validity of the proposed model in real-world deployment scenarios.
Moreover, as shown in
Table 17, the ablation study further highlights the complementary importance of each network block in the proposed model. Removing the CNN block most significantly increases the error, emphasizing its role in early spatial feature extraction. The exclusion of the transformer or Bi-LSTM blocks also leads to notable performance degradation, confirming their roles in capturing temporal dependencies through attention and recurrent mechanisms. These results validate our choice of integrating a CNN, transformer, and Bi-LSTM to achieve a robust spatiotemporal representation.
To further support the temporal robustness of the proposed model,
Figure 11 provides a visual sequence comparison where the predicted skeletons are consistently aligned with the Kinect-based ground truth across multiple frames. This visual coherence highlights the model’s ability to preserve joint structure over time. Additionally,
Figure 13 presents time-series plots of joint trajectories, such as wrist and elbow, which exhibit smooth and continuous patterns closely following the ground truth. These visualizations collectively demonstrate the model’s temporal stability and reinforce the quantitative improvements in
Table 6 and
Table 18.
In addition to the quantitative evaluation,
Table 18 and
Table 19 provide more fine-grained insights by reporting the per-joint and per-activity performance. It is evident that wrist joints, which are located farther from the torso and exhibit greater motion, tend to have higher estimation errors. This trend is especially prominent in activities involving fast upper limb movements. These findings indicate that distal joints remain more challenging to estimate due to motion-induced sparsity and orientation variance, which could be a future target for improvement.
This can be explained by the fact that frame concatenation creates a richer temporal representation, while a transformer allows more flexible generalization of spatial patterns, and Bi-LSTM enhances the modeling of long-term temporal dynamics. The combination of these three blocks produces a latent representation that is more abstract and less dependent on one specific activity type, so the model can still recognize human movement patterns, even in activities that were not previously recognized during training.
A critical comparison shows that the conventional methods often focus on spatial or temporal modeling but lack integration of both. For instance, CNN-based approaches [
1] effectively capture spatial features but cannot deal with temporal inconsistencies. In contrast, transformer-based models [
28] are capable of temporal modeling but struggle with noise in sparse data. Our framework addresses these limitations by combining local and global processing, which allows our model to achieve state-of-the art results in radar-based human joint estimation.
Despite its benefits, the proposed approach faces some limitations:
Sensitivity to sparse data: Although merging adjacent frames effectively improves data quality, the sparseness of FMCW radar data still affects the accuracy of detecting difficult joint positions, such as the wrist and ankle. This limitation is evident from their higher MAE values compared to other joints.
Computational demand: Since merging adjacent frames produces a new one, increasing frame size demands more memory and computational resources, making real-time implementation challenging in resource-constrained environments.
Data diversity: Reliance on a single dataset such as MARS [
3] limits the generalizability of the findings. Expanding the coverage of datasets for different human activities and environmental conditions is needed to validate the robustness of the model.
To address these challenges and build on the current findings, future research should explore the following directions:
Dynamic frame selection mechanisms: Introduce an adaptive frame selection model that dynamically selects frames based on motion intensity to further improve input quality while reducing unnecessary computational overhead.
Real-Time implementation: Optimizing real-time processing models is essential for practical applications. Techniques such as lightweight neural architectures, model pruning, and quantization can reduce the computational footprint without sacrificing accuracy.
Edge-level deployment feasibility: To support future deployment, the proposed model is designed with a radar-compatible architecture that can be optimized for edge devices such as the TI IWR1443. Although real-time benchmarking is not included in this work, the model’s modular structure enables the potential use of lightweight techniques, such as pruning or quantization, to reduce latency and computational cost. This direction is promising for practical applications like in-home rehabilitation and fall detection.
Generalization across datasets: Future research should focus on training and validating the model on multiple datasets with varying environmental conditions and movement patterns. While the evaluation using the MARS dataset [
3] has demonstrated strong performance, testing on a single dataset may limit the external validity of the findings. As part of future work, we plan to collect a new radar dataset under diverse environmental settings and hardware configurations. This will allow for cross-dataset validation and the opportunity to assess the ecological validity of the proposed model in real-world deployment scenarios.


