
An Assessment of the Sensory Function in the Maxillofacial Region: A Dual-Case Pilot Study


Abstract
1. Introduction
1.1. Consequences of Tooth Loss
- Difficulty eating certain foods, which can affect nutrition and digestion, as well as the enjoyment of food;
- Higher self-consciousness over appearance, which can make one feel less confident and attractive, leading to avoiding social situations or interactions that involve smiling or talking, as well as impairing communication, comprehension skills, and self-esteem;
- Increased risk of damage to surrounding teeth, such as misalignment, crowding, or tilting of the teeth, which can make them more prone to decay, fracture, or infection;
- Speech problems, such as the ability to pronounce certain sounds and words;
- Greater likelihood of gum disease and cavities due to exposing more of the gum tissue and the roots of the remaining teeth;
- Affects the density and shape of the jawbone, which supports the teeth and maintains the facial structure.
1.2. Restoring Oral Proprioception
2. Materials and Methods
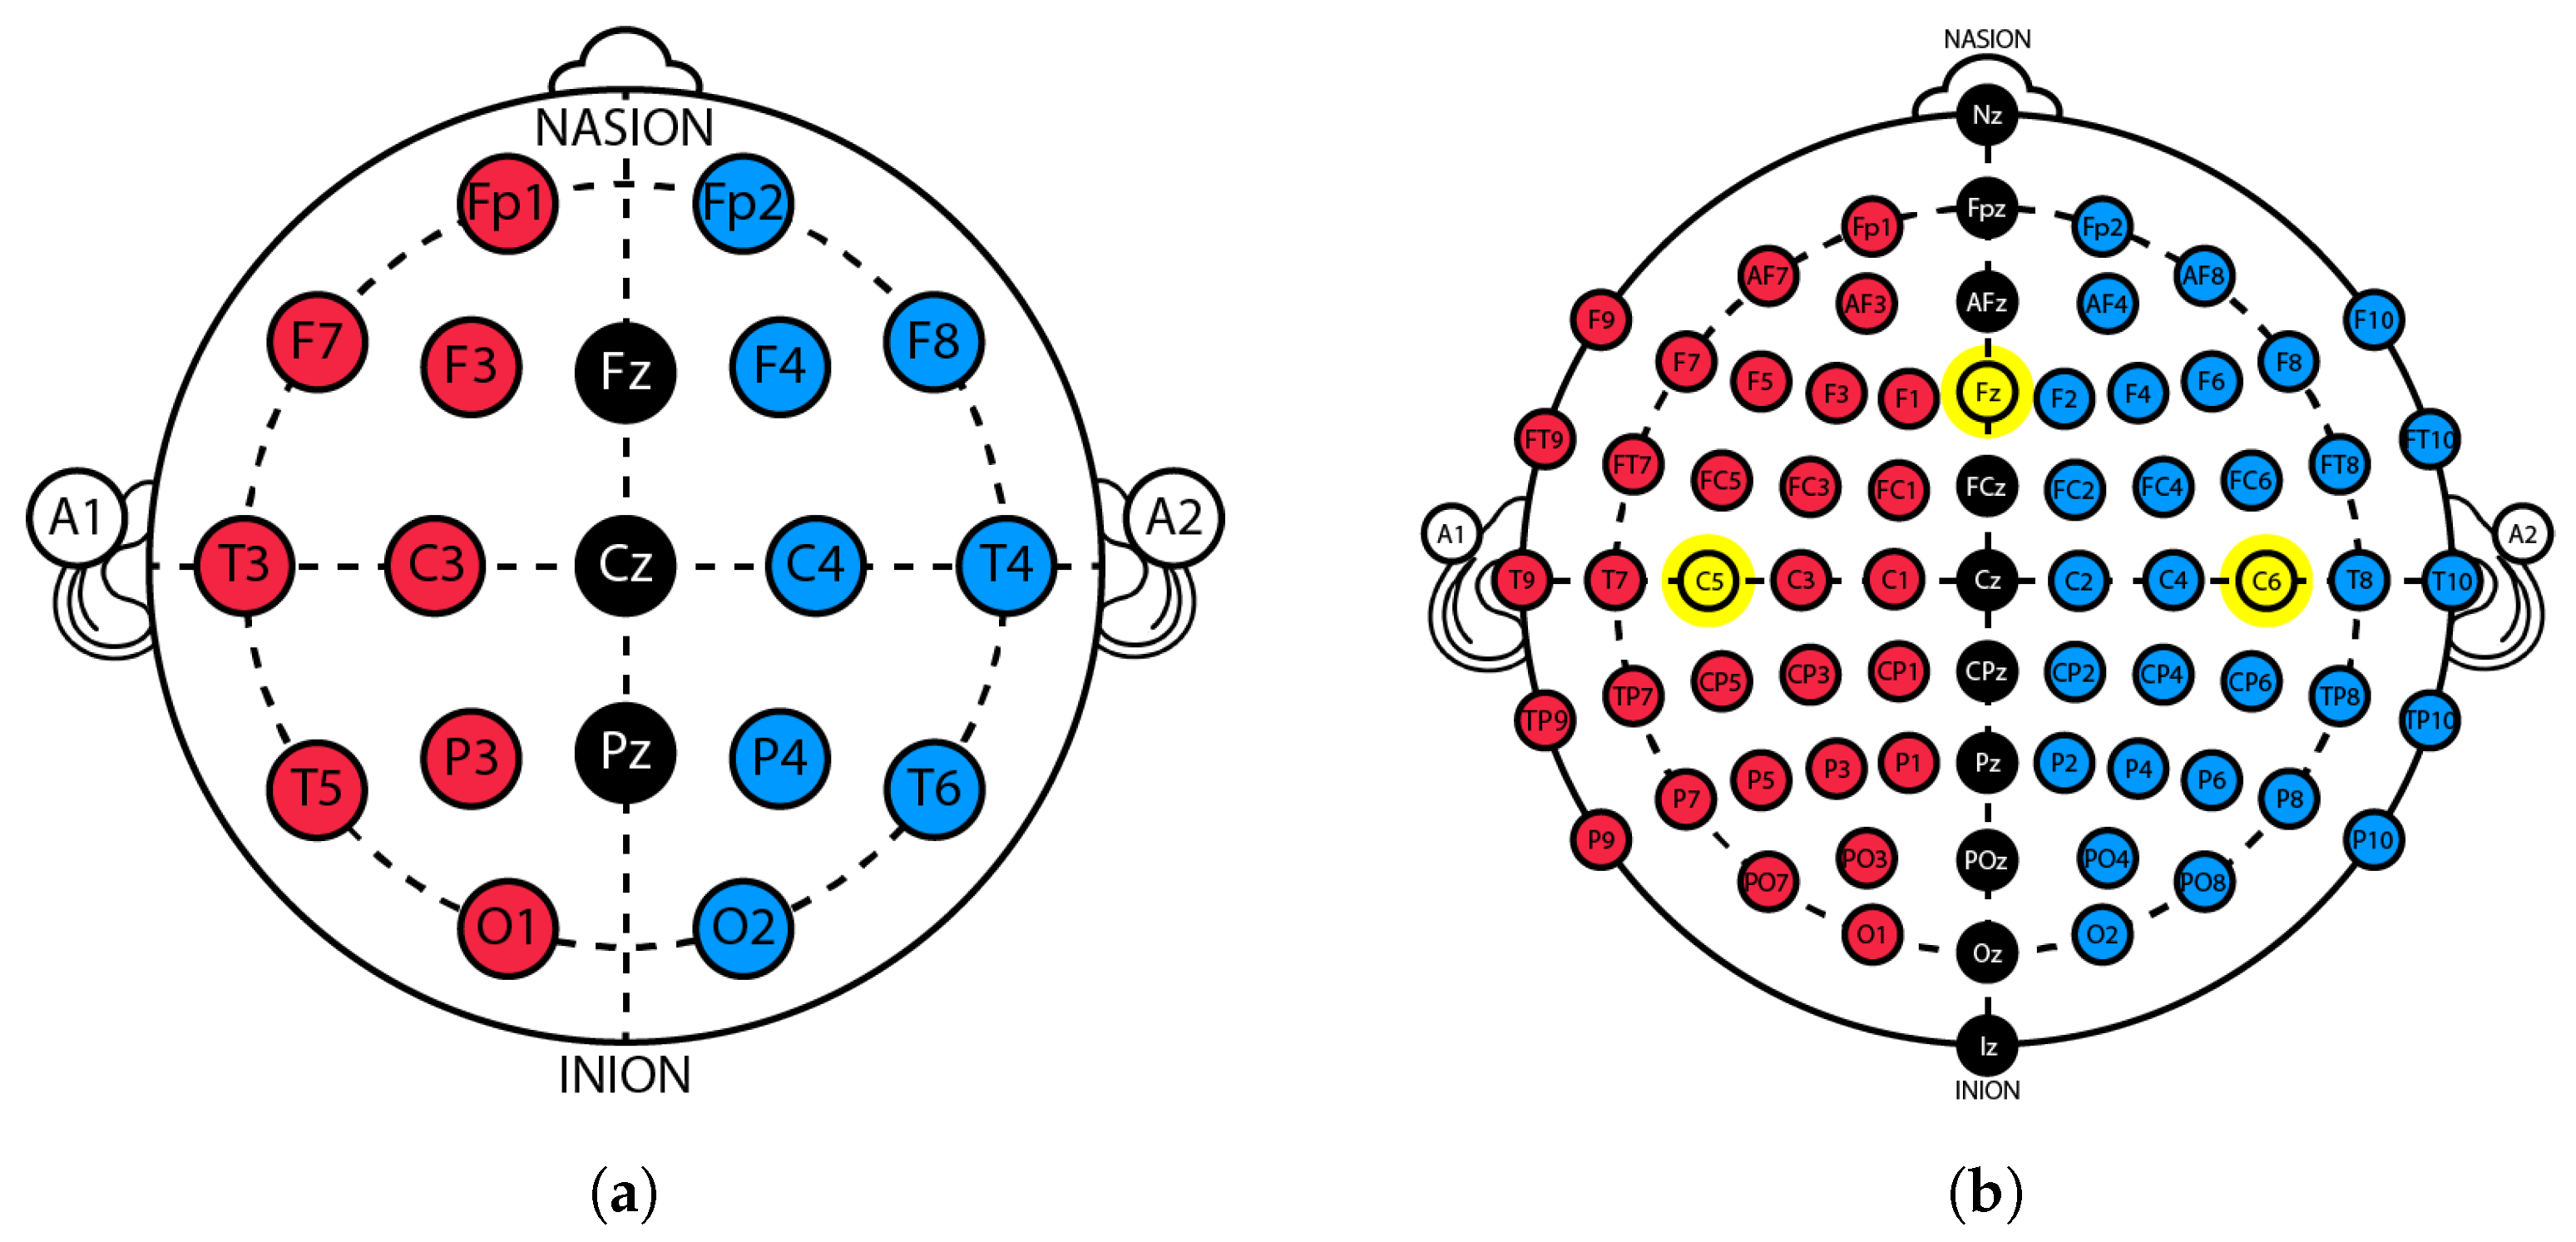
2.1. Traditional Trigeminal Somatosensory-Evoked Potentials
- Setup 1: LTK545 3-in-1 electrostimulator from Moretti S.P.A. and eego™ mylab set from ANT Neuro (64-channel EEG cap and a 32-channel amplifier).
- Setup 2: 2100 Isolated Pulse Stimulator (A-M Systems) and eego™ mylab set from ANT Neuro (64-channel EEG cap and a 32-channel amplifier).
- Setup 3: 2100 Isolated Pulse Stimulator (A-M Systems), eego™ mini-series amplifier from ANT Neuro, and a Nihon Kohden-type EEG cap.
- Setup 4: ISO-STIM-II-Stimulus Isolator (npi electronic GmbH), eego™ mini-series amplifier from ANT Neuro, and a Nihon Kohden-type EEG cap.
- Connect all the electronic components, including the stimulator, the circuit, the EEG cap, the amplifier, and the computer;
- Adjust the cap to the subject’s head;
- Configure the ANT Neuro recording program eego™ to measure the impedance of the EEG electrodes. Apply conductive gel to the electrodes as needed to reduce the impedance to below 20 k;
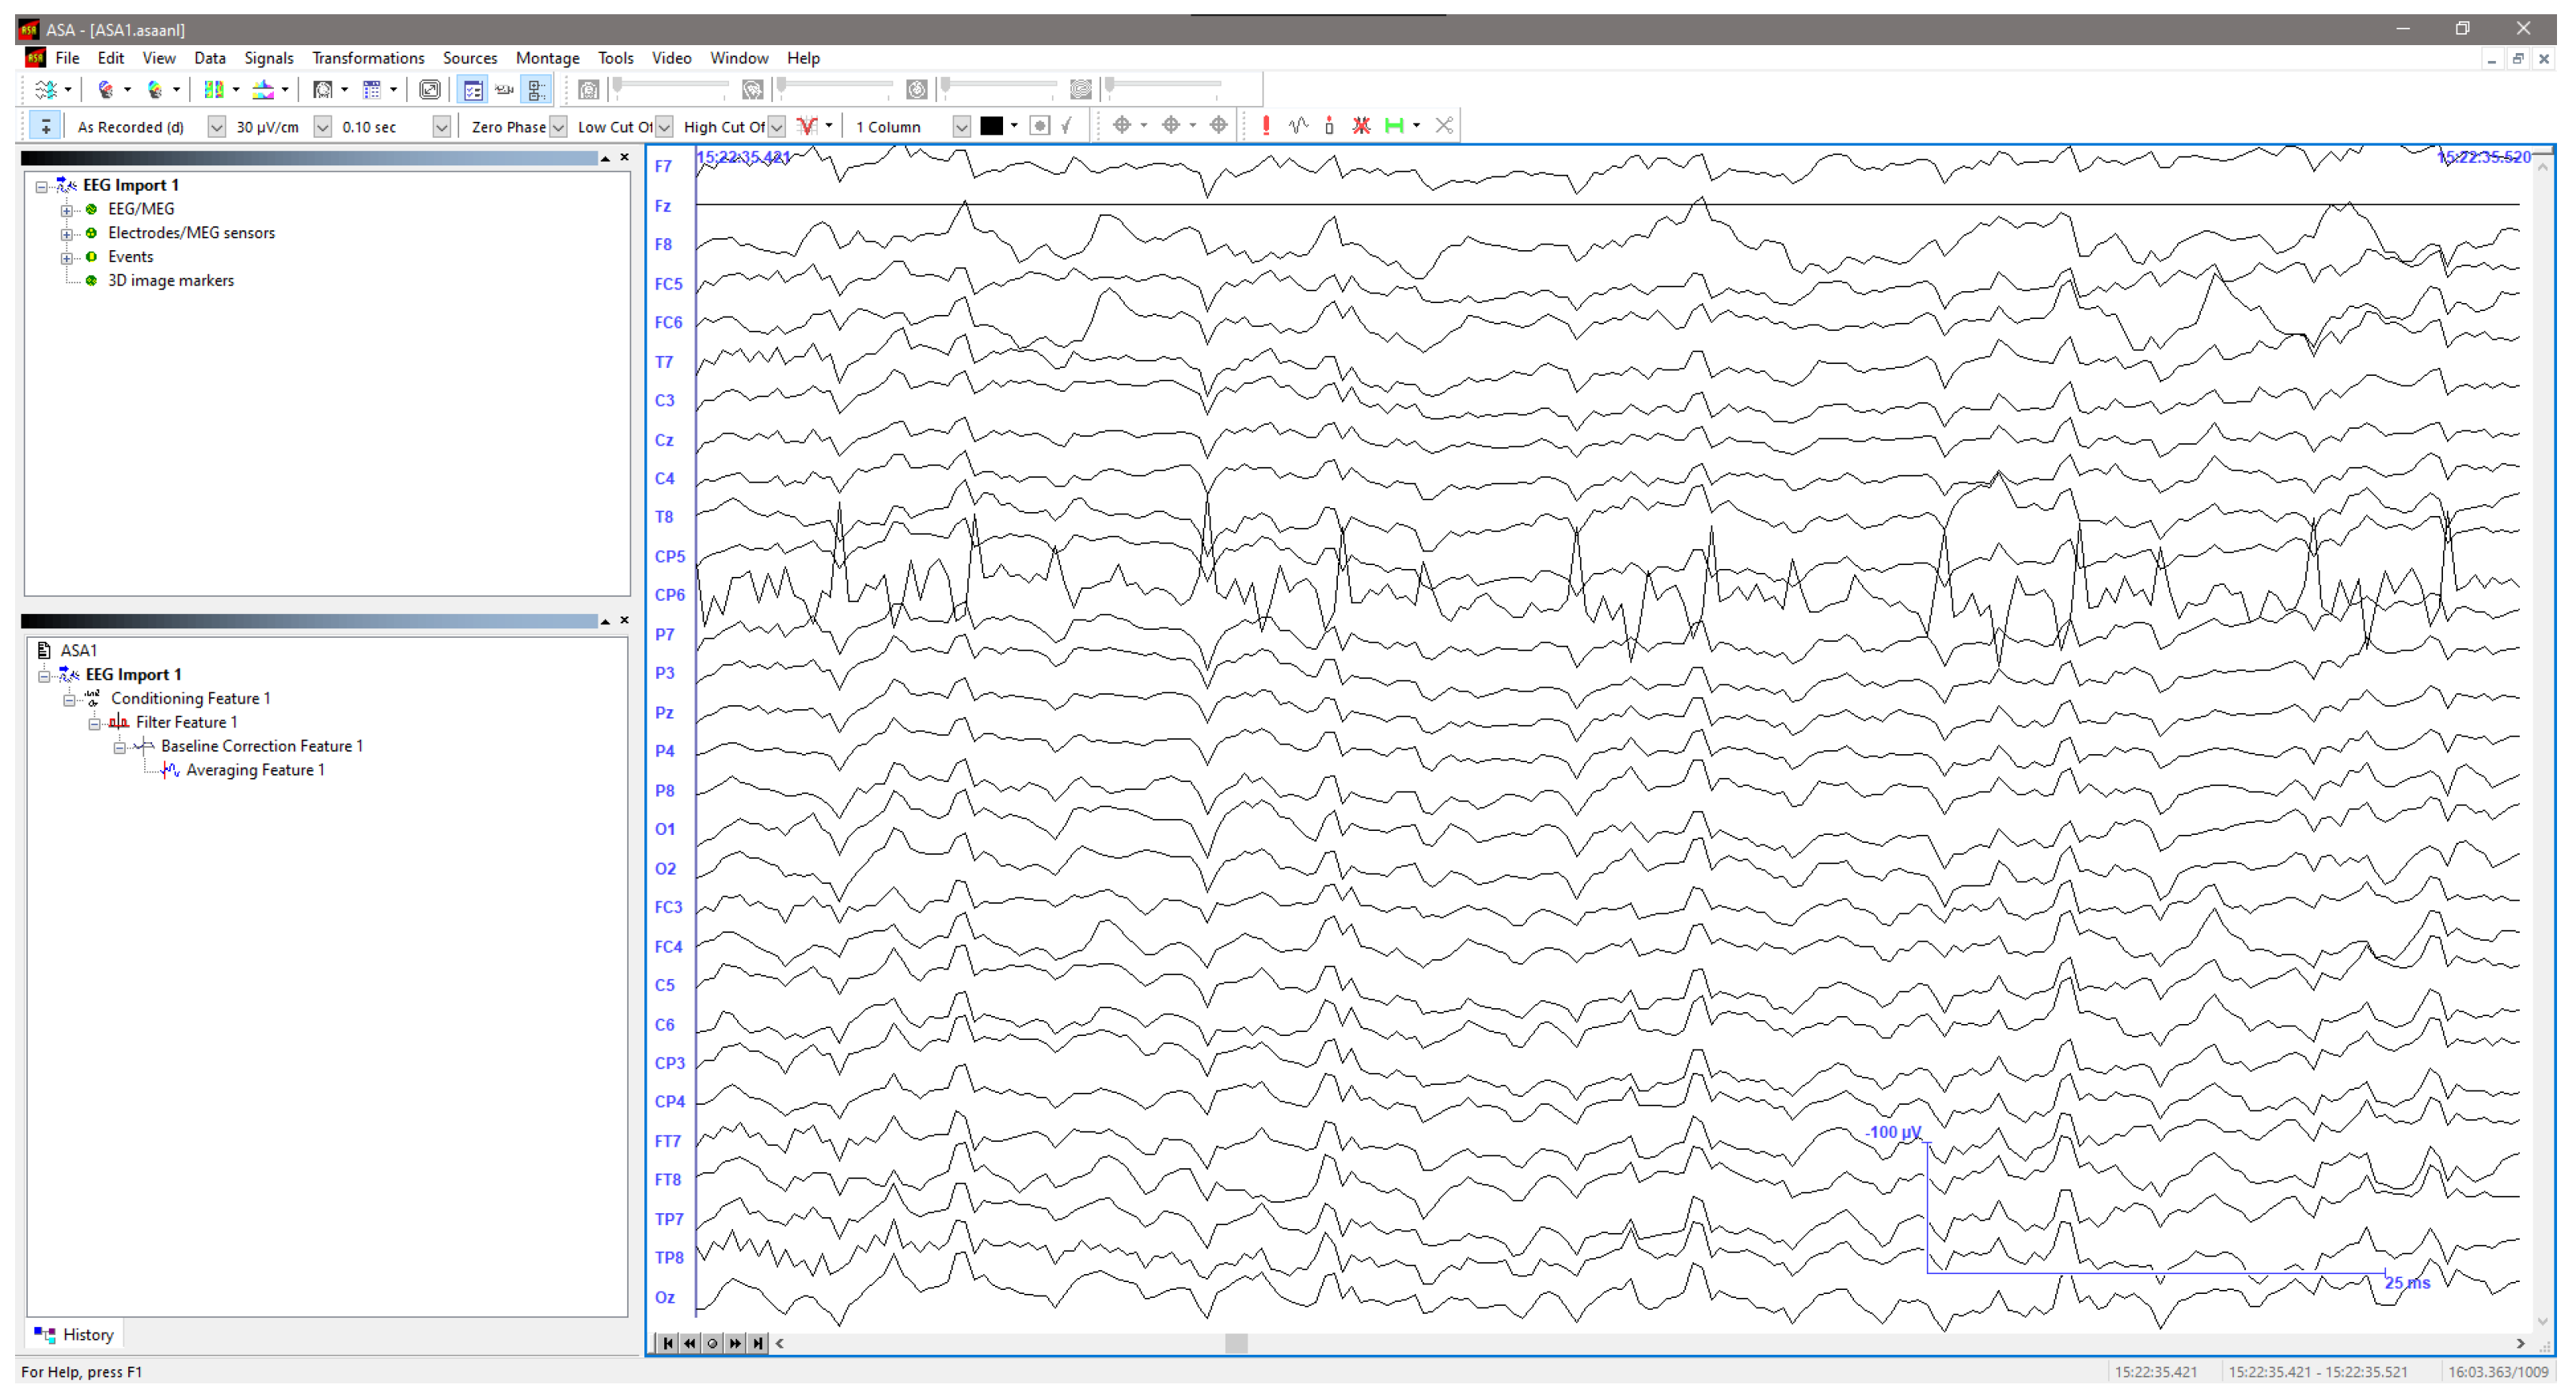
- Define the software variables for each specific acquisition, namely the subject’s data, the sampling rate (2048 Hz in our case), the setup, and the amplifier;
- Select the attributes for visualizing the signal. These include the number of observable channels, the visible time window, the scale, and the band-pass filter bandwidth, which are the same as the ones used for processing, as stated below.
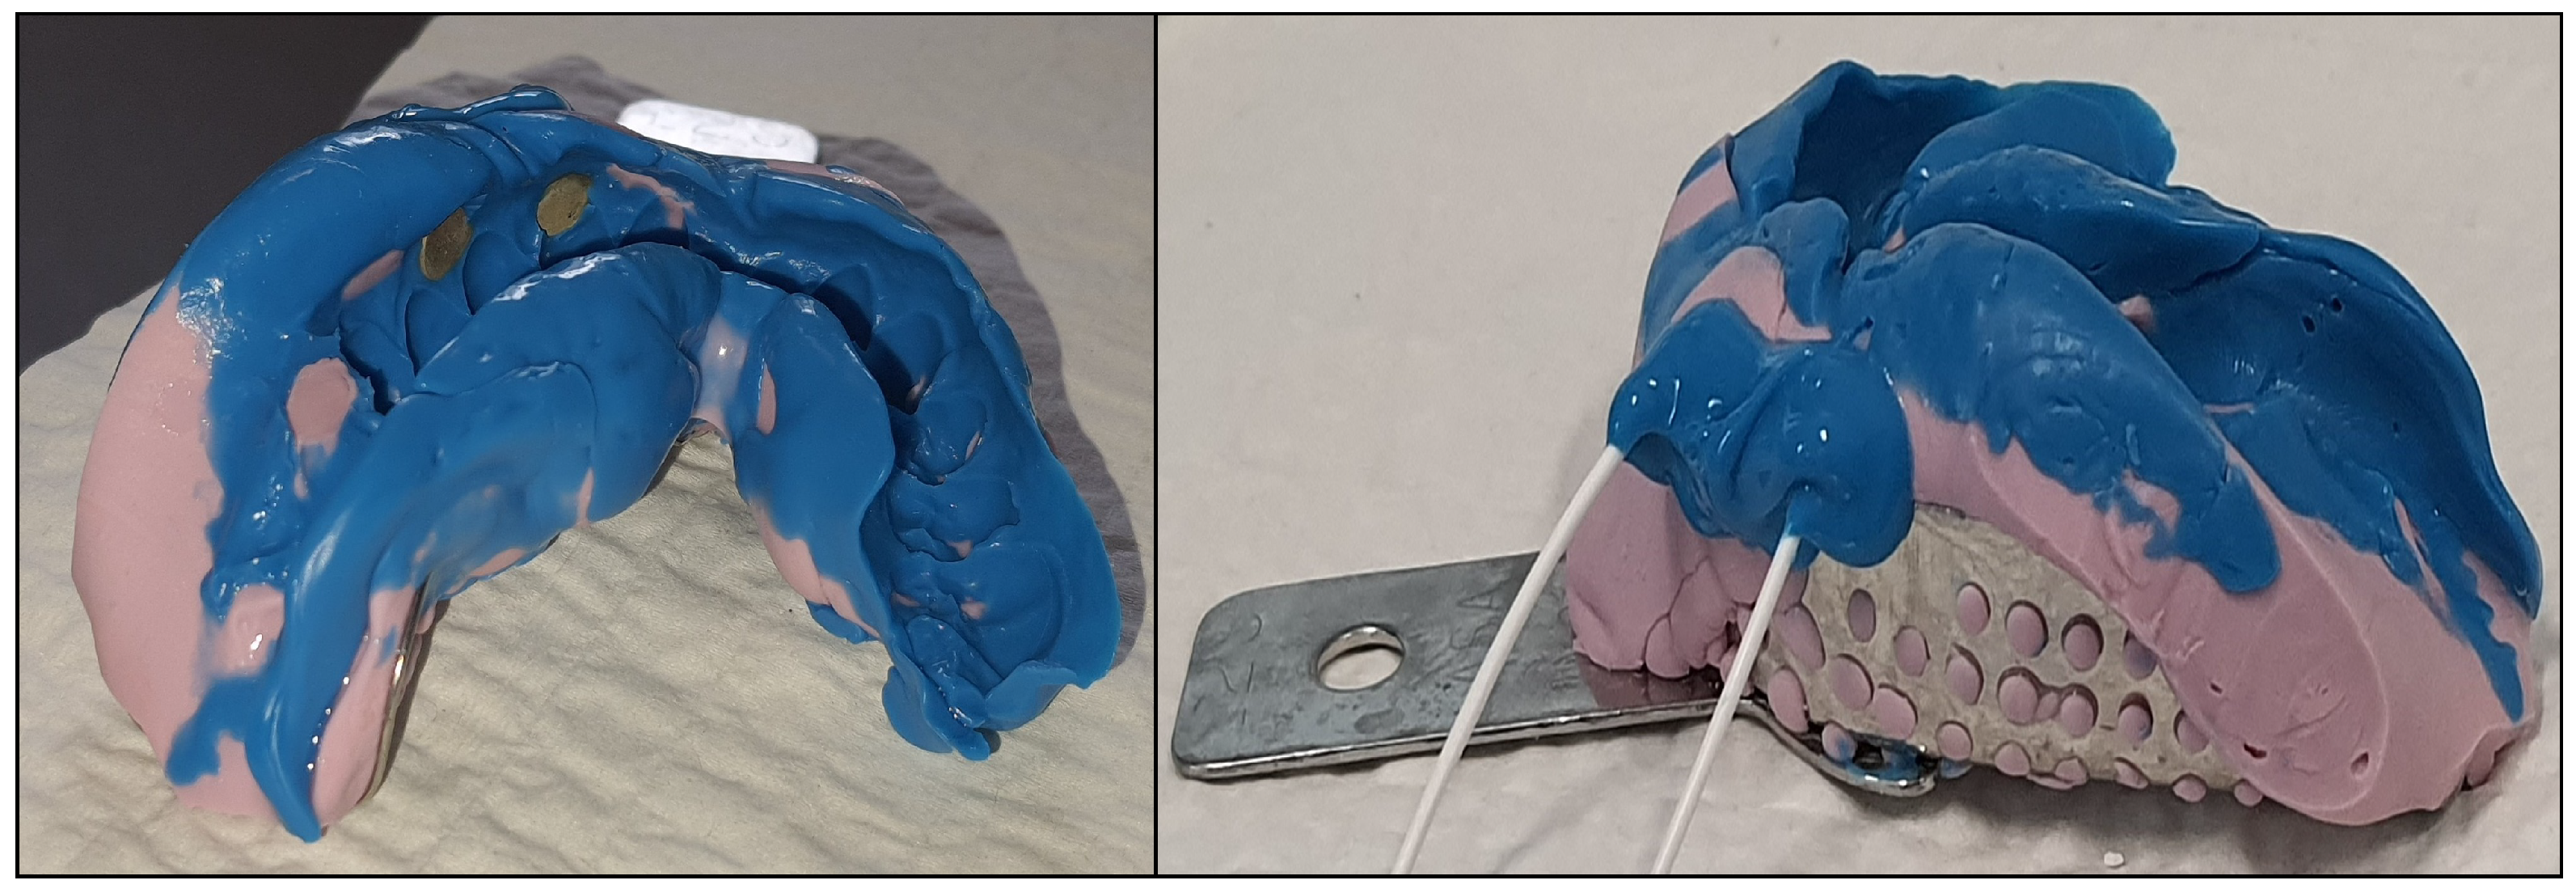
- Place the mold/electrodes in the orofacial area;
- Acquire the EEG signals as the stimulus is applied.
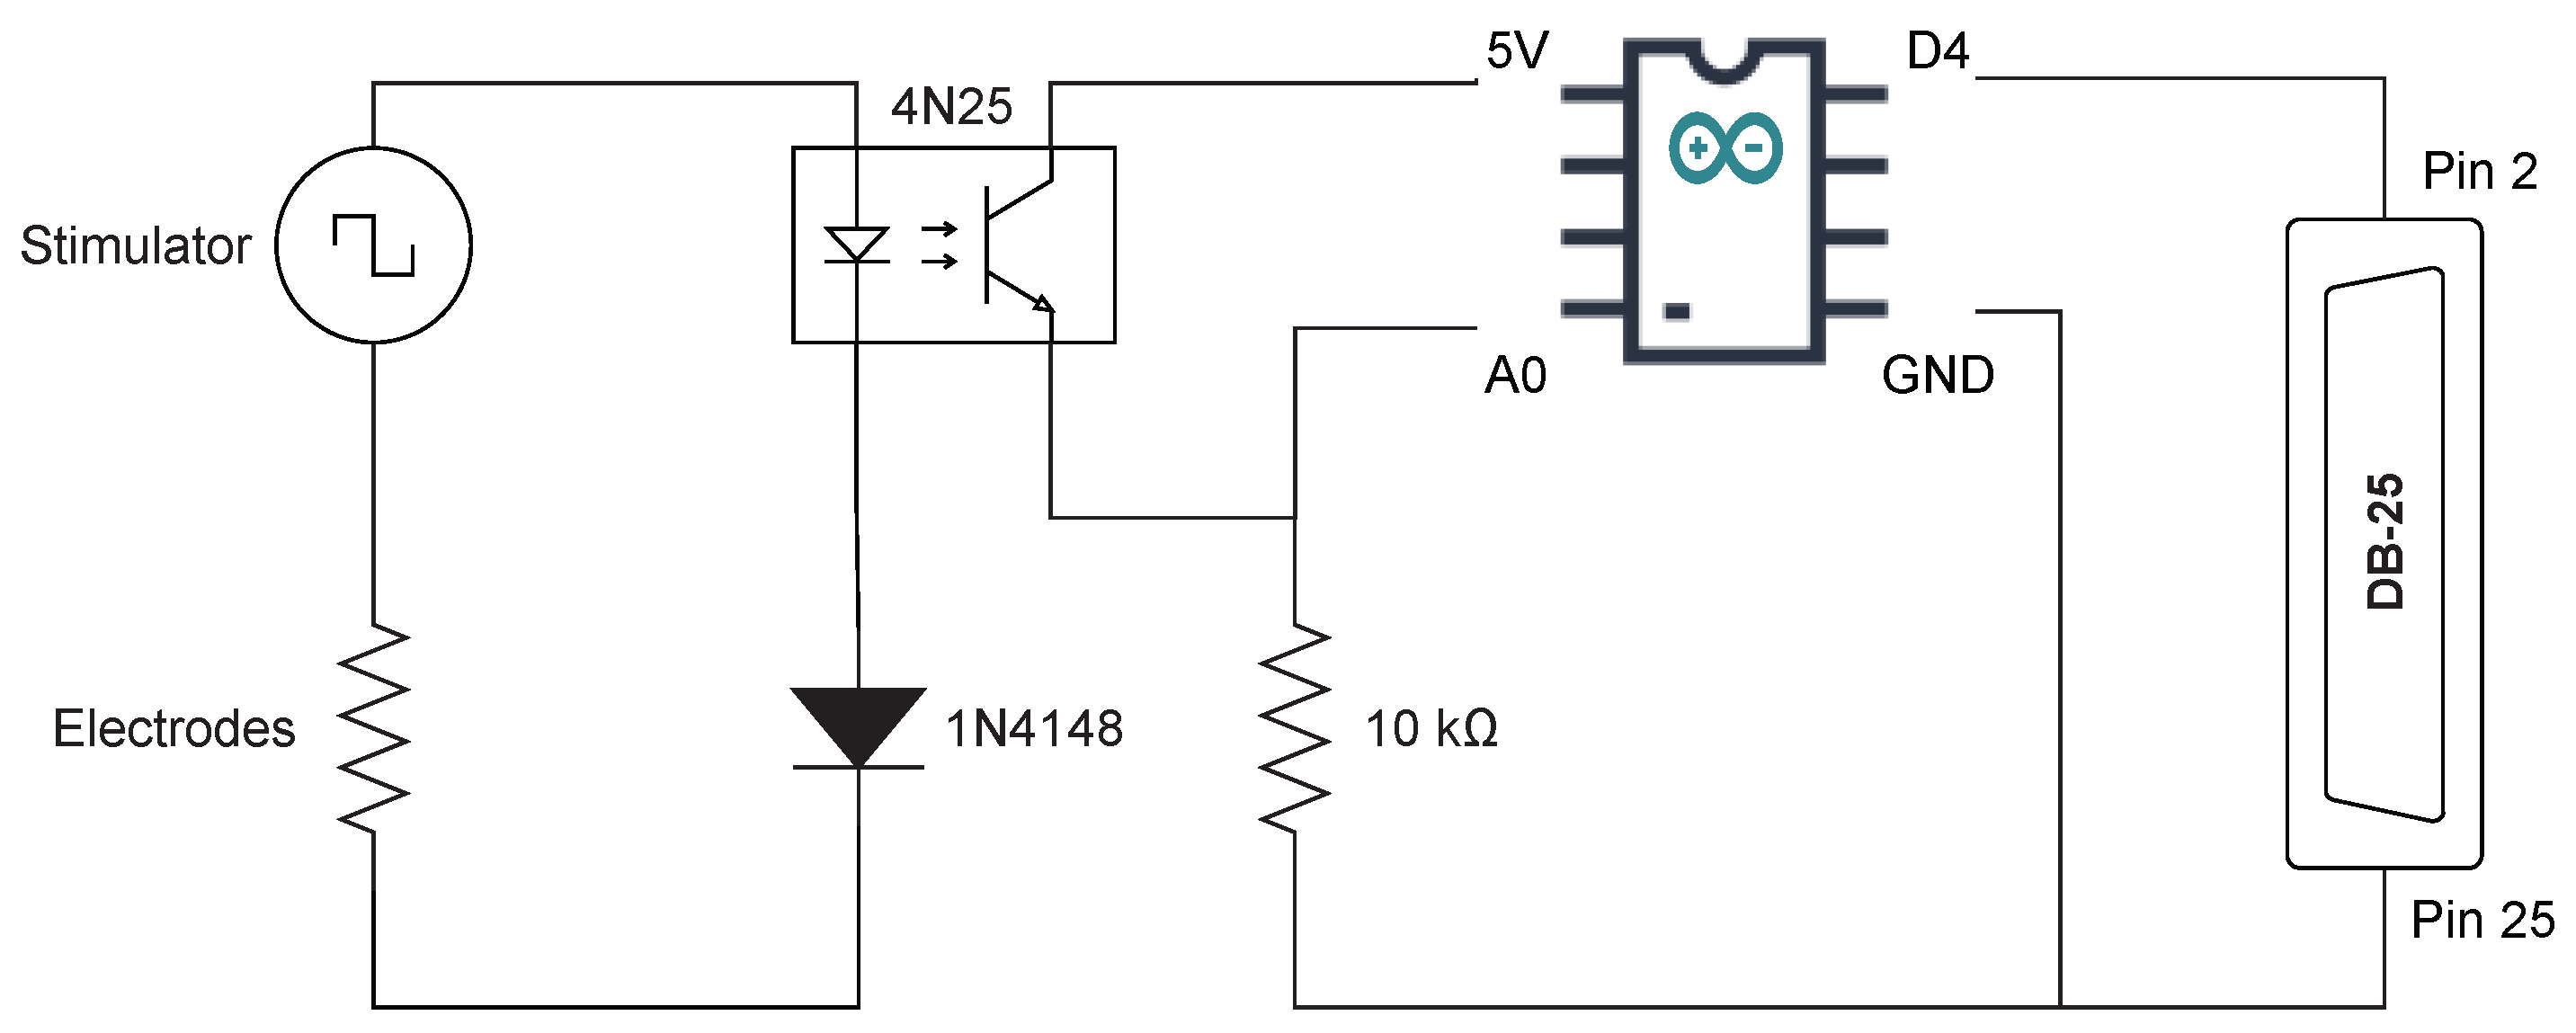
2.2. Occluded Trigeminal Somatosensory-Evoked Potentials
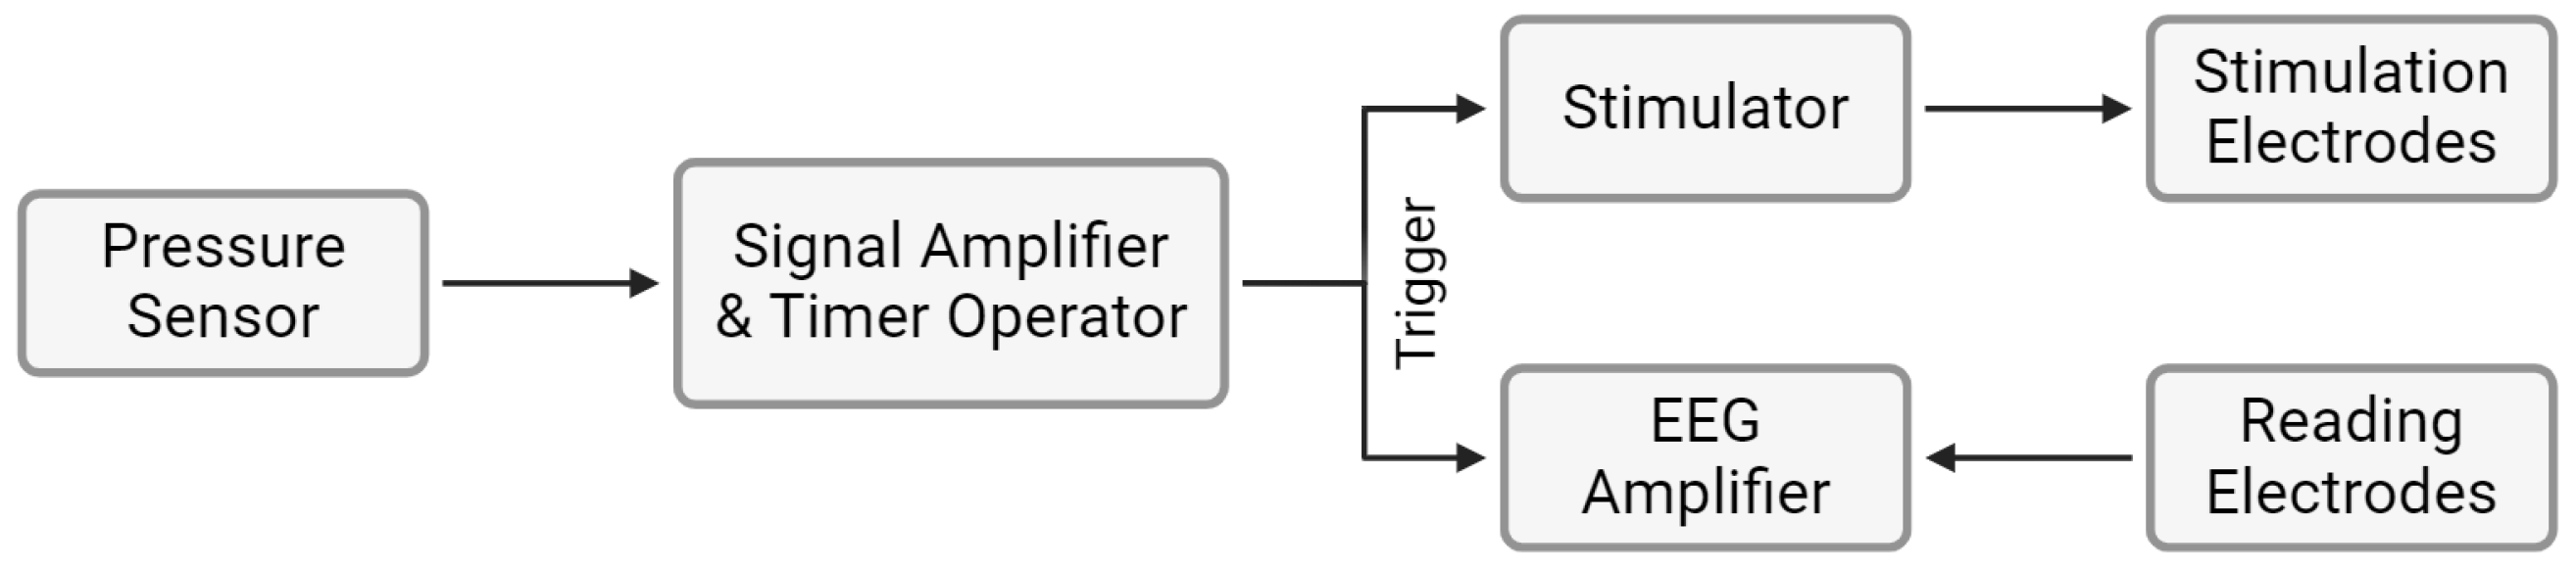
- 1.
- Signal shaping by the sensor;
- 2.
- Signal amplification;
- 3.
- Timer operation, converting the signal into pulses at the designated frequency;
- 4.
- Signal triggering the stimulator and the amplifier.
3. Results
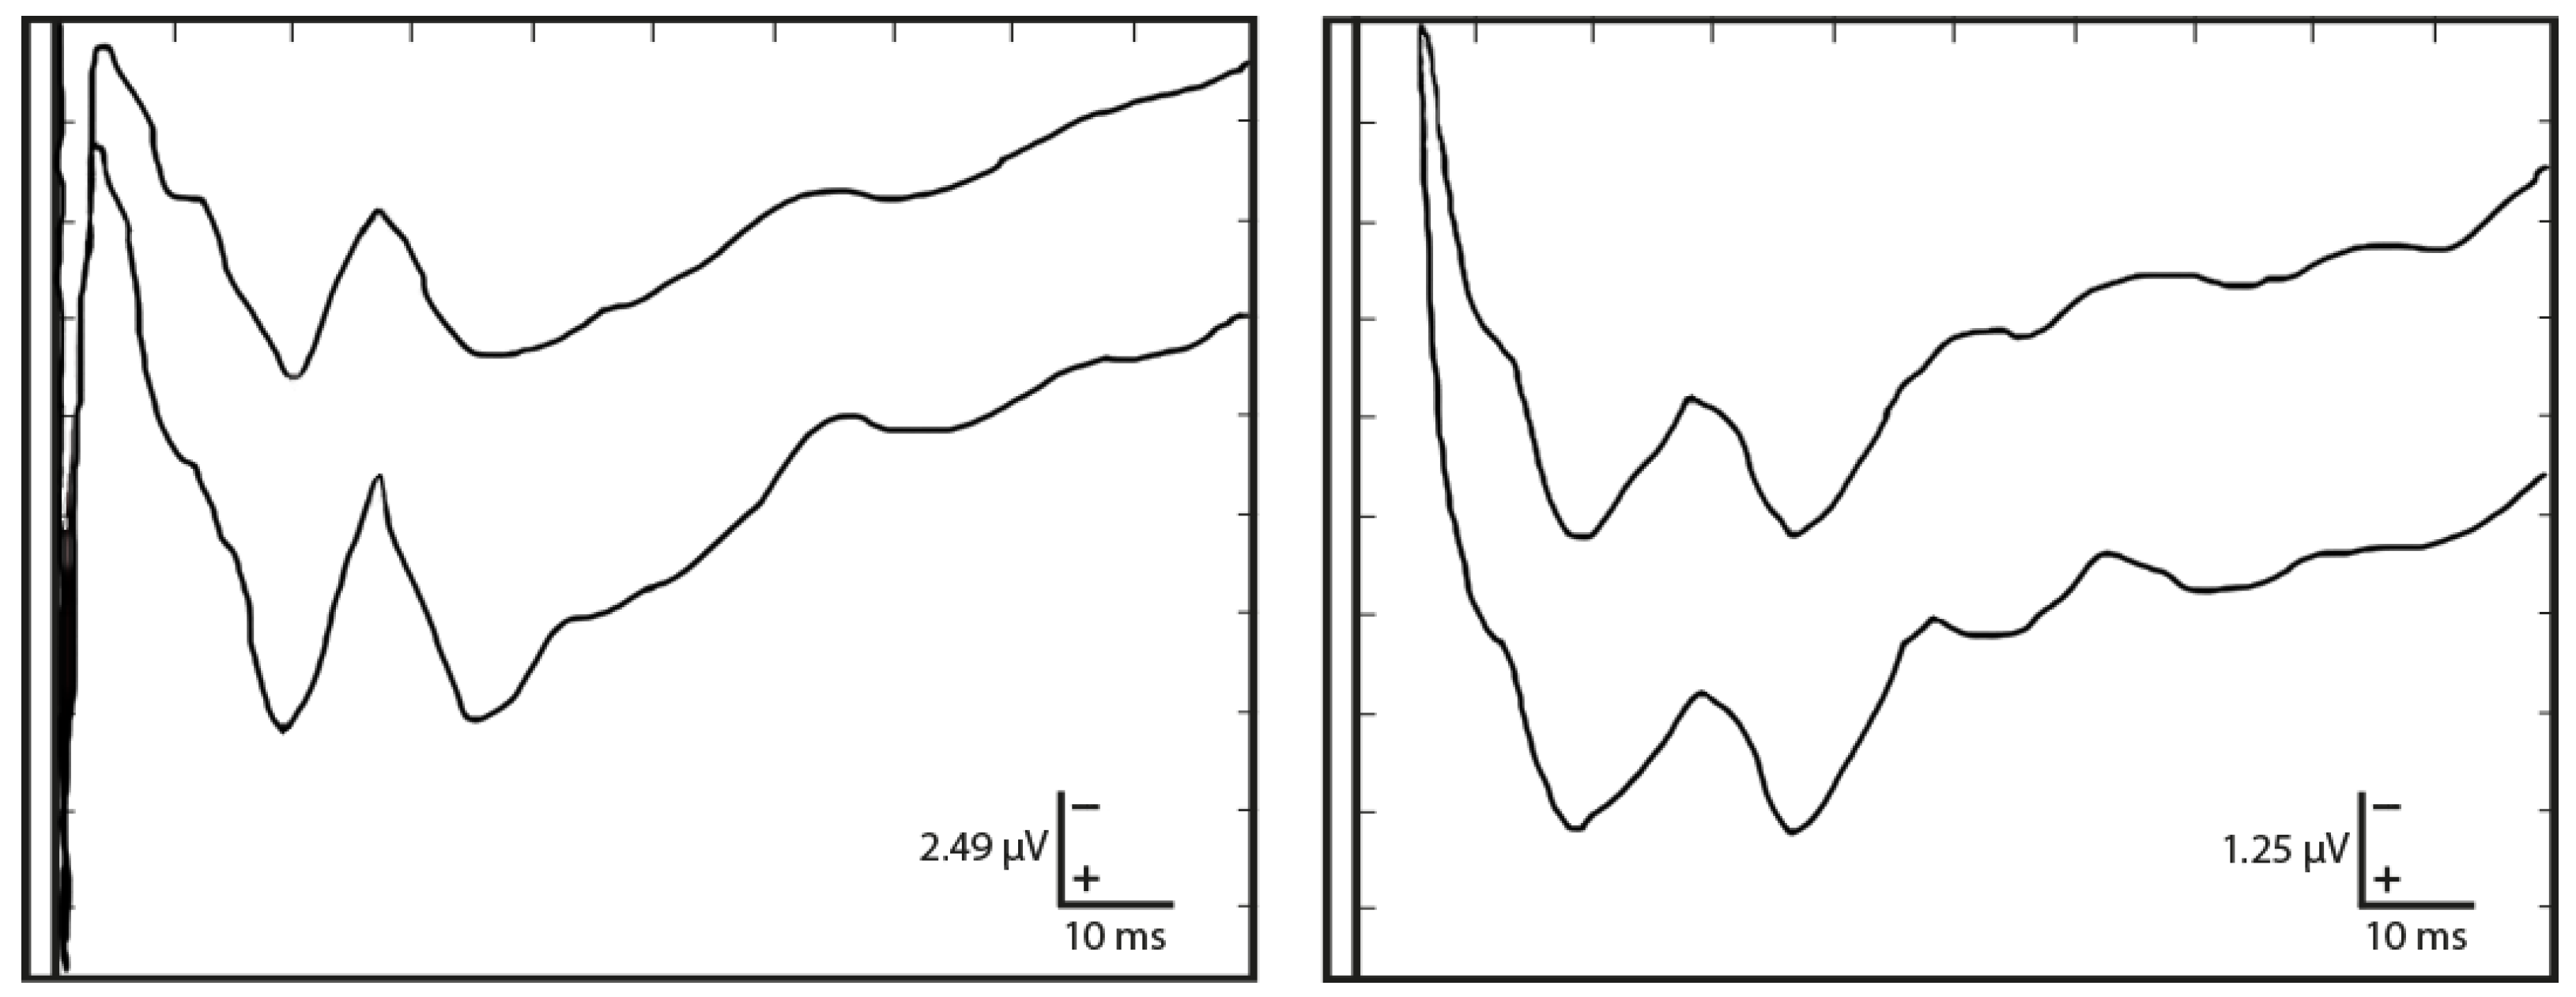
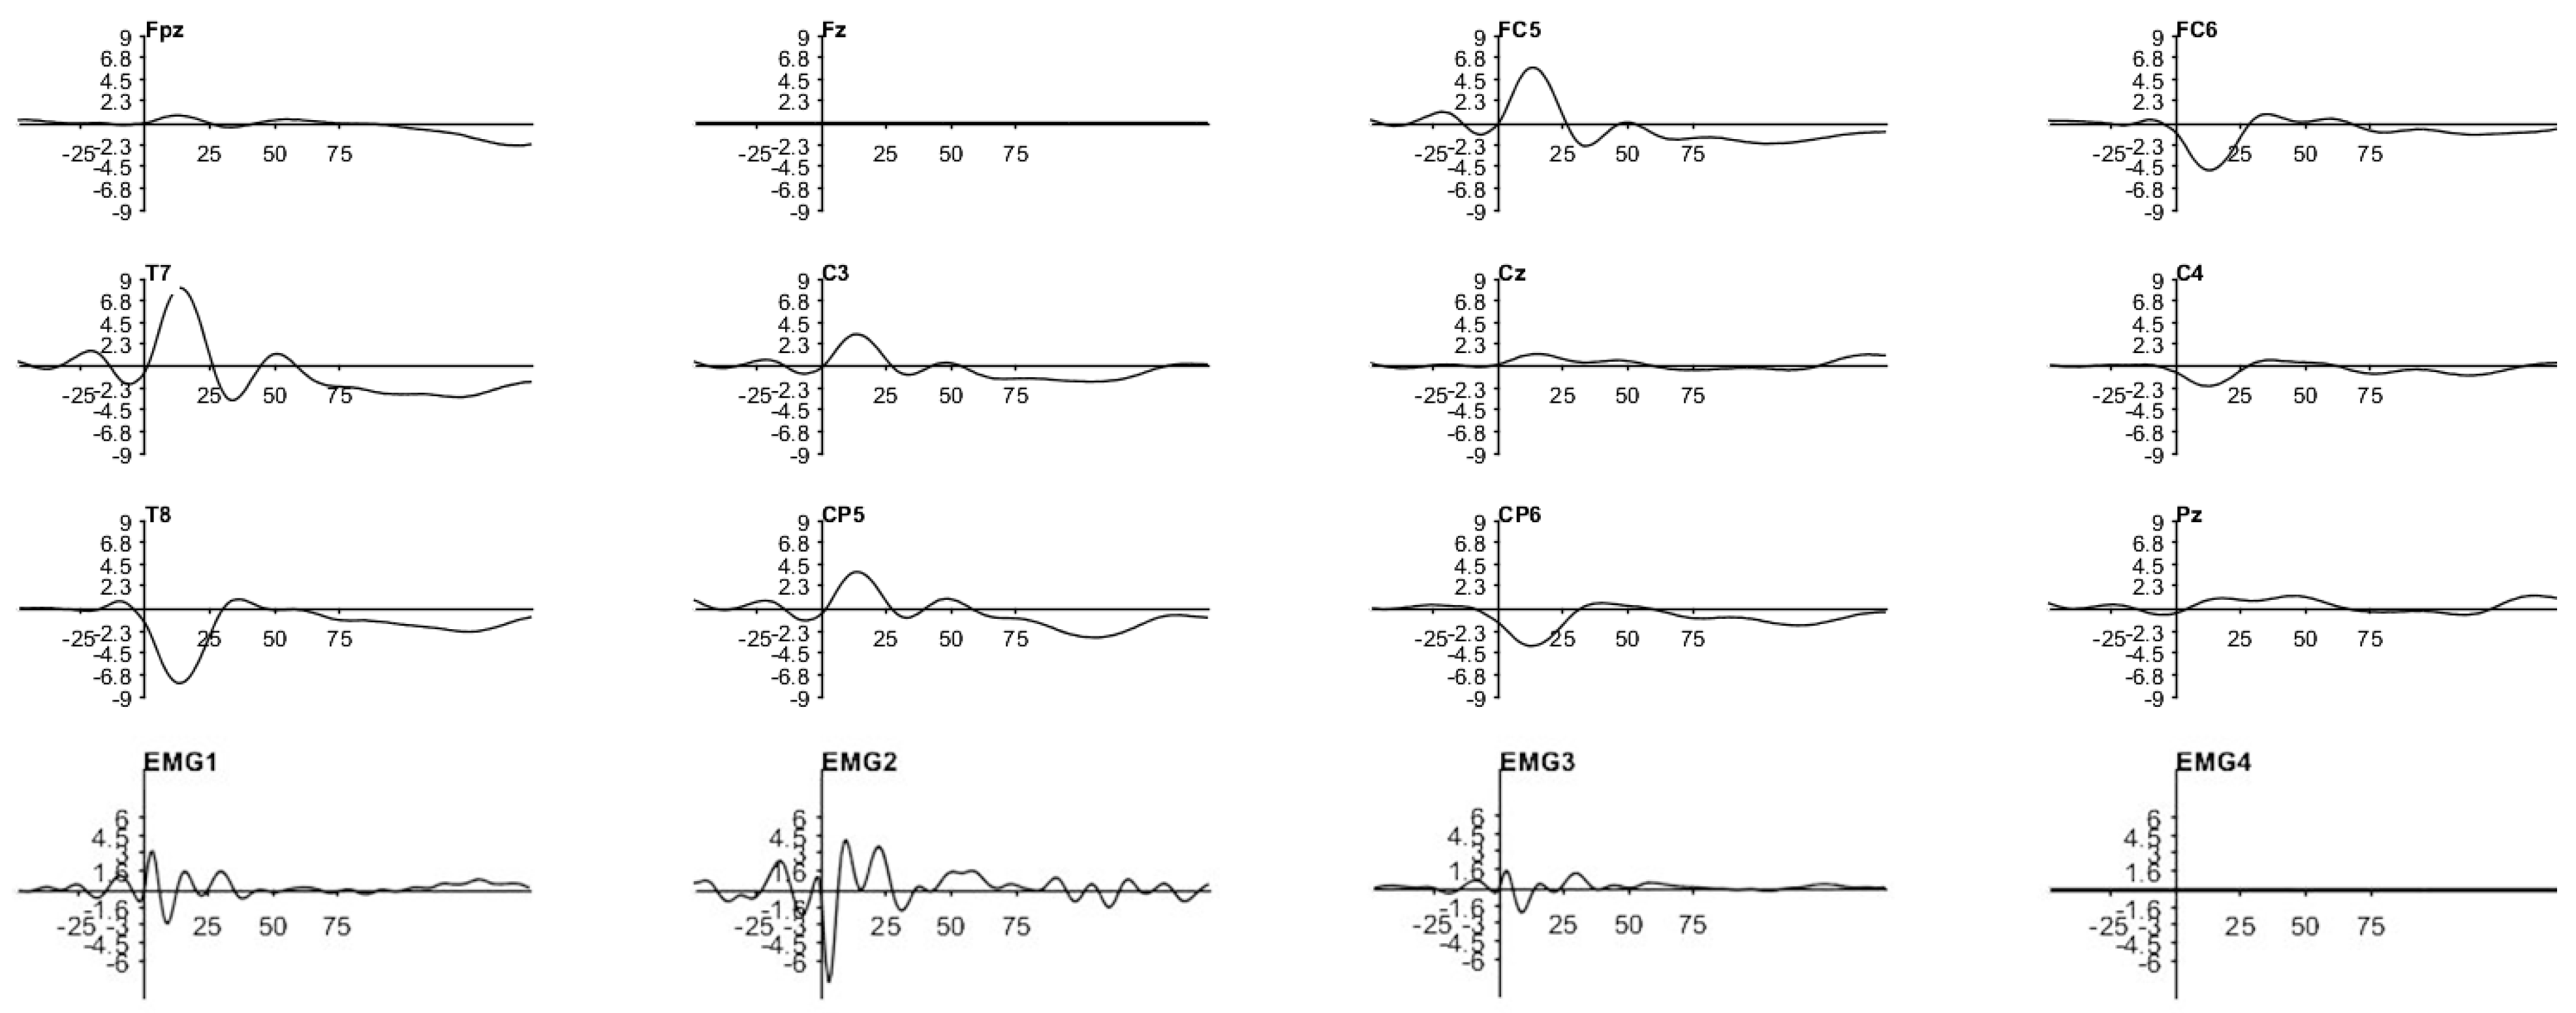
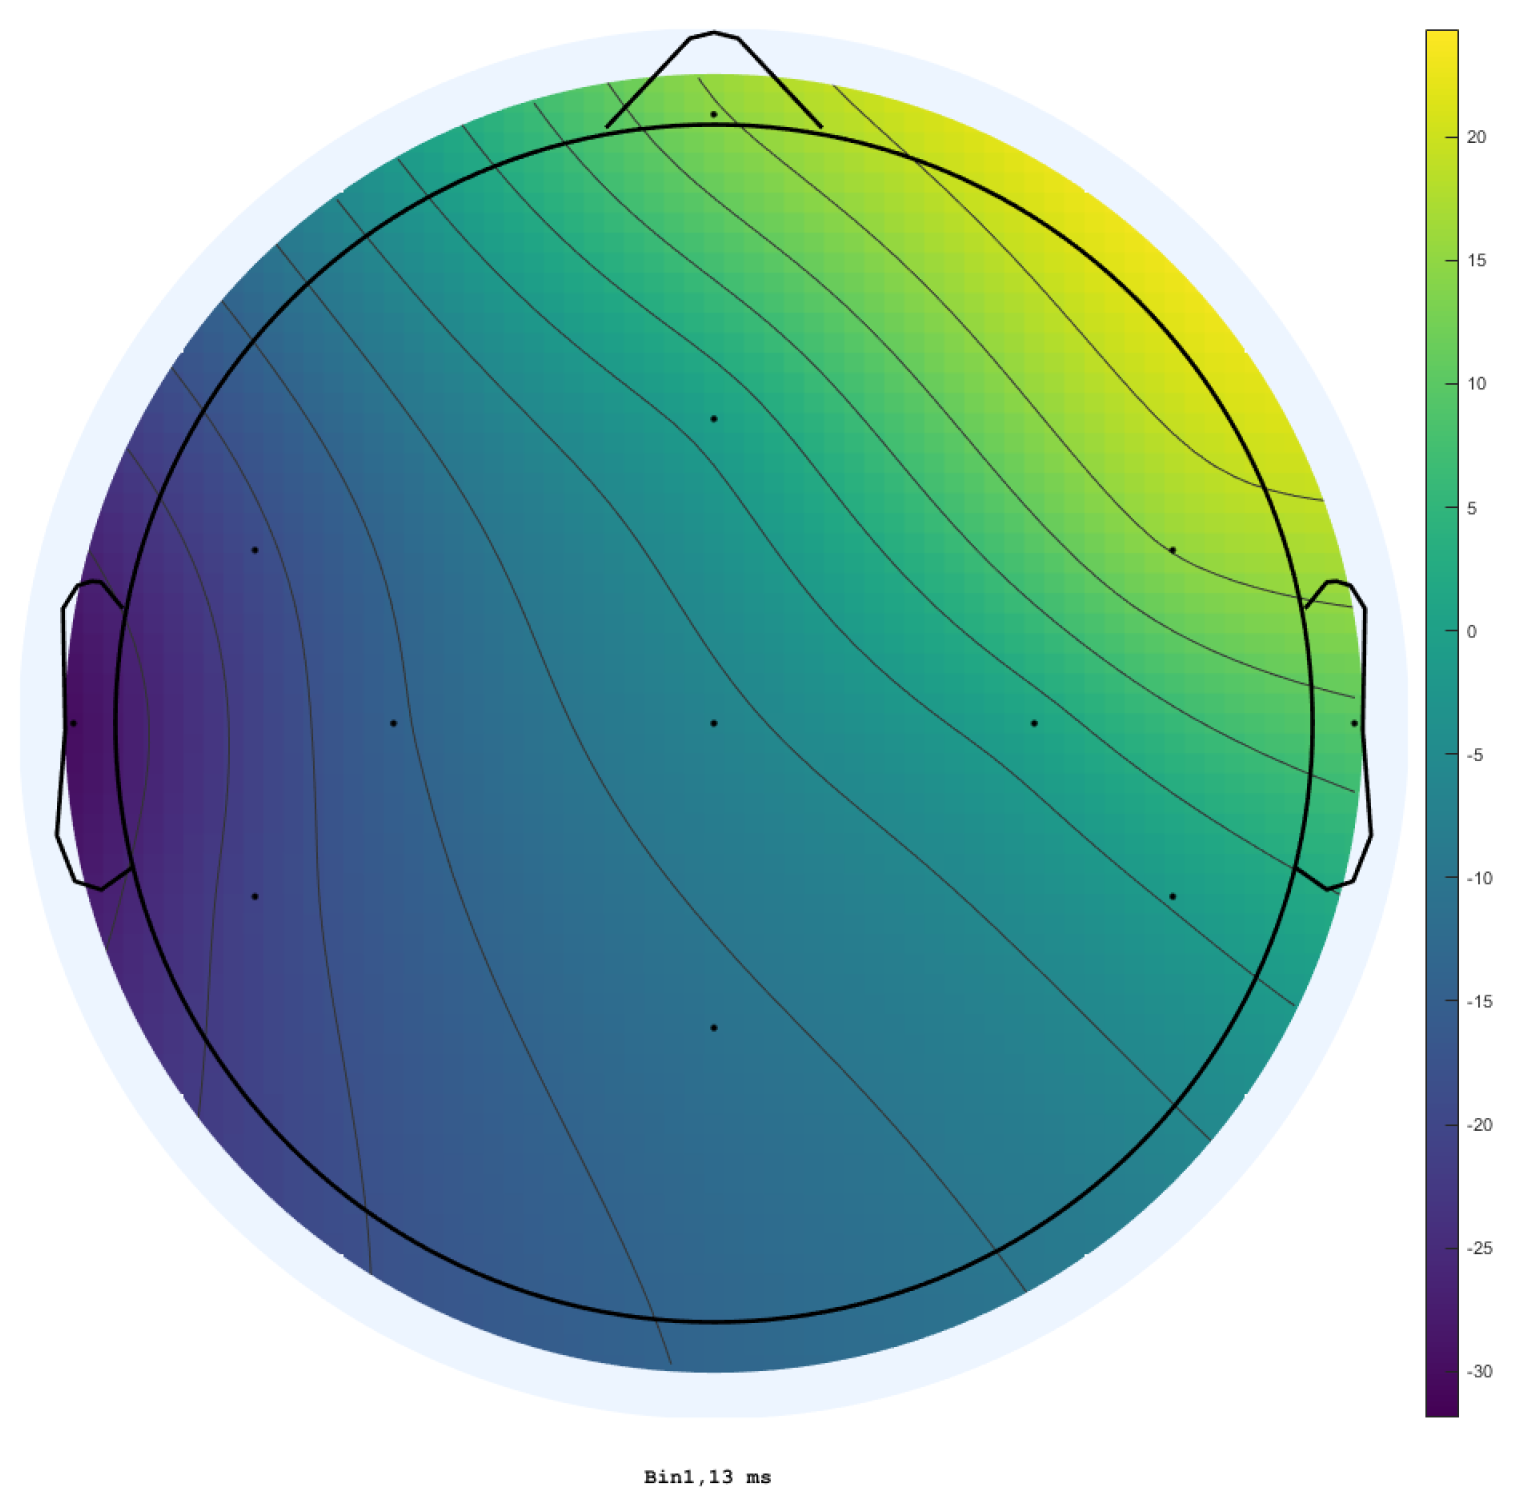
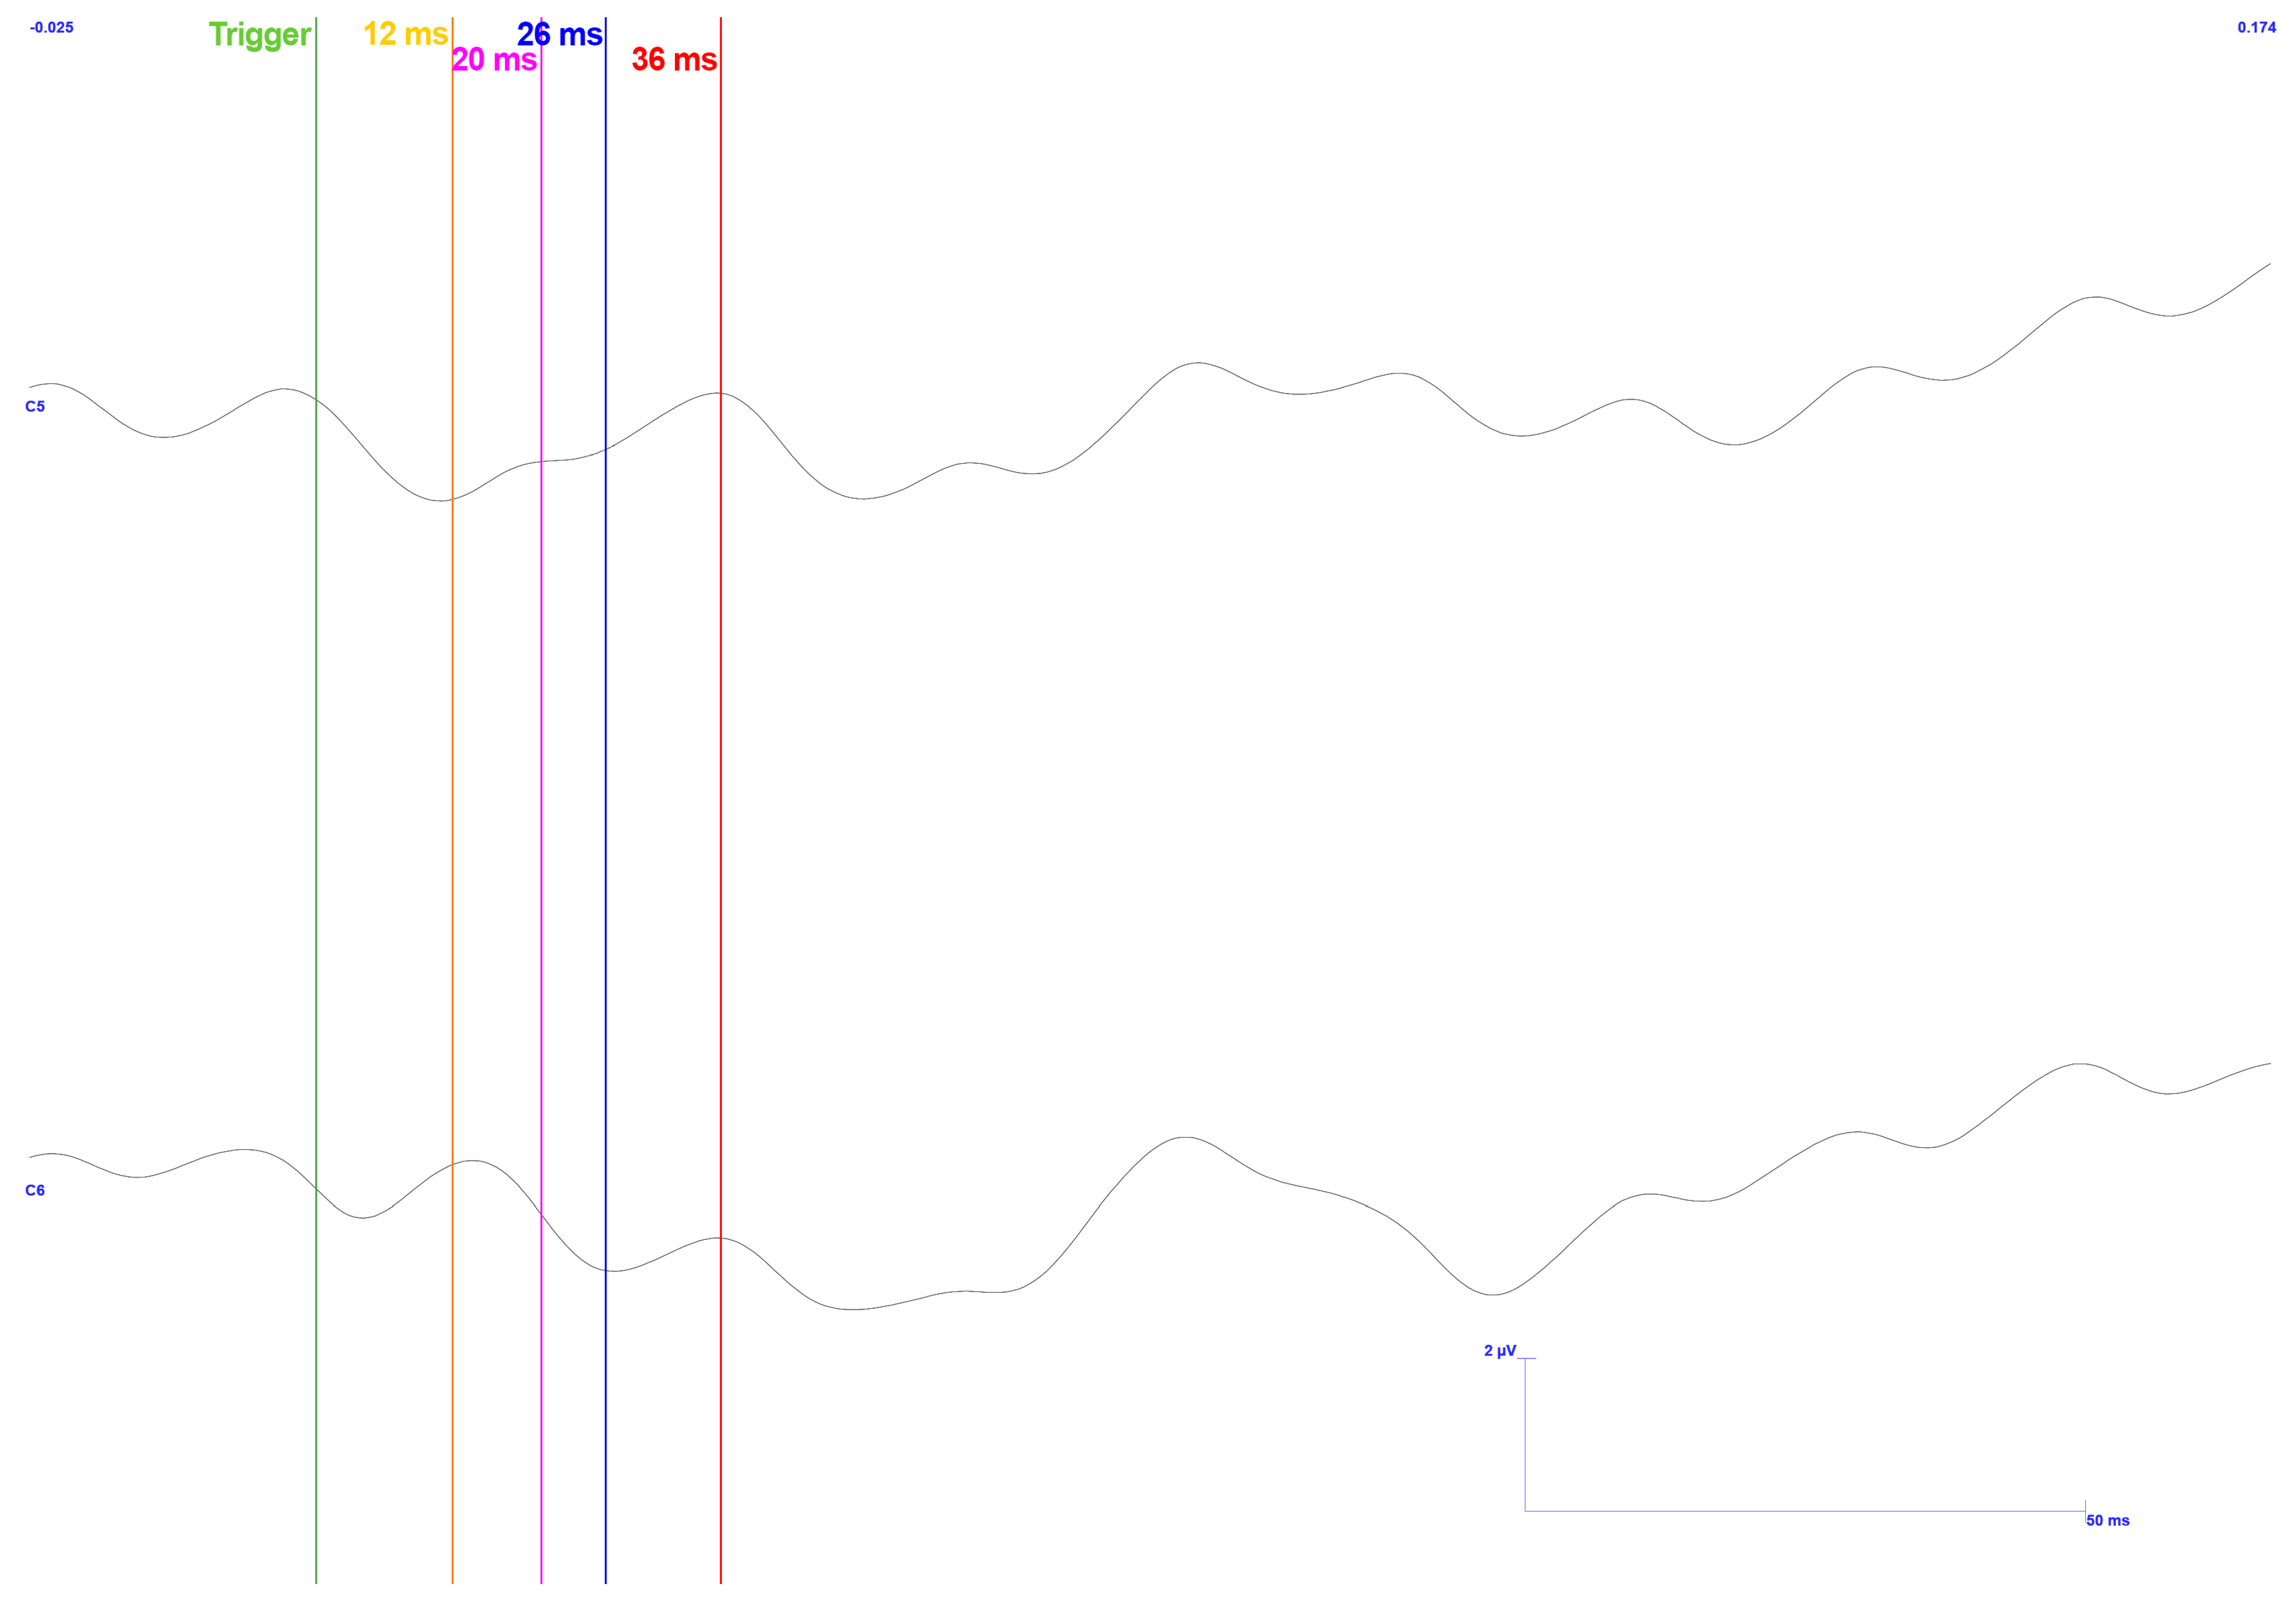
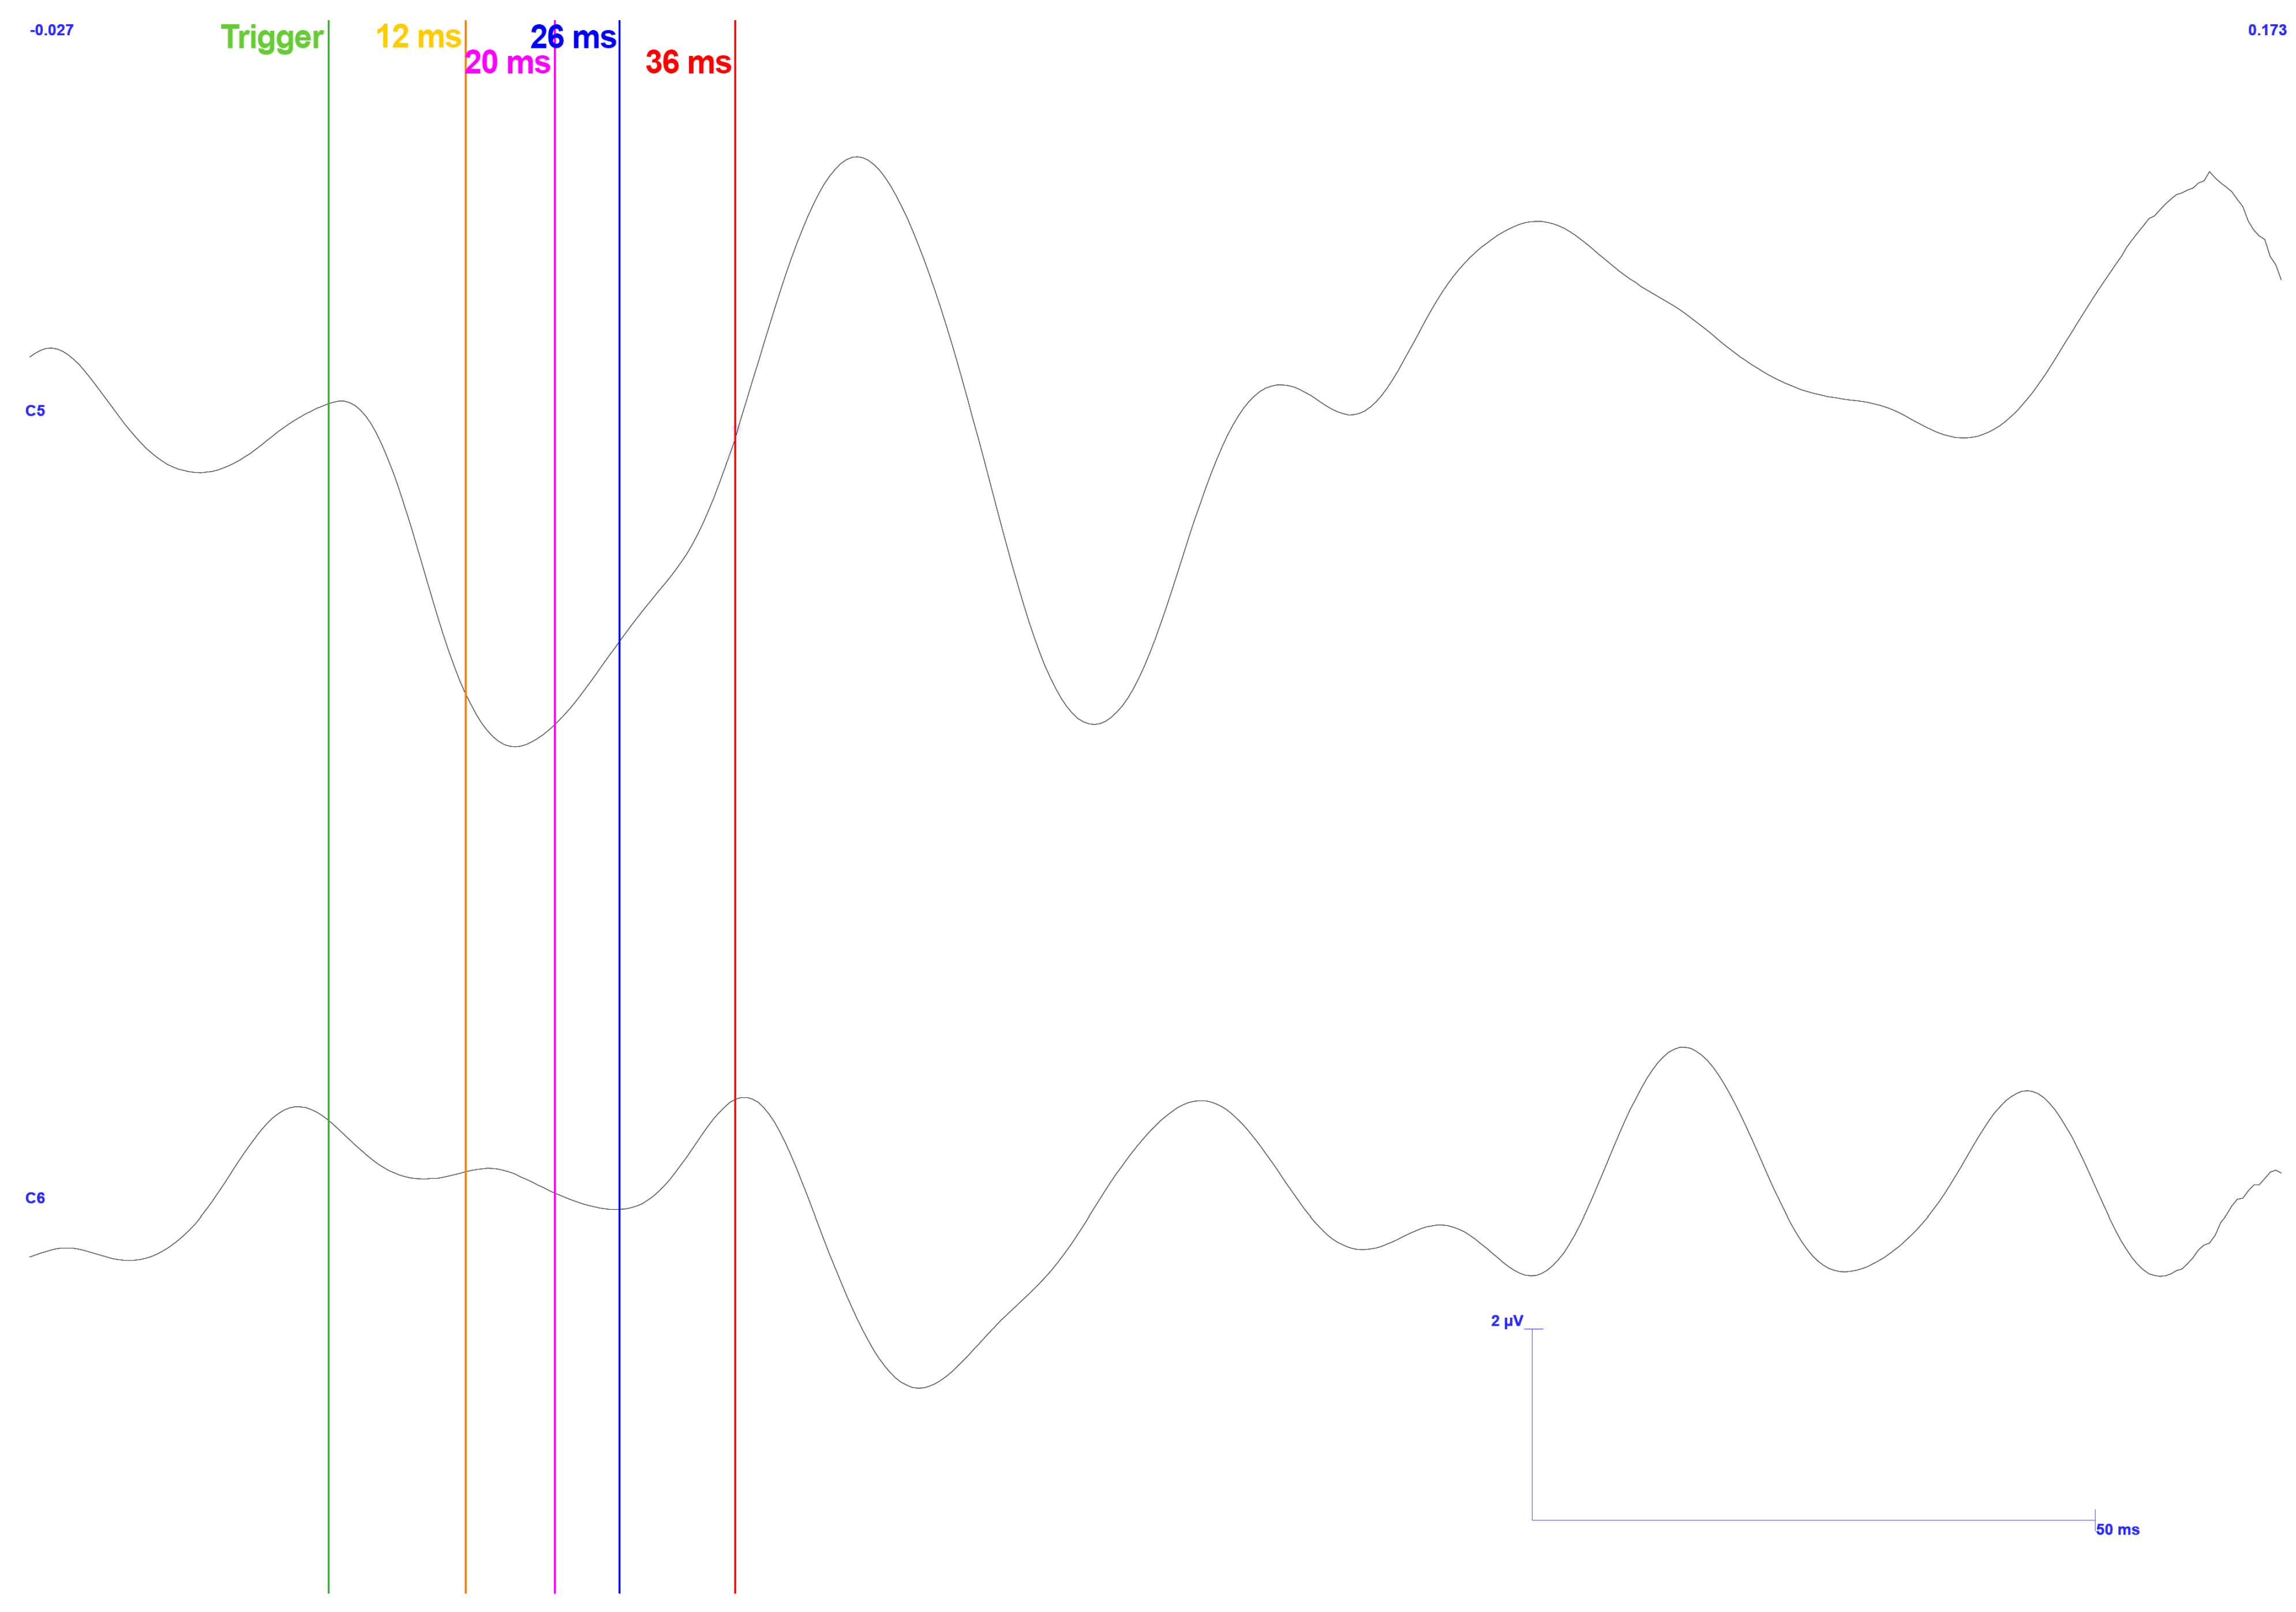
3.1. Traditional Trigeminal Somatosensory-Evoked Potentials
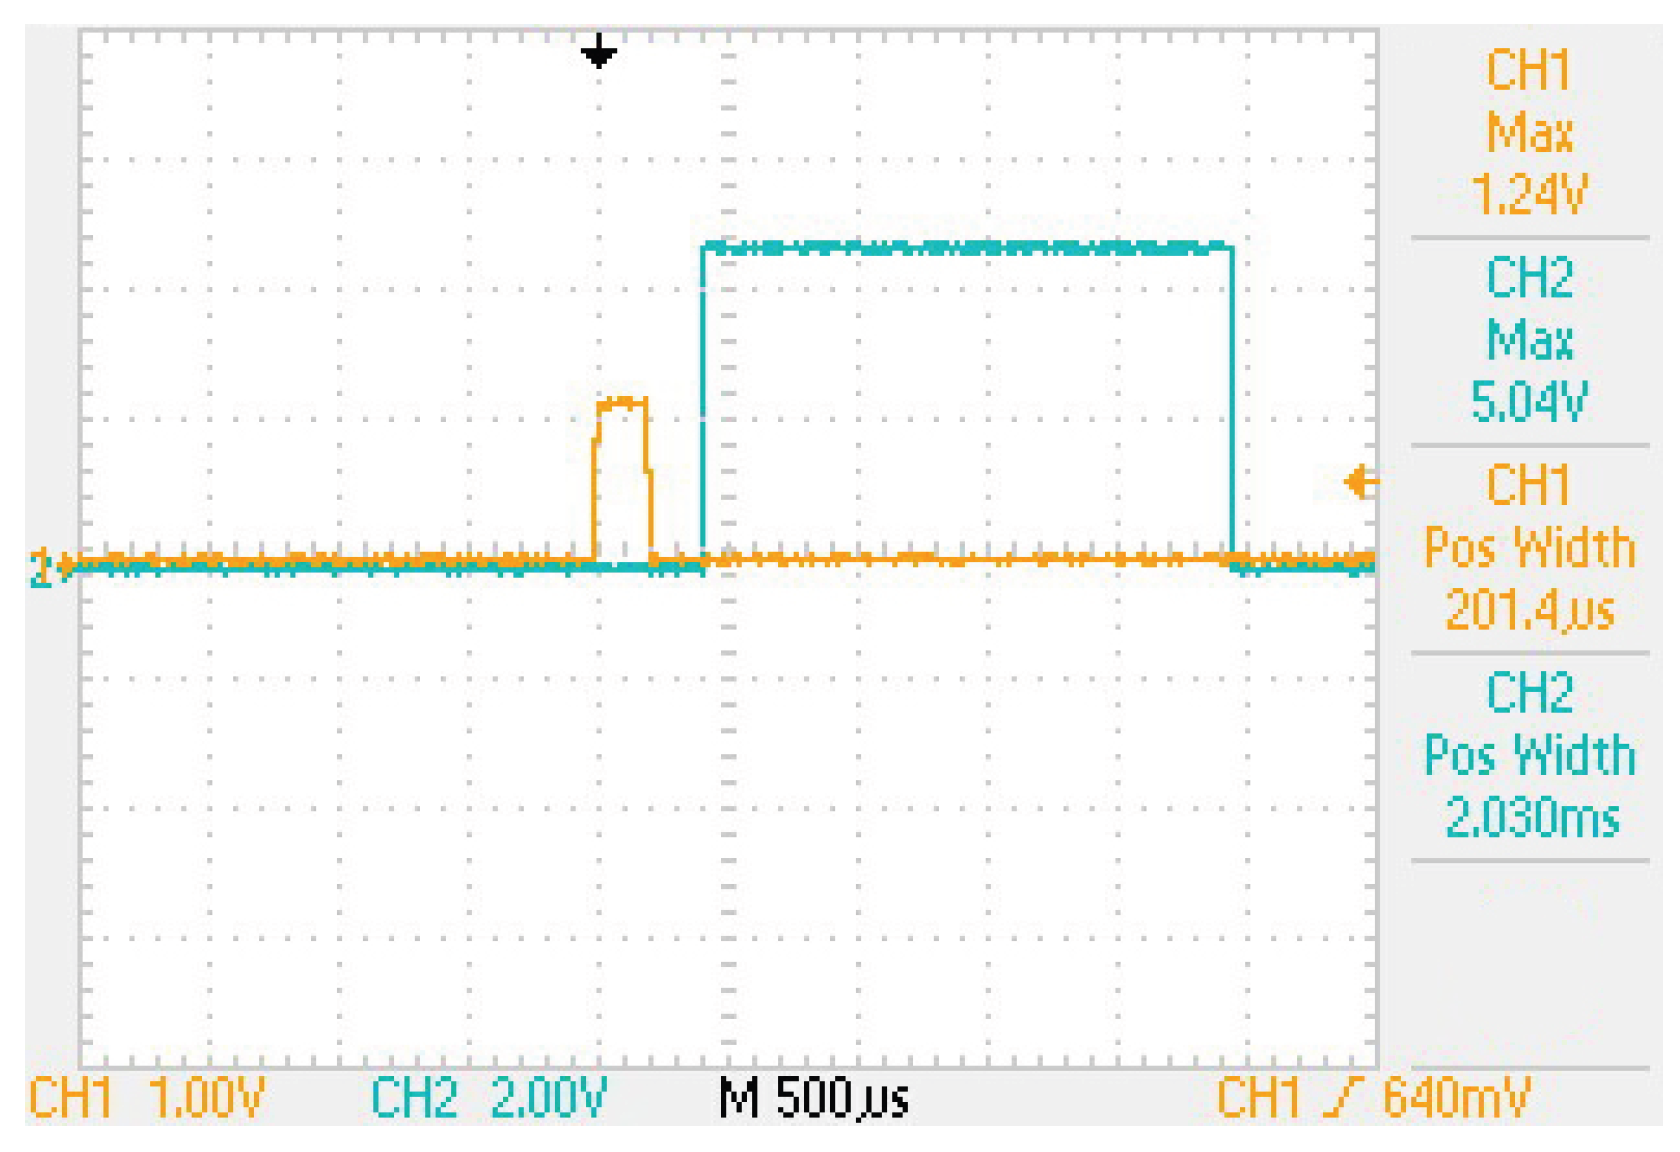
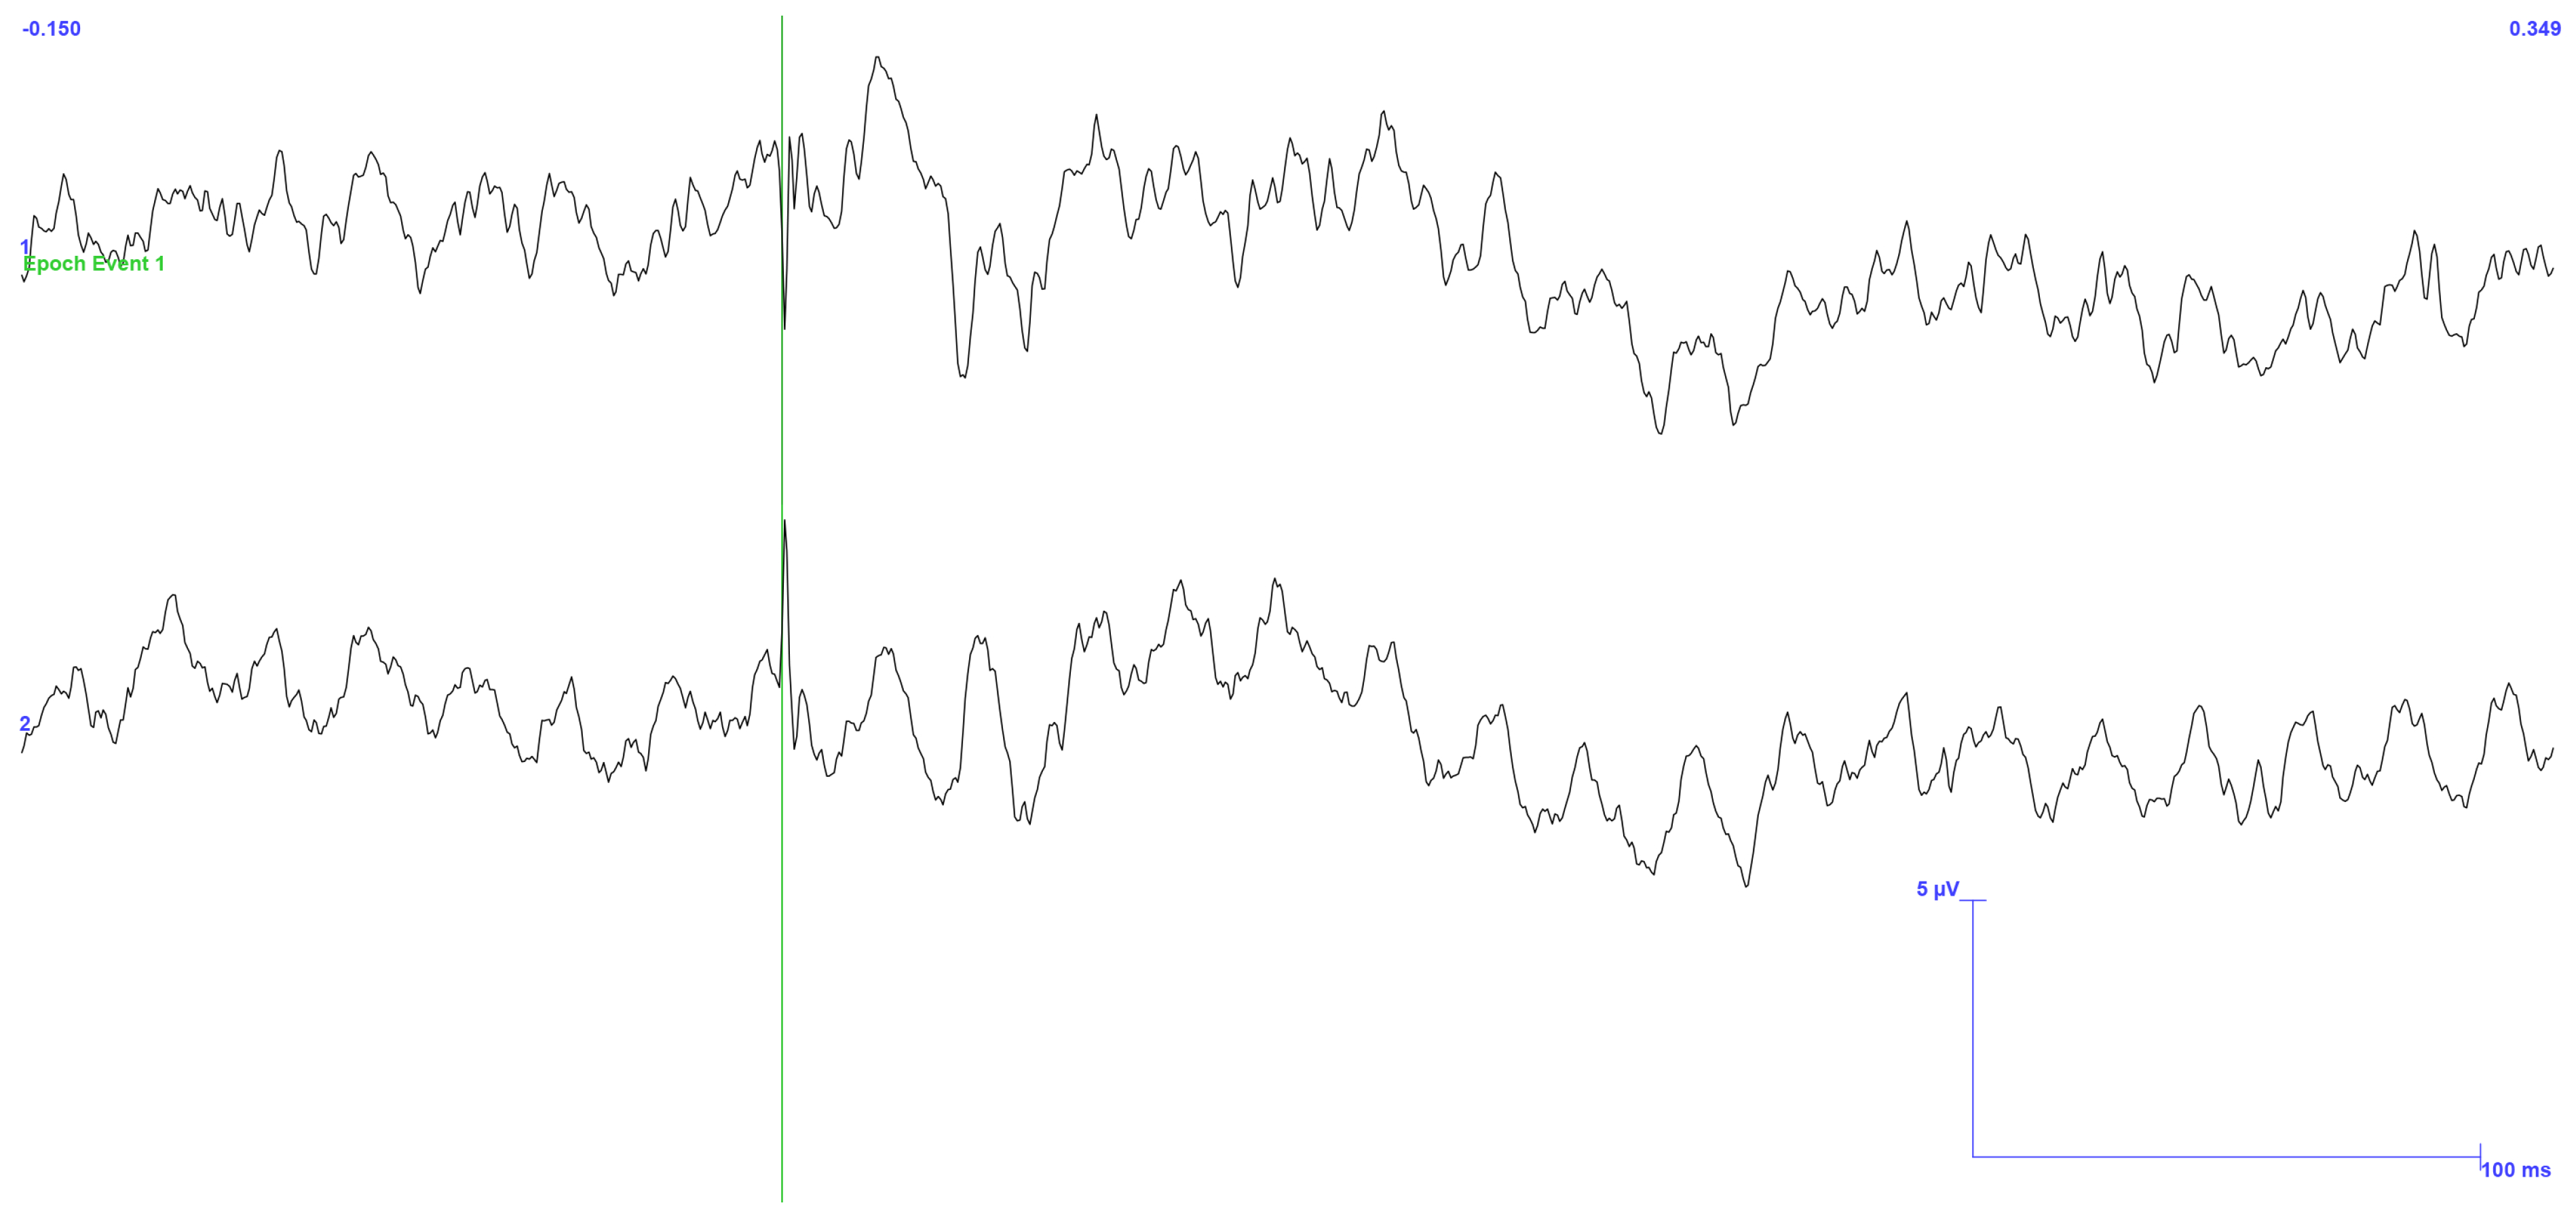
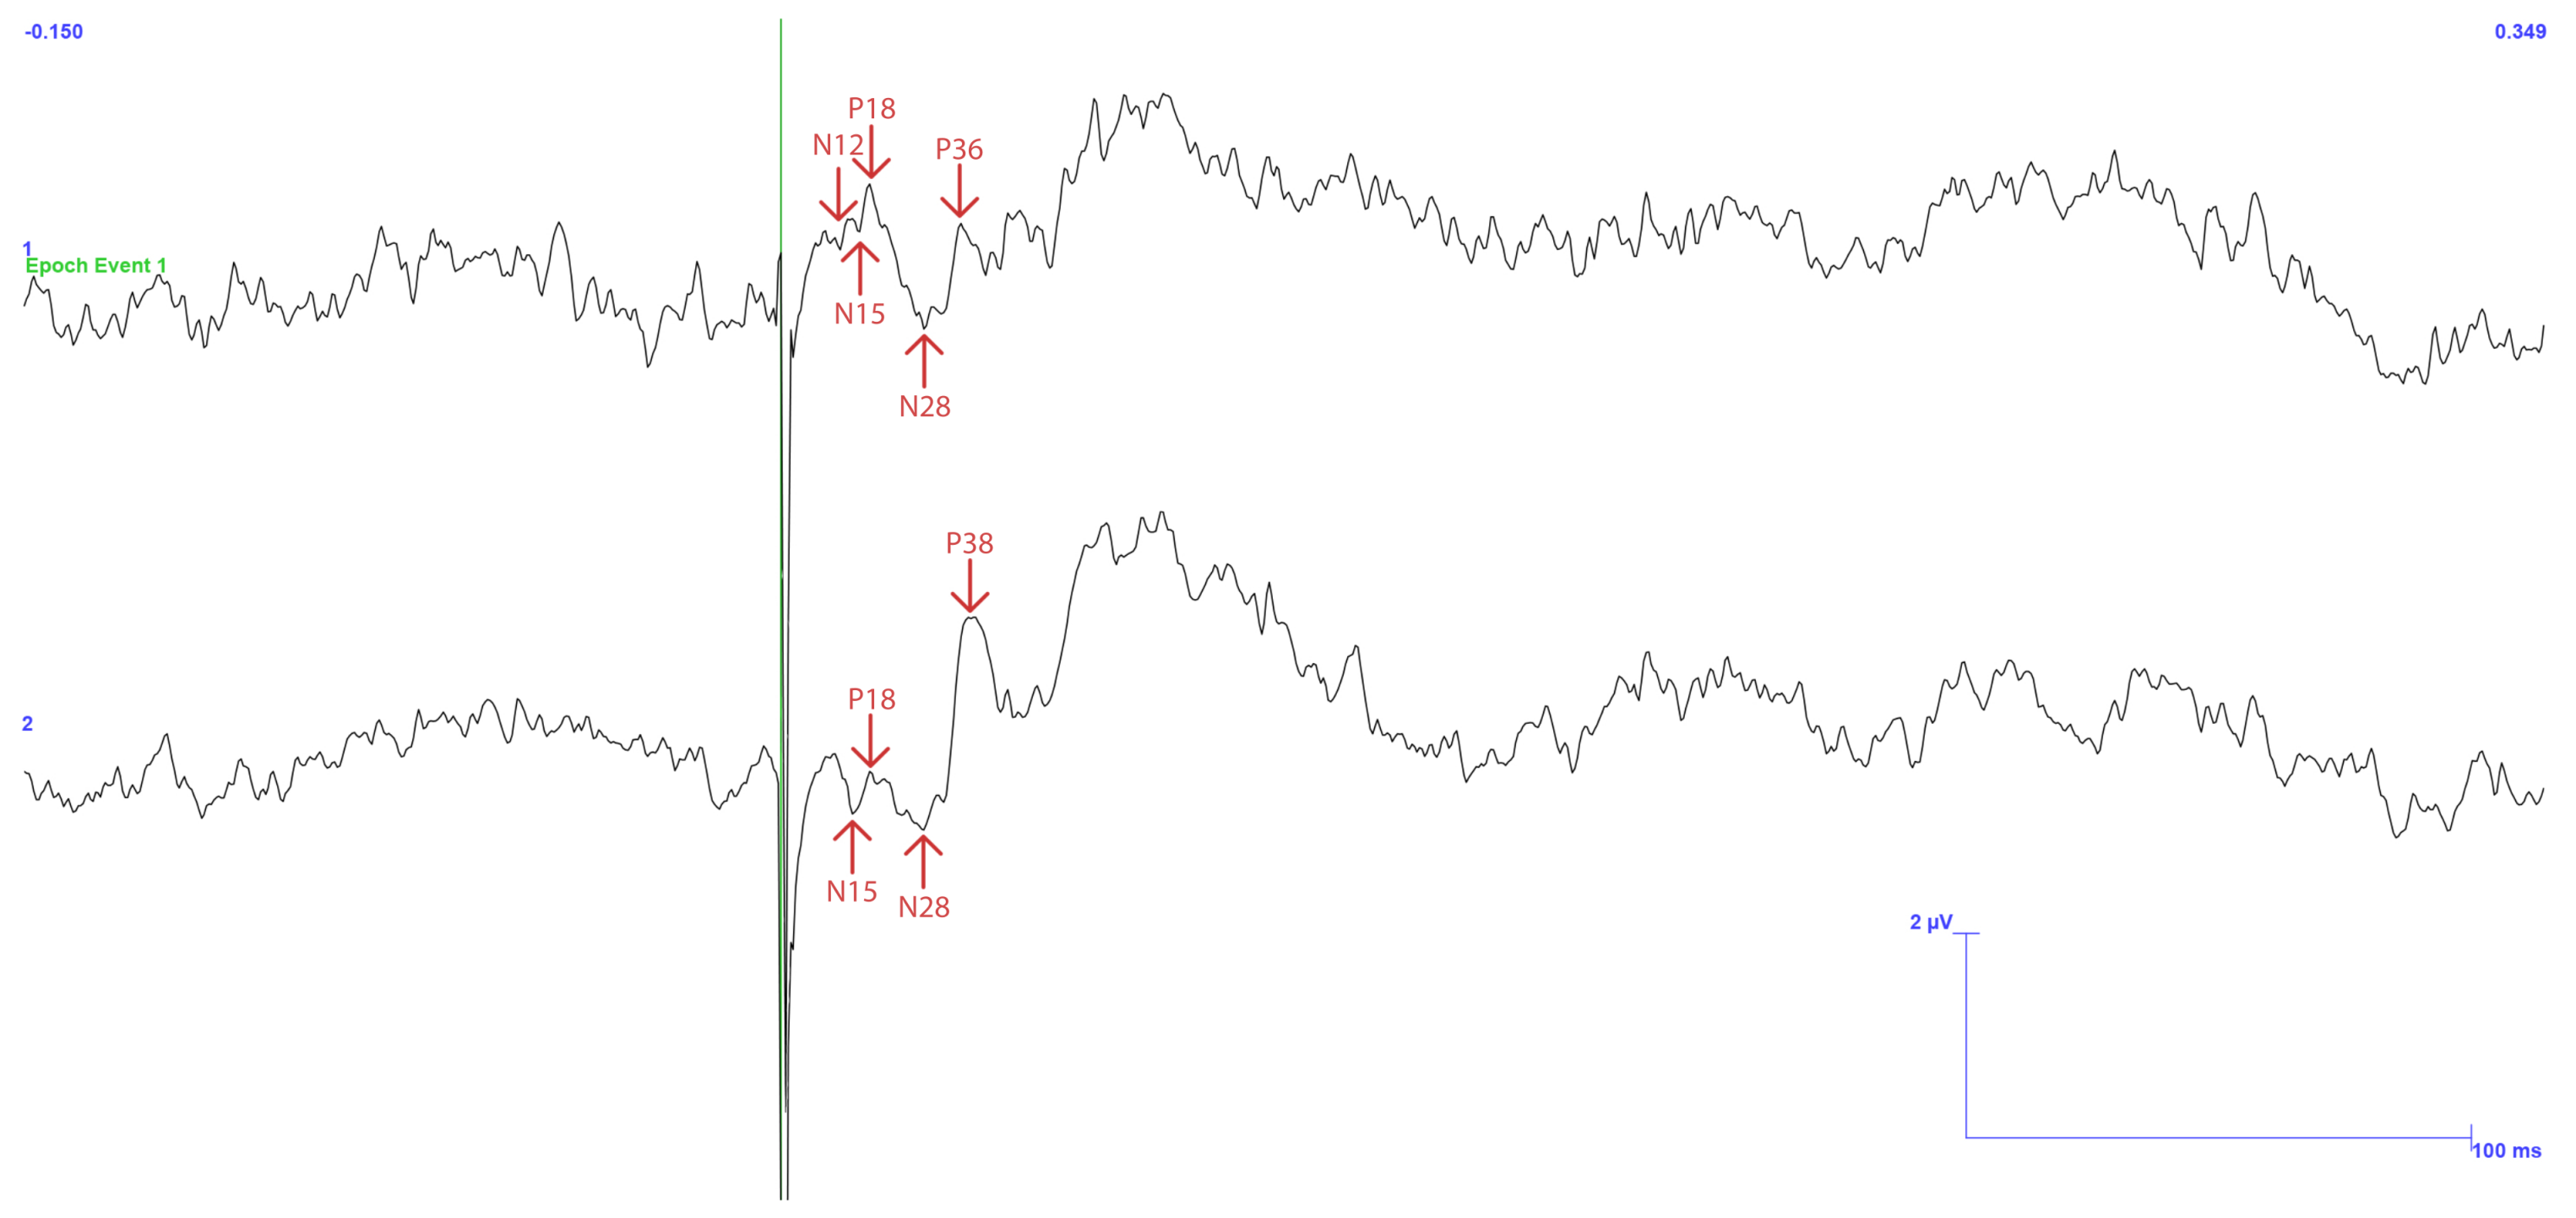
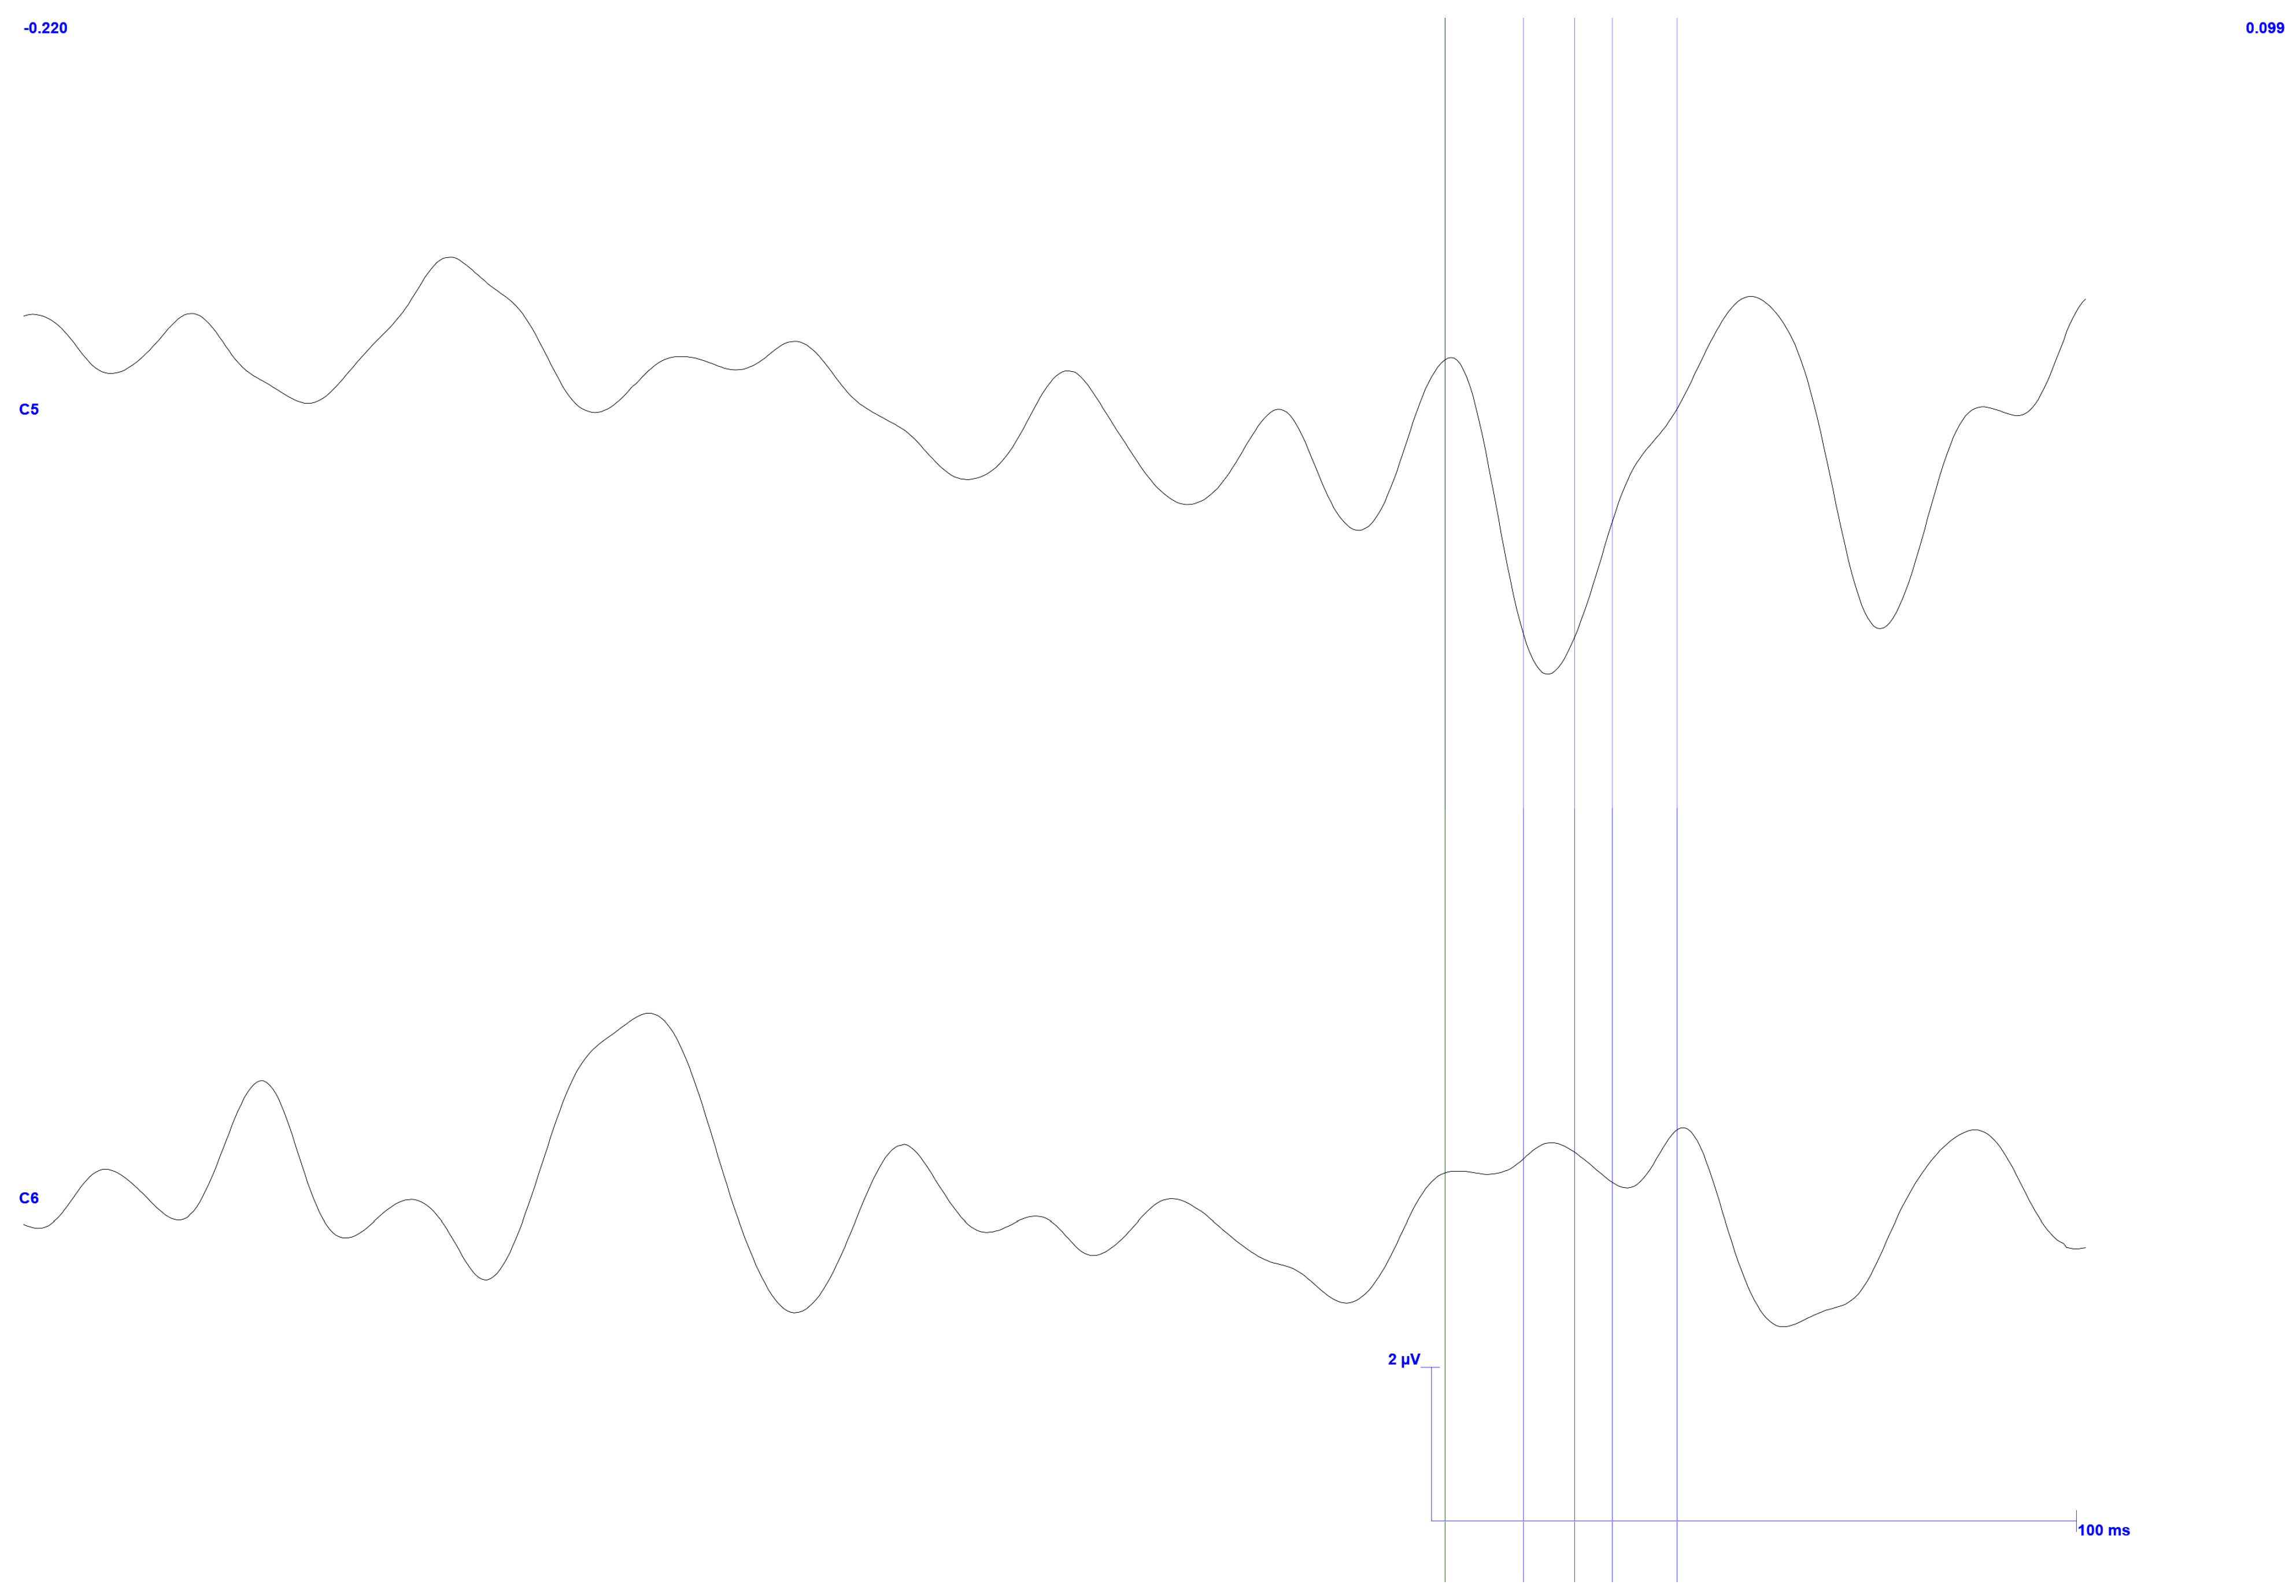
3.2. Occluded Trigeminal Somatosensory-Evoked Potentials
4. Discussion
Author Contributions
Funding
Data Availability Statement
Acknowledgments
Conflicts of Interest
References
- Baiju, R.; Peter, E.; Varghese, N.; Sivaram, R. Oral health and quality of life: Current concepts. J. Clin. Diagn. Res. 2017, 11, ZE21. [Google Scholar] [CrossRef] [PubMed]
- Trulsson, M.; Van der Bilt, A.; Carlsson, G.; Gotfredsen, K.; Larsson, P.; Müller, F.; Sessle, B.; Svensson, P. From brain to bridge: Masticatory function and dental implants. J. Oral Rehabil. 2012, 39, 858–877. [Google Scholar] [CrossRef] [PubMed]
- Johnsen, S.E. Human Periodontal Mechanoreceptors: Functional Properties and Role in Jaw Motor Control; Karolinska Institutet: Stockholm, Sweden, 2005. [Google Scholar]
- Sessle, B. Mechanisms of oral somatosensory and motor functions and their clinical correlates. J. Oral Rehabil. 2006, 33, 243–261. [Google Scholar] [CrossRef] [PubMed]
- Marchena-Rodríguez, A.; Moreno-Morales, N.; Ramírez-Parga, E.; Labajo-Manzanares, M.T.; Luque-Suárez, A.; Gijon-Nogueron, G. Relationship between foot posture and dental malocclusions in children aged 6 to 9 years: A cross-sectional study. Medicine 2018, 97, e0701. [Google Scholar] [CrossRef]
- Shi, J.; Leng, W.; Zhao, L.; Deng, C.; Xu, C.; Wang, J.; Wang, Y.; Peng, X. Tooth loss and cancer risk: A dose - response meta analysis of prospective cohort studies. Oncotarget 2018, 9, 15090. [Google Scholar] [CrossRef]
- Fang, W.L.; Jiang, M.J.; Gu, B.B.; Wei, Y.M.; Fan, S.N.; Liao, W.; Zheng, Y.Q.; Liao, S.W.; Xiong, Y.; Li, Y.; et al. Tooth loss as a risk factor for dementia: Systematic review and meta-analysis of 21 observational studies. BMC Psychiatry 2018, 18, 345. [Google Scholar] [CrossRef]
- Trulsson, M. Sensory-motor function of human periodontal mechanoreceptors. J. Oral Rehabil. 2006, 33, 262–273. [Google Scholar] [CrossRef]
- Hunter, E.; Congdon, N.; de Moura Brito, L.; McKenna, G.; Petrauskiene, E.; Rodrigues Leles, C.; Tsakos, G.; Woodside, J.; Virgili, G.; Piyasena, P. The Global Impact of Edentulism: A Systematic Review. Eur. J. Public Health 2023, 33, 452–453. [Google Scholar] [CrossRef]
- Misch, C.E. Dental Implant Prosthetics-E-Book; Elsevier Health Sciences: Amsterdam, The Netherlands, 2014. [Google Scholar]
- Goodacre, C.J.; Bernal, G.; Rungcharassaeng, K.; Kan, J.Y. Clinical complications with implants and implant prostheses. J. Prosthet. Dent. 2003, 90, 121–132. [Google Scholar] [CrossRef]
- Helkimo, M. Studies on function and dysfunction of the masticatory system: IV. Age and sex distribution of symptoms of dysfunction of the masticatory system in Lapps in the north of Finland. Acta Odontol. Scand. 1974, 32, 255–267. [Google Scholar] [CrossRef]
- da Silva, J.M.; Cerrone, I.; Malágon, D.; Marinho, J.; Mundy, S.; Gaspar, J.; Mendes, J.G. A Smart Dental Prosthesis to Restore Dental Proprioceptivity. In Proceedings of the 2020 XXXV Conference on Design of Circuits and Integrated Systems (DCIS), Madrid, Spain, 18–20 November 2020; IEEE: Piscataway, NJ, USA, 2020; pp. 1–6. [Google Scholar]
- Levin, L. Dealing with dental implant failures. J. Appl. Oral Sci. 2008, 16, 171–175. [Google Scholar] [CrossRef]
- Porter, J.A.; Von Fraunhofer, J.A. Success or failure of dental implants? A literature review with treatment considerations. Gen. Dent. 2005, 53, 423–432. [Google Scholar] [PubMed]
- Giggins, O.; Persson, U.; Caulfield, B. Biofeedback in rehabilitation. J. Neuroeng. Rehabil. 2013, 10, 60. [Google Scholar] [CrossRef] [PubMed]
- Toledo-Peral, C.L.; Vega-Martínez, G.; Mercado-Gutiérrez, J.A.; Rodríguez-Reyes, G.; Vera-Hernández, A.; Leija-Salas, L.; Gutiérrez-Martínez, J. Virtual/Augmented Reality for Rehabilitation Applications Using Electromyography as Control/Biofeedback: Systematic Literature Review. Electronics 2022, 11, 2271. [Google Scholar] [CrossRef]
- Huckabee, M.L.; Mills, M.; Flynn, R.; Doeltgen, S. The Evolution of Swallowing Rehabilitation and Emergence of Biofeedback Modalities. Curr. Otorhinolaryngol. Rep. 2023, 11, 144–153. [Google Scholar] [CrossRef]
- Vieira, M.d.A.; Oliveira-Souza, A.I.S.d.; Hahn, G.; Bähr, L.; Armijo-Olivo, S.; Ferreira, A.P.d.L. Effectiveness of Biofeedback in Individuals with Awake Bruxism Compared to Other Types of Treatment: A Systematic Review. Int. J. Environ. Res. Public Health 2023, 20, 1558. [Google Scholar] [CrossRef] [PubMed]
- Florjanski, W.; Malysa, A.; Orzeszek, S.; Smardz, J.; Olchowy, A.; Paradowska-Stolarz, A.; Wieckiewicz, M. Evaluation of Biofeedback Usefulness in Masticatory Muscle Activity Management—A Systematic Review. J. Clin. Med. 2019, 8, 766. [Google Scholar] [CrossRef]
- Arcuri, C.; Muzzi, F.; Docimo, R.; Fusco, E.; Pauri, F.; Rossini, P.M. Somatosensory evoked potentials of inferior alveolar nerve. J. Oral Maxillofac. Surg. 2006, 64, 594–599. [Google Scholar] [CrossRef]
- Bennett, A.; Wastell, D.; Barker, G.; Blackburn, C.; Rood, J. Trigeminal somatosensory evoked potentials: A review of the literature as applicable to oral dysaesthesias. Int. J. Oral Maxillofac. Surg. 1987, 16, 408–415. [Google Scholar] [CrossRef]
- Waldman, H.J. Evoked potential testing. In Pain Management; Elsevier: Amsterdam, The Netherlands, 2007; pp. 192–196. [Google Scholar]
- Cruccu, G.; Aminoff, M.; Curio, G.; Guerit, J.; Kakigi, R.; Mauguiere, F.; Rossini, P.; Treede, R.D.; Garcia-Larrea, L. Recommendations for the clinical use of somatosensory-evoked potentials. Clin. Neurophysiol. 2008, 119, 1705–1719. [Google Scholar] [CrossRef]
- Barker, G.; Bennett, A.; Wastell, D. Applications of trigeminal somatosensory evoked potentials (TSEPs) in oral and maxillofacial surgery. Br. J. Oral Maxillofac. Surg. 1987, 25, 308–313. [Google Scholar] [CrossRef] [PubMed]
- Badr, G.G.; Hanner, P.; Edström, S. Cortical evoked potentials in response to trigeminus nerve stimulation in humans. Clin. Electroencephalogr. 1983, 14, 61–66. [Google Scholar] [CrossRef] [PubMed]
- Wang, K.; Xu, W. Trigeminal somatosensory evoked potential in inferior alveolar nerve damage assessment. J. Brain Sci. 2011, 36, 81–86. [Google Scholar]
- Cruccu, G.; Truini, A. Diseases of cranial nerves and brainstem. In Handbook of Clinical Neurophysiology; Elsevier: Amsterdam, The Netherlands, 2006; Volume 7, pp. 813–839. [Google Scholar]
- Villanueva, J.; Viñuales, M.; Montes, C. Somatosensory trigeminal evoked potentials after gingival stimulation of the mental nerve. Normal values. Rev. De Neurol. 1998, 27, 817–823. [Google Scholar] [CrossRef]
- Stöhr, M.; Petruch, F.; Scheglmann, K. Somatosensory evoked potentials following trigeminal nerve stimulation in trigeminal neuralgia. Ann. Neurol. Off. J. Am. Neurol. Assoc. Child Neurol. Soc. 1981, 9, 63–66. [Google Scholar] [CrossRef]
- Maezawa, H.; Hirai, Y.; Shiraishi, H.; Funahashi, M. Somatosensory evoked magnetic fields following tongue and hard palate stimulation on the preferred chewing side. J. Neurol. Sci. 2014, 347, 288–294. [Google Scholar] [CrossRef]
- Singer, B. Functional electrical stimulation of the extremities in the neurological patient: A review. Aust. J. Physiother. 1987, 33, 33–42. [Google Scholar] [CrossRef] [PubMed]
- Polk, B.J.; Stelzenmuller, A.; Mijares, G.; MacCrehan, W.; Gaitan, M. Ag/AgCl microelectrodes with improved stability for microfluidics. Sens. Actuators B Chem. 2006, 114, 239–247. [Google Scholar] [CrossRef]
- American Dental Association. Current Dental Terminology, 3rd ed.; American Dental Association: Chicago, IL, USA, 1999. [Google Scholar]


| Wave Type | Signal | Intensity (mA) | Pulse Width (ms) | Frequency (Hz) | Quantity to Average | Noise Reduction | Study |
|---|---|---|---|---|---|---|---|
| Square | Monophasic | 4–6.5 | 0.2 | 0.7 | 200 | - | [21] |
| - | - | 3–5 times MSP | - | - | 50 | - | [27] |
| - | - | 3–4 times MSP | <1 | 0.9–3.5 | 64–1024 | Phase reversal | [22] |
| Square | Monophasic | Slightly above MSP (const. V) | 0.2–0.5 | 1–2.5 | 526 | Phase reversal (each 64 stimulations) | [26] |
| - | - | <10 | 0.1 | 2 | - | - | [25] |
| - | Monophasic | 2–3 times MSP | - | 3–5 | 500 | GND between stimulation and recording sites; Repeat the process twice | [24] |
| Square | Biphasic | 3 times MSP (const. A) | 0.5 | 1 | 600 | Biphasic | [31] |
| - | - | - | 0.2–0.3 | - | - | - | [32] |
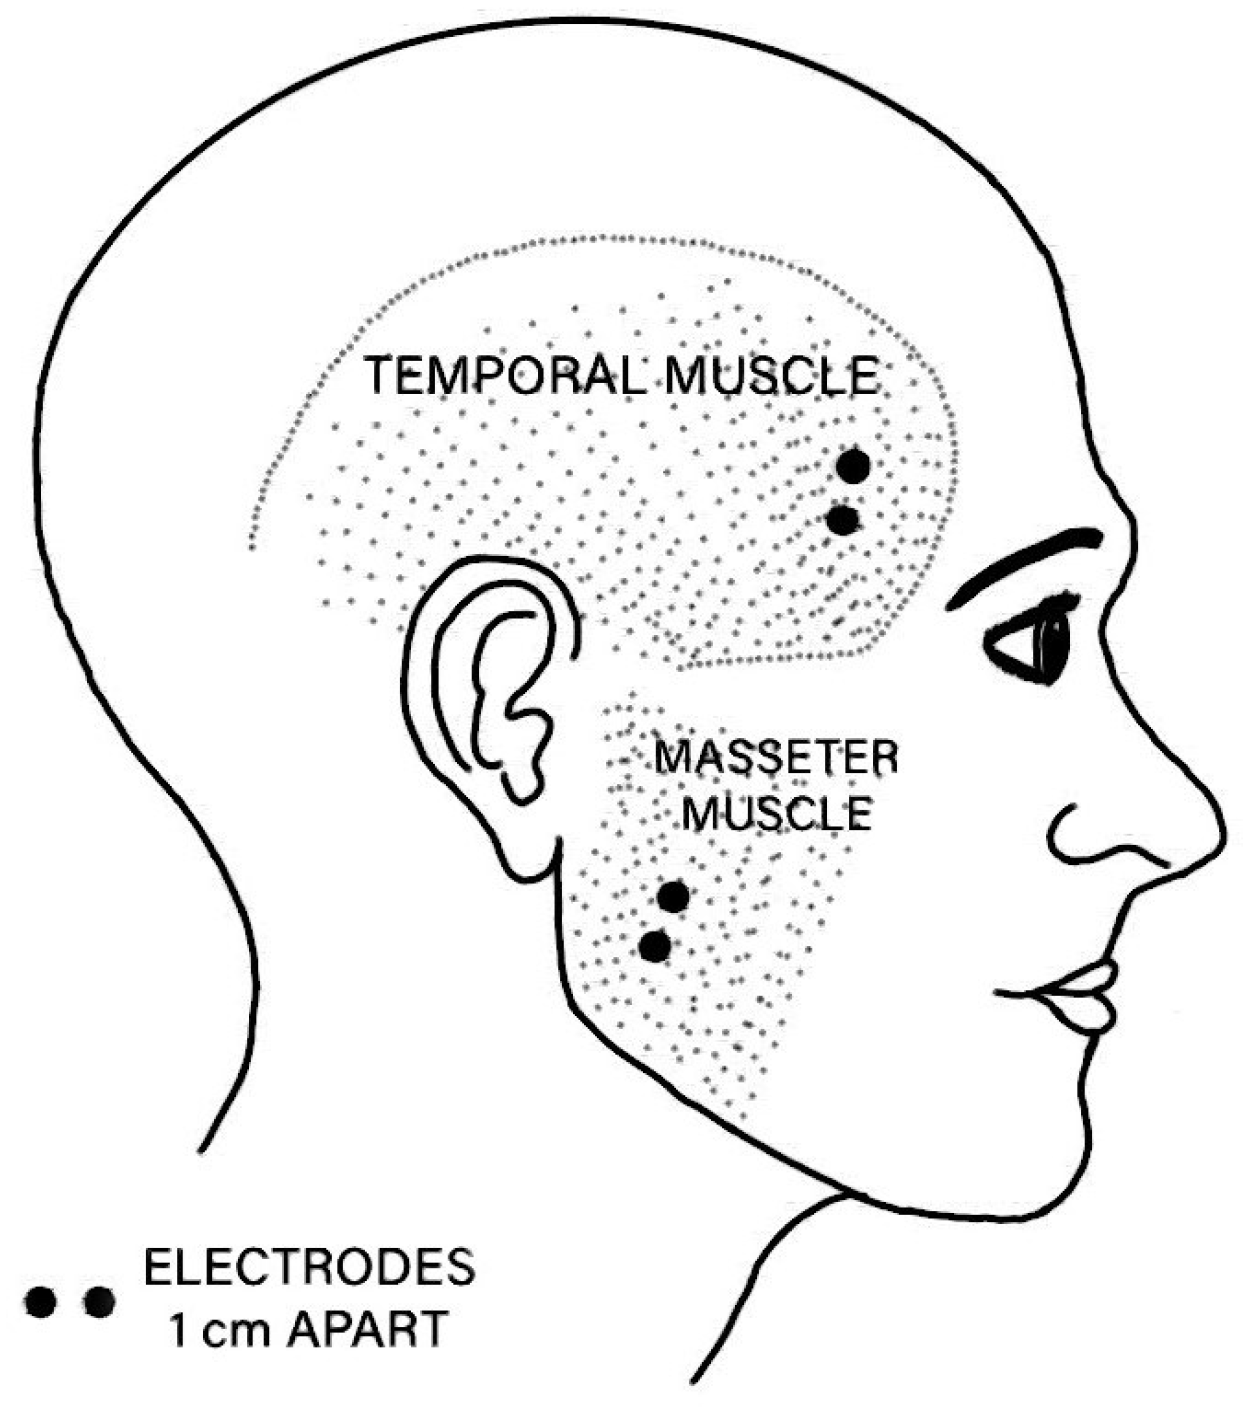
| EMG Channel | Anatomical Site |
|---|---|
| EMG1 | Right temporal muscle |
| EMG2 | Right masseter muscle |
| EMG3 | Left temporal muscle |
| EMG4 | Left masseter muscle |
Disclaimer/Publisher’s Note: The statements, opinions and data contained in all publications are solely those of the individual author(s) and contributor(s) and not of MDPI and/or the editor(s). MDPI and/or the editor(s) disclaim responsibility for any injury to people or property resulting from any ideas, methods, instructions or products referred to in the content. |
© 2025 by the authors. Licensee MDPI, Basel, Switzerland. This article is an open access article distributed under the terms and conditions of the Creative Commons Attribution (CC BY) license (https://creativecommons.org/licenses/by/4.0/).
Share and Cite
Aguiar, J.M.; Machado da Silva, J.; Fonseca, C.; Marinho, J. An Assessment of the Sensory Function in the Maxillofacial Region: A Dual-Case Pilot Study. Sensors 2025, 25, 3355. https://doi.org/10.3390/s25113355
Aguiar JM, Machado da Silva J, Fonseca C, Marinho J. An Assessment of the Sensory Function in the Maxillofacial Region: A Dual-Case Pilot Study. Sensors. 2025; 25(11):3355. https://doi.org/10.3390/s25113355
Chicago/Turabian StyleAguiar, João Maia, José Machado da Silva, Carlos Fonseca, and Jorge Marinho. 2025. "An Assessment of the Sensory Function in the Maxillofacial Region: A Dual-Case Pilot Study" Sensors 25, no. 11: 3355. https://doi.org/10.3390/s25113355
APA StyleAguiar, J. M., Machado da Silva, J., Fonseca, C., & Marinho, J. (2025). An Assessment of the Sensory Function in the Maxillofacial Region: A Dual-Case Pilot Study. Sensors, 25(11), 3355. https://doi.org/10.3390/s25113355