

Gait Characterization in Duchenne Muscular Dystrophy (DMD) Using a Single-Sensor Accelerometer: Classical Machine Learning and Deep Learning Approaches
 , ,
, ,
Abstract
1. Introduction
2. Materials and Methods
2.1. Participants
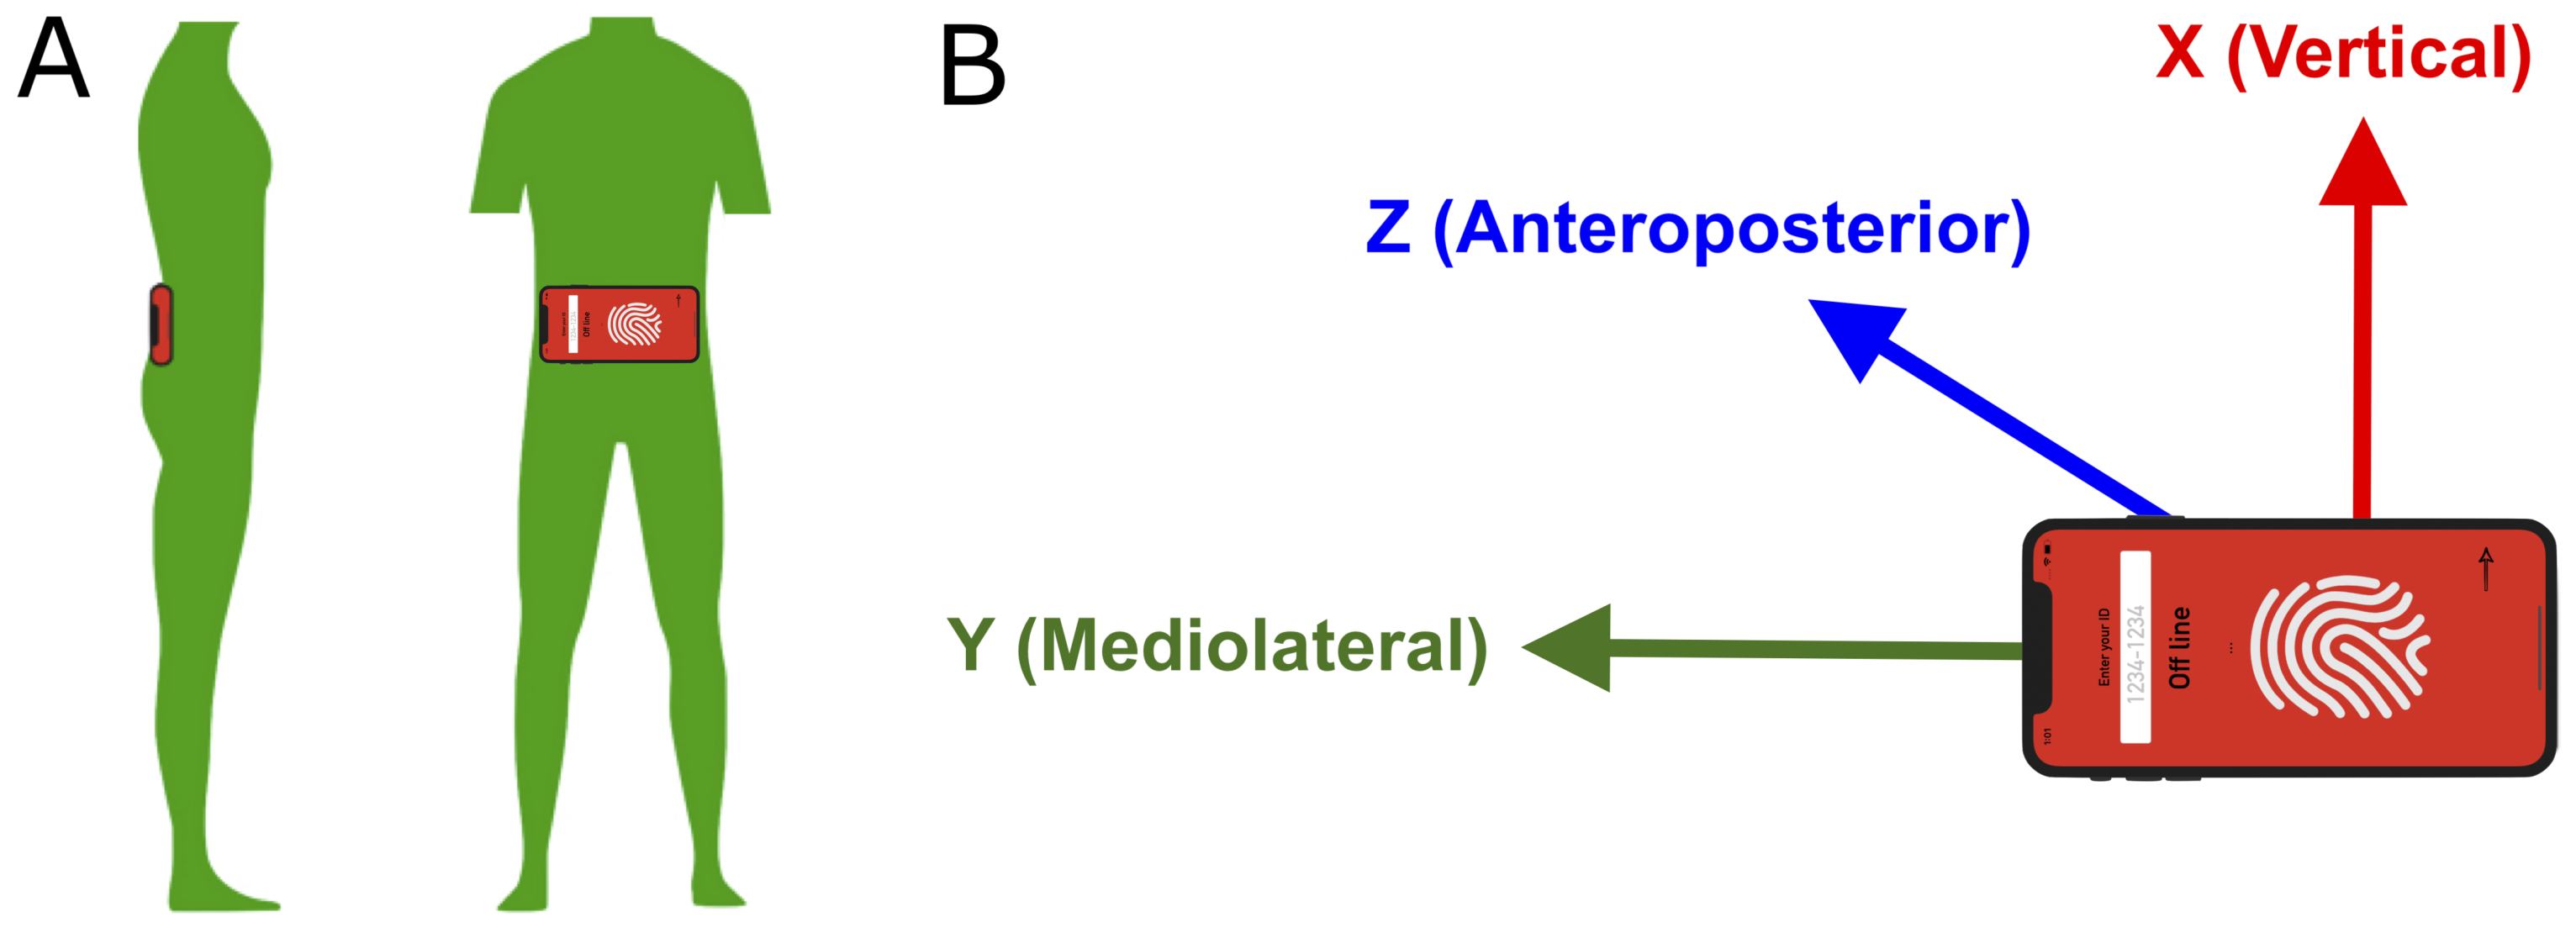
2.2. Materials
2.3. Gait and Functional Testing
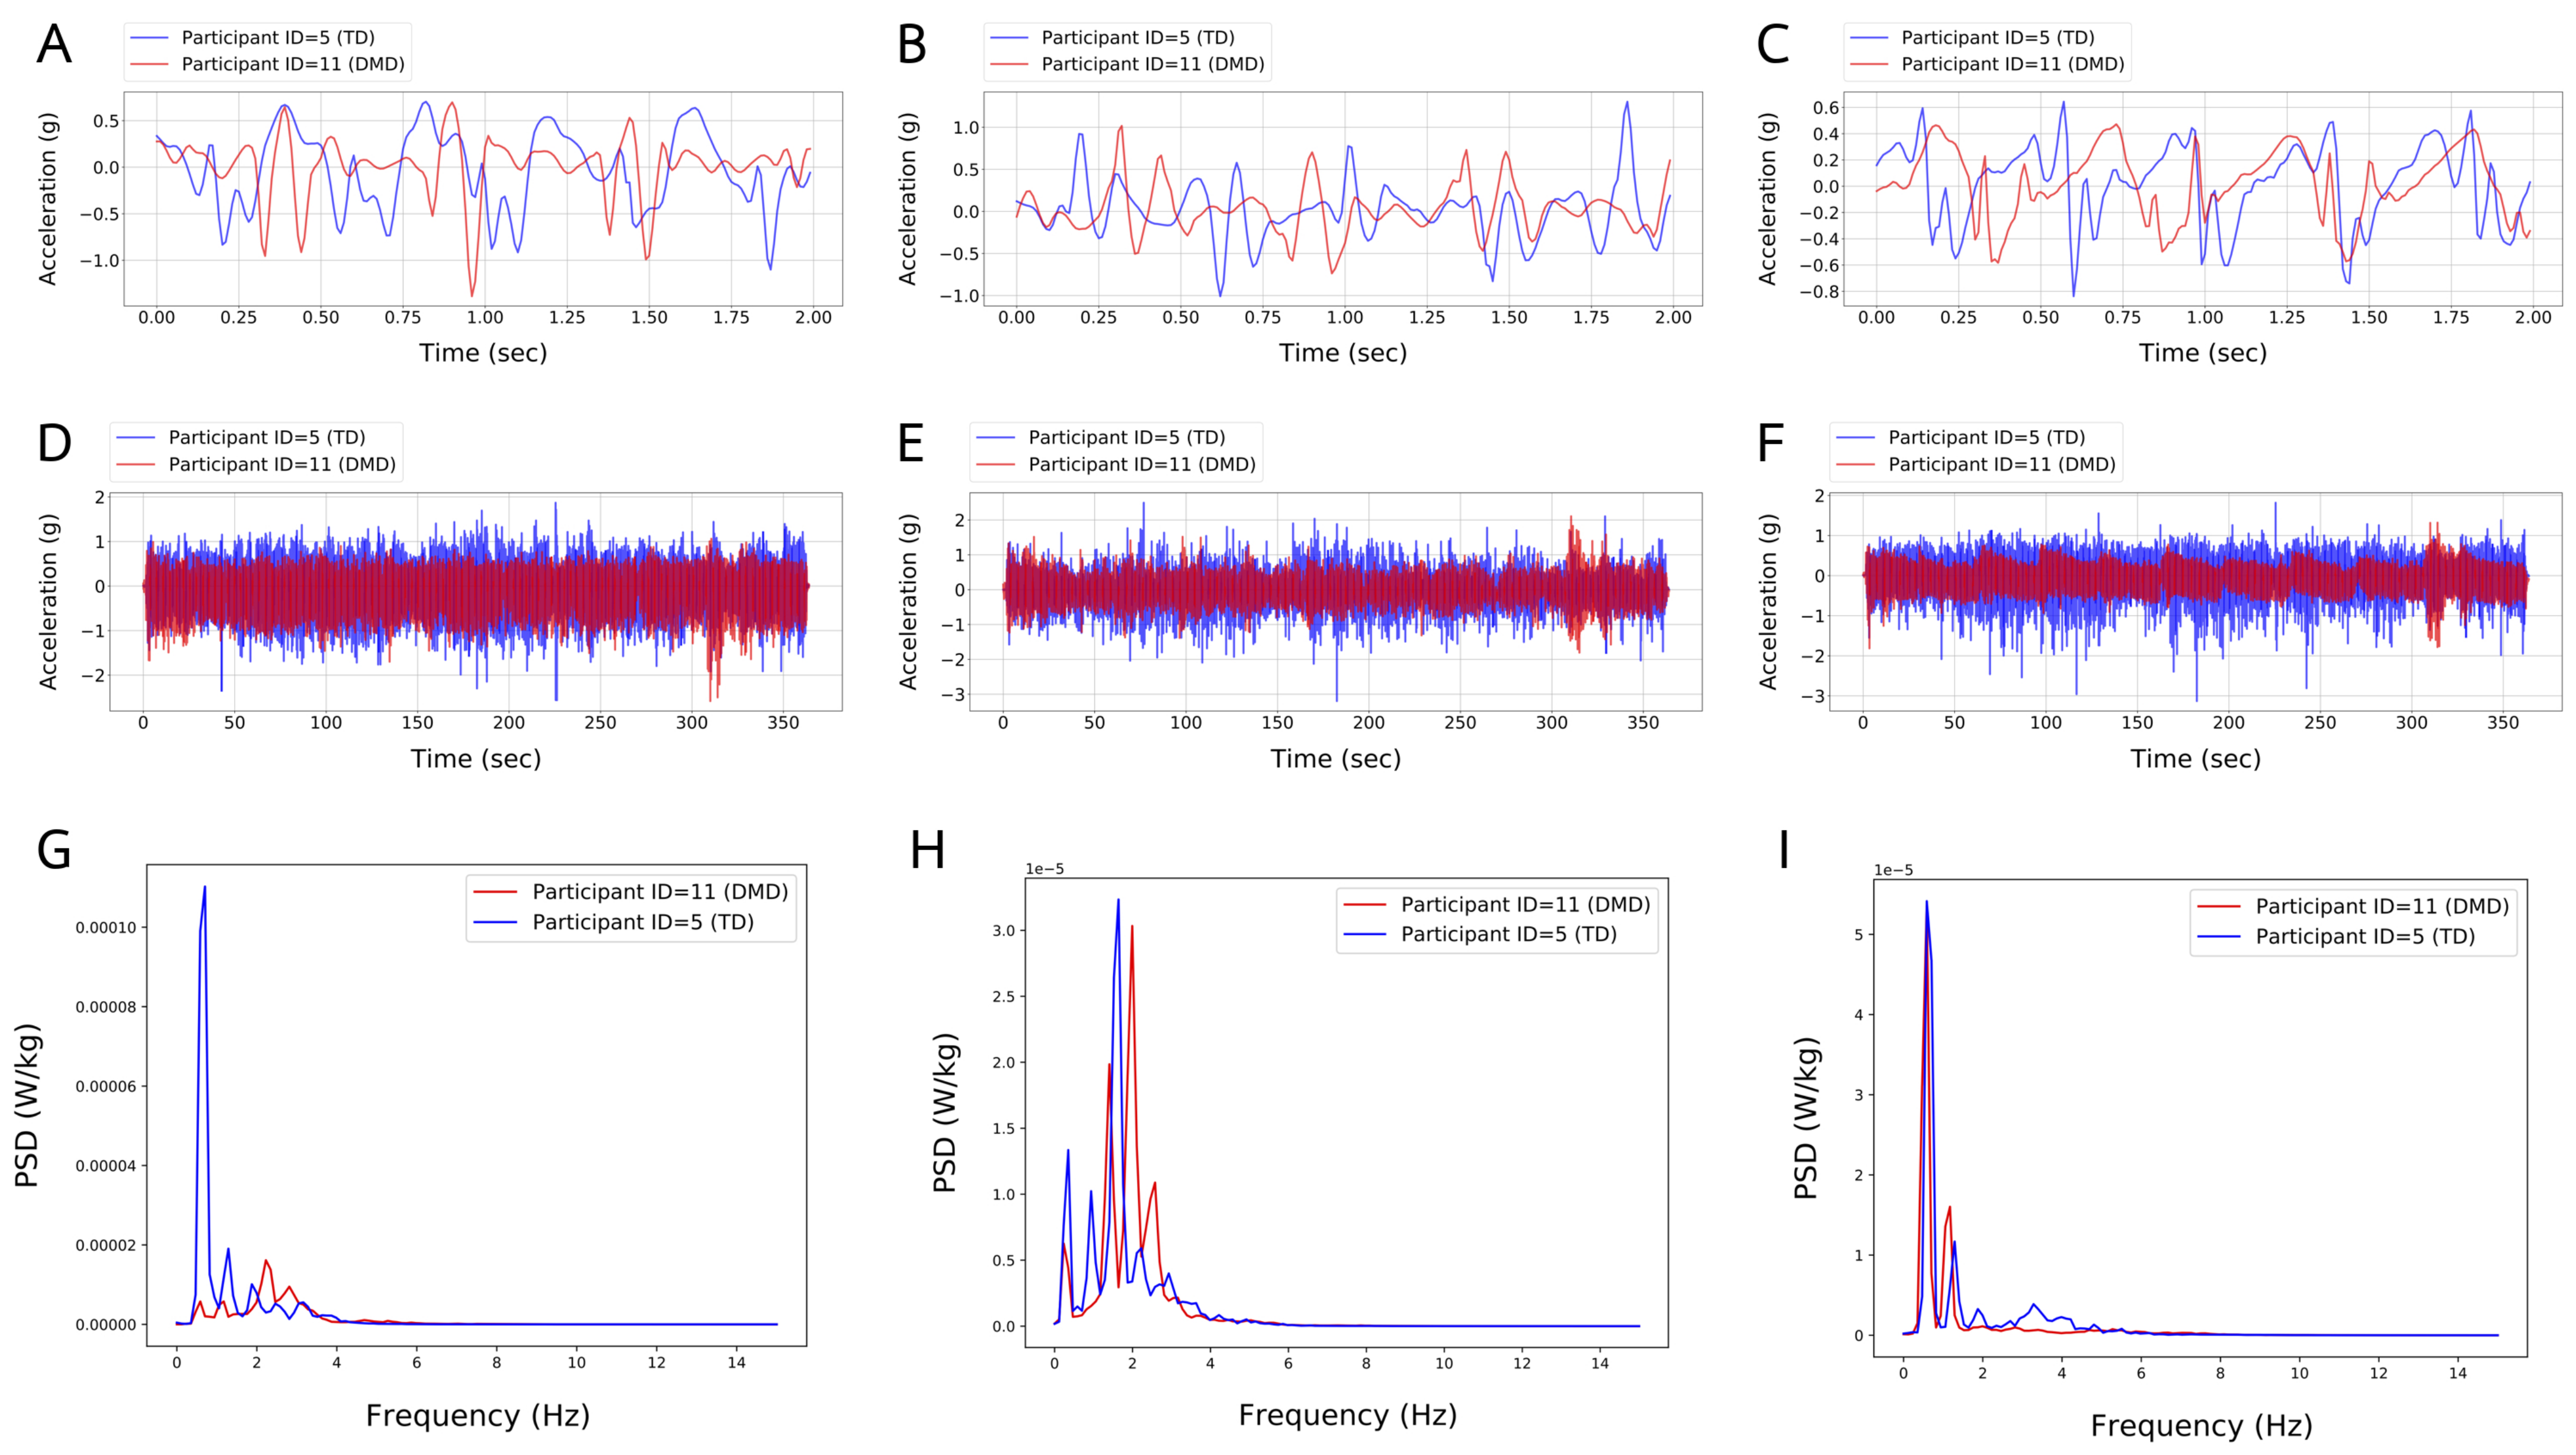
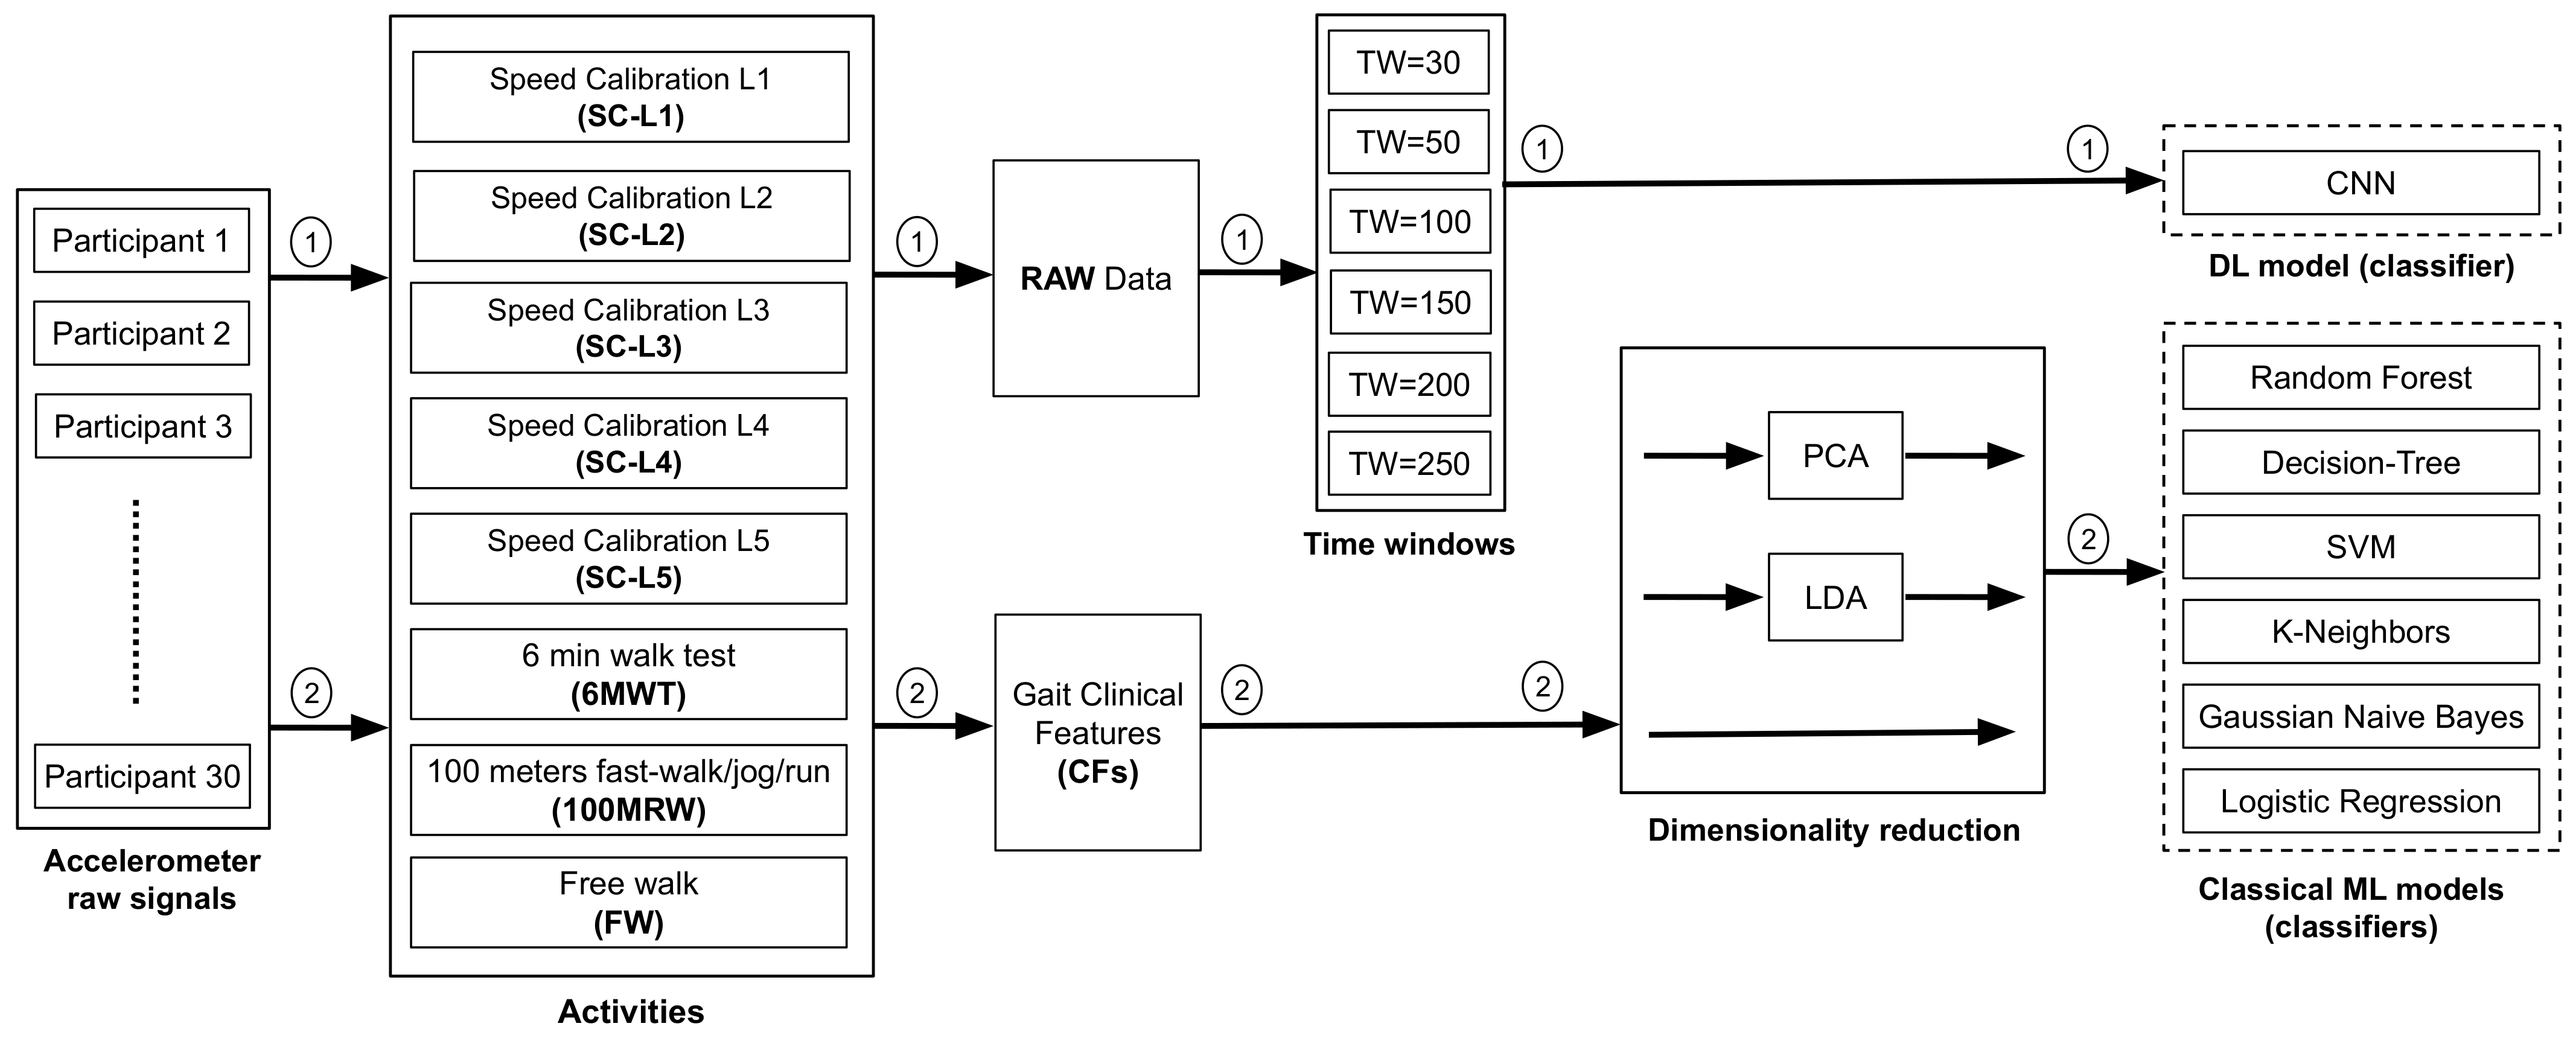
2.4. Data Analysis
2.4.1. Extraction and Evaluation of Temporospatial Gait Clinical Features
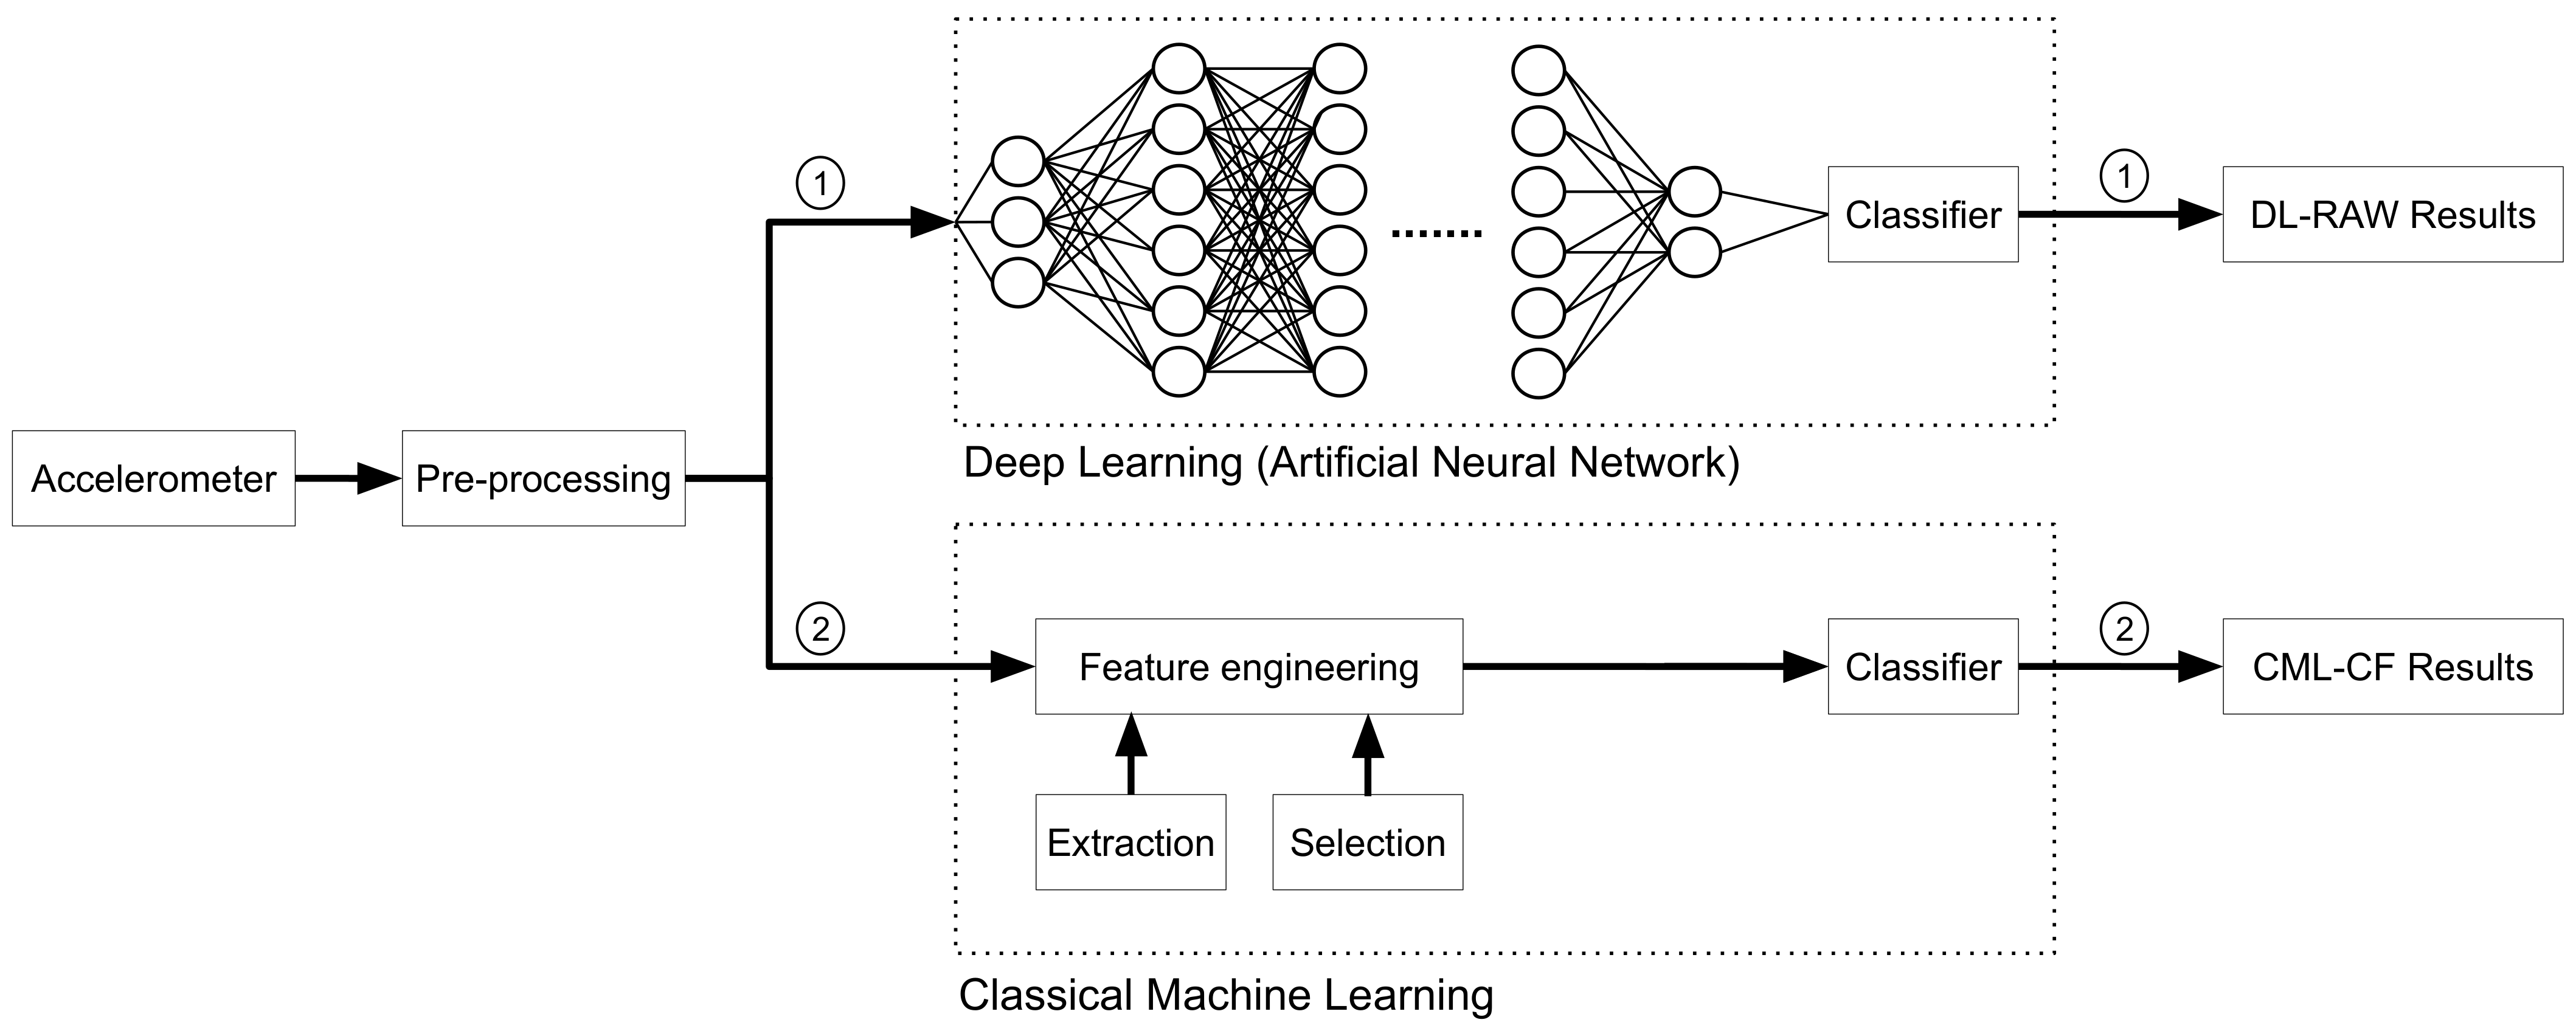
2.4.2. CML and DL Analytical Methods
2.4.3. Dimensionality Reduction
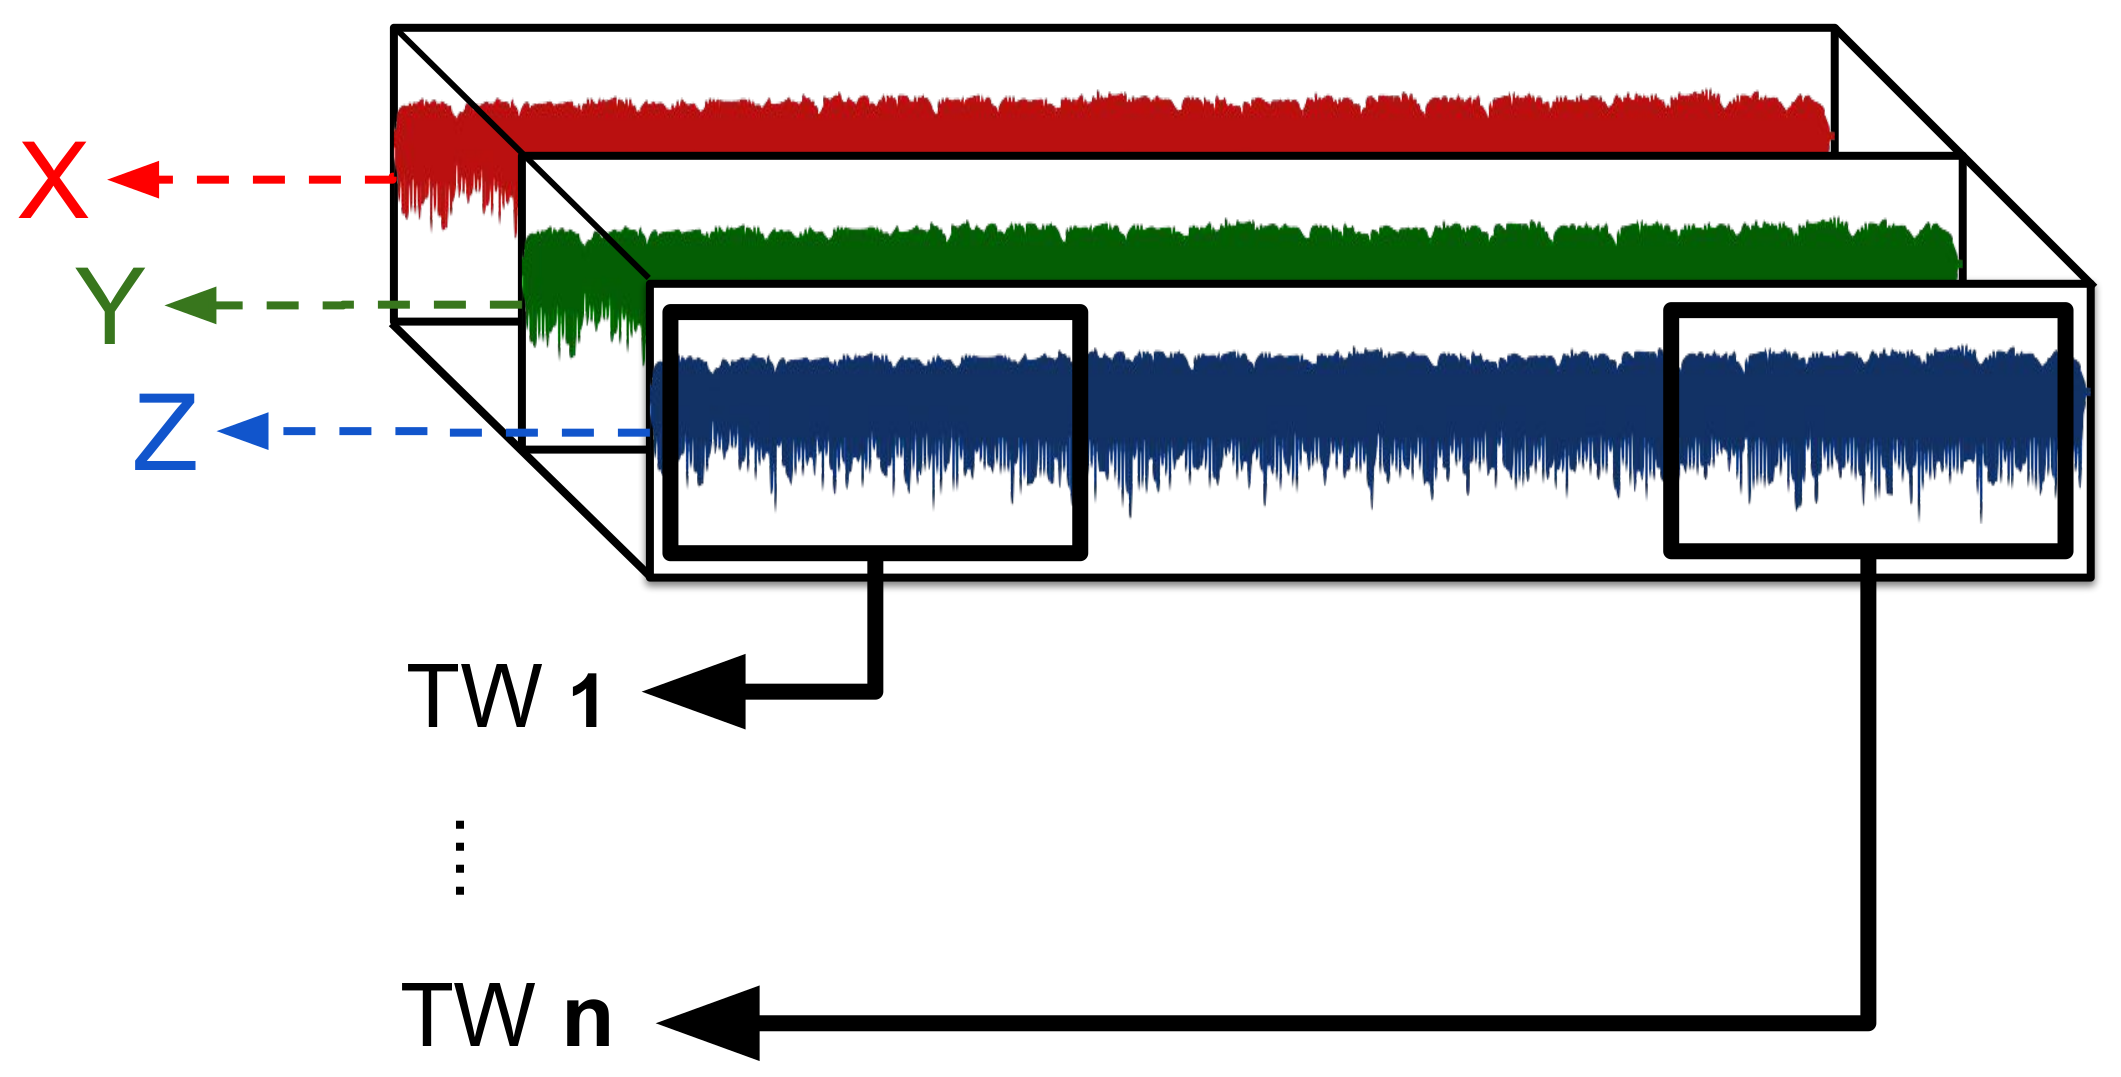
2.4.4. Preprocessing of Raw Accelerometer Signals Using Time-Windowing
2.4.5. Cross-Validation of ML Models
3. Results
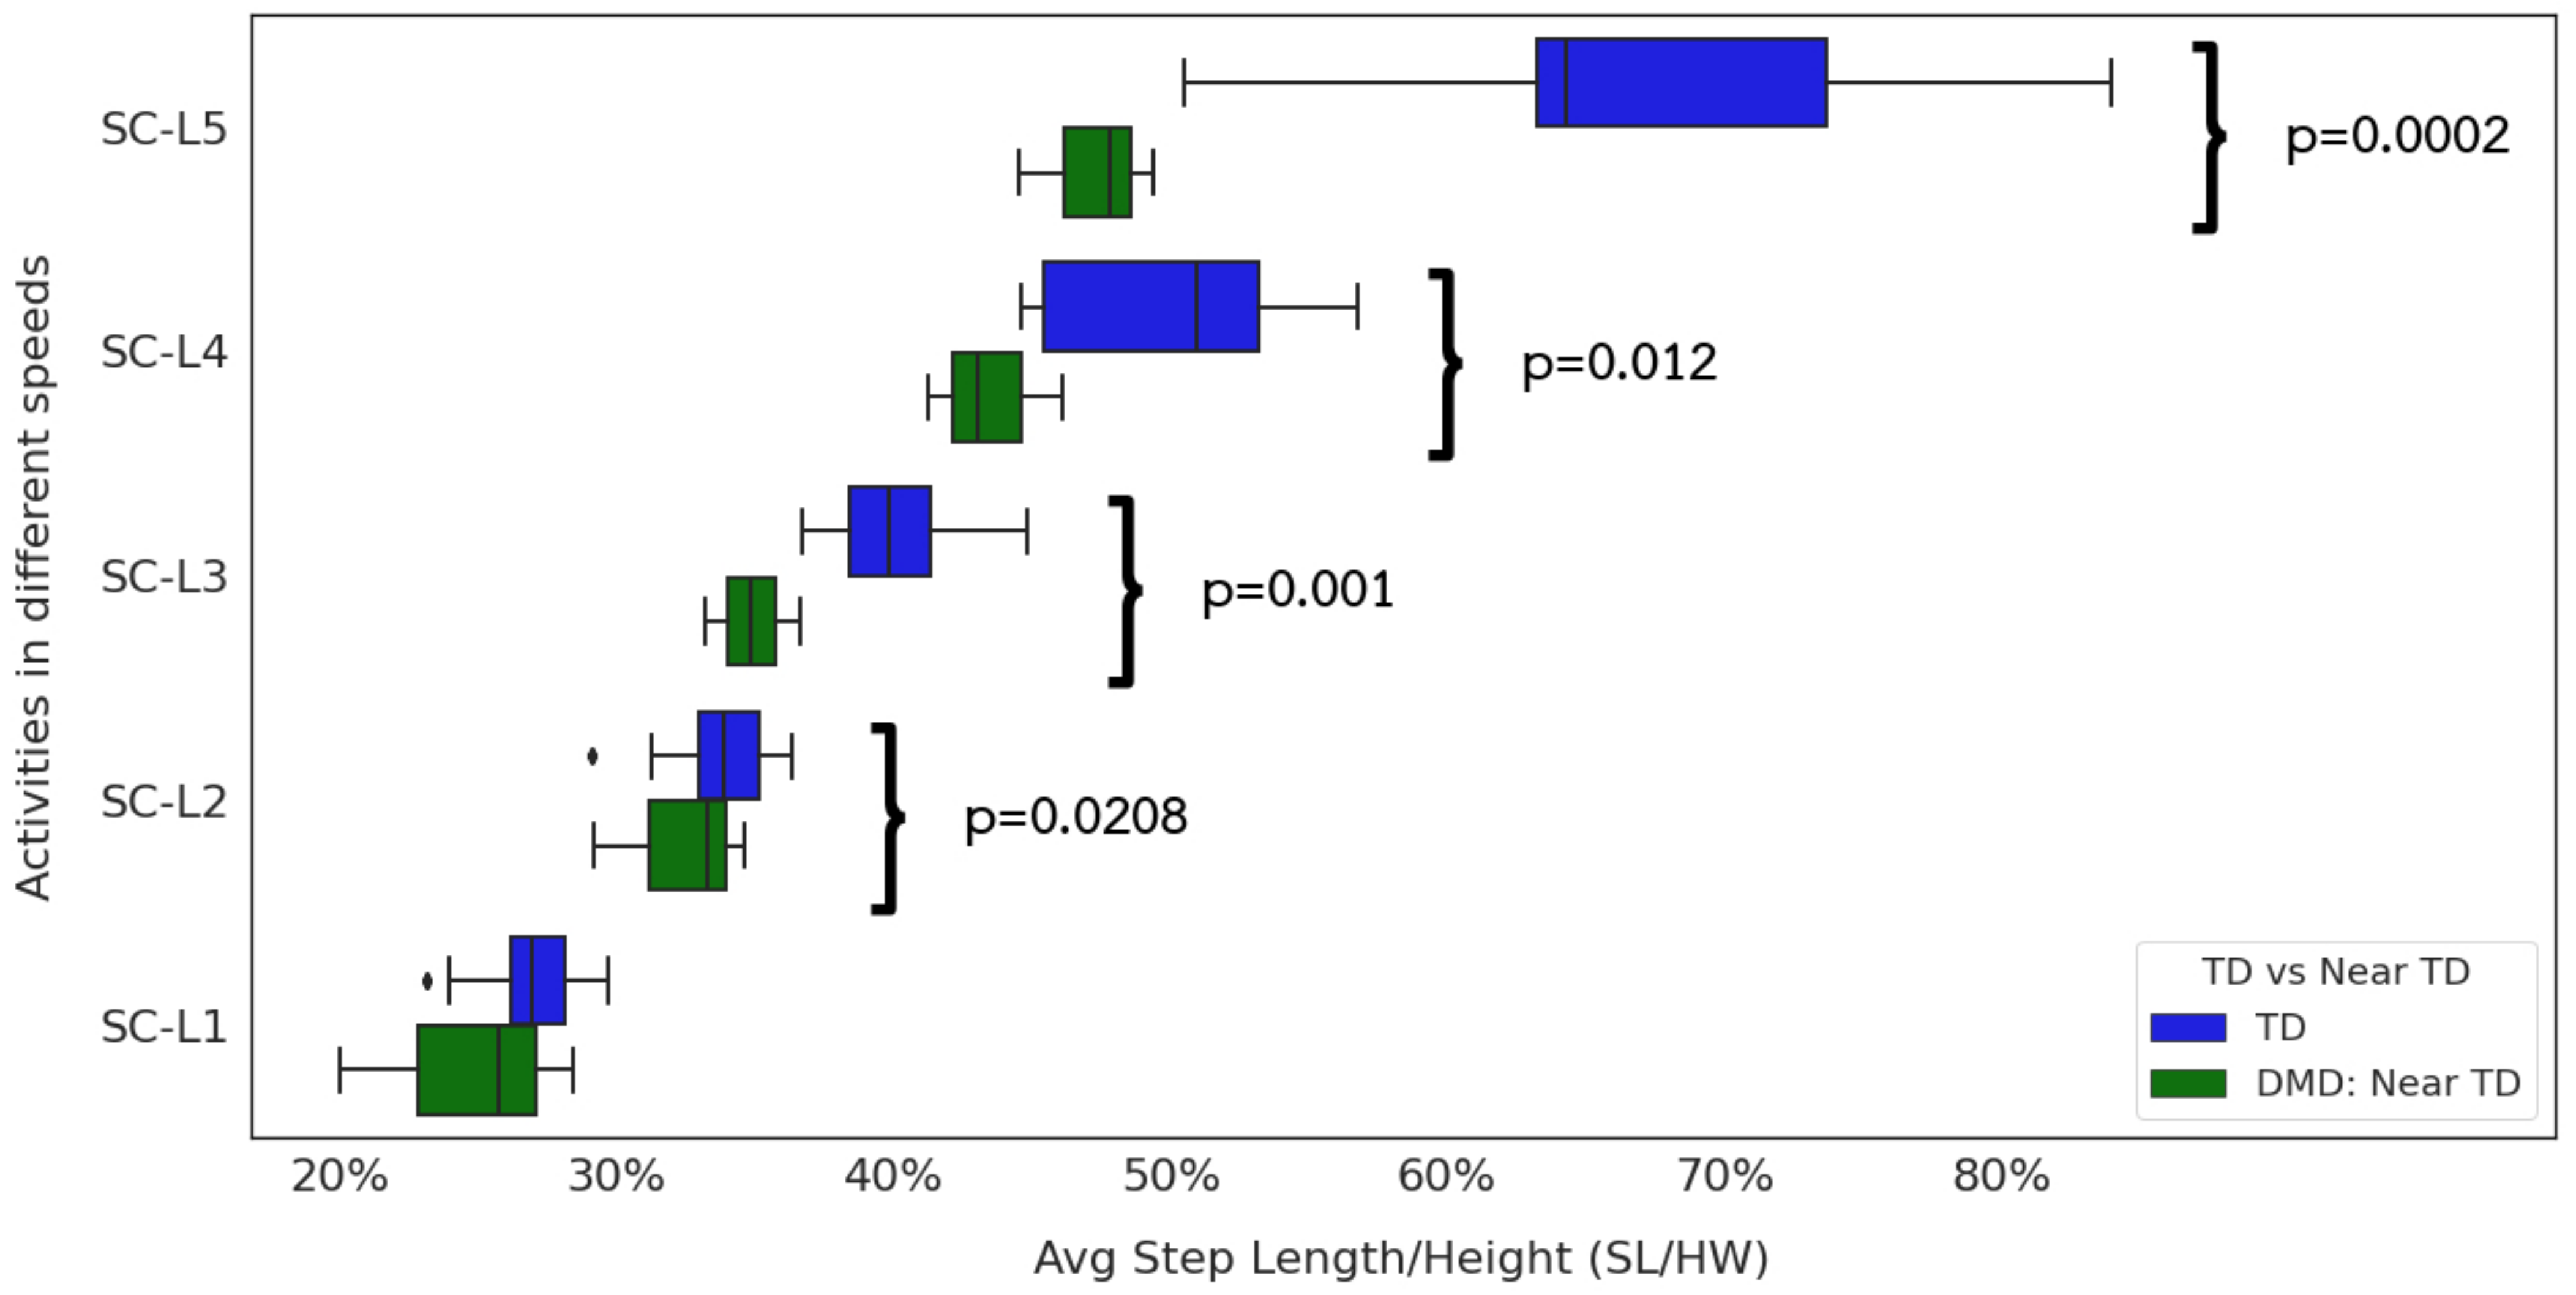
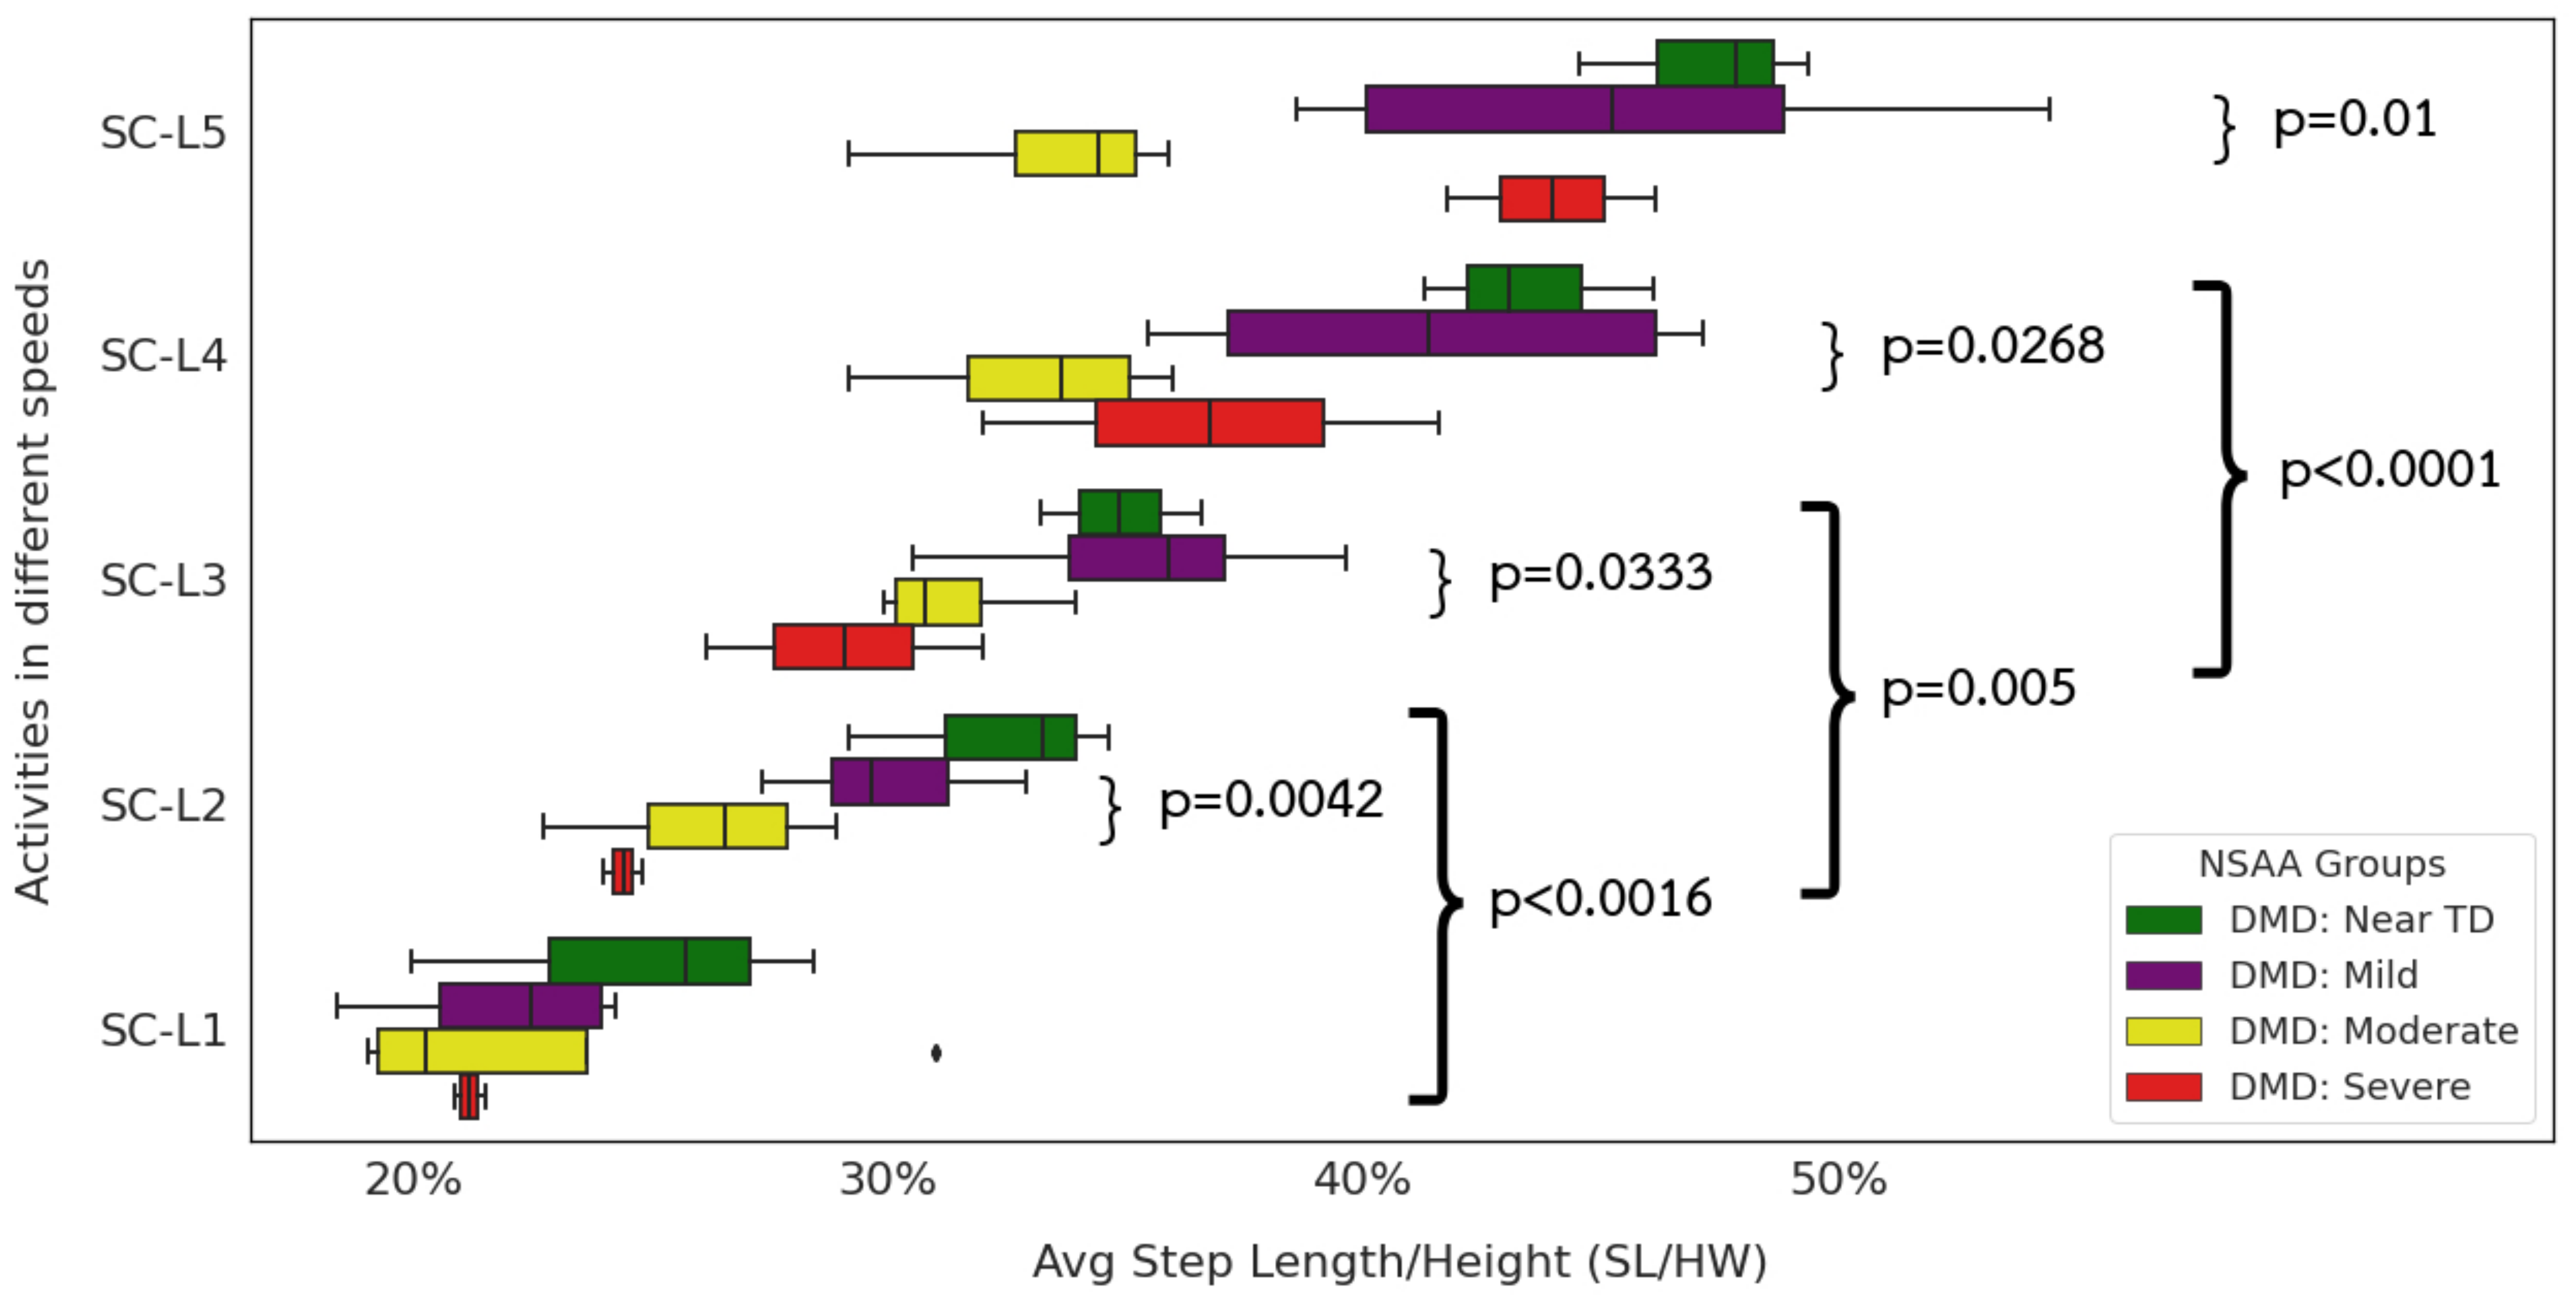
3.1. Extracted Temporospatial Gait Clinical Features
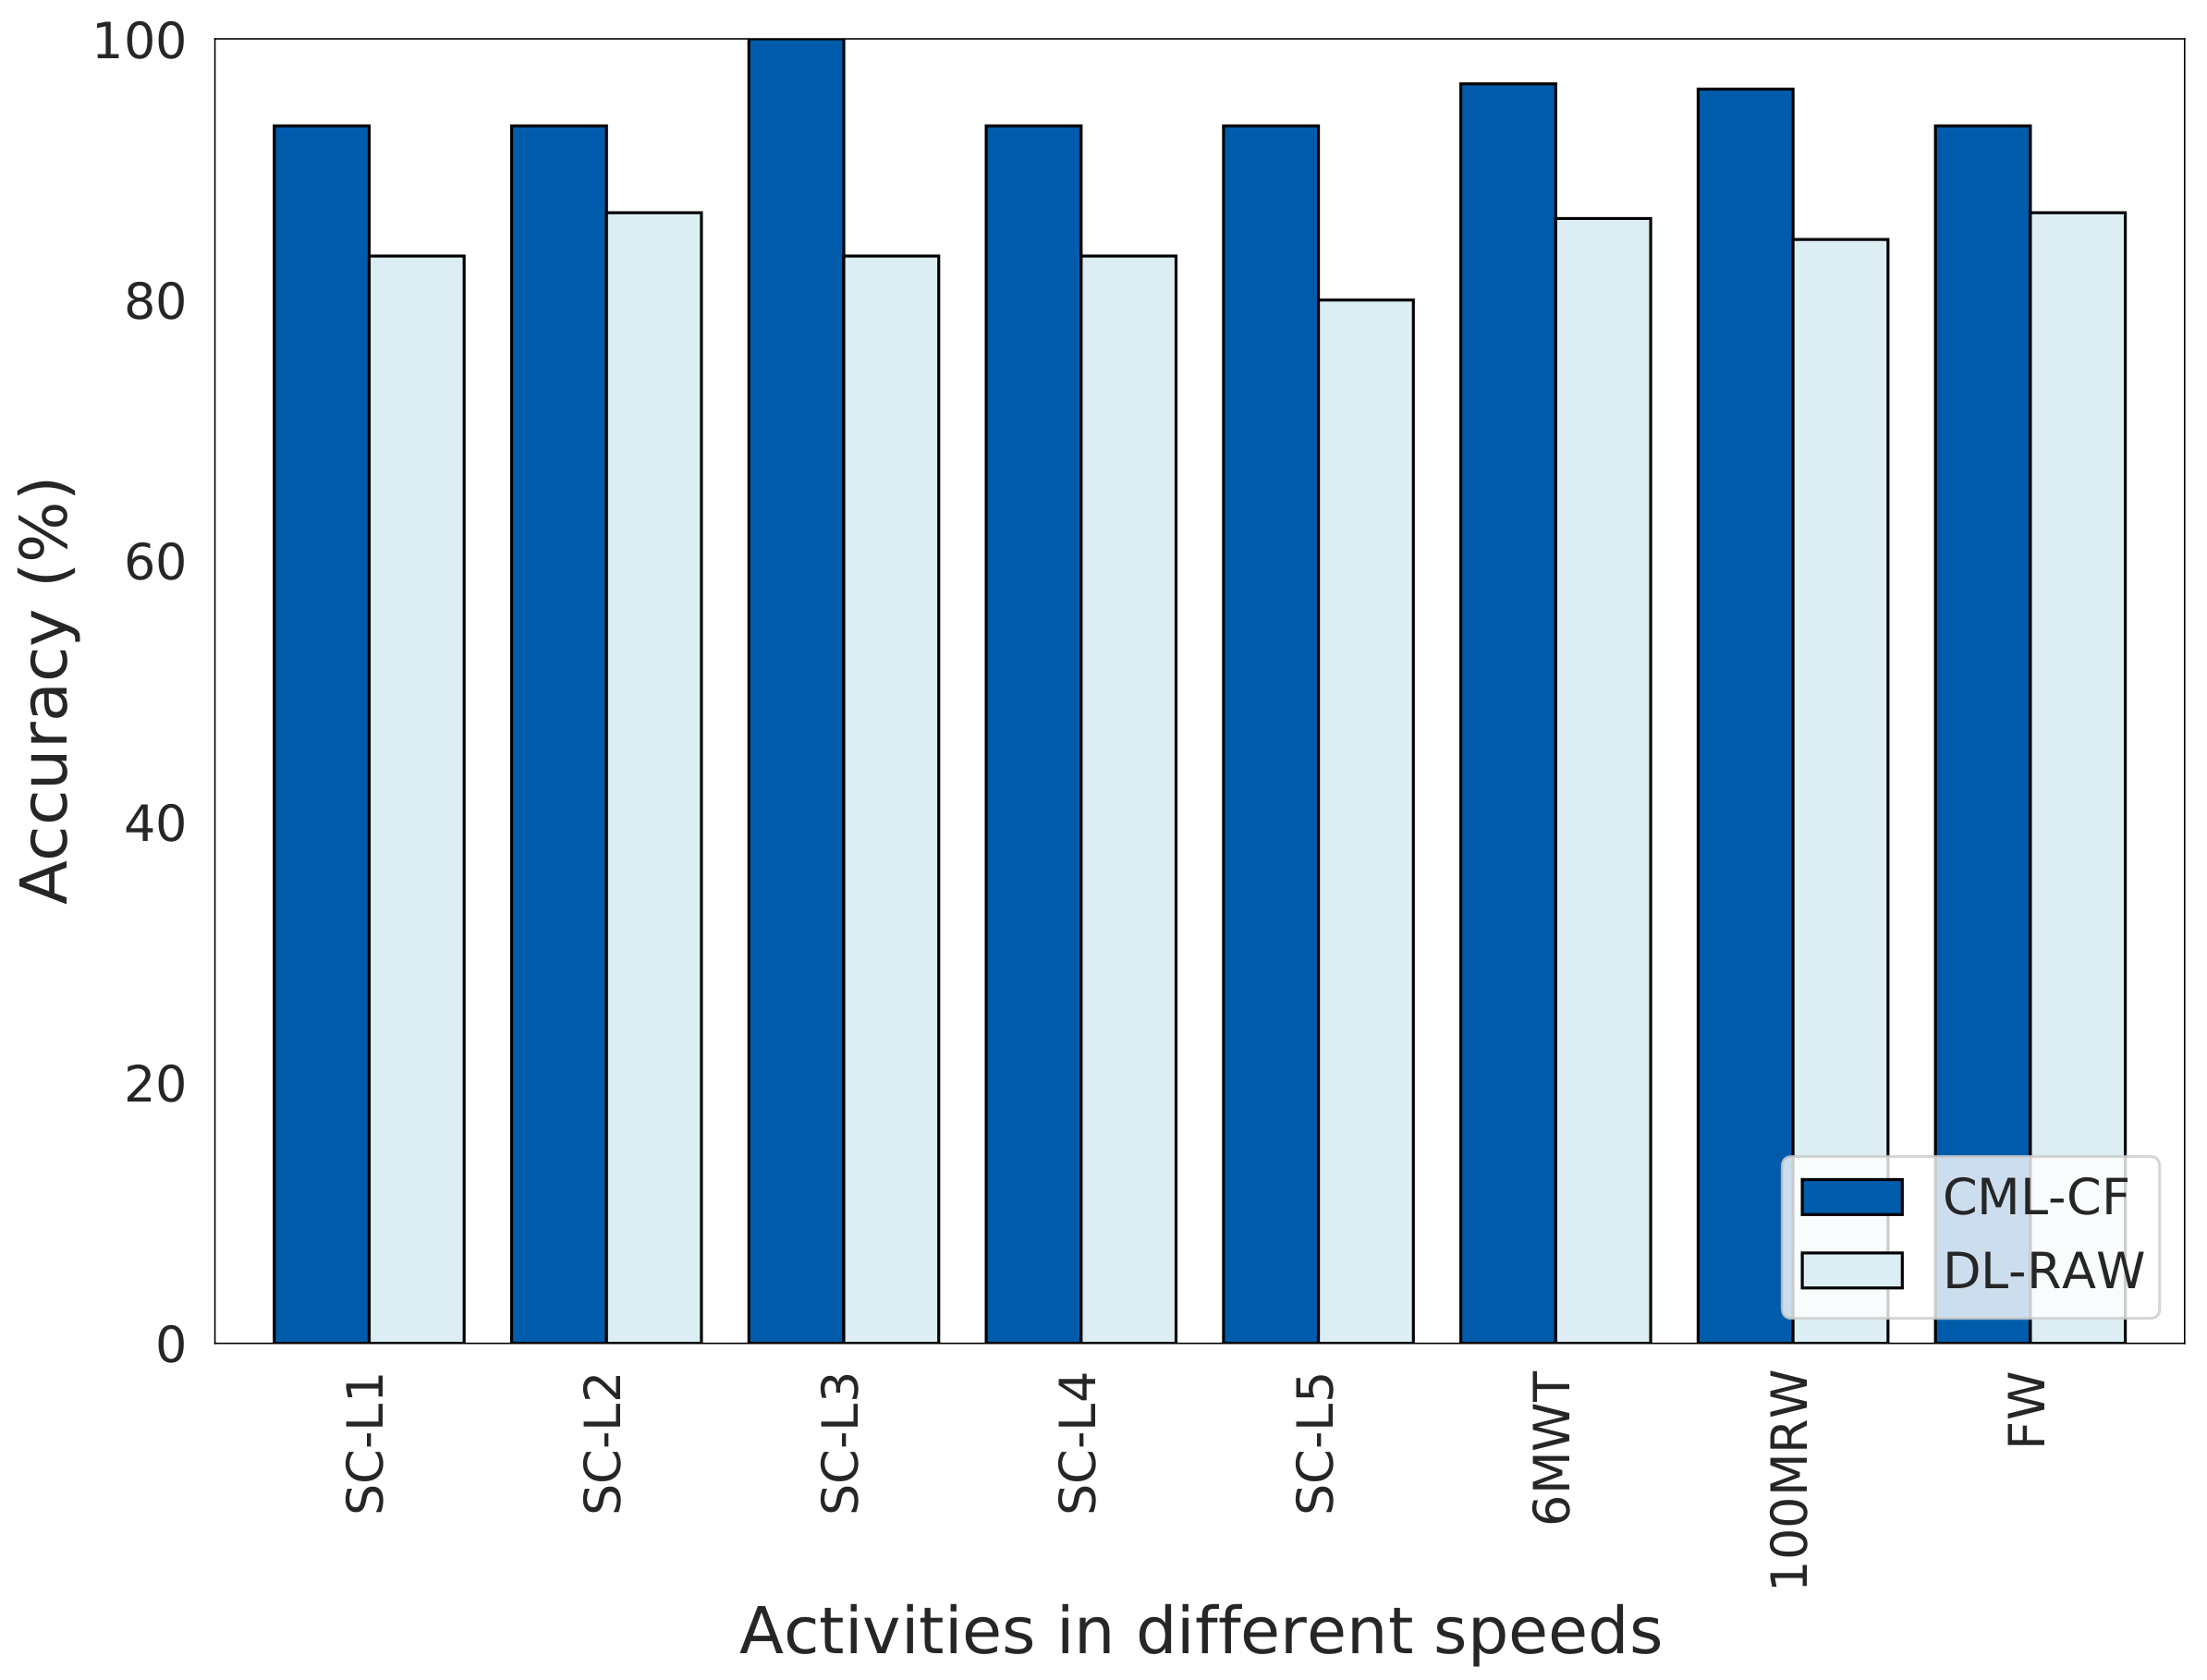
3.2. Comparison between CML-CF and DL-RAW Approaches
3.2.1. CML-CF Approach
3.2.2. DL-RAW Approach
3.3. Relationship between Extracted Step Length, Gait Speed, and Functional Ability
4. Discussions
4.1. Utility and Feasibility of CML and DL Approaches to Extracted Temporospatial Gait CFs
4.2. CML-CF Approach
4.2.1. Extracted Gait Features Are Consistent with Clinical Observations
4.2.2. Interpreting Extracted Clinical Features
4.2.3. Utility of CML Models as Classifiers
4.2.4. CML with Dimensional Reduction
4.2.5. Correlation of PCA and LDA Models with Clinical Features
4.2.6. Impact of Reduced Stride Length on Community Mobility
4.3. DL-RAW Approach
4.3.1. Evaluation of Raw Data Using DL Models
4.3.2. Time-Windowing of Raw Data
4.4. Effectiveness of CML and DL Models Differs Depending on Gait Velocity and Type of Gait
4.5. Study Limitations
5. Conclusions
Author Contributions
Funding
Institutional Review Board Statement
Informed Consent Statement
Data Availability Statement
Acknowledgments
Conflicts of Interest
References
- Emery, A.E. Population frequencies of inherited neuromuscular diseases—A world survey. Neuromuscul. Disord. 1991, 1, 19–29. [Google Scholar] [CrossRef] [PubMed]
- Orso, M.; Migliore, A.; Polistena, B.; Russo, E.; Gatto, F.; Monterubbianesi, M.; d’Angela, D.; Spandonaro, F.; Pane, M. Duchenne muscular dystrophy in Italy: A systematic review of epidemiology, quality of life, treatment adherence, and economic impact. PLoS ONE 2023, 18, e0287774. [Google Scholar] [CrossRef] [PubMed]
- Kariyawasam, D.; D’Silva, A.; Mowat, D.; Russell, J.; Sampaio, H.; Jones, K.; Taylor, P.; Farrar, M. Incidence of Duchenne muscular dystrophy in the modern era; an Australian study. Eur. J. Hum. Genet. 2022, 30, 1398–1404. [Google Scholar] [CrossRef]
- Hoffman, E.P.; Brown, R.H., Jr.; Kunkel, L.M. Dystrophin: The protein product of the Duchenne muscular dystrophy locus. Cell 1987, 51, 919–928. [Google Scholar] [CrossRef]
- Thangarajh, M.; McDermott, M.P.; Guglieri, M.; Griggs, R.C. Association between neurodevelopmental impairments and motor function in Duchenne muscular dystrophy. Ann. Clin. Transl. Neurol. 2023, 10, 2285–2296. [Google Scholar] [CrossRef] [PubMed]
- Chesshyre, M.; Ridout, D.; Hashimoto, Y.; Ookubo, Y.; Torelli, S.; Maresh, K.; Ricotti, V.; Abbott, L.; Gupta, V.A.; Main, M.; et al. Investigating the role of dystrophin isoform deficiency in motor function in Duchenne muscular dystrophy. J. Cachexia Sarcopenia Muscle 2022, 13, 1360–1372. [Google Scholar] [CrossRef]
- Tavakoli, N.P.; Gruber, D.; Armstrong, N.; Chung, W.K.; Maloney, B.; Park, S.; Wynn, J.; Koval-Burt, C.; Verdade, L.; Tegay, D.H.; et al. Newborn screening for Duchenne muscular dystrophy: A two-year pilot study. Ann. Clin. Transl. Neurol. 2023, 10, 1383–1396. [Google Scholar] [CrossRef] [PubMed]
- Henderson, M.L.; Zieba, J.K.; Li, X.; Campbell, D.B.; Williams, M.R.; Vogt, D.L.; Bupp, C.P.; Edgerly, Y.M.; Rajasekaran, S.; Hartog, N.L.; et al. Gene Therapy for Genetic Syndromes: Understanding the Current State to Guide Future Care. BioTech 2024, 13, 1. [Google Scholar] [CrossRef]
- Ricotti, V.; Balasundaram, K.; Victoria, S.; Festenstein, R.; Eugenio, M.; Thomas, V.; Faisal, A. Wearable full-body motion tracking of daily-life activities predicts disease trajectory in Duchenne Muscular Dystrophy. Nat. Med. 2023, 29, 95–193. [Google Scholar] [CrossRef]
- Servais, L.; Yen, K.; Guridi, M.; Lukawy, J.; Vissière, D.; Strijbos, P. Stride velocity 95th centile: Insights into gaining regulatory qualification of the first wearable-derived digital endpoint for use in Duchenne muscular dystrophy trials. J. Neuromuscul. Dis. 2022, 9, 335–346. [Google Scholar] [CrossRef]
- Servais, L.; Eggenspieler, D.; Poleur, M.; Grelet, M.; Muntoni, F.; Strijbos, P.; Annoussamy, M. First regulatory qualification of a digital primary endpoint to measure treatment efficacy in DMD. Nat. Med. 2023, 29, 2391–2392. [Google Scholar] [CrossRef]
- Sutherland, D.H.; Olshen, R.; Cooper, L.; Wyatt, M.; Leach, J.; Mubarak, S.; Schultz, P. The pathomechanics of gait in Duchenne muscular dystrophy. Dev. Med. Child Neurol. 1981, 23, 3–22. [Google Scholar] [CrossRef] [PubMed]
- D’Angelo, M.G.; Berti, M.; Piccinini, L.; Romei, M.; Guglieri, M.; Bonato, S.; Degrate, A.; Turconi, A.C.; Bresolin, N. Gait pattern in Duchenne muscular dystrophy. Gait Posture 2009, 29, 36–41. [Google Scholar] [CrossRef] [PubMed]
- Heberer, K.; Fowler, E.; Staudt, L.; Sienko, S.; Buckon, C.E.; Bagley, A.; Sison-Williamson, M.; McDonald, C.M.; Sussman, M.D. Hip kinetics during gait are clinically meaningful outcomes in young boys with Duchenne muscular dystrophy. Gait Posture 2016, 48, 159–164. [Google Scholar] [CrossRef] [PubMed]
- Gaudreault, N.; Gravel, D.; Nadeau, S.; Houde, S.; Gagnon, D. Gait patterns comparison of children with Duchenne muscular dystrophy to those of control subjects considering the effect of gait velocity. Gait Posture 2010, 32, 342–347. [Google Scholar] [CrossRef] [PubMed]
- Connolly, A.M.; Florence, J.M.; Cradock, M.M.; Malkus, E.C.; Schierbecker, J.R.; Siener, C.A.; Wulf, C.O.; Anand, P.; Golumbek, P.T.; Zaidman, C.M.; et al. Motor and cognitive assessment of infants and young boys with Duchenne Muscular Dystrophy: Results from the Muscular Dystrophy Association DMD Clinical Research Network. Neuromuscul. Disord. 2013, 23, 529–539. [Google Scholar] [CrossRef] [PubMed]
- Fowler, E.G.; Staudt, L.A.; Heberer, K.R.; Sienko, S.E.; Buckon, C.E.; Bagley, A.M.; Sussman, M.D.; McDonald, C.M. Longitudinal community walking activity in Duchenne muscular dystrophy. Muscle Nerve 2018, 57, 401–406. [Google Scholar] [CrossRef] [PubMed]
- Chen, S.; Lach, J.; Lo, B.; Yang, G.Z. Toward pervasive gait analysis with wearable sensors: A systematic review. IEEE J. Biomed. Health Inform. 2016, 20, 1521–1537. [Google Scholar] [CrossRef] [PubMed]
- Jarchi, D.; Pope, J.; Lee, T.K.; Tamjidi, L.; Mirzaei, A.; Sanei, S. A review on accelerometry-based gait analysis and emerging clinical applications. IEEE Rev. Biomed. Eng. 2018, 11, 177–194. [Google Scholar] [CrossRef]
- Tanawongsuwan, R.; Bobick, A. Performance analysis of time-distance gait parameters under different speeds. In Proceedings of the International Conference on Audio-and Video-Based Biometric Person Authentication, Guildford, UK, 9–11 June 2003; Springer: Berlin/Heidelberg, Germany, 2003; pp. 715–724. [Google Scholar]
- Henmi, O.; Shiba, Y.; Saito, T.; Tsuruta, H.; Takeuchi, A.; Shirataka, M.; Obuchi, S.; Kojima, M.; Ikeda, N. Spectral analysis of gait variability of stride interval time series: Comparison of young, elderly and Parkinson’s disease patients. J. Phys. Ther. Sci. 2009, 21, 105–111. [Google Scholar] [CrossRef]
- Staab, W.; Hottowitz, R.; Sohns, C.; Sohns, J.M.; Gilbert, F.; Menke, J.; Niklas, A.; Lotz, J. Accelerometer and gyroscope based gait analysis using spectral analysis of patients with osteoarthritis of the knee. J. Phys. Ther. Sci. 2014, 26, 997–1002. [Google Scholar] [CrossRef]
- Mignardot, J.B.; Deschamps, T.; Barrey, E.; Auvinet, B.; Berrut, G.; Cornu, C.; Constans, T.; Dedecker, L. Gait disturbances as specific predictive markers of the first fall onset in elderly people: A two-year prospective observational study. Front. Aging Neurosci. 2014, 6, 22. [Google Scholar] [CrossRef] [PubMed]
- Barthélémy, I.; Barrey, E.; Thibaud, J.L.; Uriarte, A.; Voit, T.; Blot, S.; Hogrel, J.Y. Gait analysis using accelerometry in dystrophin-deficient dogs. Neuromuscul. Disord. 2009, 19, 788–796. [Google Scholar] [CrossRef] [PubMed]
- Ganea, R.; Jeannet, P.Y.; Paraschiv-Ionescu, A.; Goemans, N.M.; Piot, C.; Van den Hauwe, M.; Aminian, K. Gait assessment in children with duchenne muscular dystrophy during long-distance walking. J. Child Neurol. 2012, 27, 30–38. [Google Scholar] [CrossRef] [PubMed]
- Ramasamy Ramamurthy, S.; Roy, N. Recent trends in machine learning for human activity recognition—A survey. Wiley Interdiscip. Rev. Data Min. Knowl. Discov. 2018, 8, e1254. [Google Scholar] [CrossRef]
- Hossain Arib, S.; Akter, R.; Shahid, O.; Ahad, M.A.R. Classical machine learning approach for human activity recognition using location data. In Proceedings of the Adjunct Proceedings of the 2021 ACM International Joint Conference on Pervasive and Ubiquitous Computing and Proceedings of the 2021 ACM International Symposium on Wearable Computers, Virtual, 21–26 September 2021; pp. 340–345. [Google Scholar]
- Dong, S.; Wang, P.; Abbas, K. A survey on deep learning and its applications. Comput. Sci. Rev. 2021, 40, 100379. [Google Scholar] [CrossRef]
- Pouyanfar, S.; Sadiq, S.; Yan, Y.; Tian, H.; Tao, Y.; Reyes, M.P.; Shyu, M.L.; Chen, S.C.; Iyengar, S.S. A survey on deep learning: Algorithms, techniques, and applications. ACM Comput. Surv. (CSUR) 2018, 51, 1–36. [Google Scholar] [CrossRef]
- Alom, M.Z.; Taha, T.M.; Yakopcic, C.; Westberg, S.; Sidike, P.; Nasrin, M.S.; Hasan, M.; Van Essen, B.C.; Awwal, A.A.; Asari, V.K. A state-of-the-art survey on deep learning theory and architectures. Electronics 2019, 8, 292. [Google Scholar] [CrossRef]
- Kwapisz, J.R.; Weiss, G.M.; Moore, S.A. Activity recognition using cell phone accelerometers. ACM SigKDD Explor. Newsl. 2011, 12, 74–82. [Google Scholar] [CrossRef]
- Lee, R.Y.; Carlisle, A.J. Detection of falls using accelerometers and mobile phone technology. Age Ageing 2011, 40, 690–696. [Google Scholar] [CrossRef]
- Marquardt, P.; Verma, A.; Carter, H.; Traynor, P. (sp) iphone: Decoding vibrations from nearby keyboards using mobile phone accelerometers. In Proceedings of the 18th ACM Conference on Computer and Communications Security, Chicago, IL, USA, 17–21 October 2011; pp. 551–562. [Google Scholar]
- Akimura, D.; Kawahara, Y.; Asami, T. Compressed sensing method for human activity sensing using mobile phone accelerometers. In Proceedings of the 2012 Ninth International Conference on Networked Sensing (INSS), Antwerp, Belgium, 11–14 June 2012; pp. 1–4. [Google Scholar]
- Sun, L.; Zhang, D.; Li, B.; Guo, B.; Li, S. Activity recognition on an accelerometer embedded mobile phone with varying positions and orientations. In Proceedings of the Ubiquitous Intelligence and Computing: 7th International Conference, UIC 2010, Xi’an, China, 26–29 October 2010; Proceedings 7. Springer: Berlin/Heidelberg, Germany, 2010; pp. 548–562. [Google Scholar]
- Brezmes, T.; Gorricho, J.L.; Cotrina, J. Activity recognition from accelerometer data on a mobile phone. In Proceedings of the Distributed Computing, Artificial Intelligence, Bioinformatics, Soft Computing, and Ambient Assisted Living: 10th International Work-Conference on Artificial Neural Networks, IWANN 2009 Workshops, Salamanca, Spain, 10–12 June 2009; Proceedings, Part II 10. Springer: Berlin/Heidelberg, Germany, 2009; pp. 796–799. [Google Scholar]
- Thang, H.M.; Viet, V.Q.; Thuc, N.D.; Choi, D. Gait identification using accelerometer on mobile phone. In Proceedings of the 2012 International Conference on Control, Automation and Information Sciences (ICCAIS), Saigon, Vietnam, 26–29 November 2012; pp. 344–348. [Google Scholar]
- Ramli, A.A.; Liu, X.; Henricson, E.K. Walk4Me: Telehealth Community Mobility Assessment, An Automated System for Early Diagnosis and Disease Progression. arXiv 2023, arXiv:2305.05543. [Google Scholar]
- de Almeida Mendes, M.; da Silva, I.C.; Ramires, V.V.; Reichert, F.F.; Martins, R.C.; Tomasi, E. Calibration of raw accelerometer data to measure physical activity: A systematic review. Gait Posture 2018, 61, 98–110. [Google Scholar] [CrossRef] [PubMed]
- Vähä-Ypyä, H.; Vasankari, T.; Husu, P.; Suni, J.; Sievänen, H. A universal, accurate intensity-based classification of different physical activities using raw data of accelerometer. Clin. Physiol. Funct. Imaging 2015, 35, 64–70. [Google Scholar] [CrossRef] [PubMed]
- Ahmadi, M.N.; Pfeiffer, K.A.; Trost, S.G. Physical activity classification in youth using raw accelerometer data from the hip. Meas. Phys. Educ. Exerc. Sci. 2020, 24, 129–136. [Google Scholar] [CrossRef]
- LeCun, Y.; Bengio, Y.; Hinton, G. Deep Learning. Nature 2015, 521, 436–444. [Google Scholar] [CrossRef] [PubMed]
- Ramli, A.A.; Liu, X.; Berndt, K.; Chuah, C.N.; Goude, E.; Kaethler, L.B.; Lopez, A.; Nicorici, A.; Owens, C.; Rodriguez, D.; et al. Automated Detection of Gait Events and Travel Distance Using Waist-worn Accelerometers across a Typical Range of Walking and Running Speeds. arXiv 2023, arXiv:2307.04866. [Google Scholar]
- De Sanctis, R.; Pane, M.; Sivo, S.; Ricotti, V.; Baranello, G.; Frosini, S.; Mazzone, E.; Bianco, F.; Fanelli, L.; Main, M.; et al. Suitability of North Star Ambulatory Assessment in young boys with Duchenne muscular dystrophy. Neuromuscul. Disord. 2015, 25, 14–18. [Google Scholar] [CrossRef] [PubMed]
- Mcdonald, C.M.; Henricson, E.K.; Abresch, R.T.; Florence, J.M.; Eagle, M.; Gappmaier, E.; Glanzman, A.M.; PTC124-GD-007-DMD Study Group; Spiegel, R.; Barth, J.; et al. The 6-minute walk test and other endpoints in Duchenne muscular dystrophy: Longitudinal natural history observations over 48 weeks from a multicenter study. Muscle Nerve 2013, 48, 343–356. [Google Scholar] [CrossRef]
- Alfano, L.N.; Miller, N.F.; Berry, K.M.; Yin, H.; Rolf, K.E.; Flanigan, K.M.; Mendell, J.R.; Lowes, L.P. The 100-meter timed test: Normative data in healthy males and comparative pilot outcome data for use in Duchenne muscular dystrophy clinical trials. Neuromuscul. Disord. 2017, 27, 452–457. [Google Scholar] [CrossRef]
- Mazzone, E.; Messina, S.; Vasco, G.; Main, M.; Eagle, M.; D’Amico, A.; Doglio, L.; Politano, L.; Cavallaro, F.; Frosini, S.; et al. Reliability of the North Star Ambulatory Assessment in a multicentric setting. Neuromuscul. Disord. 2009, 19, 458–461. [Google Scholar] [CrossRef]
- Fraysse, B.; Barthélémy, I.; Qannari, E.M.; Rouger, K.; Thorin, C.; Blot, S.; Le Guiner, C.; Cherel, Y.; Hogrel, J.Y. Gait characterization in golden retriever muscular dystrophy dogs using linear discriminant analysis. BMC Musculoskelet. Disord. 2017, 18, 153. [Google Scholar] [CrossRef] [PubMed]
- Barthélémy, I.; Barrey, E.; Aguilar, P.; Uriarte, A.; Chevoir, M.; Thibaud, J.L.; Voit, T.; Blot, S.; Hogrel, J.Y. Longitudinal Ambulatory Measurements of Gait Abnormality in Dystrophin-Deficient Dogs. BMC Musculoskelet. Disord. 2011, 12, 75. [Google Scholar] [CrossRef] [PubMed]
- Sprager, S.; Zazula, D. A cumulant-based method for gait identification using accelerometer data with principal component analysis and support vector machine. WSEAS Trans. Signal Process. 2009, 5, 369–378. [Google Scholar]
- Marasović, T.; Papić, V. Accelerometer-based gesture classification using principal component analysis. In Proceedings of the SoftCOM 2011, 19th International Conference on Software, Telecommunications and Computer Networks, Split, Croatia, 15–17 September 2011; pp. 1–5. [Google Scholar]
- Mao, C.; Li, Y.; Sun, F. Accelerometer-based gait recognition using PCA & LDA algorithms. In Proceedings of the 2018 IEEE 23rd International Conference on Digital Signal Processing (DSP), Shanghai, China, 19–21 November 2018; pp. 1–4. [Google Scholar]
- Khan, A.M.; Lee, Y.K.; Lee, S.Y.; Kim, T.S. Human activity recognition via an accelerometer-enabled-smartphone using kernel discriminant analysis. In Proceedings of the 2010 5th International Conference on Future Information Technology, Busan, Republic of Korea, 21–23 May 2010; pp. 1–6. [Google Scholar]
- Cui, Z.; Chen, W.; Chen, Y. Multi-scale convolutional neural networks for time series classification. arXiv 2016, arXiv:1603.06995. [Google Scholar]
- Le Guennec, A.; Malinowski, S.; Tavenard, R. Data augmentation for time series classification using convolutional neural networks. In Proceedings of the ECML/PKDD Workshop on Advanced Analytics and Learning on Temporal Data, Porto, Portugal, 19–23 September 2016. [Google Scholar]
- Shin, H.; Roth, H.R.; Gao, M.; Lu, L.; Xu, Z.; Nogues, I.; Yao, J.; Mollura, D.; Summers, R.M. Deep Convolutional Neural Networks for Computer-Aided Detection: CNN Architectures, Dataset Characteristics and Transfer Learning. IEEE Trans. Med. Imaging 2016, 35, 1285–1298. [Google Scholar] [CrossRef] [PubMed]
- Miotto, R.; Wang, F.; Wang, S.; Jiang, X.; Dudley, J.T. Deep learning for healthcare: Review, opportunities and challenges. Briefings Bioinform. 2018, 19, 1236–1246. [Google Scholar] [CrossRef] [PubMed]
- McDonald, C.M.; Widman, L.M.; Walsh, D.D.; Walsh, S.A.; Abresch, R.T. Use of step activity monitoring for continuous physical activity assessment in boys with Duchenne muscular dystrophy. Arch. Phys. Med. Rehabil. 2005, 86, 802–808. [Google Scholar] [CrossRef]
- Lott, D.J.; Taivassalo, T.; Senesac, C.R.; Willcocks, R.J.; Harrington, A.M.; Zilke, K.; Cunkle, H.; Powers, C.; Finanger, E.L.; Rooney, W.D.; et al. Walking activity in a large cohort of boys with Duchenne muscular dystrophy. Muscle Nerve 2021, 63, 192–198. [Google Scholar] [CrossRef]
- Conger, S.A.; Toth, L.P.; Cretsinger, C.; Raustorp, A.; Mitáš, J.; Inoue, S.; Bassett, D.R. Time trends in physical activity using wearable devices: A systematic review and meta-analysis of studies from 1995 to 2017. Med. Sci. Sport. Exerc. 2022, 54, 288–298. [Google Scholar] [CrossRef]
- Kuczmarski, R.J.; Ogden, C.L.; Guo, S.S.; Grummer-Strawn, L.M.; Flegal, K.M.; Mei, Z.; Wei, R.; Curtin, L.R.; Roche, A.F.; Johnson, C.L. 2000 CDC Growth Charts for the United States: Methods and development. In Vital and Health Statistics. Series 11, Data from the National Health Survey; Department of Health and Human Services: Hyattsville, MD, USA, 2002; pp. 1–190. [Google Scholar]


| Case | Value | Age | Weight | Height | NSAA |
|---|---|---|---|---|---|
| (Status) | (Years) | (kg) | (cm) | (/34) | |
| Mean | 9.5 | 37.7 | 127.1 | 20.5 | |
| DMD | (SD) | (3.9) | (16.0) | (16.2) | (8.2) |
| (N = 15) | Min | 3 | 17.2 | 101.6 | 8.0 |
| Max | 16 | 67.7 | 153.3 | 34.0 | |
| Mean | 7.7 | 34.2 | 130.8 | 33.8 | |
| TD | (SD) | (3.0) | (21.6) | (15.8) | (0.8) |
| (N = 15) | Min | 4 | 18.6 | 108.5 | 31.0 |
| Max | 15 | 101.0 | 165.5 | 34.0 | |
| p-value | 0.1664 | 0.6229 | 0.5331 | <0.0001 |
| Temporospatial Gait Clinical Features (CFs) | ||||||||||
|---|---|---|---|---|---|---|---|---|---|---|
| Activities | Case | Value | SP (%) | SF | SL (%) | TP | VP (%) | MP (%) | AP (%) | FI |
| TD | Mean | 0.35 | 1.29 | 0.27 | 64.84 | 28.45 | 36.24 | 35.31 | 11.54 | |
| (SD) | (0.06) | (0.19) | (0.02) | (48.52) | (4.07) | (7.22) | (5.45) | (8.94) | ||
| SC-L1 | DMD | Mean | 0.26 | 1.12 | 0.23 | 62.0 | 27.82 | 42.1 | 30.08 | 5.79 |
| (SD) | (0.1) | (0.32) | (0.04) | (92.77) | (5.48) | (6.17) | (4.36) | (6.95) | ||
| p-value | 0.0077 | 0.093 | 0.0004 | 0.9172 | 0.7246 | 0.0239 | 0.0072 | 0.0594 | ||
| TD | Mean | 0.55 | 1.62 | 0.34 | 155.3 | 31.48 | 34.29 | 34.23 | 16.02 | |
| (SD) | (0.07) | (0.16) | (0.02) | (104.07) | (7.78) | (8.4) | (5.63) | (13.4) | ||
| SC-L2 | DMD | Mean | 0.46 | 1.58 | 0.29 | 170.27 | 28.25 | 40.16 | 31.59 | 9.85 |
| (SD) | (0.12) | (0.31) | (0.03) | (179.9) | (6.2) | (6.8) | (6.63) | (11.03) | ||
| p-value | 0.0139 | 0.6133 | <0.0001 | 0.7823 | 0.22 | 0.0445 | 0.2487 | 0.1801 | ||
| TD | Mean | 0.76 | 1.89 | 0.4 | 355.84 | 36.93 | 31.36 | 31.7 | 19.54 | |
| (SD) | (0.12) | (0.23) | (0.02) | (255.55) | (10.22) | (7.9) | (5.72) | (16.06) | ||
| SC-L3 | DMD | Mean | 0.63 | 1.89 | 0.33 | 334.35 | 30.16 | 39.32 | 30.52 | 14.05 |
| (SD) | (0.1) | (0.24) | (0.03) | (317.31) | (5.98) | (7.48) | (5.79) | (13.76) | ||
| p-value | 0.0024 | 0.9457 | <0.0001 | 0.8396 | 0.0348 | 0.0085 | 0.5786 | 0.323 | ||
| TD | Mean | 1.28 | 2.55 | 0.5 | 1907.94 | 38.92 | 30.94 | 30.14 | 58.39 | |
| (SD) | (0.24) | (0.32) | (0.04) | (1690.83) | (8.75) | (8.73) | (5.84) | (58.04) | ||
| SC-L4 | DMD | Mean | 0.94 | 2.4 | 0.39 | 1807.78 | 29.07 | 40.11 | 30.83 | 49.58 |
| (SD) | (0.28) | (0.51) | (0.06) | (3060.77) | (10.71) | (9.29) | (3.86) | (65.31) | ||
| p-value | 0.0016 | 0.3496 | <0.0001 | 0.9125 | 0.0101 | 0.0095 | 0.7091 | 0.6992 | ||
| TD | Mean | 2.44 | 3.61 | 0.67 | 9219.81 | 50.13 | 21.53 | 28.34 | 93.53 | |
| (SD) | (0.48) | (0.52) | (0.09) | (6775.47) | (8.93) | (10.08) | (10.09) | (71.93) | ||
| SC-L5 | DMD | Mean | 1.22 | 2.82 | 0.42 | 4235.65 | 35.67 | 35.01 | 29.32 | 68.55 |
| (SD) | (0.48) | (0.73) | (0.07) | (5913.64) | (13.68) | (10.86) | (9.18) | (88.33) | ||
| p-value | <0.0001 | 0.002 | <0.0001 | 0.0406 | 0.0019 | 0.0015 | 0.7822 | 0.4029 | ||
| TD | Mean | 1.18 | 2.36 | 0.5 | 1521.86 | 41.68 | 29.51 | 28.81 | 915.74 | |
| (SD) | (0.11) | (0.17) | (0.03) | (1054.76) | (11.07) | (9.01) | (6.71) | (677.16) | ||
| 6MWT | DMD | Mean | 0.79 | 2.05 | 0.38 | 992.04 | 31.61 | 38.79 | 29.6 | 840.77 |
| (SD) | (0.25) | (0.39) | (0.06) | (1441.95) | (6.02) | (6.93) | (5.46) | (1210.56) | ||
| p-value | <0.0001 | 0.0088 | <0.0001 | 0.2664 | 0.0056 | 0.0046 | 0.7327 | 0.837 | ||
| TD | Mean | 2.27 | 3.39 | 0.67 | 8402.12 | 52.89 | 18.05 | 29.06 | 480.5 | |
| (SD) | (0.4) | (0.47) | (0.08) | (5348.93) | (8.86) | (9.36) | (10.53) | (410.11) | ||
| 100MRW | DMD | Mean | 1.1 | 2.57 | 0.42 | 2944.45 | 39.68 | 34.82 | 25.51 | 599.57 |
| (SD) | (0.42) | (0.67) | (0.07) | (5073.6) | (17.19) | (12.28) | (7.58) | (955.96) | ||
| p-value | <0.0001 | 0.0013 | <0.0001 | 0.0148 | 0.0172 | 0.0006 | 0.3512 | 0.6685 | ||
| TD | Mean | 0.83 | 1.96 | 0.42 | 617.5 | 41.38 | 28.46 | 30.17 | 321.34 | |
| (SD) | (0.16) | (0.29) | (0.04) | (478.61) | (8.92) | (7.49) | (4.87) | (263.17) | ||
| FW | DMD | Mean | 0.61 | 1.83 | 0.33 | 529.12 | 32.87 | 36.47 | 30.66 | 638.46 |
| (SD) | (0.18) | (0.42) | (0.06) | (983.01) | (8.51) | (6.99) | (7.19) | (1252.37) | ||
| p-value | 0.0015 | 0.3626 | <0.0001 | 0.7565 | 0.0124 | 0.0052 | 0.826 | 0.3454 | ||
| TD | Mean | 1.21 | 2.33 | 0.47 | 2780.65 | 40.23 | 28.8 | 30.97 | 239.57 | |
| (SD) | (0.76) | (0.83) | (0.14) | (4680.29) | (11.6) | (10.13) | (7.35) | (417.76) | ||
| All | DMD | Mean | 0.74 | 2.01 | 0.35 | 1333.61 | 31.62 | 38.47 | 29.91 | 262.26 |
| (SD) | (0.4) | (0.69) | (0.08) | (3175.88) | (10.1) | (8.54) | (6.43) | (740.37) | ||
| p-value | <0.0001 | 0.0016 | <0.0001 | 0.0062 | <0.0001 | <0.0001 | 0.2423 | 0.7714 | ||
| CML-CF | DL-RAW | |||||
|---|---|---|---|---|---|---|
| Activities | Alg. | CML | PCA | LDA | TW * | CNN |
| (%) | (%) | (%) | (Samples) | (%) | ||
| SC-L1 | RF | 76.67 | 86.67 | 93.33 | 30 | 79.98 |
| DT | 66.67 | 80.0 | 93.33 | 50 | 83.35 | |
| SVM | 73.33 | 73.33 | 93.33 | 100 | 83.35 | |
| KNN | 83.33 | 73.33 | 93.33 | 150 | 79.98 | |
| GNB | 70.0 | 66.67 | 93.33 | 200 | 79.98 | |
| LR | 80.0 | 73.33 | 93.33 | 250 | 79.98 | |
| SC-L2 | RF | 70.0 | 53.33 | 93.33 | 30 | 86.67 |
| DT | 70.0 | 56.67 | 93.33 | 50 | 83.35 | |
| SVM | 83.33 | 70.0 | 90.0 | 100 | 79.98 | |
| KNN | 66.67 | 70.0 | 86.67 | 150 | 76.66 | |
| GNB | 76.67 | 66.67 | 90.0 | 200 | 60.01 | |
| LR | 76.67 | 60.0 | 90.0 | 250 | 63.33 | |
| SC-L3 | RF | 90.0 | 53.33 | 100.0 | 30 | 83.35 |
| DT | 83.33 | 53.33 | 100.0 | 50 | 76.66 | |
| SVM | 70.0 | 70.0 | 96.67 | 100 | 63.33 | |
| KNN | 70.0 | 50.0 | 96.67 | 150 | 60.01 | |
| GNB | 73.33 | 70.0 | 96.67 | 200 | 63.33 | |
| LR | 80.0 | 73.33 | 100.0 | 250 | 56.69 | |
| SC-L4 | RF | 63.33 | 63.33 | 83.33 | 30 | 76.66 |
| DT | 80.0 | 70.0 | 83.33 | 50 | 83.35 | |
| SVM | 80.0 | 73.33 | 90.0 | 100 | 79.98 | |
| KNN | 76.67 | 70.0 | 83.33 | 150 | 56.69 | |
| GNB | 76.67 | 70.0 | 93.33 | 200 | 66.65 | |
| LR | 76.67 | 66.67 | 93.33 | 250 | 60.01 | |
| SC-L5 | RF | 90.0 | 66.67 | 93.33 | 30 | 79.98 |
| DT | 86.67 | 60.0 | 93.33 | 50 | 66.65 | |
| SVM | 86.67 | 83.33 | 93.33 | 100 | 56.69 | |
| KNN | 83.33 | 83.33 | 93.33 | 150 | 73.34 | |
| GNB | 86.67 | 76.67 | 93.33 | 200 | 50.0 | |
| LR | 90.0 | 83.33 | 93.33 | 250 | 73.34 | |
| 6MWT a | RF | 86.21 | 72.41 | 93.1 | 30 | 86.23 |
| DT | 86.21 | 89.66 | 93.1 | 50 | 86.23 | |
| SVM | 89.66 | 79.31 | 96.55 | 100 | 82.76 | |
| KNN | 82.76 | 82.76 | 82.76 | 150 | 82.76 | |
| GNB | 89.66 | 75.86 | 93.1 | 200 | 79.3 | |
| LR | 82.76 | 86.21 | 93.1 | 250 | 79.3 | |
| 100MRW b | RF | 88.46 | 88.46 | 92.31 | 30 | 80.76 |
| DT | 88.46 | 92.31 | 92.31 | 50 | 80.76 | |
| SVM | 88.46 | 80.77 | 96.15 | 100 | 69.24 | |
| KNN | 92.31 | 80.77 | 92.31 | 150 | 84.62 | |
| GNB | 92.31 | 88.46 | 96.15 | 200 | 80.76 | |
| LR | 92.31 | 88.46 | 92.31 | 250 | 84.62 | |
| FW | RF | 80.0 | 83.33 | 93.33 | 30 | 83.35 |
| DT | 80.0 | 76.67 | 93.33 | 50 | 86.67 | |
| SVM | 93.33 | 86.67 | 90.0 | 100 | 79.98 | |
| KNN | 83.33 | 83.33 | 86.67 | 150 | 73.34 | |
| GNB | 80.0 | 83.33 | 86.67 | 200 | 76.66 | |
| LR | 90.0 | 80.0 | 86.67 | 250 | 76.66 | |
| Temporospatial Gait Clinical Features (CFs) | |||||||||||
|---|---|---|---|---|---|---|---|---|---|---|---|
| Com. a | Act. b | Value | SP | SF | SL | TP | VP | MP | AP | FI | NSAA * |
| SC-L1 | Corr. ** (p-value) | 0.93 (<0.0001) | 0.85 (<0.0001) | 0.72 (0.0002) | 0.82 (<0.0001) | 0.03 (1.0) | −0.44 (0.5332) | 0.55 (0.0589) | 0.81 (<0.0001) | 0.56 (0.0014) | |
| SC-L2 | Corr. ** (p-value) | 0.92 (<0.0001) | 0.85 (<0.0001) | 0.61 (0.0116) | 0.83 (<0.0001) | −0.28 (1.0) | −0.32 (1.0) | 0.74 (0.0001) | 0.74 (0.0001) | 0.4 (0.0273) | |
| PC1 1 | SC-L3 | Corr. ** (p-value) | 0.93 (<0.0001) | 0.85 (<0.0001) | 0.54 (0.0679) | 0.83 (<0.0001) | 0.29 (1.0) | −0.41 (0.8368) | 0.17 (1.0) | 0.72 (0.0003) | 0.51 (0.0041) |
| SC-L4 | Corr. ** (p-value) | 0.91 (<0.0001) | 0.85 (<0.0001) | 0.66 (0.0027) | 0.83 (<0.0001) | 0.82 (<0.0001) | −0.78 (<0.0001) | −0.23 (1.0) | 0.7 (0.0007) | 0.71 (<0.0001) | |
| SC-L5 | Corr. ** (p-value) | −0.93 (<0.0001) | −0.85 (<0.0001) | −0.83 (<0.0001) | −0.89 (<0.0001) | −0.66 (0.0023) | 0.88 (<0.0001) | −0.2 (1.0) | −0.76 (<0.0001) | −0.62 (0.0002) | |
| SC-L1 | Corr. ** (p-value) | 0.12 (1.0) | 0.15 (1.0) | 0.01 (1.0) | 0.35 (1.0) | −0.76 (0.0001) | 0.89 (<0.0001) | −0.52 (0.1481) | 0.14 (1.0) | −0.28 (0.1278) | |
| SC-L2 | Corr. ** (p-value) | 0.19 (1.0) | 0.11 (1.0) | 0.2 (1.0) | −0.43 (0.7552) | 0.85 (<0.0001) | −0.9 (<0.0001) | 0.19 (1.0) | −0.4 (1.0) | 0.19 (0.3069) | |
| PC2 2 | SC-L3 | Corr. ** (p-value) | 0.19 (1.0) | −0.32 (1.0) | 0.57 (0.0485) | −0.53 (0.1187) | 0.85 (<0.0001) | −0.72 (0.0003) | −0.25 (1.0) | −0.57 (0.0453) | 0.3 (0.1049) |
| SC-L4 | Corr. ** (p-value) | −0.19 (1.0) | 0.3 (1.0) | −0.61 (0.0144) | 0.27 (1.0) | −0.12 (1.0) | 0.45 (0.603) | −0.65 (0.004) | 0.29 (1.0) | −0.41 (0.0253) | |
| SC-L5 | Corr. ** (p-value) | −0.09 (1.0) | −0.17 (1.0) | 0.05 (1.0) | −0.42 (0.9396) | 0.56 (0.0645) | 0.11 (1.0) | −0.93 (<0.0001) | −0.54 (0.0945) | 0.29 (0.1268) | |
| SC-L1 | Corr. ** (p-value) | −0.54 (0.0695) | −0.35 (1.0) | −0.7 (0.0007) | −0.04 (1.0) | −0.07 (1.0) | 0.47 (0.3336) | −0.55 (0.0601) | −0.42 (0.7212) | −0.72 (<0.0001) | |
| SC-L2 | Corr. ** (p-value) | −0.51 (0.1305) | −0.11 (1.0) | −0.78 (<0.0001) | 0.05 (1.0) | −0.26 (1.0) | 0.42 (0.7424) | −0.25 (1.0) | −0.3 (1.0) | −0.63 (0.0002) | |
| LDA | SC-L3 | Corr. ** (p-value) | −0.64 (0.0054) | −0.02 (1.0) | −0.91 (<0.0001) | −0.05 (1.0) | −0.46 (0.3801) | 0.56 (0.044) | −0.23 (1.0) | −0.68 (<0.0001) | |
| SC-L4 | Corr. ** (p-value) | −0.65 (0.004) | −0.19 (1.0) | −0.89 (<0.0001) | −0.01 (1.0) | −0.54 (0.0732) | 0.54 (0.0795) | 0.1 (1.0) | −0.07 (1.0) | −0.79 (<0.0001) | |
| SC-L5 | Corr. ** (p-value) | −0.87 (<0.0001) | −0.59 (0.0195) | −0.92 (<0.0001) | −0.42 (0.8081) | −0.59 (0.0204) | 0.61 (0.0134) | 0.05 (1.0) | −0.18 (1.0) | −0.67 (0.0001) | |
Disclaimer/Publisher’s Note: The statements, opinions and data contained in all publications are solely those of the individual author(s) and contributor(s) and not of MDPI and/or the editor(s). MDPI and/or the editor(s) disclaim responsibility for any injury to people or property resulting from any ideas, methods, instructions or products referred to in the content. |
© 2024 by the authors. Licensee MDPI, Basel, Switzerland. This article is an open access article distributed under the terms and conditions of the Creative Commons Attribution (CC BY) license (https://creativecommons.org/licenses/by/4.0/).
Share and Cite
Ramli, A.A.; Liu, X.; Berndt, K.; Goude, E.; Hou, J.; Kaethler, L.B.; Liu, R.; Lopez, A.; Nicorici, A.; Owens, C.; et al. Gait Characterization in Duchenne Muscular Dystrophy (DMD) Using a Single-Sensor Accelerometer: Classical Machine Learning and Deep Learning Approaches. Sensors 2024, 24, 1123. https://doi.org/10.3390/s24041123
Ramli AA, Liu X, Berndt K, Goude E, Hou J, Kaethler LB, Liu R, Lopez A, Nicorici A, Owens C, et al. Gait Characterization in Duchenne Muscular Dystrophy (DMD) Using a Single-Sensor Accelerometer: Classical Machine Learning and Deep Learning Approaches. Sensors. 2024; 24(4):1123. https://doi.org/10.3390/s24041123
Chicago/Turabian StyleRamli, Albara Ah, Xin Liu, Kelly Berndt, Erica Goude, Jiahui Hou, Lynea B. Kaethler, Rex Liu, Amanda Lopez, Alina Nicorici, Corey Owens, and et al. 2024. "Gait Characterization in Duchenne Muscular Dystrophy (DMD) Using a Single-Sensor Accelerometer: Classical Machine Learning and Deep Learning Approaches" Sensors 24, no. 4: 1123. https://doi.org/10.3390/s24041123
APA StyleRamli, A. A., Liu, X., Berndt, K., Goude, E., Hou, J., Kaethler, L. B., Liu, R., Lopez, A., Nicorici, A., Owens, C., Rodriguez, D., Wang, J., Zhang, H., Aranki, D., McDonald, C. M., & Henricson, E. K. (2024). Gait Characterization in Duchenne Muscular Dystrophy (DMD) Using a Single-Sensor Accelerometer: Classical Machine Learning and Deep Learning Approaches. Sensors, 24(4), 1123. https://doi.org/10.3390/s24041123