


Improving Balance and Movement Control in Fencing Using IoT and Real-Time Sensorial Feedback †


Abstract
:1. Introduction
2. Materials and Methods
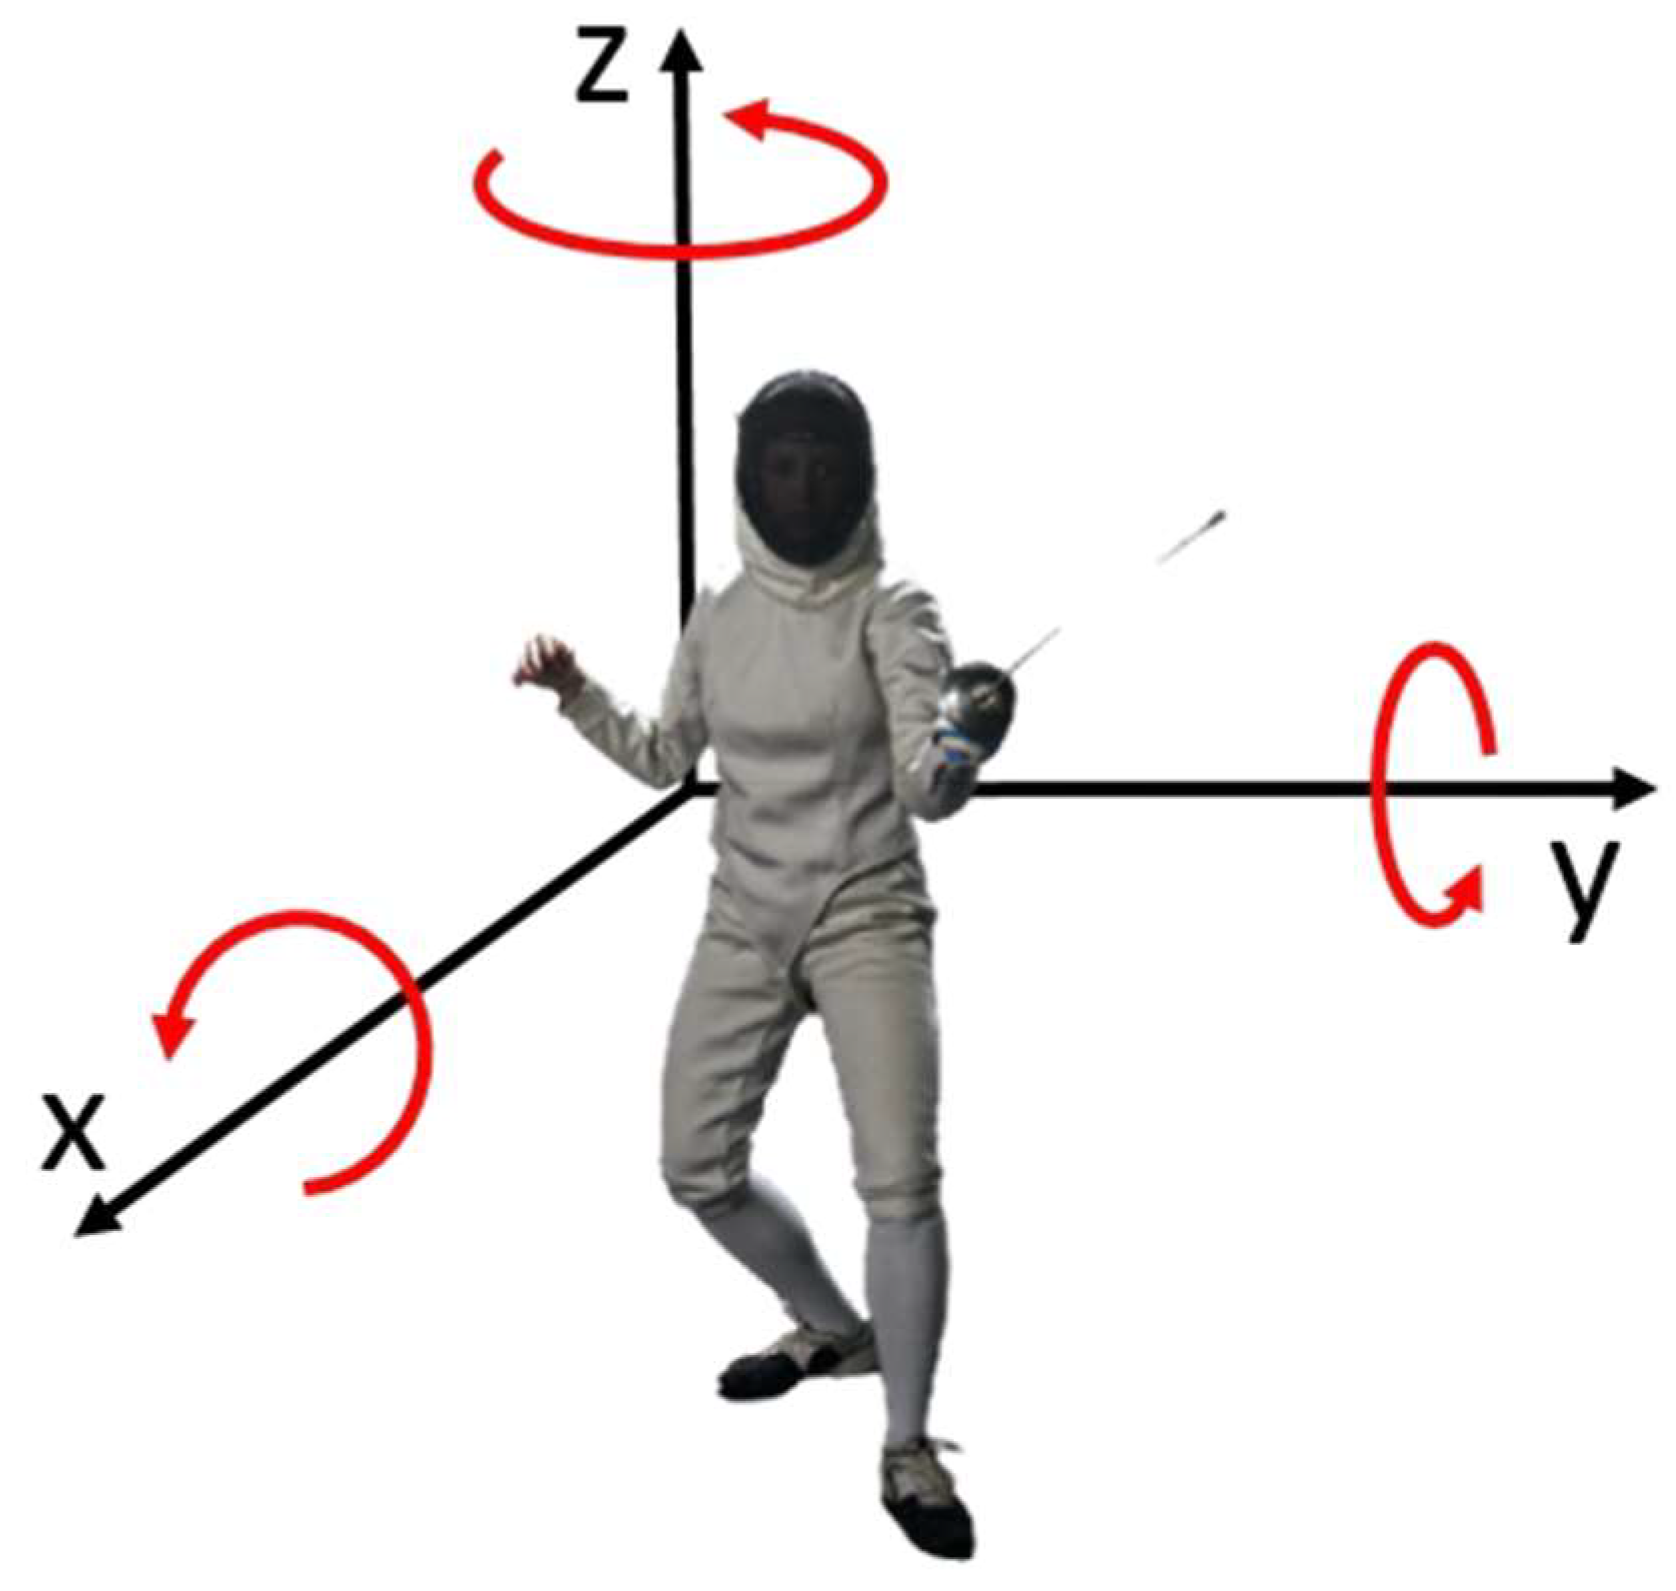
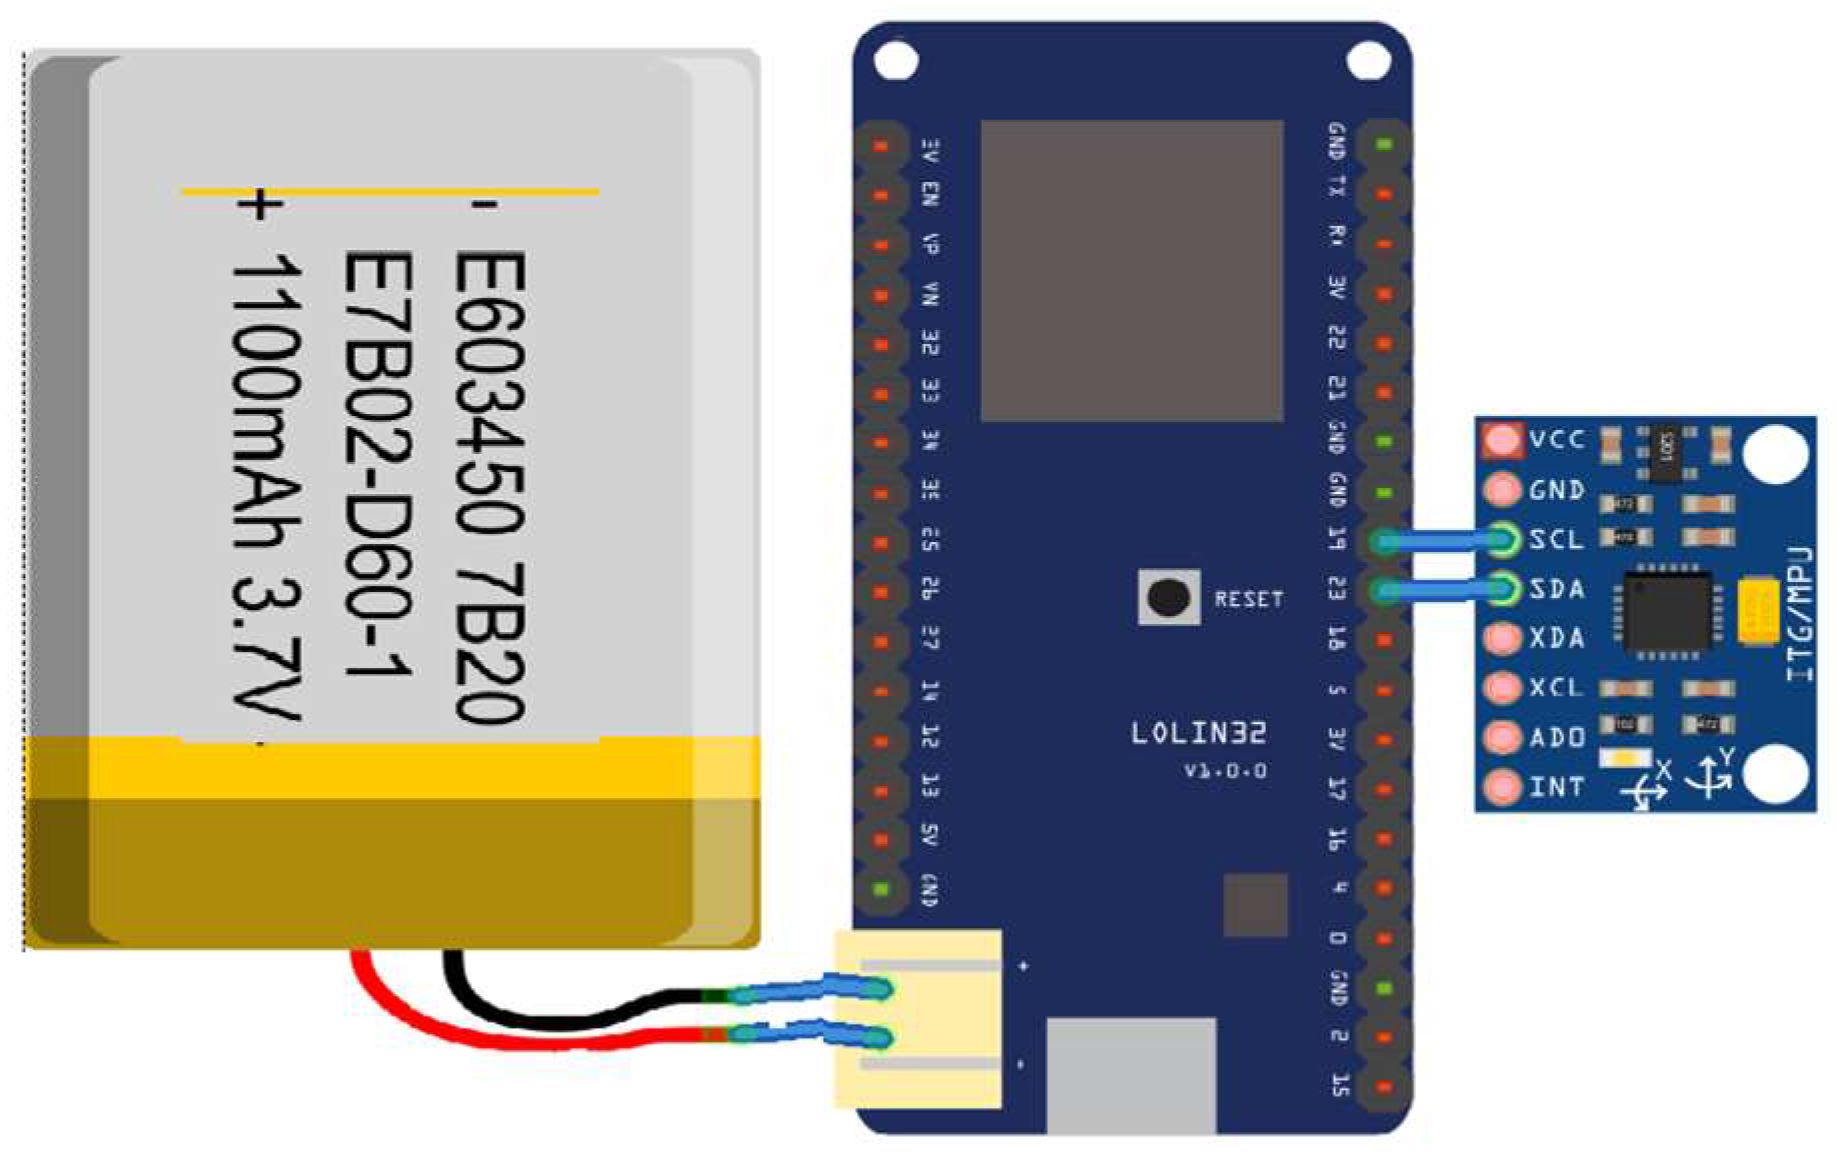
2.1. Balance and Movement Control Sensor
2.2. Haptic Feedback Module
2.3. Visual Feedback Module
2.4. Population and Sample
- Inclusion criteria:
- Subjects must be between 11 and 14 years old at the time of selection.
- They should have 4–5 years of experience in fencing.
- They must have the written consent of their parents/legal guardians for their participation in the study.
- Exclusion criteria:
- Unmotivated absence from training sessions (not more than 4 times/5 weeks) and tests.
- Excused absence from more than four training sessions during the study. This kind of absence can be encountered in the context of competitions, training camps, school exams, or the occurrence of some illnesses.
3. Results
3.1. Average Absolute Evaluation of the Efficacy of the Proposed Training Feedback Modules
3.2. Relative Evaluation of the Efficacy of the Proposed Training Feedback Modules Using the Wilcoxon Signed-Rank Test for Repeated Measures
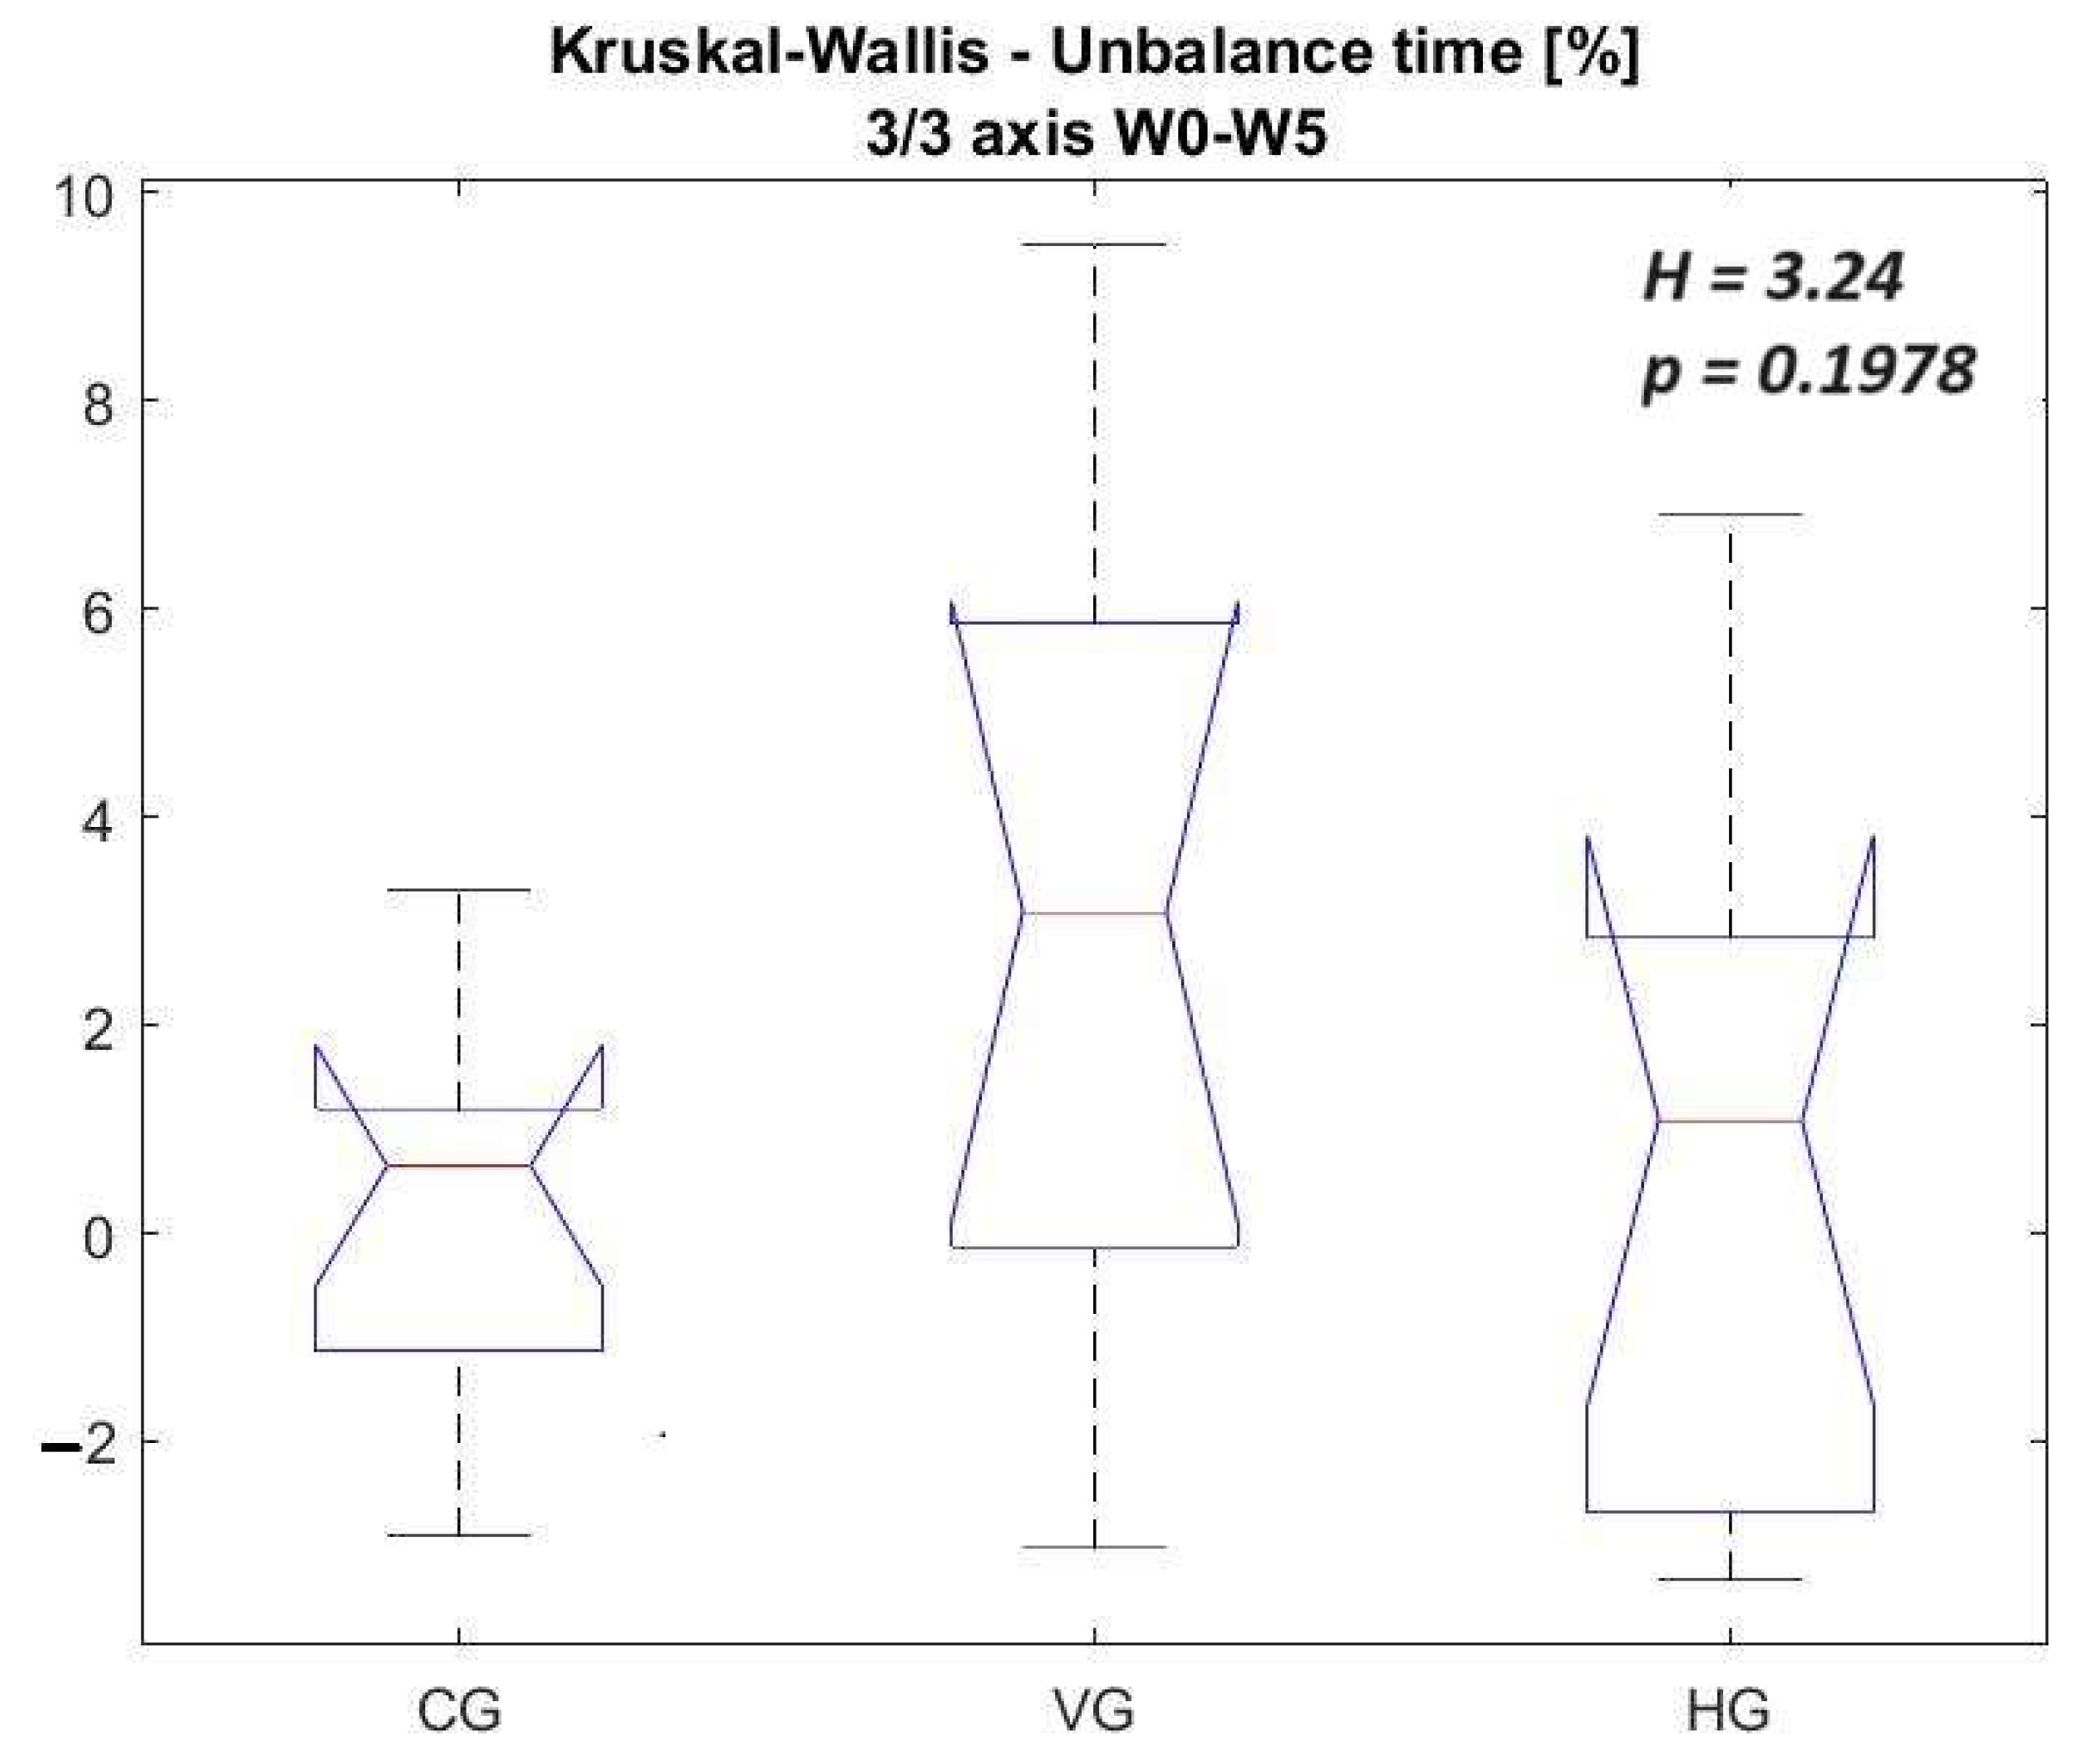
3.3. Vector Difference Comparison of the Final and Initial Testing between the Three Groups Using the Kruskal–Wallis and Mann–Whitney U Tests, with Bonferroni-Corrected p-Values
- Each of the three groups has been drawn from a population with an identical distribution.
- Following the five-week training period, the enhancements realized by one group demonstrate statistical significance when compared to the other groups within the study.
4. Discussions
Strengths and Limitations
5. Conclusions
Supplementary Materials
Author Contributions
Funding
Institutional Review Board Statement
Informed Consent Statement
Data Availability Statement
Conflicts of Interest
References
- Vezocnik, M.; Juric, M.B. Average Step Length Estimation Models’ Evaluation Using Inertial Sensors: A Review. IEEE Sens. J. 2019, 19, 396–403. [Google Scholar] [CrossRef]
- Pérez-Chirinos Buxadé, C.; Fernández-Valdés, B.; Morral-Yepes, M.; Tuyà Viñas, S.; Padullés Riu, J.M.; Moras Feliu, G. Validity of a Magnet-Based Timing System Using the Magnetometer Built into an IMU. Sensors 2021, 21, 5773. [Google Scholar] [CrossRef] [PubMed]
- Demrozi, F.; Pravadelli, G.; Bihorac, A.; Rashidi, P. Human activity recognition using inertial, physiological and environmental sensors: A comprehensive survey. IEEE Access 2020, 8, 210816–210836. [Google Scholar] [CrossRef] [PubMed]
- Yuan, Q.; Chen, I.-M. Human Velocity and Dynamic Behavior Tracking Method for Inertial capture System. Sens. Actuators 2012, 183, 123. [Google Scholar] [CrossRef]
- Rajkumar, A.; Vulpi, F.; Bethi, S.R.; Wazir, H.K.; Raghavan, P.; Kapila, V. Wearable Inertial Sensors for Range of Motion Assessment. IEEE Sens. J. 2020, 20, 3777–3787. [Google Scholar] [CrossRef]
- Yuan, Q.; Chen, I.-M. Localization and Velocity Tracking of Human via 3 IMU Sensors. Sens. Actuators A Phys. 2014, 212, 25–33. [Google Scholar] [CrossRef]
- Wu, M.; Fan, M.; Hu, Y.; Wang, R.; Wang, Y.; Li, Y.; Wu, S.; Xia, G. A real-time tennis level evaluation and strokes classification system based on the Internet of Things. Internet Things 2022, 17, 100494. [Google Scholar] [CrossRef]
- López-Nava, I.H.; Muñoz-Meléndez, A. Wearable Inertial Sensors for Human Motion Analysis: A Review. IEEE Sens. J. 2016, 16, 7821–7834. [Google Scholar] [CrossRef]
- Ekelund, U.; Tarp, J.; Steene-Johannessen, J.; Hansen, B.H.; Jefferis, B.; Fagerland, M.W.; Whincup, P.; Diaz, K.M.; Hooker, S.P.; Chernofsky, A.; et al. Dose-response associations between accelerometry measured physical activity and sedentary time and all-cause mortality: A systematic review and harmonised meta-analysis. BMJ 2019, 366, l4570. [Google Scholar] [CrossRef]
- Leroux, A.; Xu, S.; Kundu, P.; Muschelli, J.; Smirnova, E.; Chatterjee, N.; Crainiceanu, C. Quantifying the Predictive Performance of Objectively Measured Physical Activity on Mortality in the UK Biobank. J. Gerontol. A Biol. Sci. Med. Sci. 2021, 76, 1486–1494. [Google Scholar] [CrossRef]
- Strain, T.; Wijndaele, K.; Dempsey, P.C.; Sharp, S.J.; Pearce, M.; Jeon, J.; Lindsay, T.; Wareham, N.; Brage, S. Wearable-device-measured physical activity and future health risk. Nat. Med. 2020, 26, 1385–1391. [Google Scholar] [CrossRef]
- Klenk, J.; Dallmeier, D.; Denkinger, M.D.; Rapp, K.; Koenig, W.; Rothenbacher, D.; ActiFE Study Group. Objectively Measured Walking Duration and Sedentary Behaviour and Four-Year Mortality in Older People. PLoS ONE 2016, 11, e0153779. [Google Scholar] [CrossRef]
- McGrath, T.; Stirling, L. Body-Worn IMU-Based Human Hip and Knee Kinematics Estimation during Treadmill Walking. Sensors 2022, 22, 2544. [Google Scholar] [CrossRef]
- Moon, K.S.; Gombatto, S.P.; Phan, K.; Ozturk, Y. Extraction of Lumbar Spine Motion Using a 3-IMU Wearable Cluster. Sensors 2023, 23, 182. [Google Scholar] [CrossRef]
- Williams, B.K.; Sanders, R.H.; Ryu, J.H.; Bourdon, P.C.; Graham-Smith, P.; Sinclair, P.J. Static and dynamic accuracy of a magnetic-inertial measurement unit used to provide racket swing kinematics. Sport Biomech. 2019, 18, 202–214. [Google Scholar] [CrossRef]
- Blair, S.; Duthie, G.; Robertson, S.; Hopkins, W.; Ball, K. Concurrent validation of an inertial measurement system to quantify kicking biomechanics in four football codes. J. Biomech. 2019, 73, 24–32. [Google Scholar] [CrossRef]
- Straeten, M.; Rajai, P.; Ahamed, M.J. Method and Implementation of Micro Inertial Measurement Unit (IMU) in Sensing Basketball Dynamics. Sens. Actuators A Phys. 2019, 293, 7–13. [Google Scholar] [CrossRef]
- Manchado, C.; Martínez, J.T.; Pueo, B.; Tormo, J.M.C.; Vila, H.; Ferragut, C.; Sánchez, F.S.; Busquier, S.; Amat, S.; Ríos, L.J.C. High-performance handball player’s time-motion analysis by playing positions. Int. J. Environ. Res. Public Health 2020, 17, 6768. [Google Scholar] [CrossRef]
- Hicks, D.; Drummond, C.; Williams, K.; Van den Tillaar, R. Investigating Vertical and Horizontal Force-Velocity Profiles in Club-Level Field Hockey Athletes: Do Mechanical Characteristics Transfer Between Orientation of Movement? Int. J. Strength Cond. 2023, 3, 1–14. [Google Scholar] [CrossRef]
- Ishac, K.; Bourahmoune, K.; Carmichael, M. An IoT Sensing Platform and Serious Game for Remote Martial Arts Training. Sensors 2023, 23, 7565. [Google Scholar] [CrossRef] [PubMed]
- Rusdiana, A. Analysis of Wearable Smartphone-Based Technologies for the Measuresment of Barbell Velocity in Different Resistance Training, Exercises. Songklanakarin J. Sci. Technol. 2021, 43, 448–452. [Google Scholar] [CrossRef]
- Balsalobre-Fernández, C.; Marchante, D.; Baz-Valle, E.; Alonso-Molero, I.; Jiménez, S.L.; Muñóz-López, M. Development of agility, coordination, and reaction time training device with infrared sensor and WiFi module Arduino in badminton. Front. Physiol. 2017, 8, 649. [Google Scholar] [CrossRef] [PubMed]
- Balsalobre-Fernández, C.; Marchante, D.; Baz-Valle, E.; Alonso-Molero, I.; Jiménez, S.L.; Muñóz-López, M. Effects of Plyometric Training Program on Speed and Explosive Strength of Lower Limbs in Young Athletes. J. Phys. Educ. Sport 2018, 18, 2476–2482. [Google Scholar] [CrossRef]
- bin Abdullah, M.N.; Yeong, C.F.; Ming, E.S.L.; Ramli, M.S.B.; Khor, K.X.; Yang, C. Development of ReactRun: Advanced Universal IoT System for Agility Training in Sports and Healthcare. In Proceedings of the 2020 IEEE-EMBS Conference on Biomedical Engineering and Sciences (IECBES), Langkawi Island, Malaysia, 1–3 March 2021; pp. 286–291. [Google Scholar] [CrossRef]
- Turna, B. The Effect of Agility Training on Reaction Time in Fencers. J. Educ. Learn. 2020, 9, 127–135. [Google Scholar] [CrossRef]
- Witkowski, M.; Karpowicz, K.; Tomczak, M.; Bronikowski, M. A loss of precision of movements in fencing due to increasing fatigue during physical exercise. J. Fisiopatol. Dello Sport 2019, 72, 331–343. [Google Scholar] [CrossRef]
- Balkó, S.; Rous, M.; Balkó, I.; Hnízdil, J.; Borysiuk, Z. Influence of a 9-week training intervention on the reaction time of fencers aged 15 to 18 years. Phys. Act. Rev. 2017, 5, 146–154. [Google Scholar] [CrossRef]
- Nita, V.A.; Magyar, P. Smart IoT device for measuring body angular velocity and centralized assesing of balance and control in fencing. In Proceedings of the 2023 International Symposium on Signals, Circuits and Systems (ISSCS), Iasi, Romania, 13–14 July 2023; pp. 1–4. [Google Scholar] [CrossRef]
- Wojciechowski, Z. This Is Fencing! Advanced Training and Performance Principles for Foil; The Crowood Press: Marlborough, MA, USA, 2019. [Google Scholar]
- Niță, V.A.; Popa, V. Bringing Technology into Fencing Training. The art of Counterattacking. In Proceedings of the 2019 11th International Symposium on Advanced Topics in Electrical Engineering (ATEE), Bucharest, Romania, 28–30 March 2019; pp. 1–4. [Google Scholar] [CrossRef]
- Available online: https://www.thingiverse.com/thing:3999211 (accessed on 10 April 2023).
- Inuiguchi, M.; Sakawa, M.; Ushiro, S. Mean-absolute-deviation-based fuzzy linear regression analysis by level sets automatic deduction from data. In Proceedings of the 6th International Fuzzy Systems Conference, Barcelona, Spain, 5 July 1997; Volume 2, pp. 829–834. [Google Scholar] [CrossRef]
- Selim, S.Z.; Ismail, M.A. K-Means-Type Algorithms: A Generalized Convergence Theorem and Characterization of Local Optimality. IEEE Trans. Pattern Anal. Mach. Intell. 1984, PAMI-6, 81–87. [Google Scholar] [CrossRef] [PubMed]
- Wayne, D.W. Kruskal–Wallis One-Way Analysis of Variance by Ranks. In Applied Nonparametric Statistics, 2nd ed.; PWS-Kent: Boston, MA, USA, 1990; pp. 226–234. ISBN 0-534-91976-6. [Google Scholar]
- Hettmansperger, T.P.; McKean, J.W. Robust nonparametric statistical methods. In Kendall’s Library of Statistics; Edward Arnold: London, UK; John Wiley and Sons, Inc.: New York, NY, USA, 1998; Volume 5, p. 467. ISBN 978-0-340-54937-7. [Google Scholar]
- Dunn, O.J. Multiple Comparisons Among Means. J. Am. Stat. Assoc. 1961, 56, 52–64. [Google Scholar] [CrossRef]
- Noether, G.E. Introduction to Wilcoxon (1945) Individual Comparisons by Ranking Methods. In Breakthroughs in Statistics: Methodology and Distribution; Kotz, S., Johnson, N.L., Eds.; Springer: Berlin/Heidelberg, Germany, 1992; pp. 191–195. [Google Scholar] [CrossRef]
- Gonzalez, R.; Dabove, P. Performance Assessment of an Ultra Low-Cost Inertial Measurement Unit for Ground Vehicle Navigation. Sensors 2019, 19, 3865. [Google Scholar] [CrossRef]


| X-Axis Threshold [rad/s] | Y-Axis Threshold [rad/s] | X-Axis Threshold [rad/s] |
|---|---|---|
| 0.447 | 0.543 | 0.365 |
| Group | Week 0 Average Total Time [s] | Week 5 Average Total Time [s] | Week 0 Average Unbalance Time [%]—2/3 | Week 5 Average Unbalance Time [%]—2/3 | Week 0 Average Unbalance Time [%]—3/3 | Week 5 Average Unbalance Time [%] 3/3 |
|---|---|---|---|---|---|---|
| CG | 9.952 | 9.928 | 34.366 | 32.775 | 17.152 | 16.905 |
| VG | 10.661 | 10.951 | 33.005 | 27.891 | 17.141 | 13.867 |
| HG | 10.933 | 10.948 | 31.028 | 29.816 | 16.58 | 15.766 |
| Group | Week 0 vs. Week 5 Total Time [%] | Week 0 vs. Week 5 Unbalance—2/3 [%] | Week 0 vs. Week 5 Unbalance—2/3 [%] |
|---|---|---|---|
| CG | 0.24174 | 4.629576 | 1.440065 |
| VG | −2.64816 | 15.49462 | 19.1004 |
| HG | −0.137011 | 3.906149 | 4.90953 |
| Group/ Critical Value 8 p = 0.05 | Wilcoxon Test Result W0 vs. W5 Unbalance—2/3 [%] | Wilcoxon Test Result W0 vs. W5 Unbalance—2/3 [%] |
|---|---|---|
| CG | 15 | 22 |
| VG | 4 | 6 |
| HG | 14 | 21 |
| CG | VG | |
|---|---|---|
| VG | 0.7913 | - |
| HG | 0.5708 | 0.6232 |
| CG | VG | |
|---|---|---|
| VG | 1 | - |
| HG | 0.9097 | 0.9097 |
| CG | VG | |
|---|---|---|
| VG | 0.3239 | - |
| HG | 1 | 0.1513 |
| CG | VG | |
|---|---|---|
| VG | 0.2082 | - |
| HG | 1 | 0.3972 |
Disclaimer/Publisher’s Note: The statements, opinions and data contained in all publications are solely those of the individual author(s) and contributor(s) and not of MDPI and/or the editor(s). MDPI and/or the editor(s) disclaim responsibility for any injury to people or property resulting from any ideas, methods, instructions or products referred to in the content. |
© 2023 by the authors. Licensee MDPI, Basel, Switzerland. This article is an open access article distributed under the terms and conditions of the Creative Commons Attribution (CC BY) license (https://creativecommons.org/licenses/by/4.0/).
Share and Cite
Niță, V.-A.; Magyar, P. Improving Balance and Movement Control in Fencing Using IoT and Real-Time Sensorial Feedback. Sensors 2023, 23, 9801. https://doi.org/10.3390/s23249801
Niță V-A, Magyar P. Improving Balance and Movement Control in Fencing Using IoT and Real-Time Sensorial Feedback. Sensors. 2023; 23(24):9801. https://doi.org/10.3390/s23249801
Chicago/Turabian StyleNiță, Valentin-Adrian, and Petra Magyar. 2023. "Improving Balance and Movement Control in Fencing Using IoT and Real-Time Sensorial Feedback" Sensors 23, no. 24: 9801. https://doi.org/10.3390/s23249801
APA StyleNiță, V.-A., & Magyar, P. (2023). Improving Balance and Movement Control in Fencing Using IoT and Real-Time Sensorial Feedback. Sensors, 23(24), 9801. https://doi.org/10.3390/s23249801