
The Fabrication and Evaluation of a Capacitive Pressure Sensor Using Ru-Based Thin Film Metallic Glass with Structural Relaxation by Heat Treatment


Abstract
:1. Introduction
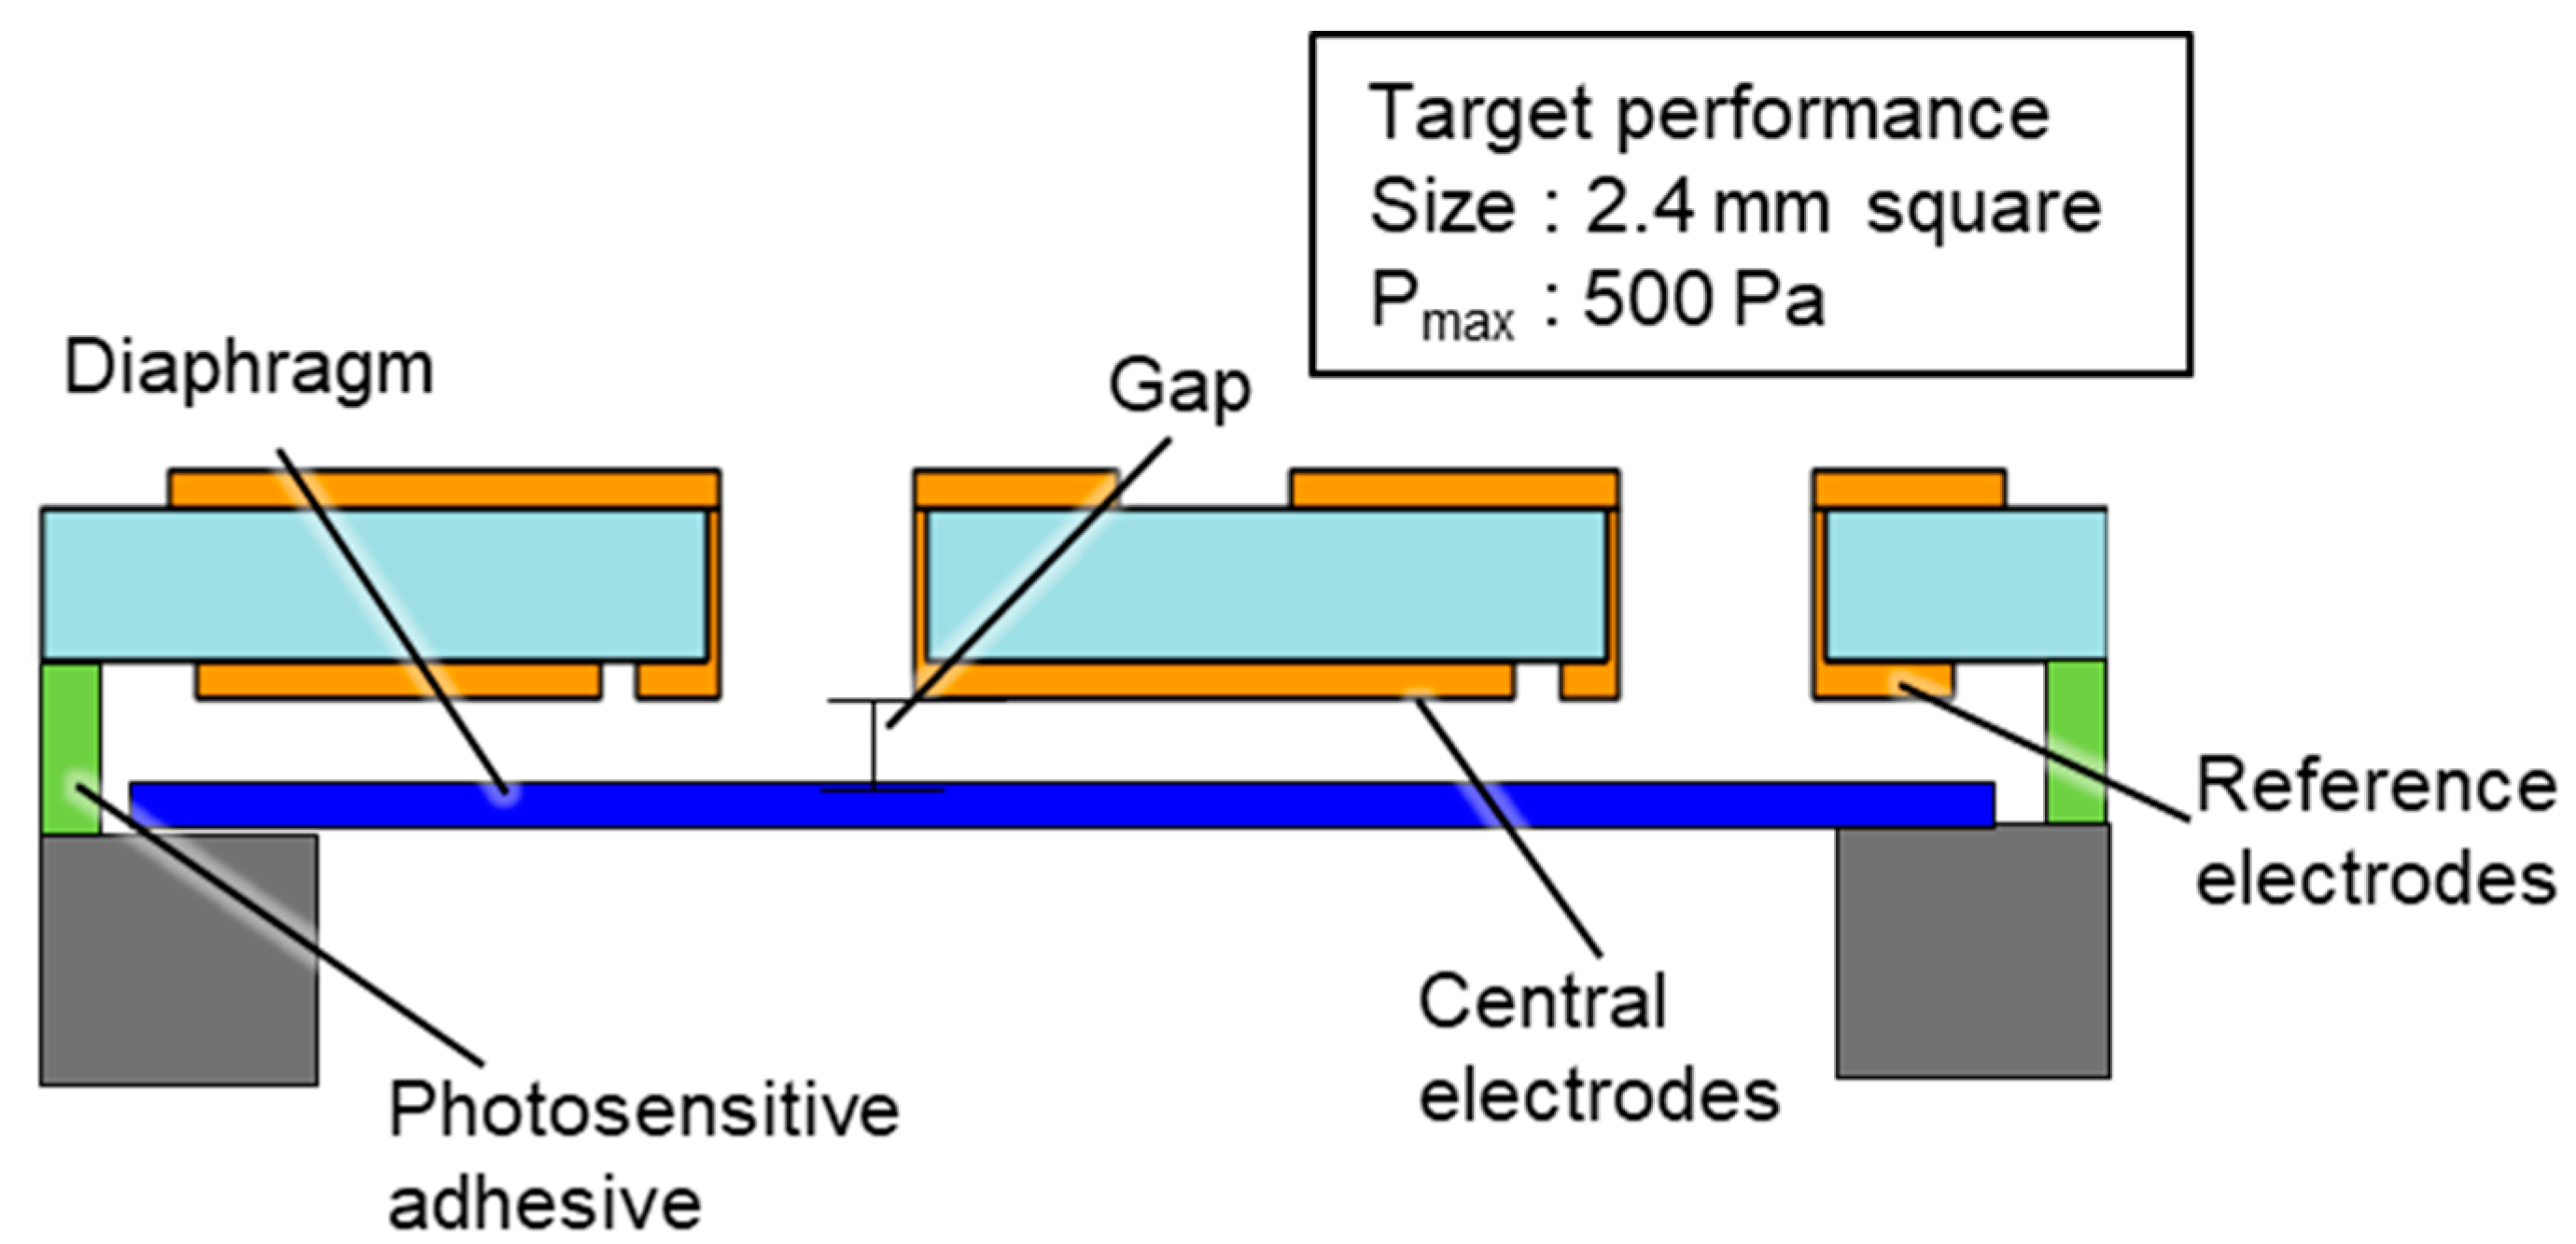
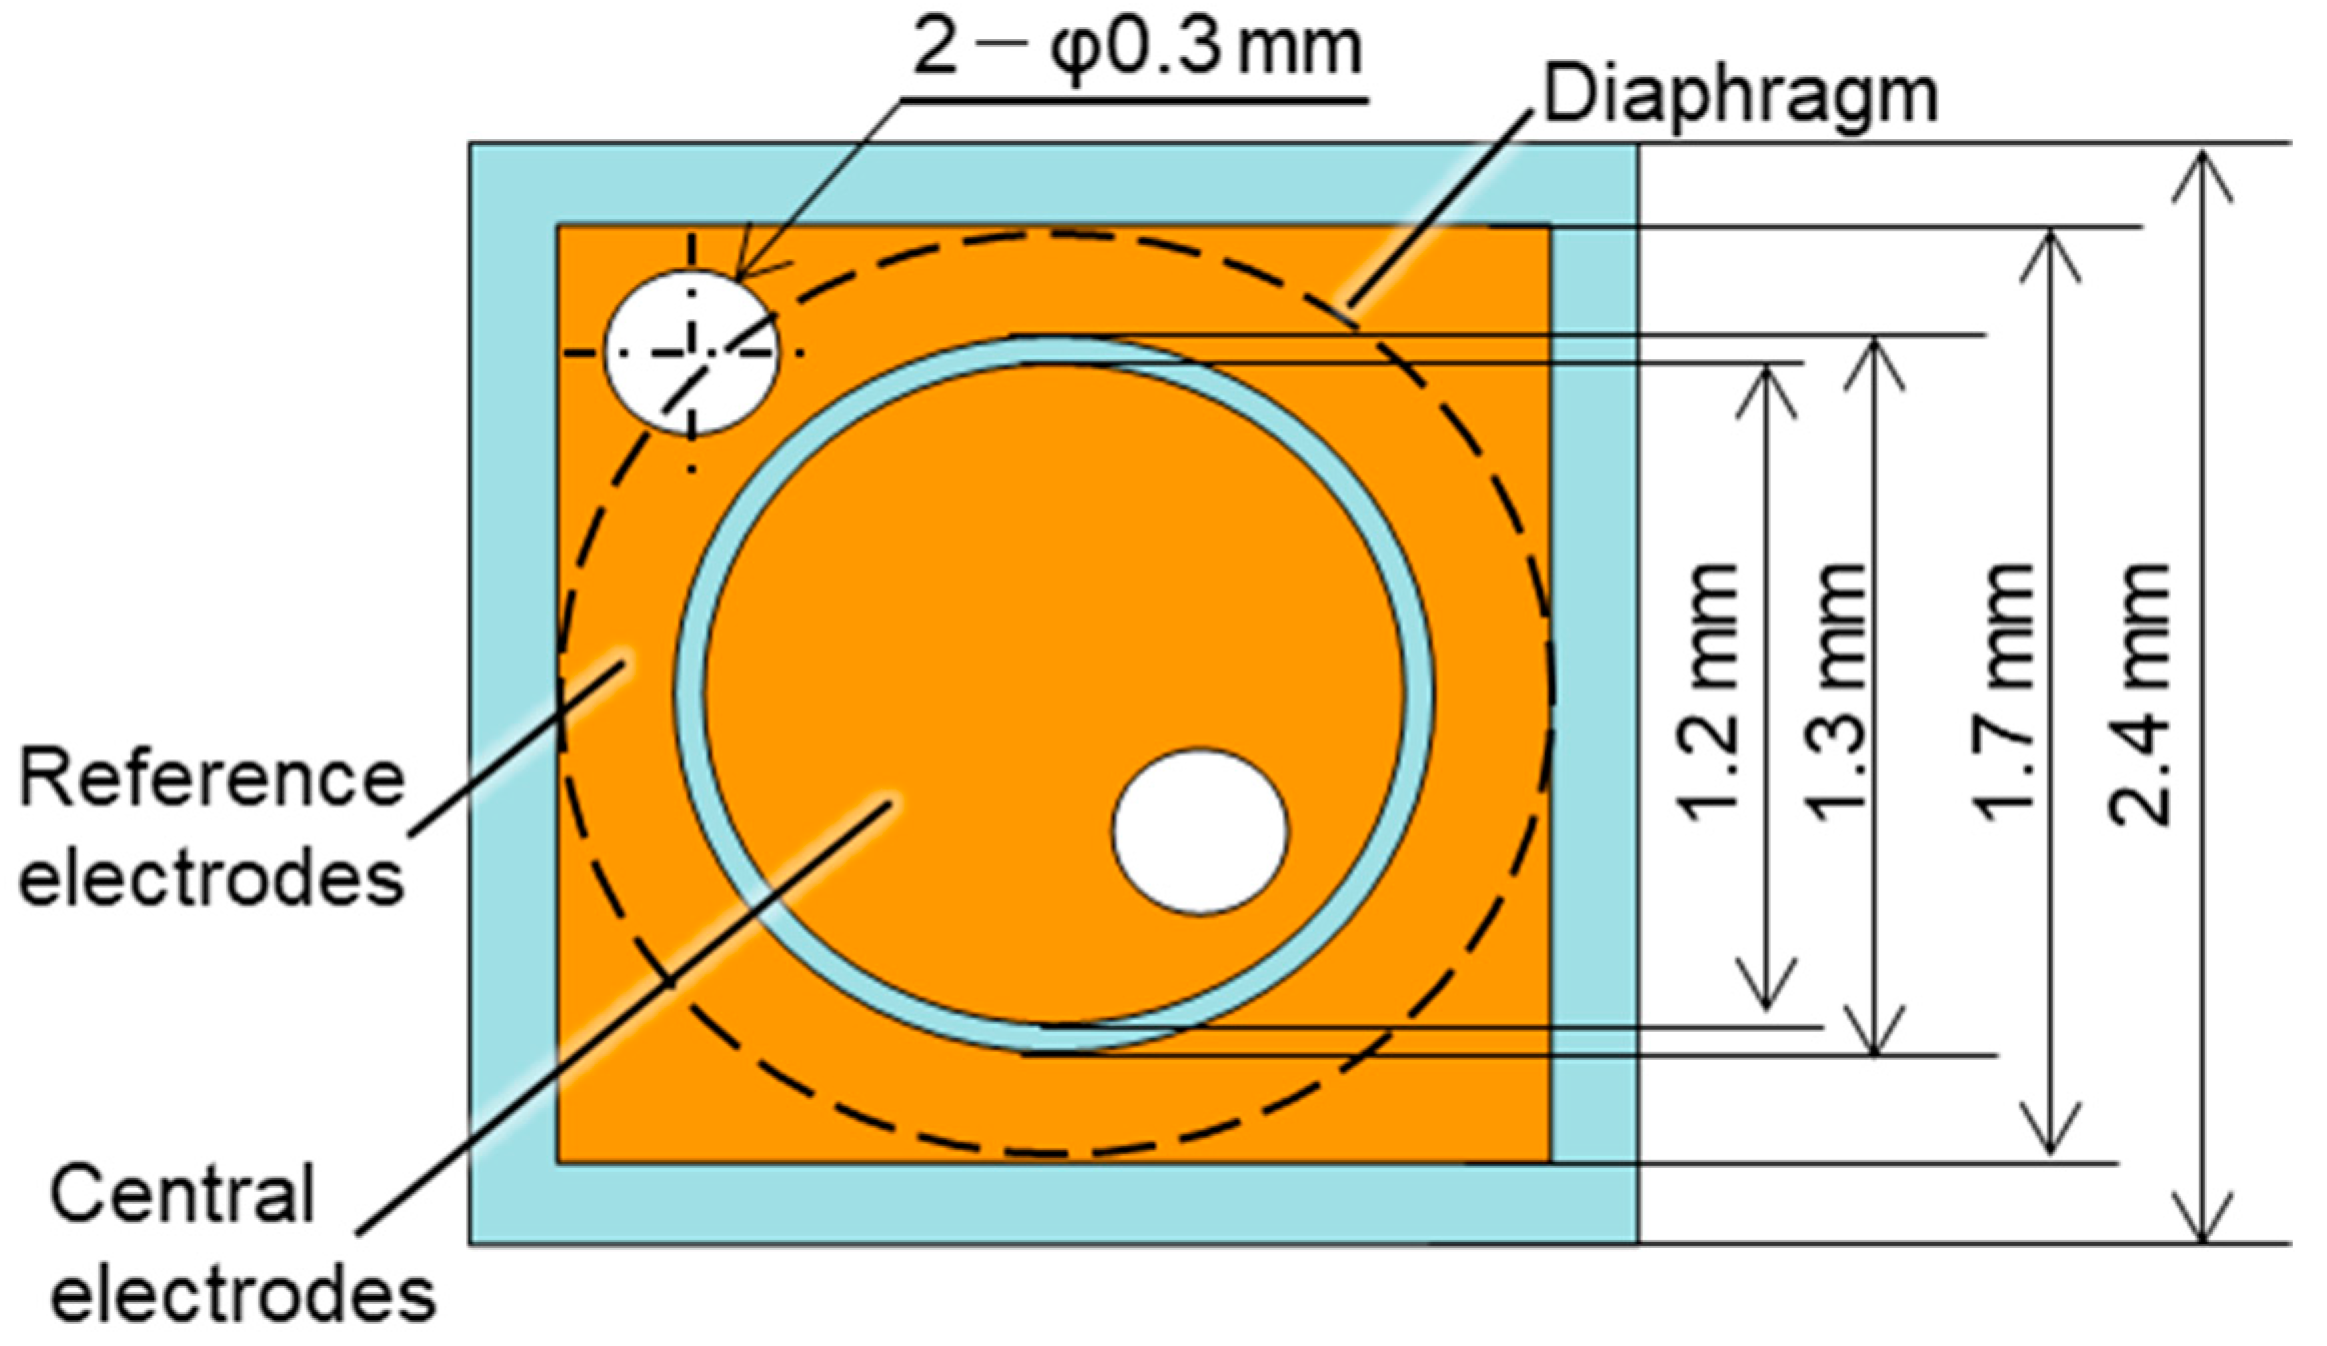
2. Design
3. Fabrication
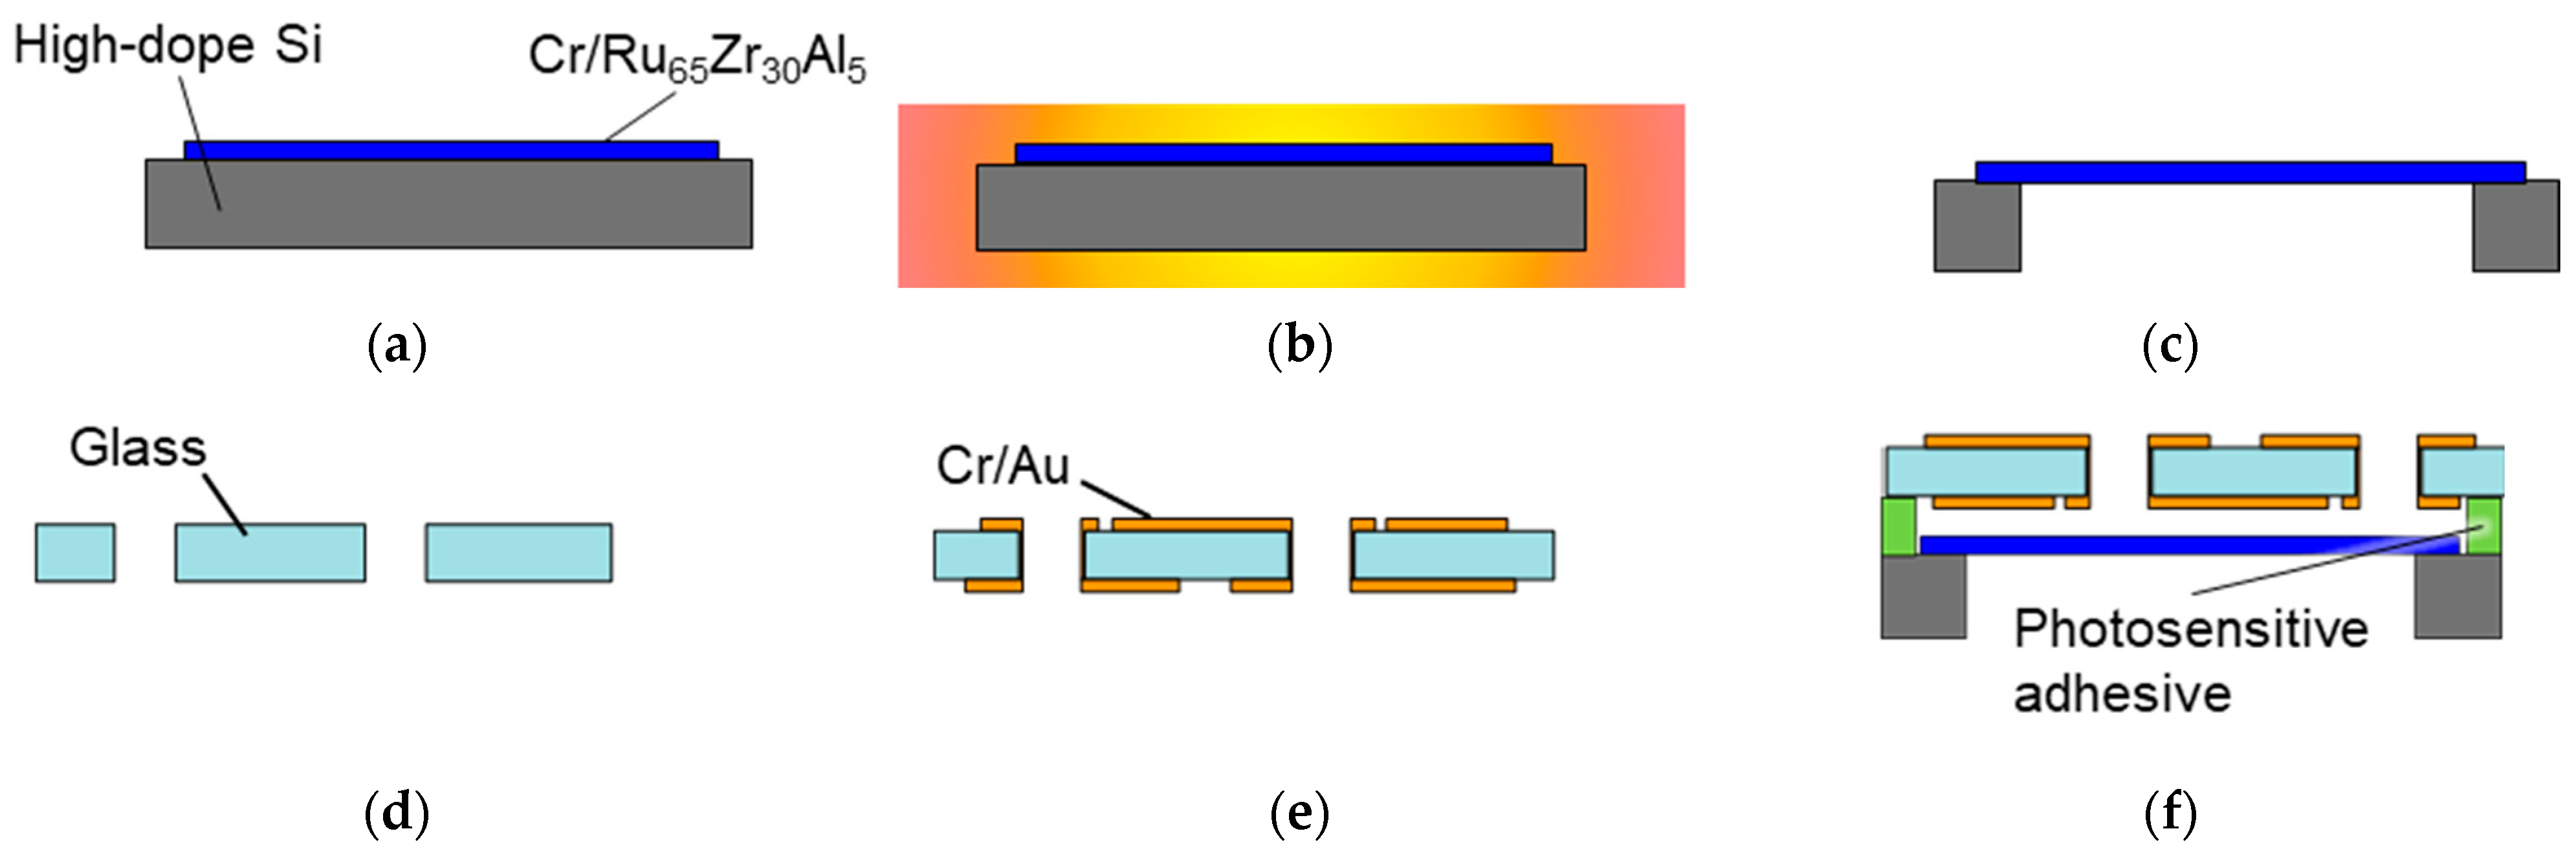
3.1. Fabrication Process
3.2. Annealing Conditions
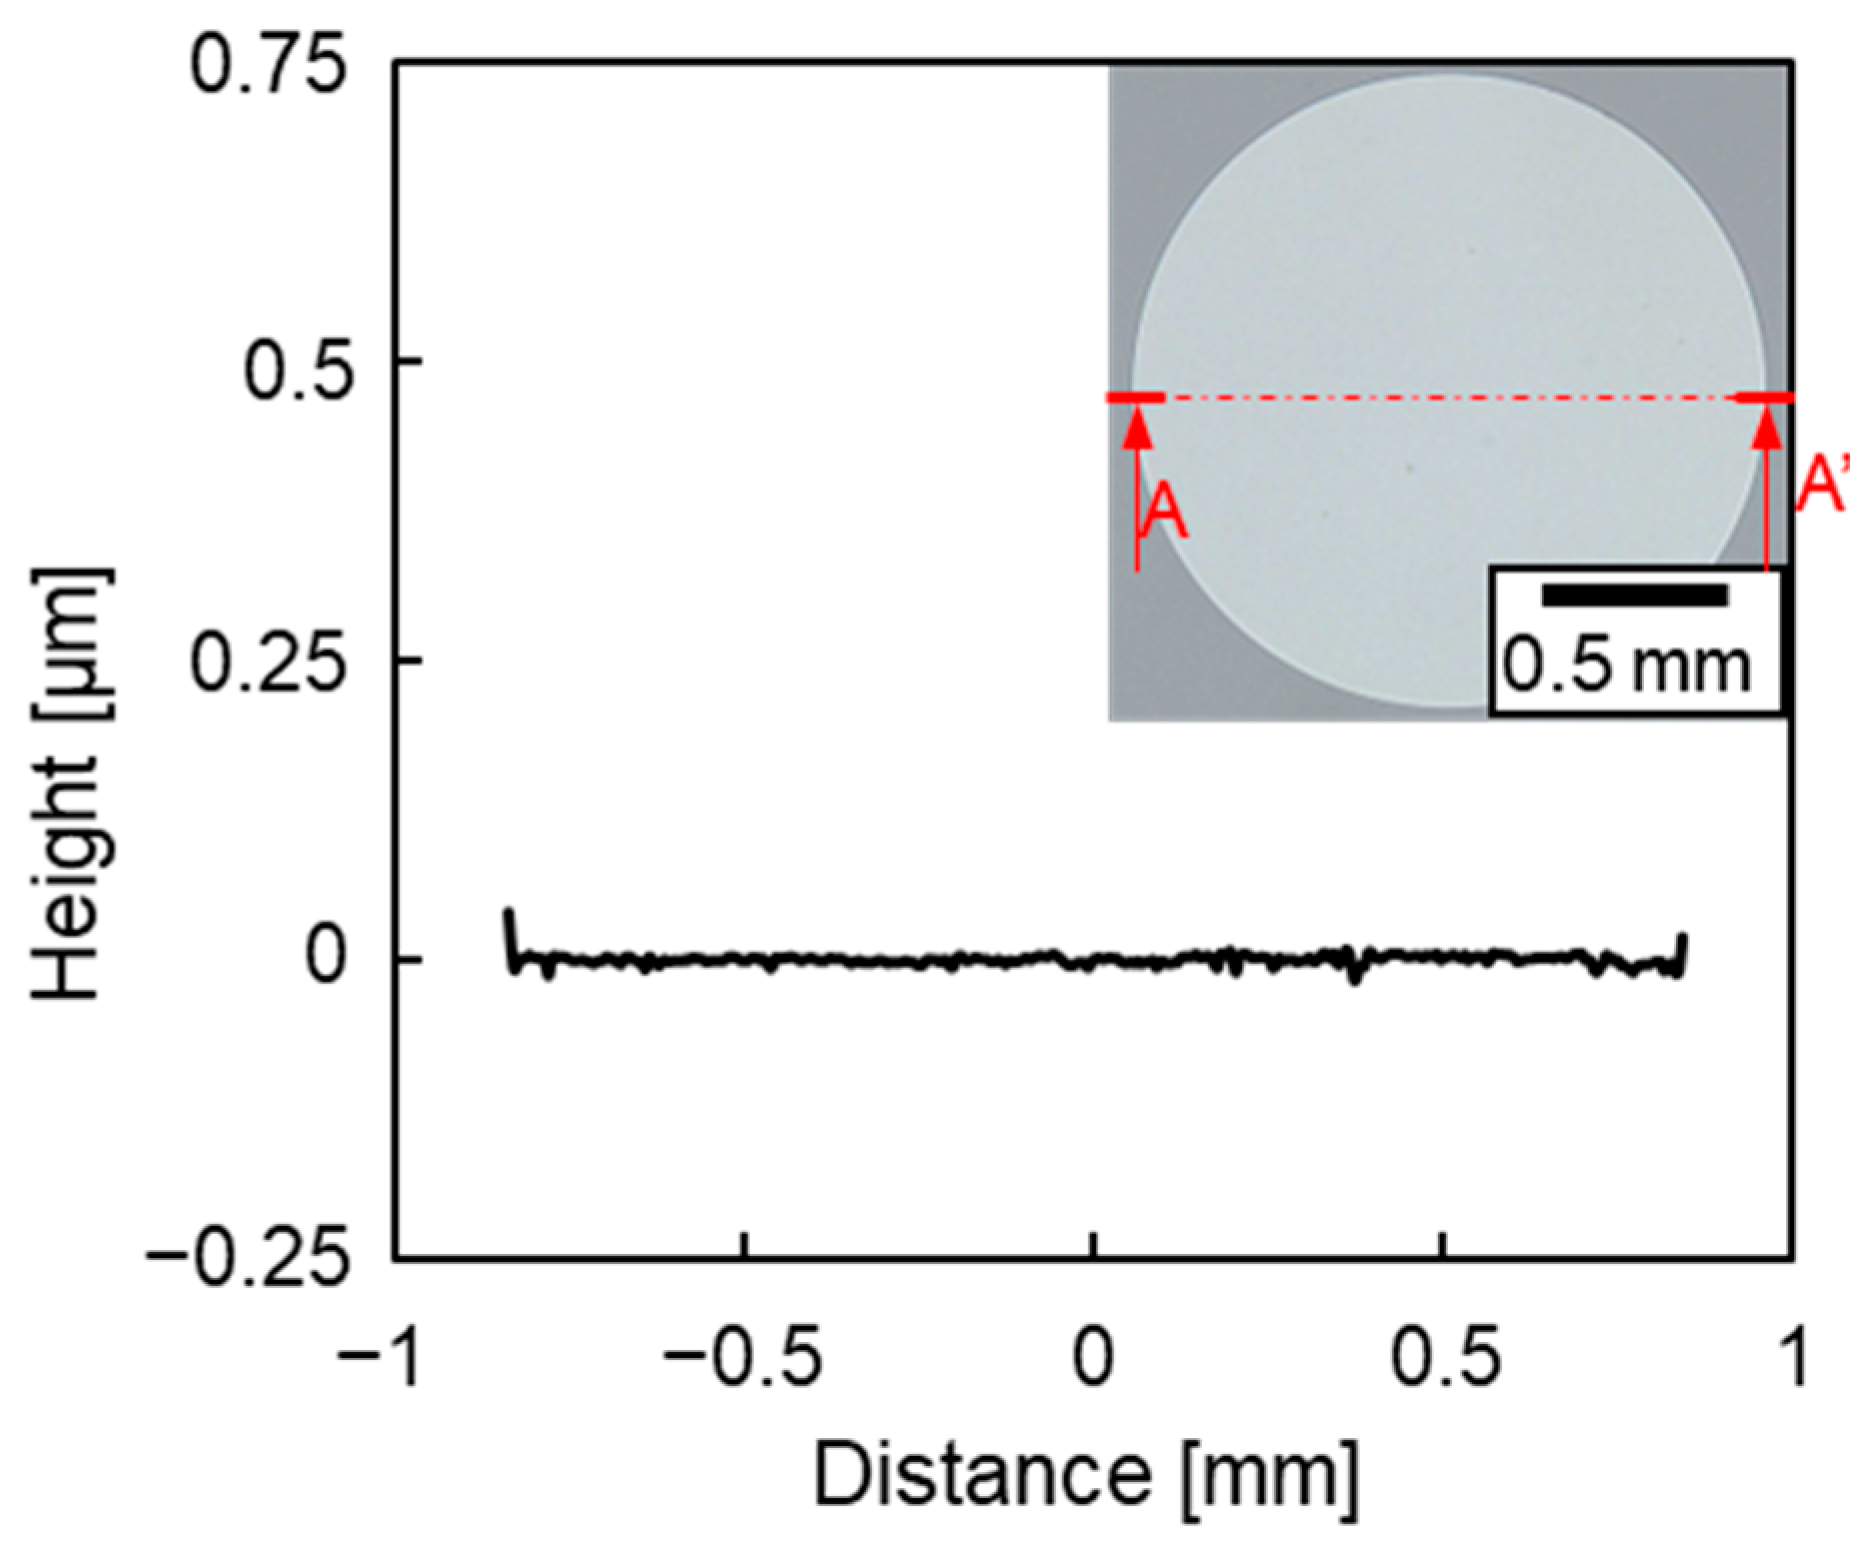
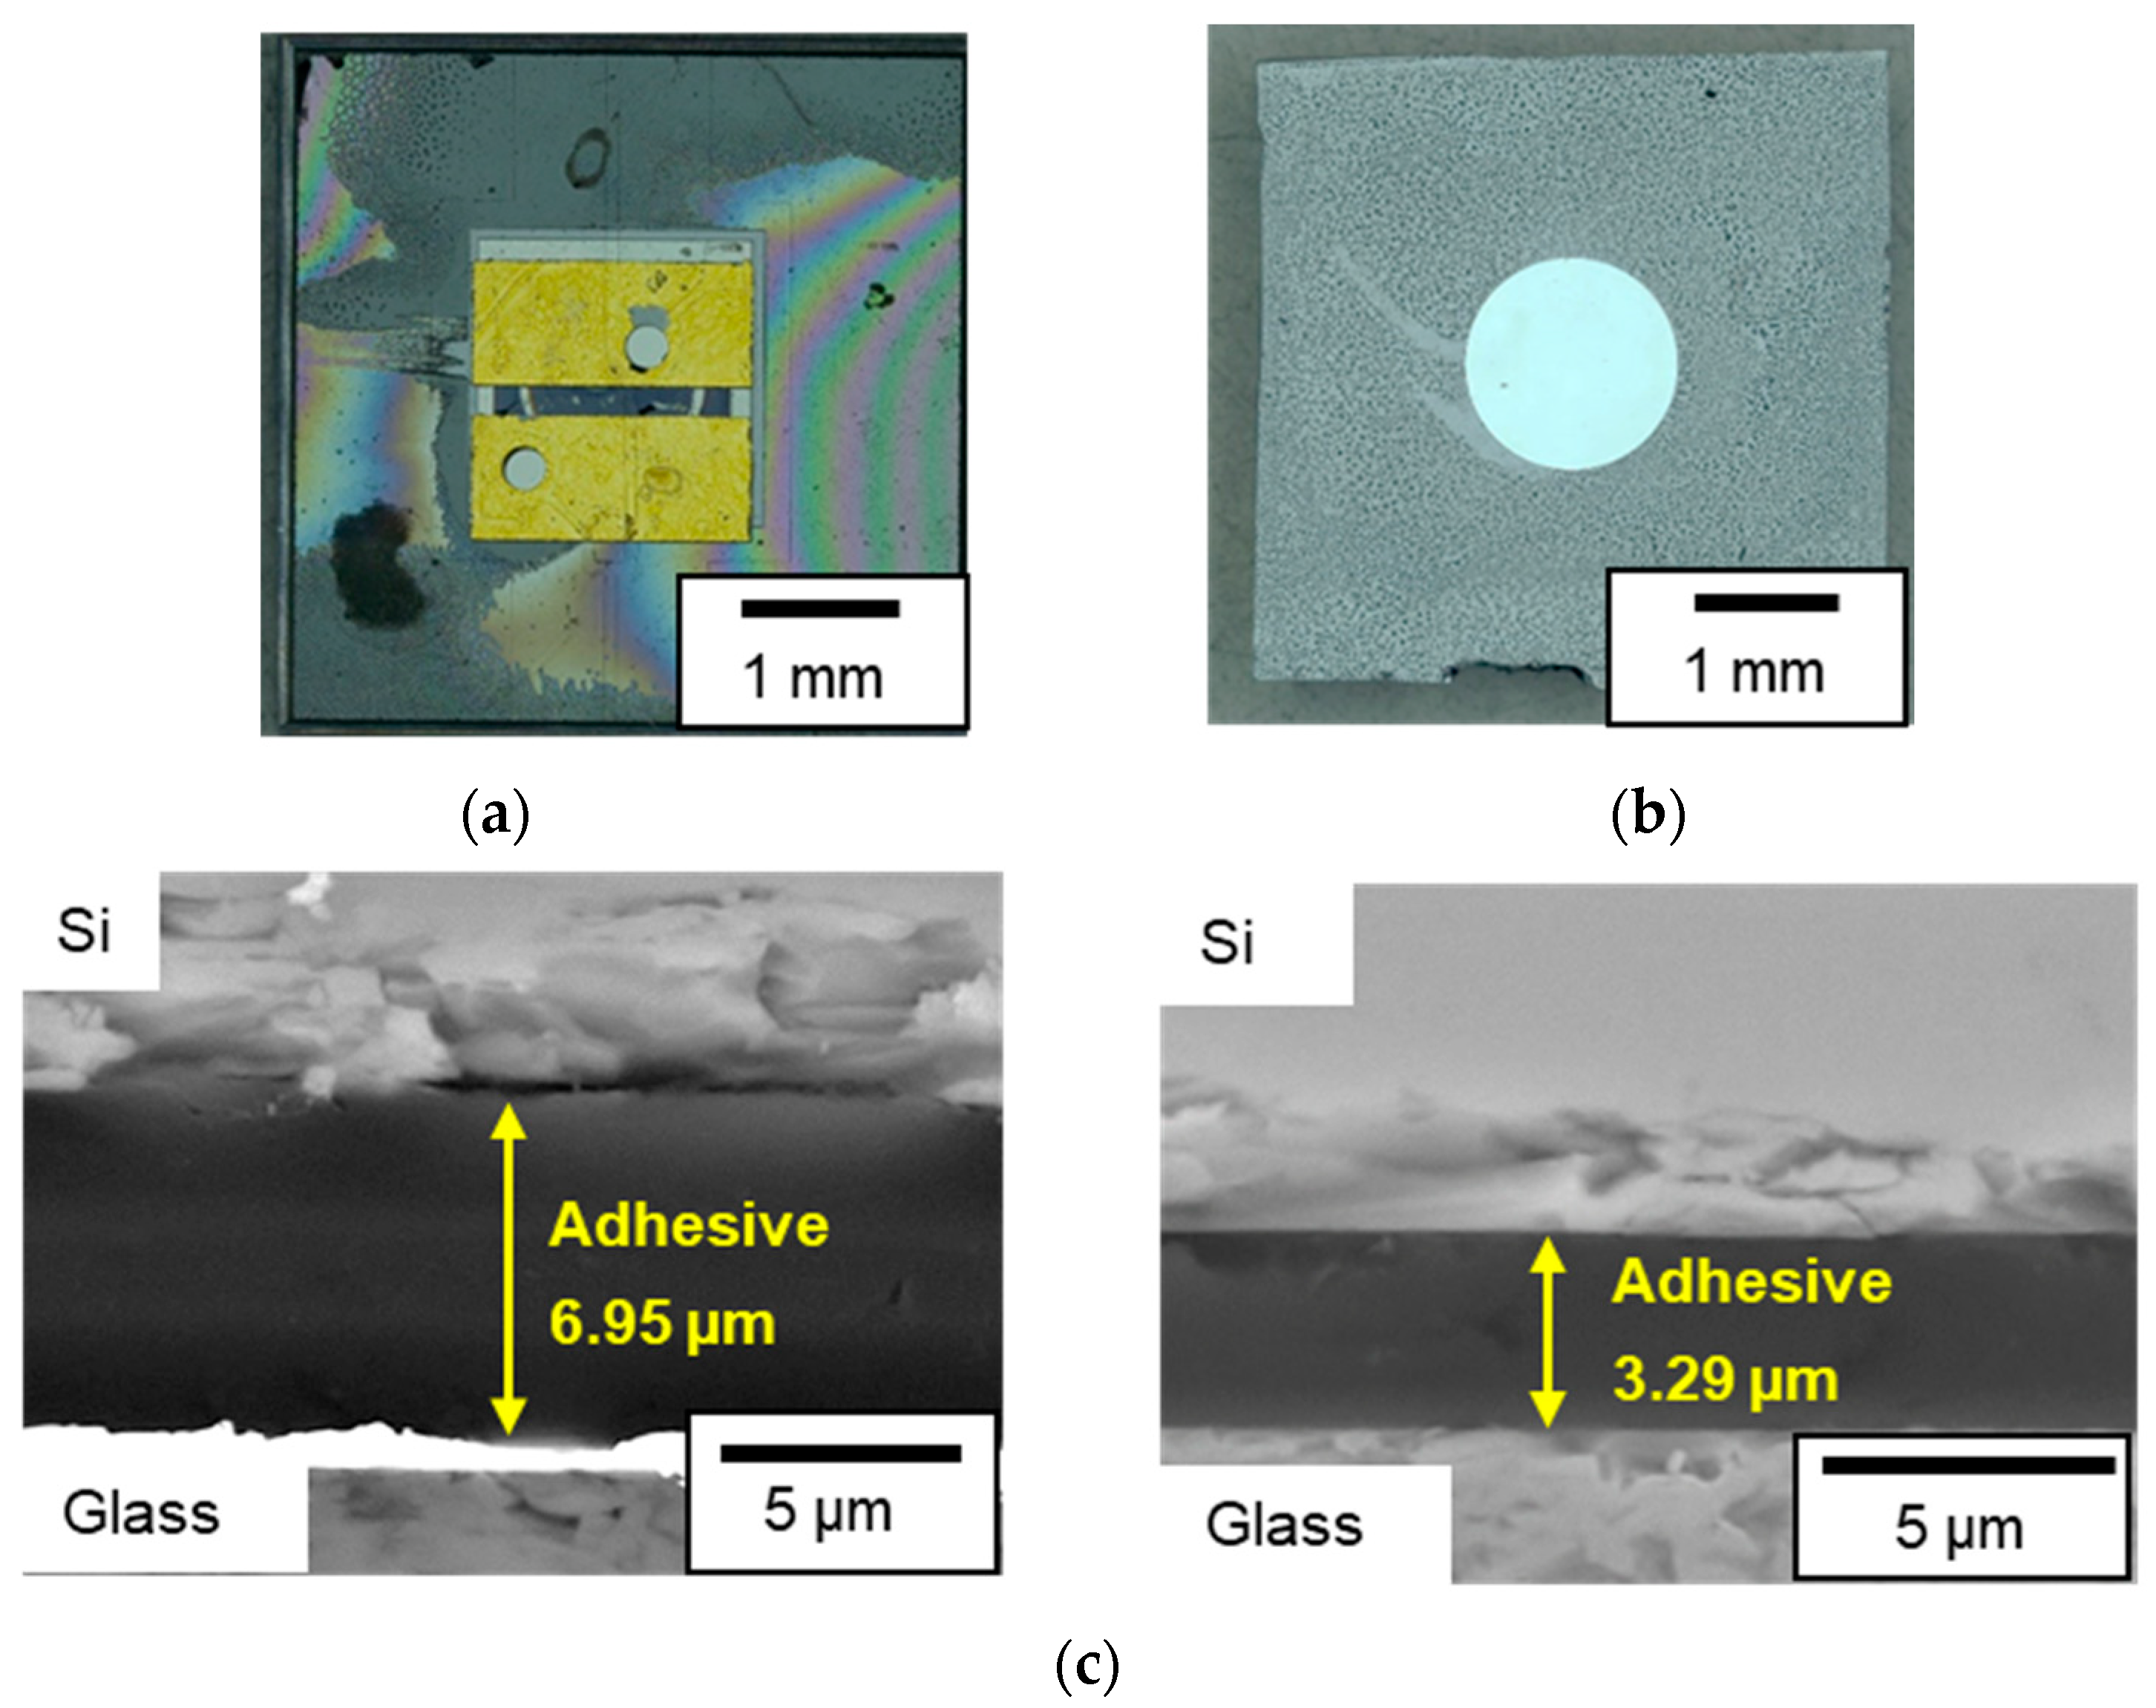
3.3. Fabrication Results
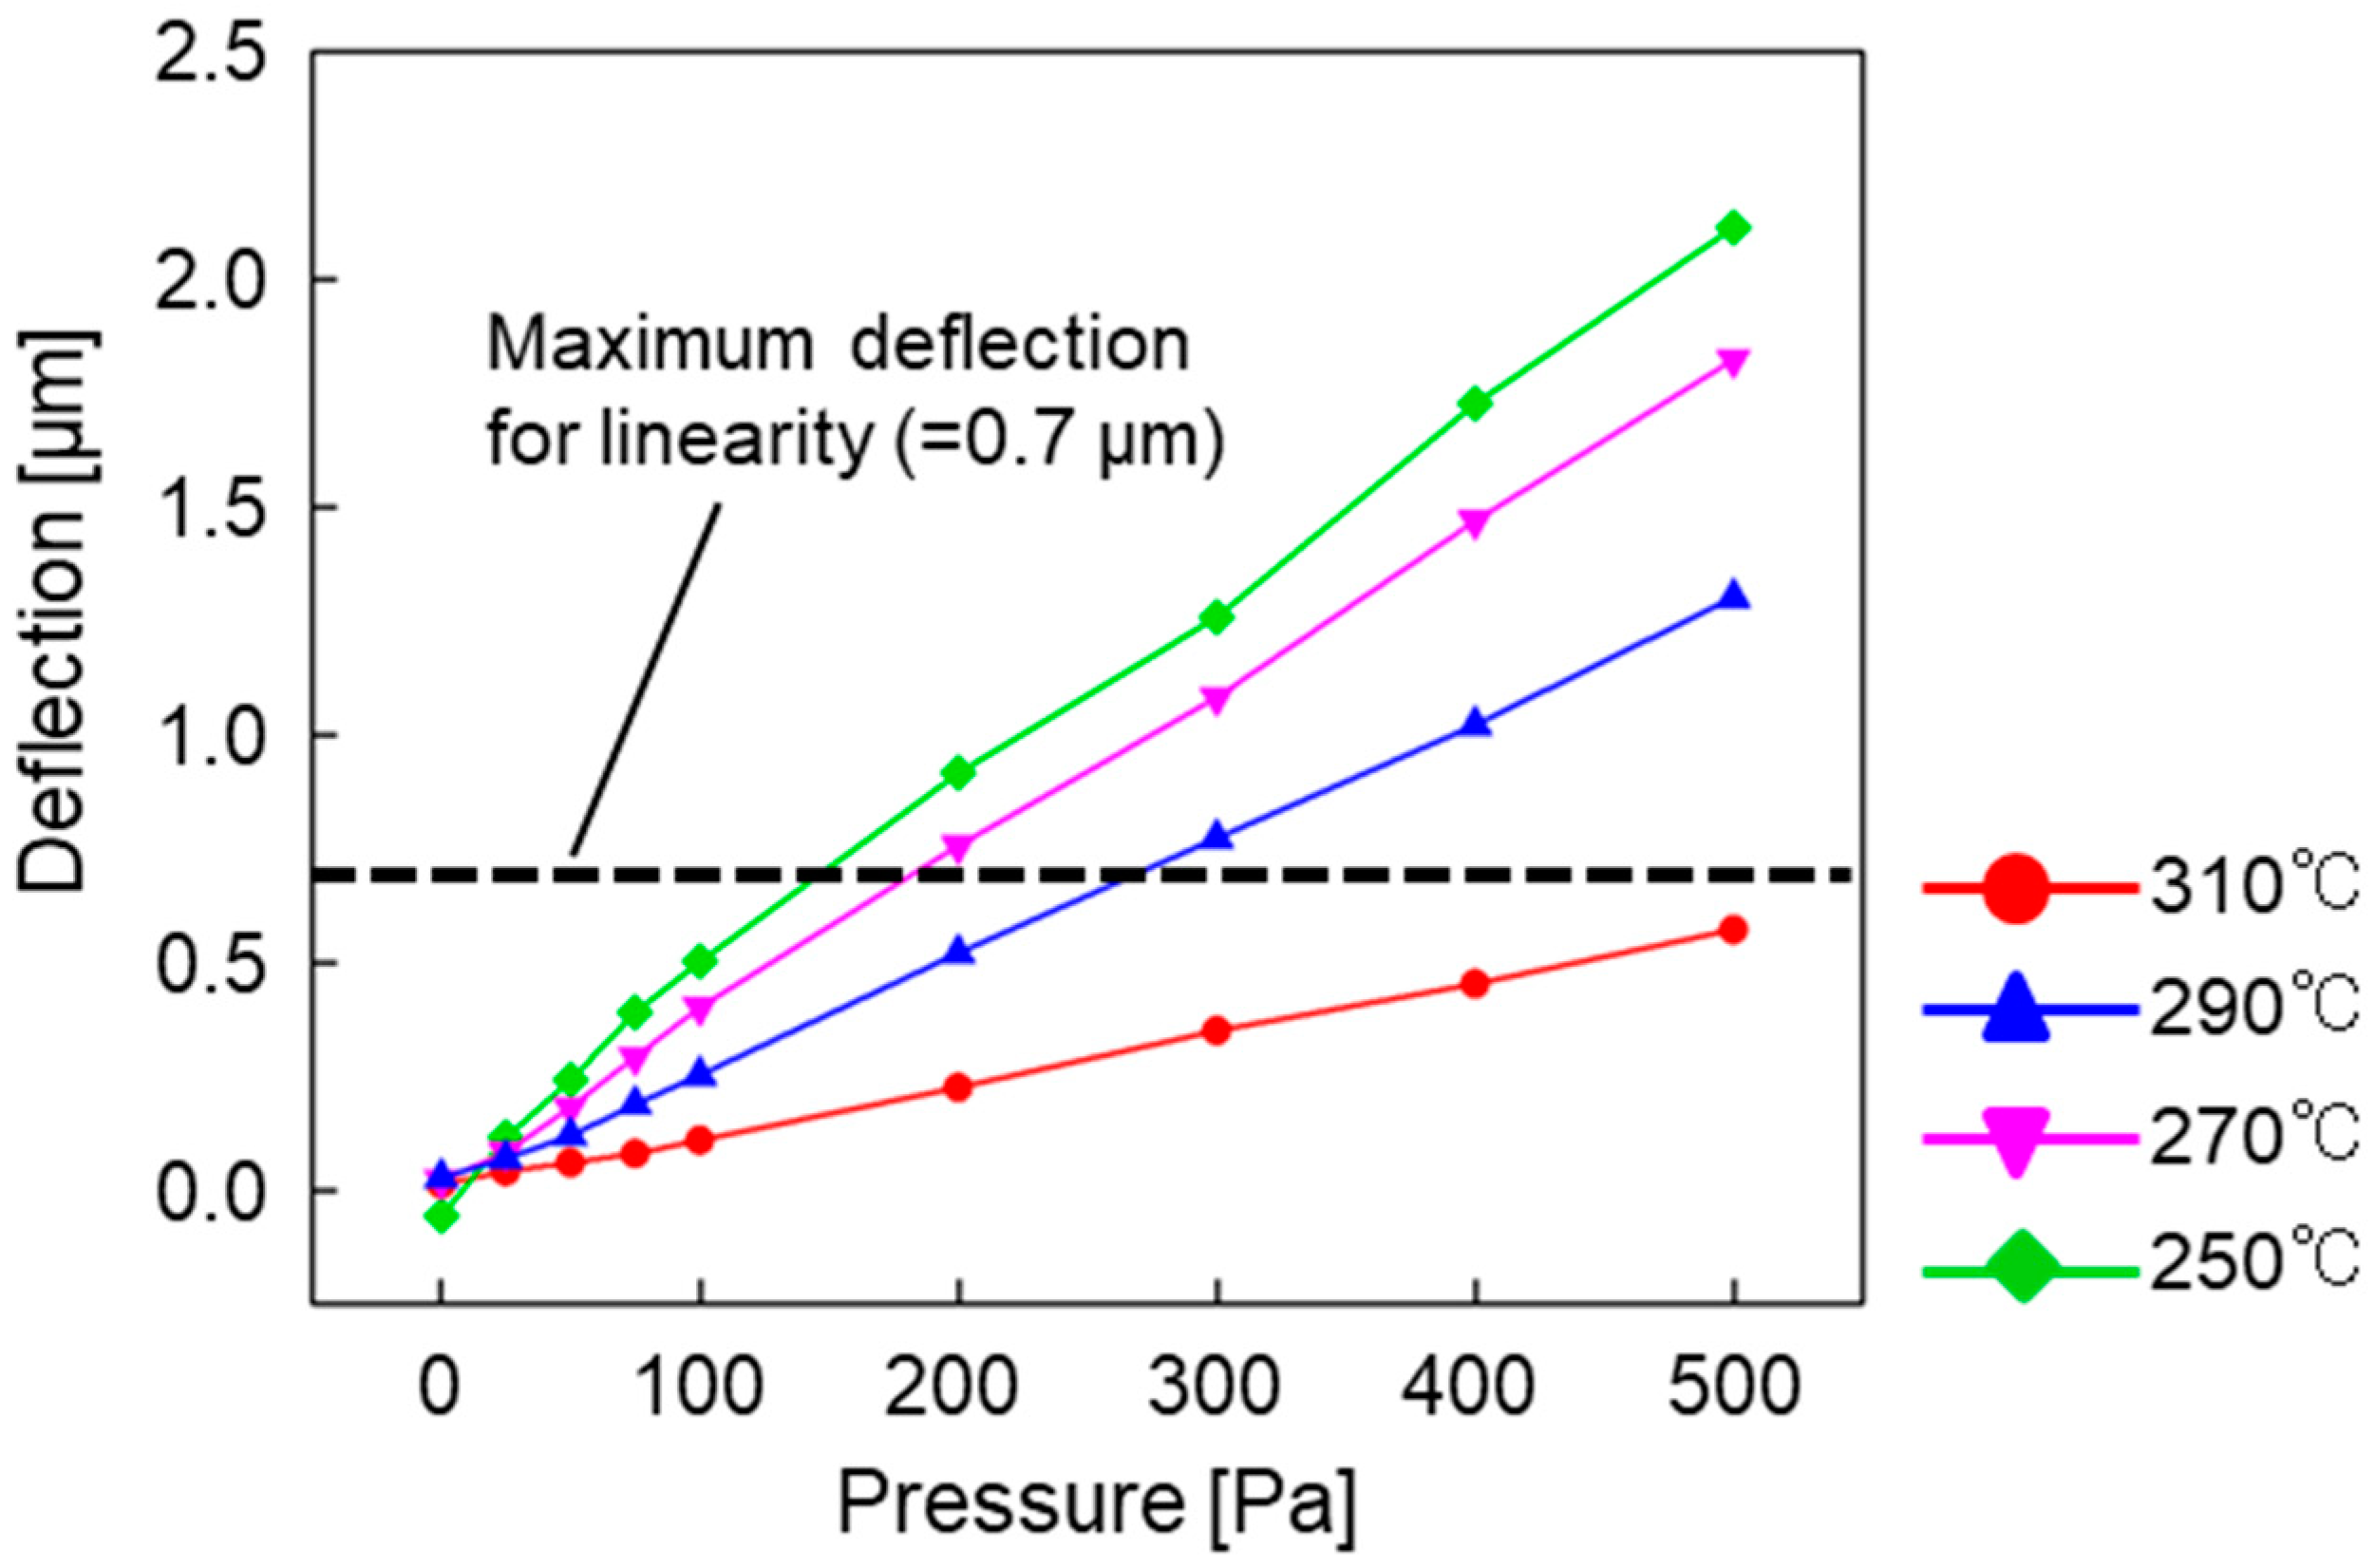
4. Performance Evaluation
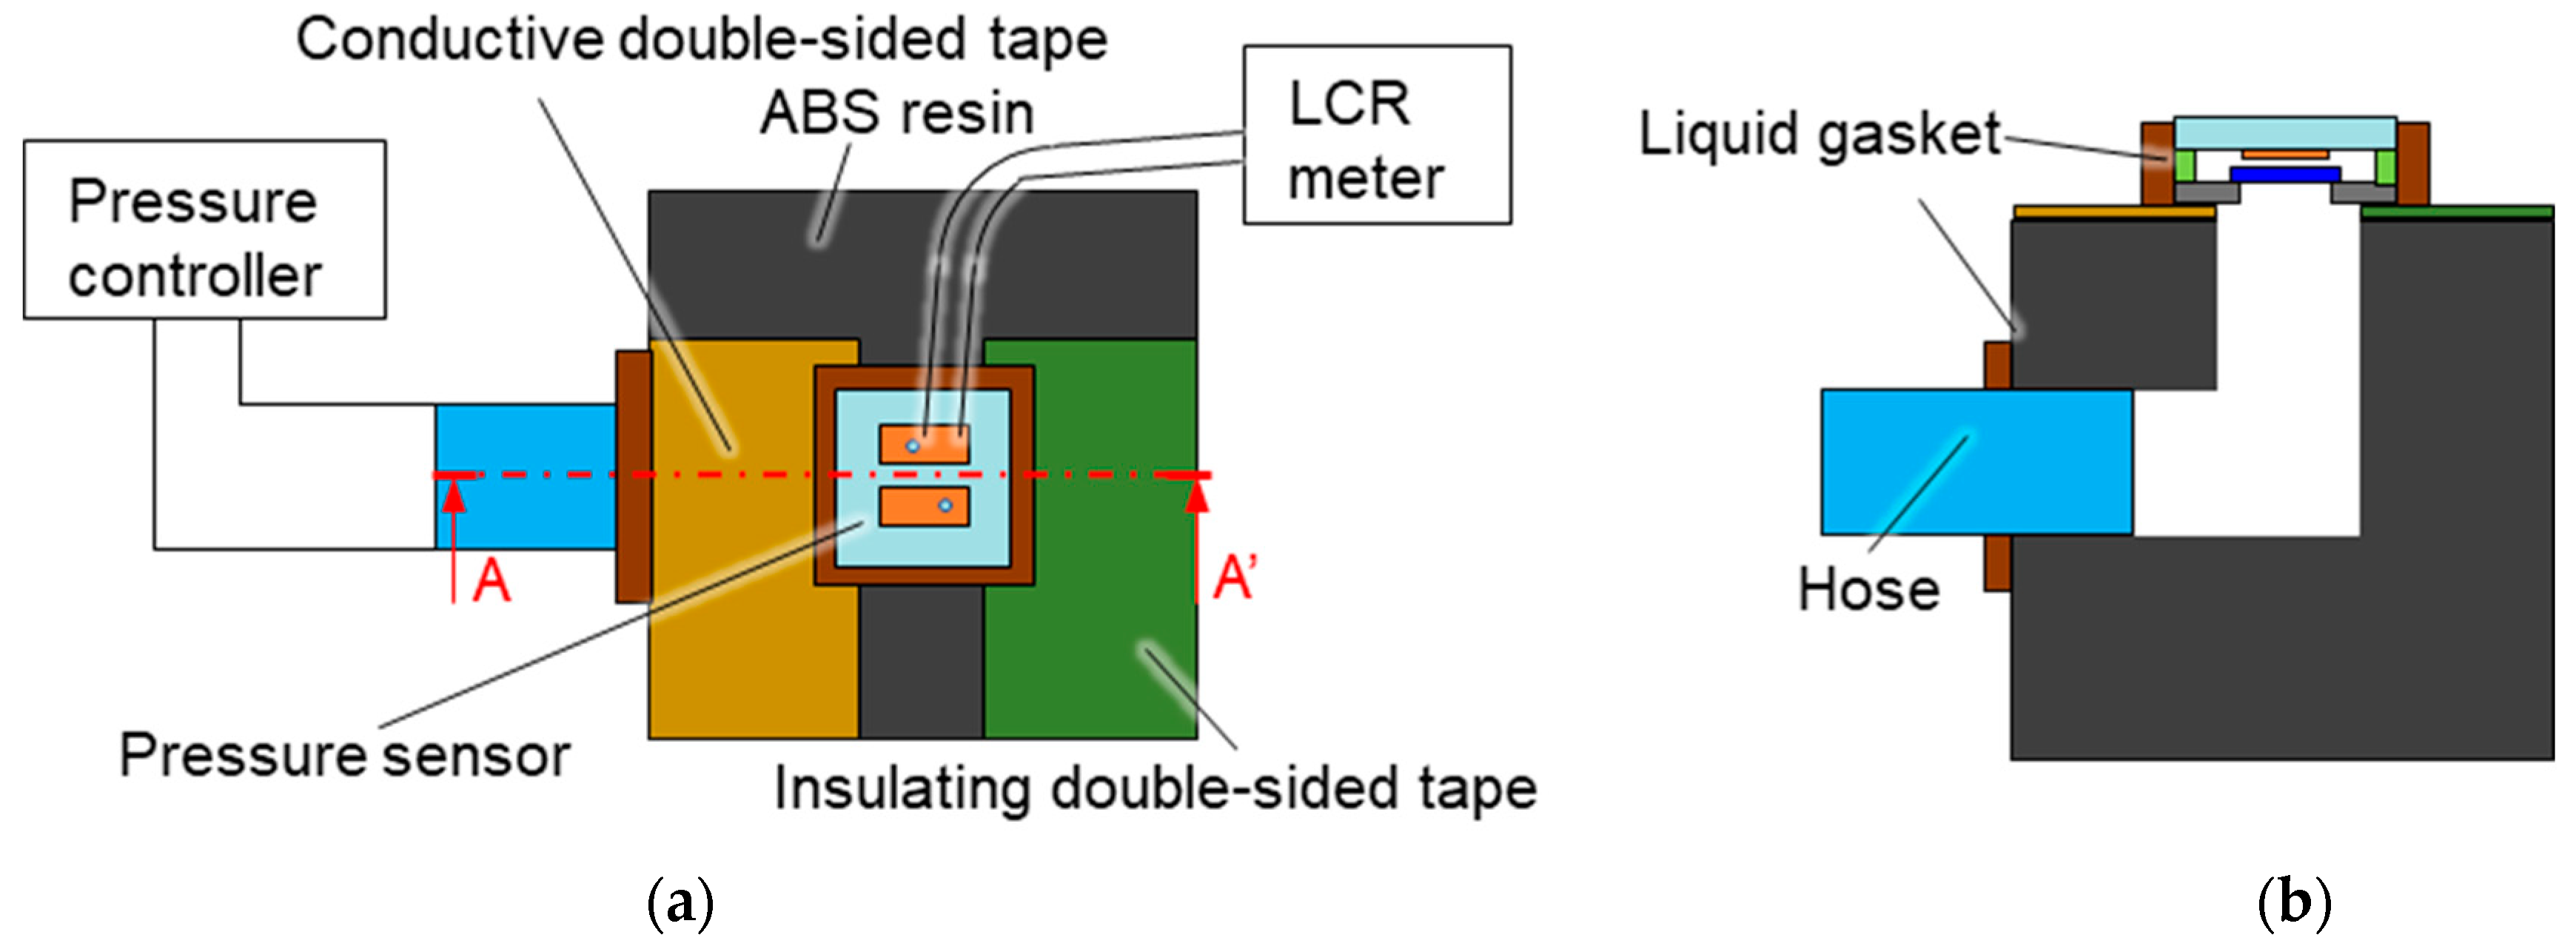
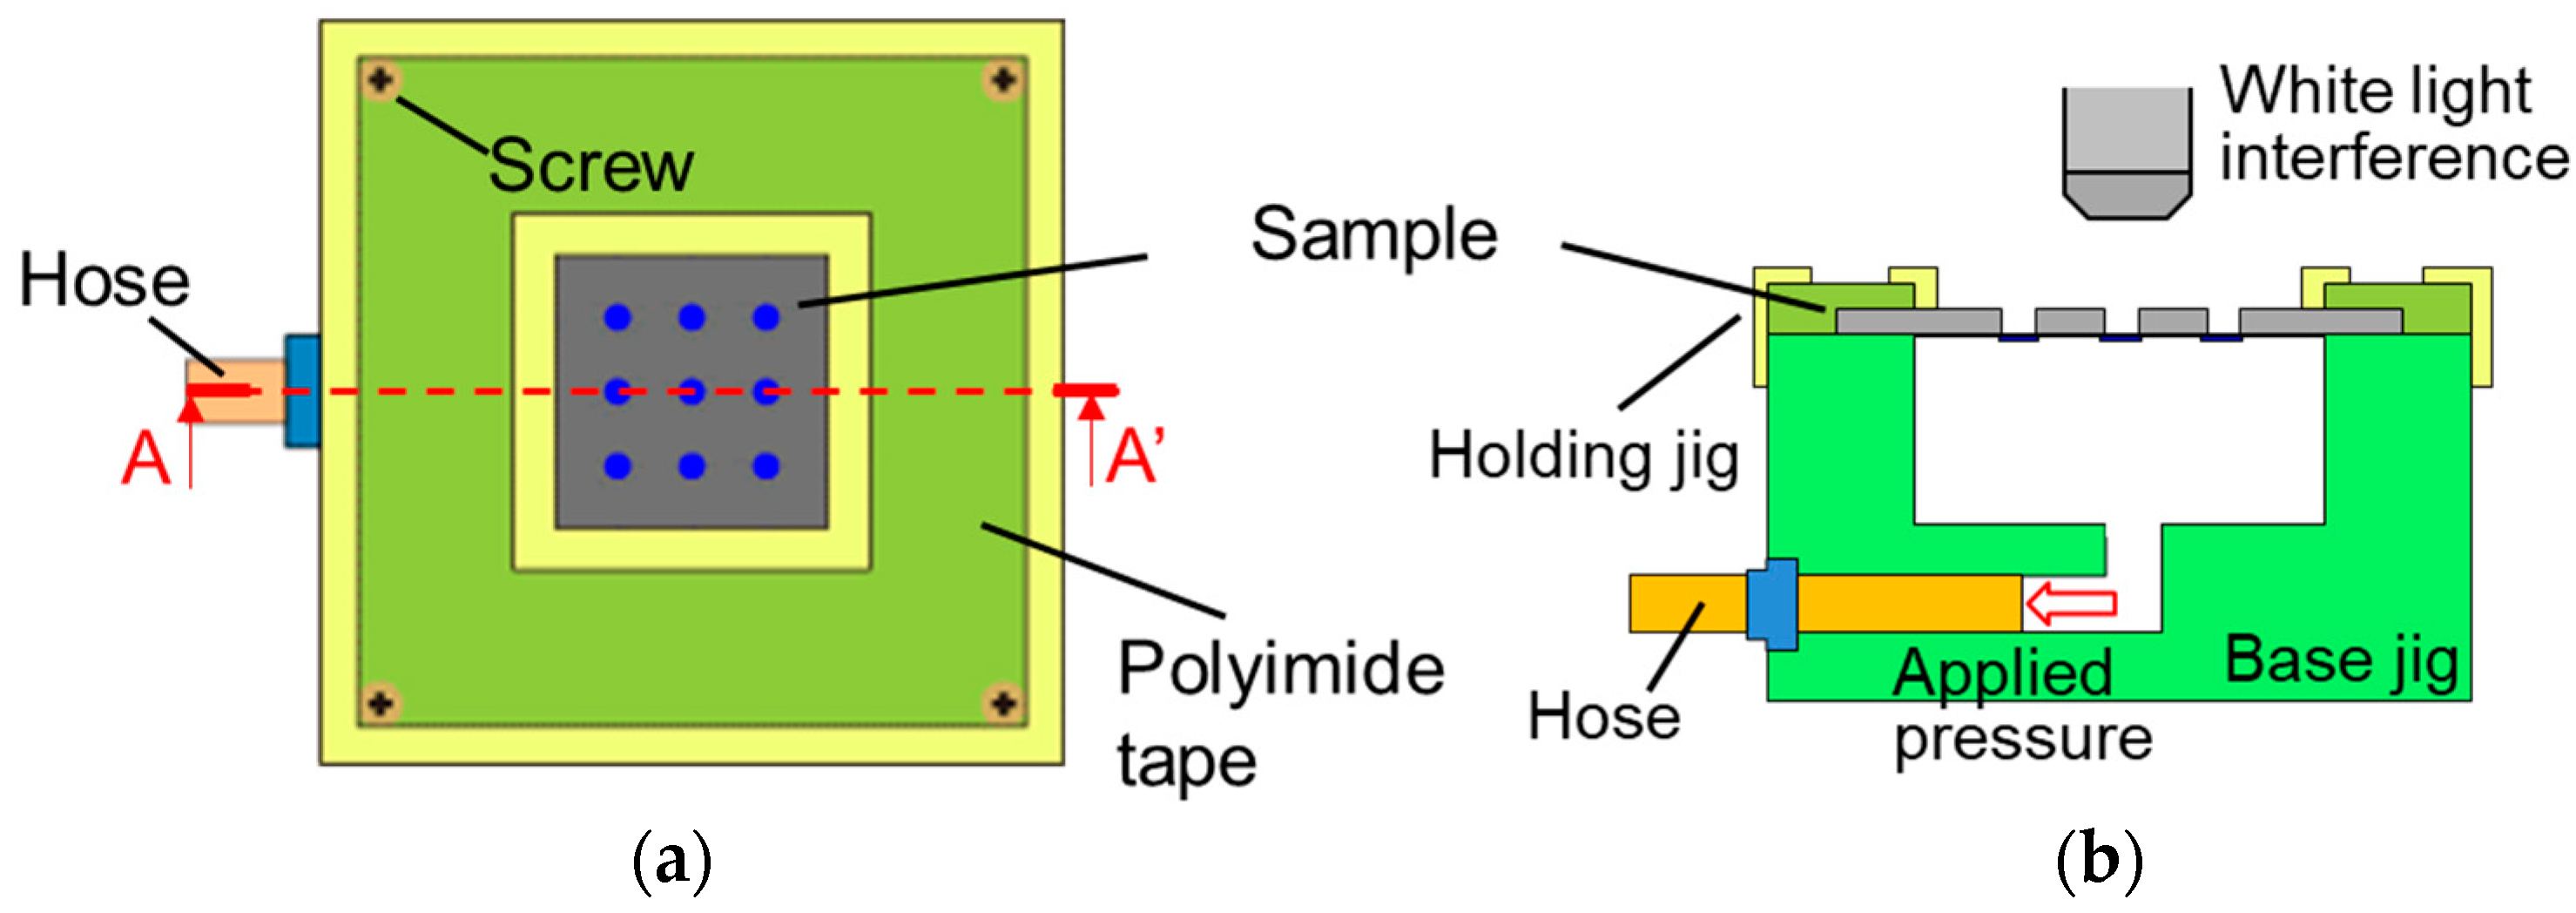
4.1. Evaluation Method
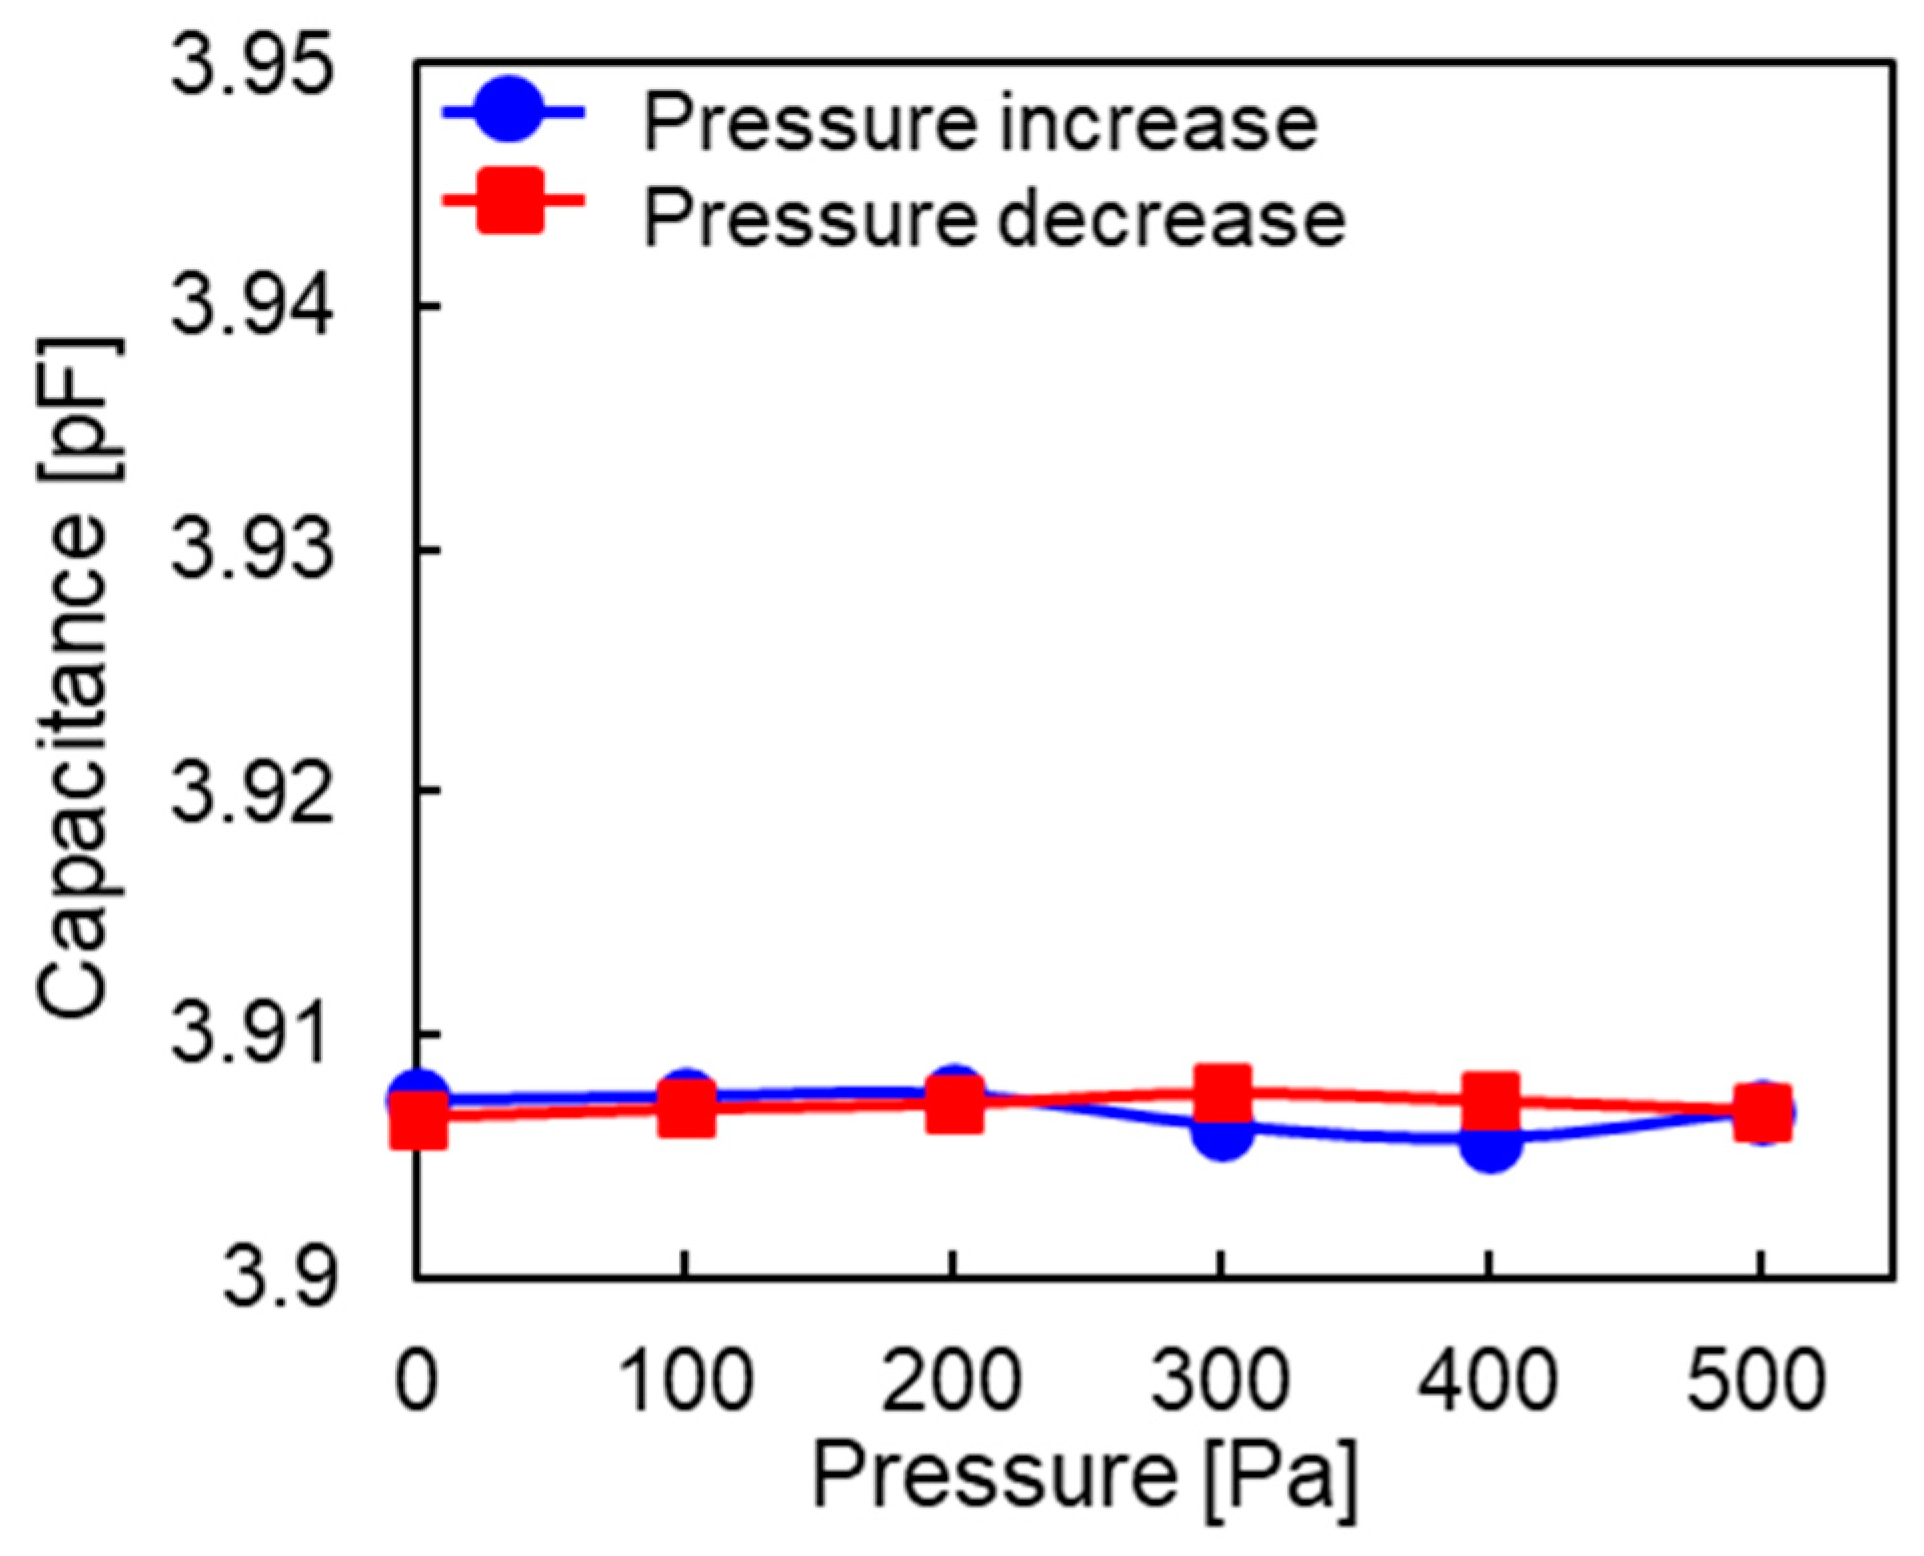
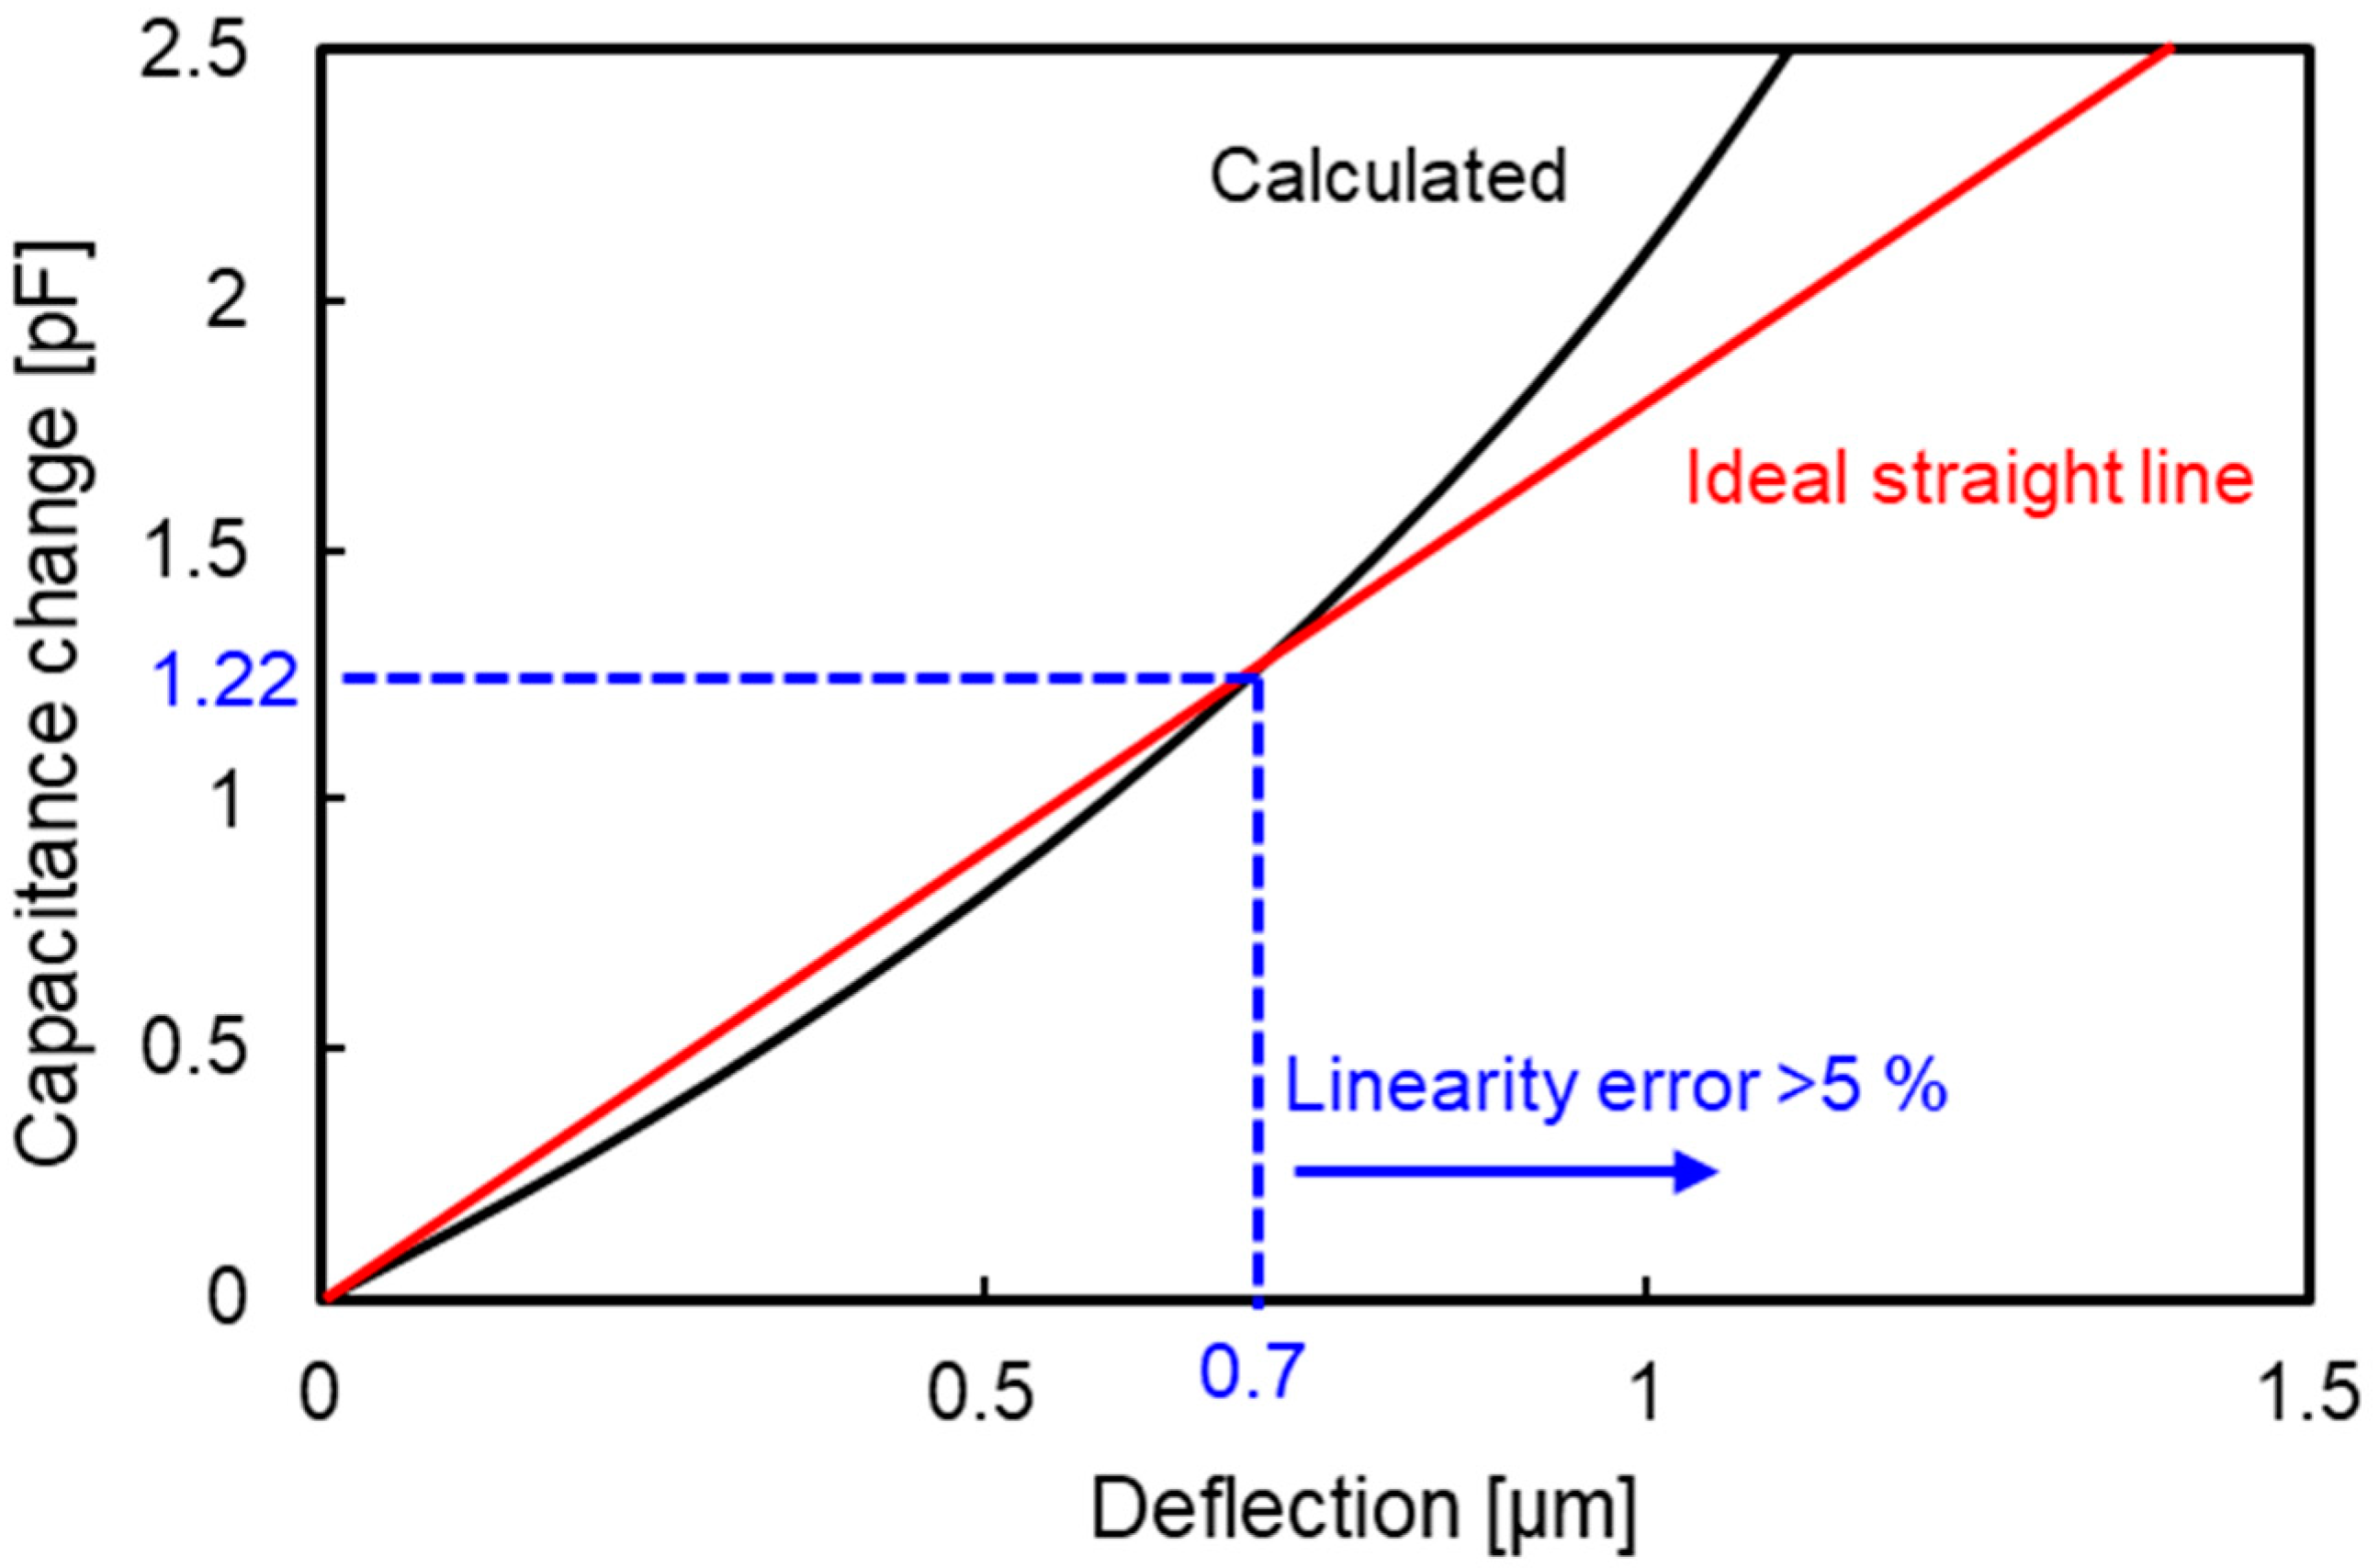
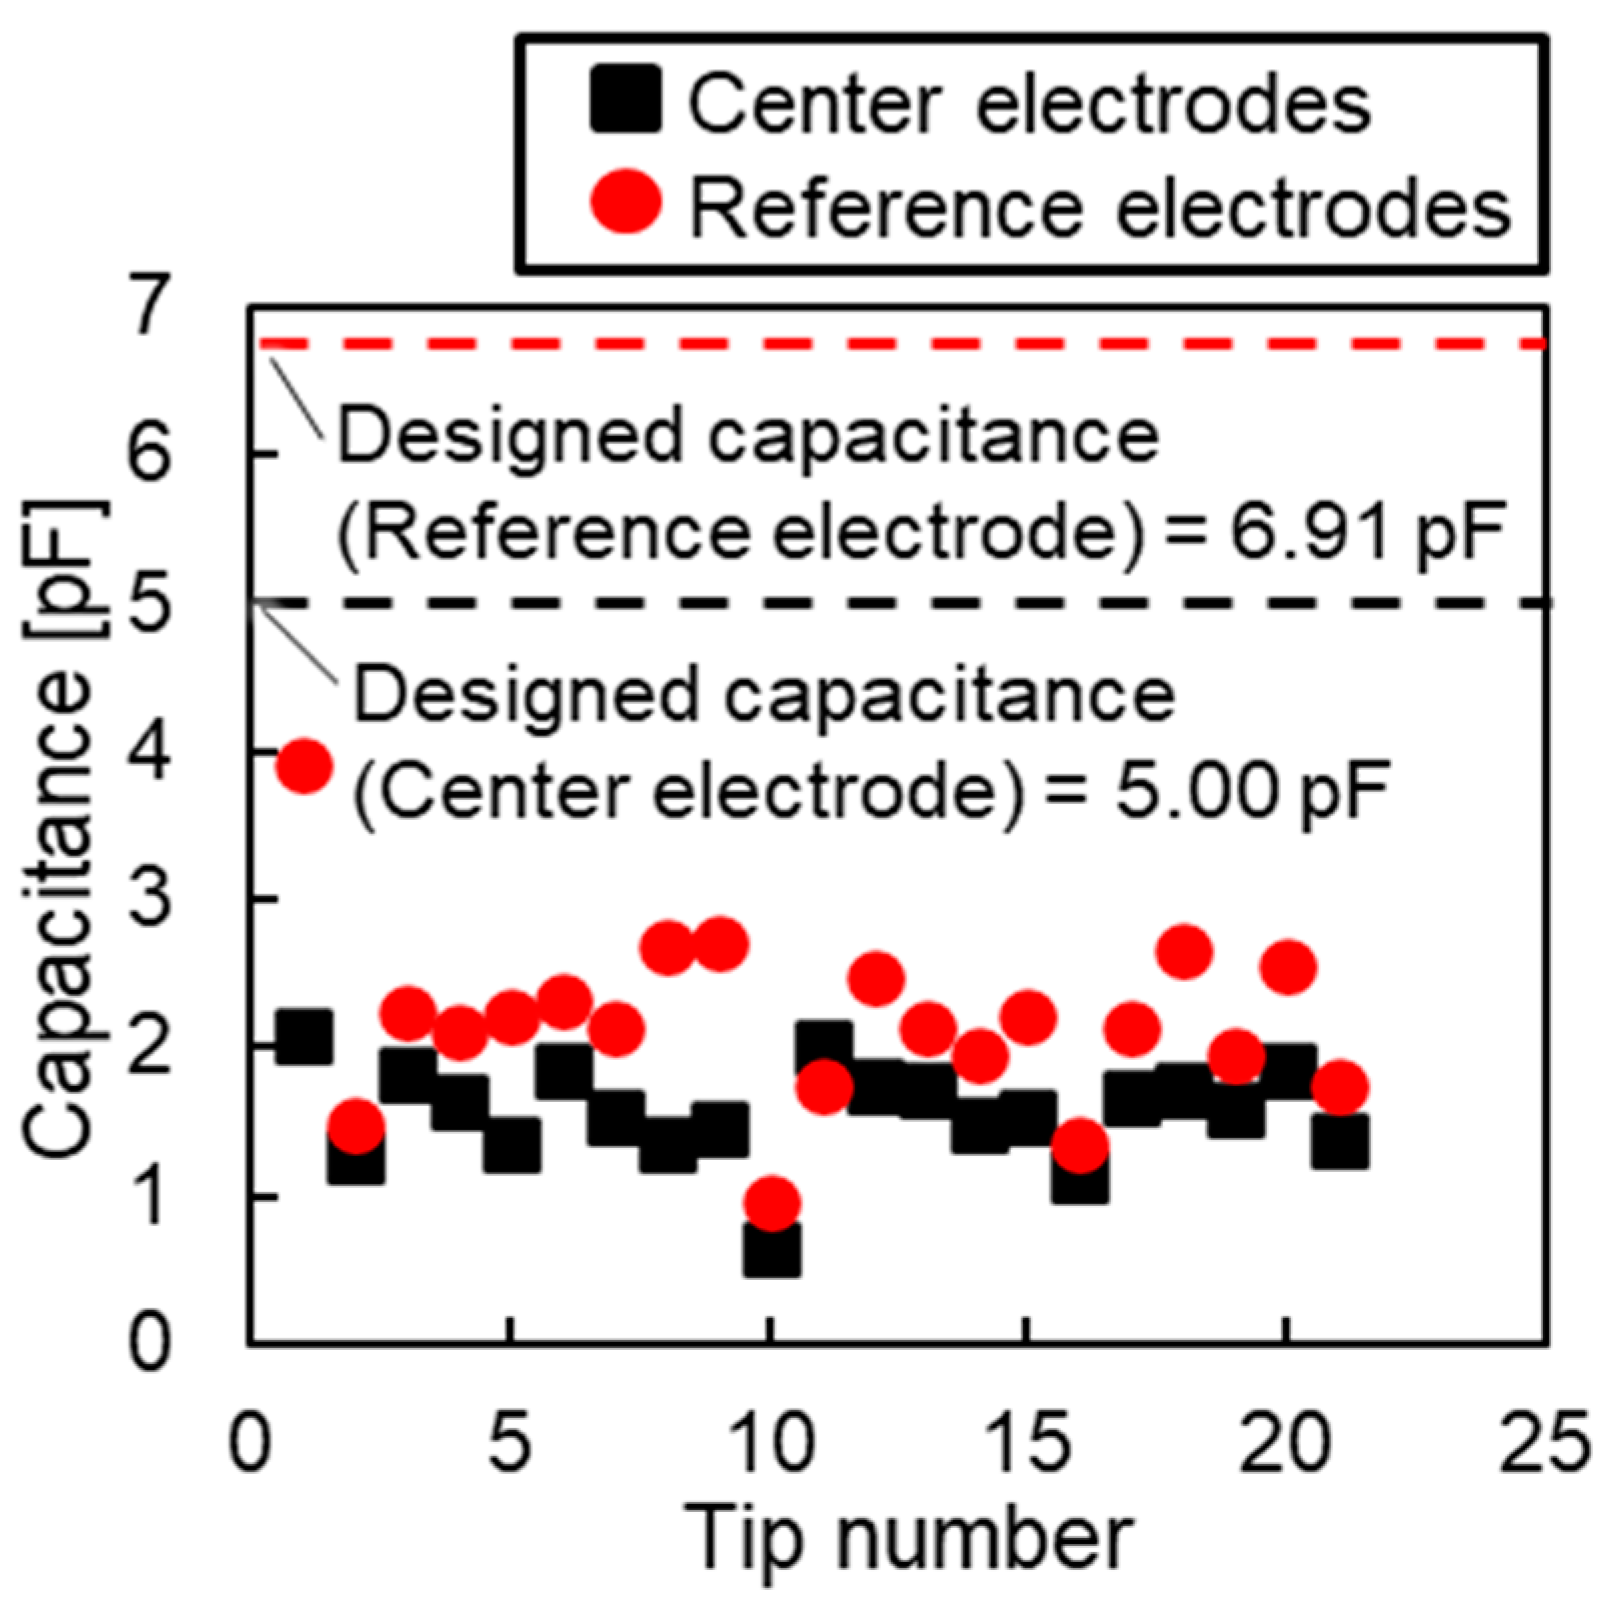
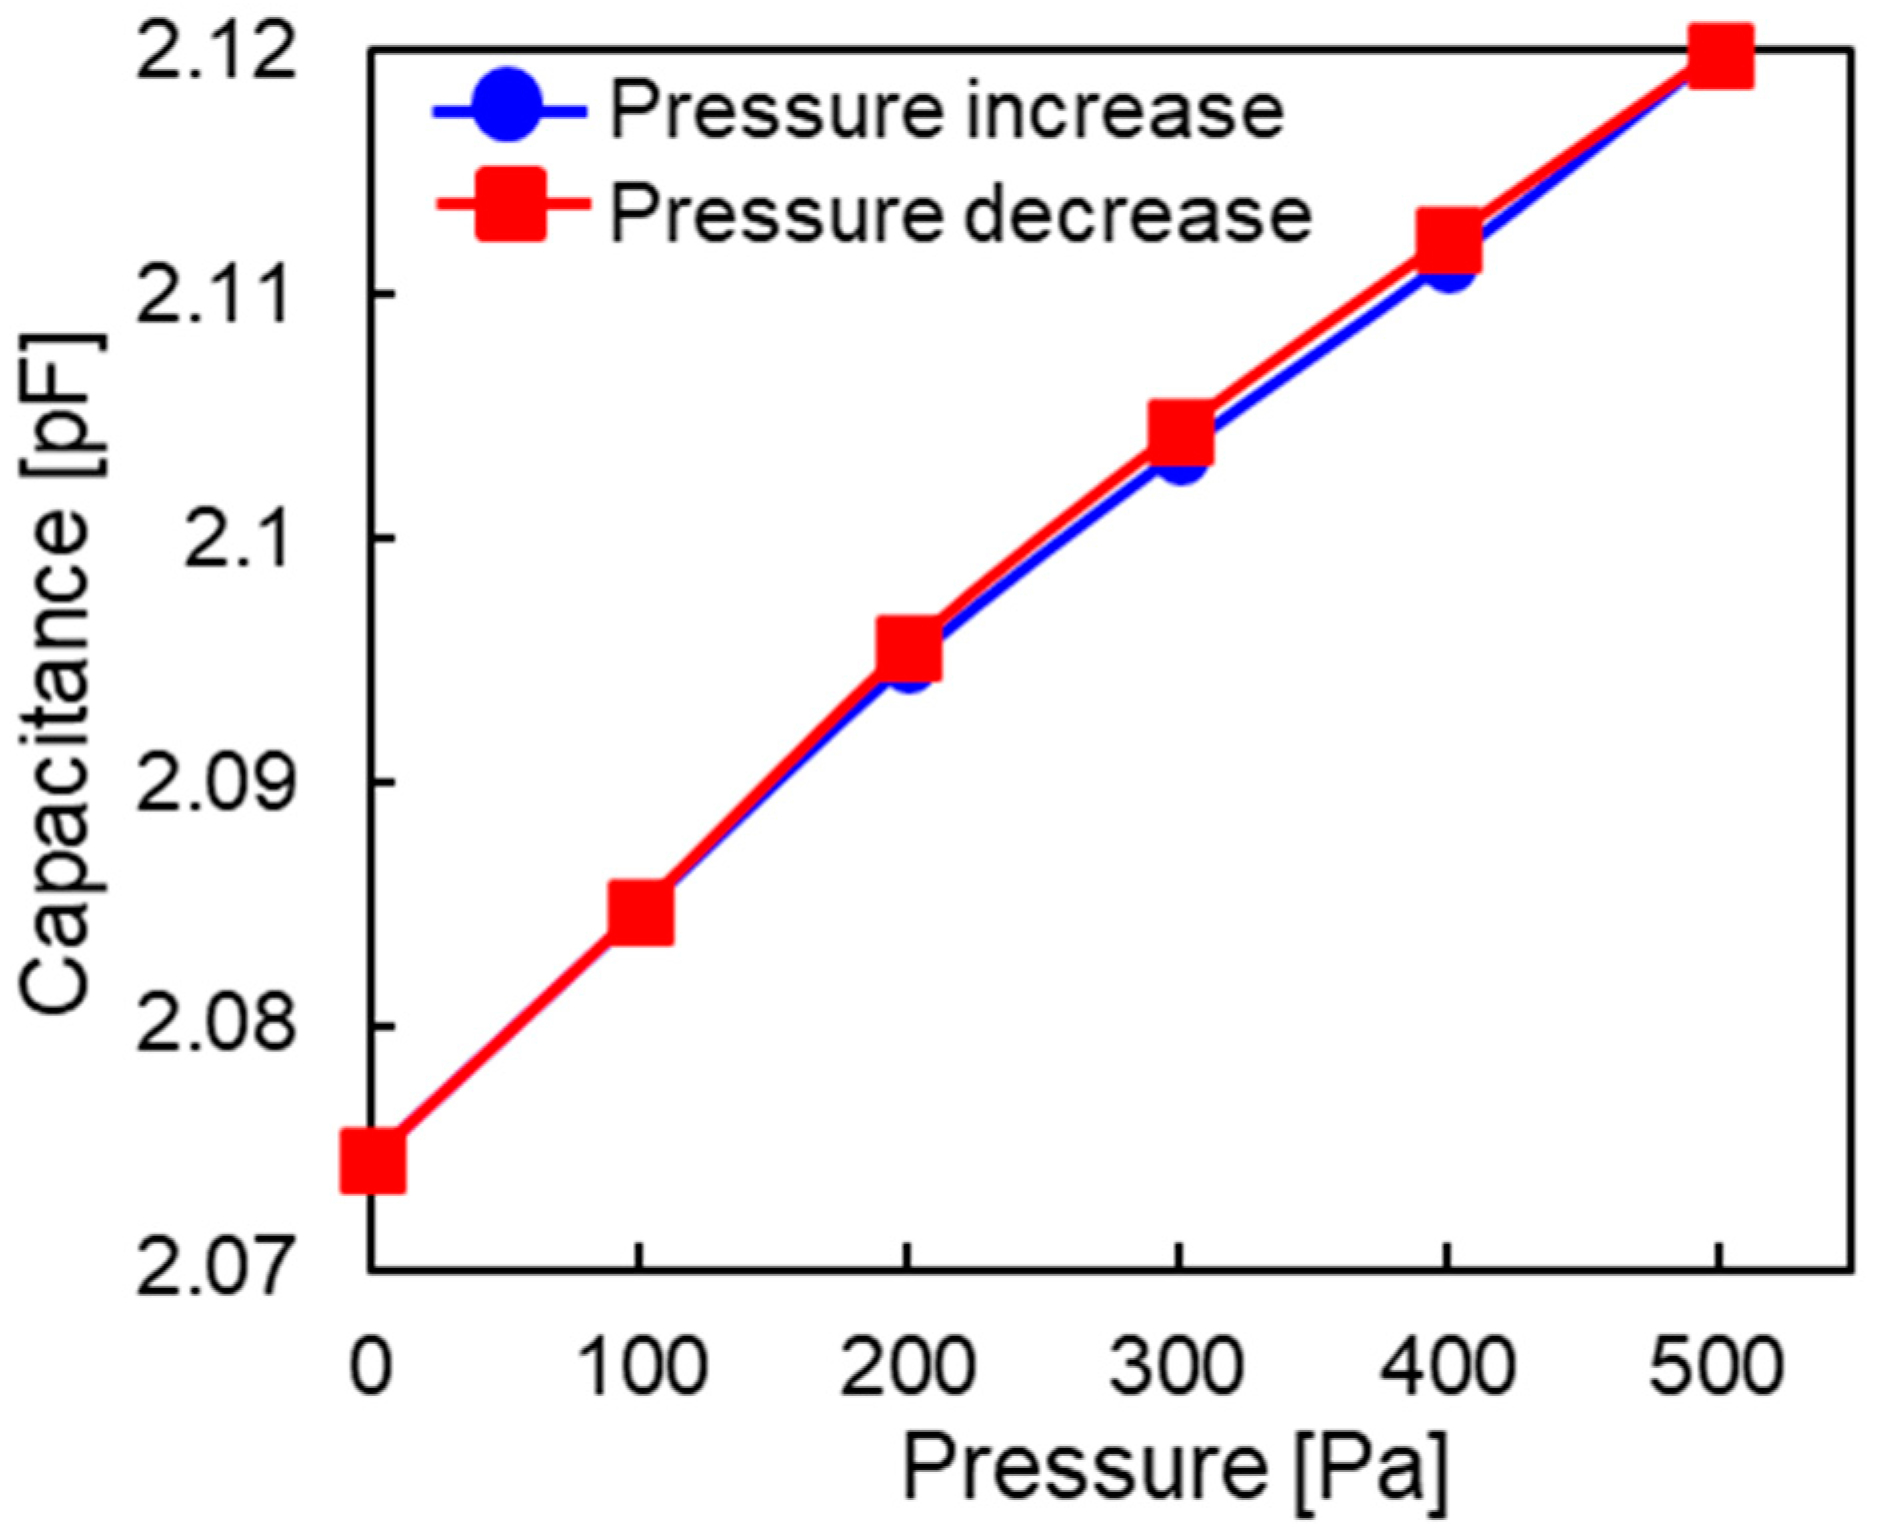
4.2. Evaluation Results
5. Conclusions
Author Contributions
Funding
Institutional Review Board Statement
Informed Consent Statement
Data Availability Statement
Conflicts of Interest
References
- Georgios, A.F.; Paul, C. Global warming and carbon dioxide through sciences. Environ. Int. 2009, 35, 390. [Google Scholar]
- Manufacturers of Emission Controls Association. Emission Control Technologies for Diesel-Powered Vehicles; Manufacturers of Emission Controls Association: Arlington, VA, USA, 2007. [Google Scholar]
- Ayhan, D. Potential applications of renewable energy sources, biomass combustion problems in boiler power systems and combustion related environmental issues. Prog. Energy Combust. Sci. 2005, 31, 171. [Google Scholar]
- Zhang, Y.; Tang, N.; Niu, Y.; Du, X. Wind energy rejection in China: Current status, reasons and perspectives. Renew. Sustain. Energy Rev. 2016, 66, 322. [Google Scholar] [CrossRef]
- Joshua, M.P. Industrial symbiosis of very large-scale photovoltaic manufacturing. Renew. Energy 2007, 33, 1101. [Google Scholar]
- Neil, C.; Alan, H. The disposal of radioactive wastes underground. Proc. Geol. Assoc. 2012, 123, 46. [Google Scholar]
- Georg, S.; Alexander, B.; Thomas, E.J. Comparison of the Chernobyl and Fukushima nuclear accidents: A review of the environmental impacts. Sci. Total Environ. 2014, 470, 800. [Google Scholar]
- Gursan, C.; Gooyert, V. The systemic impact of a transition fuel: Does natural gas help or hinder the energy transition? Renew. Sustain. Energy Rev. 2021, 138, 110552. [Google Scholar] [CrossRef]
- Chiang, C.; Lin, C.K.; Ju, M. An implantable capacitive pressure sensor for biomedical applications. Sens. Actuators A Phys. 2007, 134, 382. [Google Scholar] [CrossRef]
- Sun, C.M.; Wang, C.; Tsai, M.H.; Hsieh, H.S.; Fang, W. Monolithic integration of capacitive sensors using a double-side CMOS MEMS post process. J. Micromechanics Microengineering 2009, 19, 015023. [Google Scholar] [CrossRef]
- Eswaran, P.; Malarvizhi, S. Design Analysis of MEMS Capacitive Differential Pressure Sensor for Aircraft Altimeter. Int. J. Appl. Phys. Math. 2012, 2, 1. [Google Scholar] [CrossRef]
- Eswaran, P.; Malarvizhi, S. MEMS Capacitive Pressure Sensors: A Review on Recent Development and Prospective. Int. J. Eng. Technol. 2013, 5, 2734. [Google Scholar]
- Kubba, A.E.; Hasson, A.; Kubba, A.I.; Hall, G. A micro-capacitive pressure sensor design and modelling. J. Sens. Sens. Syst. 2016, 5, 95. [Google Scholar] [CrossRef]
- Vasileios, M.; Lisa, M.; Fiona, C.D.; Philip, J.W.H.; Marc, P.Y.D. Design, Manufacture and Testing of Capacitive Pressure Sensors for Low-Pressure Measurement Ranges. Micromachines 2017, 8, 41. [Google Scholar]
- Chattopadhyay, M.; Chowdhury, D. Design and performance analysis of MEMS capacitive pressure sensor array for measurement of heart rate. Microsyst. Technol. 2017, 23, 4203. [Google Scholar] [CrossRef]
- Mishra, R.B.; Kumar, S.S.; Mukhiya, R. Analytical Modelling and FEM Simulation of Capacitive Pressure Sensor for Intraocular Pressure Sensing. IOP Conf. Ser. Mater. Sci. Eng. 2018, 404, 012026. [Google Scholar] [CrossRef]
- Rao, K.S.; Samyuktha, W.; Vardhan, D.V.; Naidu, B.G.; Kumar, P.A.; Sravani, K.G.; Guha, K. Design and sensitivity analysis of capacitive MEMS pressure sensor for blood pressure measurement. Microsyst. Technol. 2020, 26, 2371. [Google Scholar] [CrossRef]
- Yu, H.; Yu, X.; Li, Y. Design, fabrication and optimization of a CMOS compatible capacitive pressure sensor. J. Micromechanics Microengineering 2019, 29, 025009. [Google Scholar] [CrossRef]
- Pedersen, T.; Fragiacomo, G.; Hansen, O.; Thomsen, E.V. Highly sensitive micromachined capacitive pressure sensor with reduced hysteresis and low parasitic capacitance. Sens. Actuators A Phys. 2009, 154, 35. [Google Scholar] [CrossRef]
- Han, X.; Li, G.; Xu, M.; Ke, M.; Chen, H.; Feng, Y.; Yan, H.; Li, D. Differential MEMS capacitance diaphragm vacuum gauge with high sensitivity and wide range. Vacuum 2021, 191, 110367. [Google Scholar] [CrossRef]
- Chou, H.S.; Huang, J.C.; Chang, L.W. Mechanical properties of ZrCuTi thin film metallic glass with high content of immiscible tantalum. Surf. Coat. Technol. 2010, 205, 587. [Google Scholar] [CrossRef]
- Cai, C.; Zhang, C.; Sun, Y.; Huang, H.; Yang, C.; Liu, L. ZrCuFeAlAg thin film metallic glass for potential dental applications. Intermetallics 2017, 86, 80. [Google Scholar] [CrossRef]
- Yu, C.; Lee, C.M.; Chu, J.P.; Greene, J.E.; Liaw, P.K. Fracture-resistant thin-film metallic glass: Ultra-high plasticity at room temperature. APL Mater. 2016, 4, 116101. [Google Scholar] [CrossRef]
- Sharpe, W.N.; Yuan, B.; Vaidyanathan, R.; Edwards, R.L. Measurements of Young’s modulus, Poisson’s ratio, and tensile strength of polysilicon. In Proceedings of the IEEE International Conference on Micro Electro Mechanical Systems, Nagoya, Japan, 26–30 January 1997. [Google Scholar]
- Bruckner, W.; Weihnacht, V. Stress relaxation in CuNi thin films. J. Appl. Phys. 1999, 85, 3602. [Google Scholar] [CrossRef]
- Huang, F.; Barnard, J.A.; Weaver, M.L. Mechanical characterization of DC magnetron sputtered amorphous Ti–Al–Cr coatings. Surf. Coat. Technol. 2002, 155, 146. [Google Scholar] [CrossRef]
- Sakurai, J.; Hata, S.; Yamauchi, R.; Shimokohbe, A. Searching for Novel Ru-Based Thin Film Metallic Glass by Combinatorial Arc Plasma Deposition. Jpn. J. Appl. Phys. 2007, 46, 1590. [Google Scholar] [CrossRef]
- Uejima, S.; Oka, C.; Hata, S.; Sakurai, J. Fabrication of Miniaturized Capacitive Pressure Sensor using Thin Film Metallic Glass. In Proceedings of the 2018 International Symposium on Micromechatronics and Human Science, Nagoya, Japan, 9–12 December 2018. [Google Scholar]


| Target | Ru65Zr30Al5 | Cr |
|---|---|---|
| Ar pressure [Pa] | 0.8 | 0.5 |
| RF power [W] | 100 | 100 |
| Time [min] | 40 | 1 |
| Target | Au | Cr |
|---|---|---|
| Ar pressure [Pa] | 1.0 | 1.0 |
| RF power [W] | 200 | 200 |
| Time [min] | 8 | 1 |
| Chip | Central Electrode | Reference Electrode |
|---|---|---|
| Designed initial capacitance [pF] | 5.00 | 6.91 |
| Measured initial capacitance [pF] | 2.08 | 3.90 |
| Estimated gap [µm] | 4.82 | 3.53 |
Disclaimer/Publisher’s Note: The statements, opinions and data contained in all publications are solely those of the individual author(s) and contributor(s) and not of MDPI and/or the editor(s). MDPI and/or the editor(s) disclaim responsibility for any injury to people or property resulting from any ideas, methods, instructions or products referred to in the content. |
© 2023 by the authors. Licensee MDPI, Basel, Switzerland. This article is an open access article distributed under the terms and conditions of the Creative Commons Attribution (CC BY) license (https://creativecommons.org/licenses/by/4.0/).
Share and Cite
Otsuka, H.; Ninoseki, T.; Oka, C.; Hata, S.; Sakurai, J. The Fabrication and Evaluation of a Capacitive Pressure Sensor Using Ru-Based Thin Film Metallic Glass with Structural Relaxation by Heat Treatment. Sensors 2023, 23, 9557. https://doi.org/10.3390/s23239557
Otsuka H, Ninoseki T, Oka C, Hata S, Sakurai J. The Fabrication and Evaluation of a Capacitive Pressure Sensor Using Ru-Based Thin Film Metallic Glass with Structural Relaxation by Heat Treatment. Sensors. 2023; 23(23):9557. https://doi.org/10.3390/s23239557
Chicago/Turabian StyleOtsuka, Hodaka, Takafumi Ninoseki, Chiemi Oka, Seiichi Hata, and Junpei Sakurai. 2023. "The Fabrication and Evaluation of a Capacitive Pressure Sensor Using Ru-Based Thin Film Metallic Glass with Structural Relaxation by Heat Treatment" Sensors 23, no. 23: 9557. https://doi.org/10.3390/s23239557
APA StyleOtsuka, H., Ninoseki, T., Oka, C., Hata, S., & Sakurai, J. (2023). The Fabrication and Evaluation of a Capacitive Pressure Sensor Using Ru-Based Thin Film Metallic Glass with Structural Relaxation by Heat Treatment. Sensors, 23(23), 9557. https://doi.org/10.3390/s23239557