


A Smart Sensing Technologies-Based Intelligent Healthcare System for Diabetes Patients
 , , , and
Abstract
:1. Introduction
- It was assumed that patients do not have serious skin diseases that cause redness or itching due to light absorption.
- It was assumed that patients will not have applied any medicine or compound on a skin area that faces the hardware, such that measurements will not be affected.
2. Related Work

| System Name | No. of Parameters | Sensing Parameters Monitored | Health Condition Checked | Communication Protocol | No. of Layers | Technology Used |
|---|---|---|---|---|---|---|
| A personalized healthcare Monitoring system for diabetic… [25] | 4 | Glucose, heart rate, activity, temperature | Diabetes, general health | Bluetooth, Wi-Fi | 5 | Mobile app, wearables |
| A real-time health monitoring system… [35] | 3 | Heart rate, blood pressure, temperature | Cardiovascular | Wi-Fi | 4 | Wearables, IoT, Zephyr BT |
| IoT-based personal health care monitoring device for diabetic patients [36] | 2 | Glucose, ketones | Diabetes | Wi-Fi | 3 | Mobile app, cloud |
| Wearable IoT enabled real-time health monitoring system [30] | 3 | Heartbeat, temperature, blood pressure | Diabetes, cardiovascular disease, obesity | Wi-Fi | 3 | Mobile app, cloud |
| Proposed article | 5 | Blood glucose, temperature, heart rate, blood pressure, oxygen saturation | Diabetes, general health | Wi-Fi | 6 | Wearable sensor, cloud |
3. Proposed Architecture and Methodology
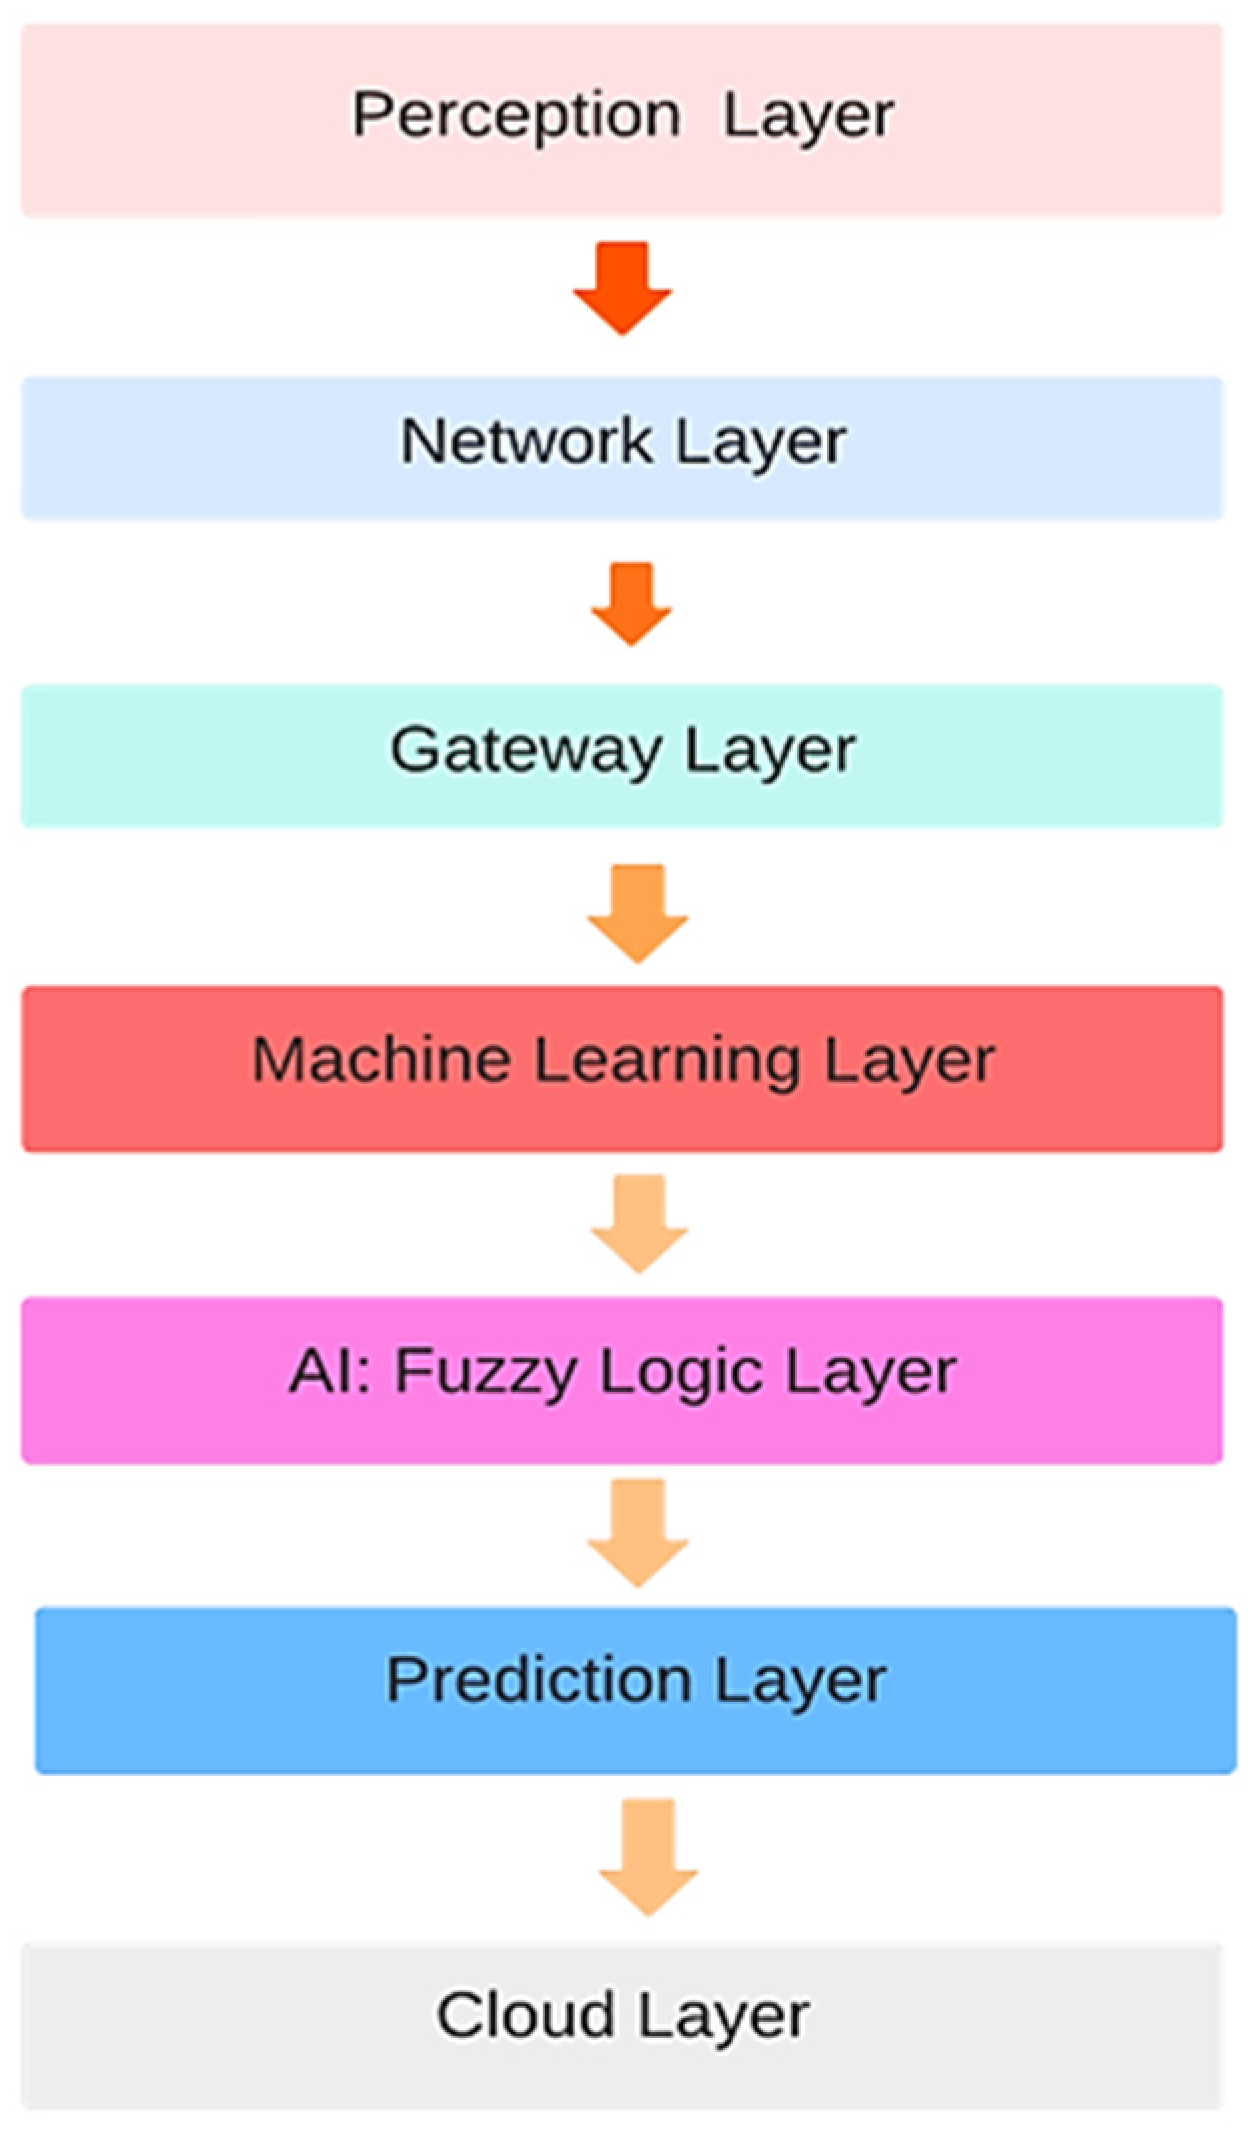
3.1. Layered Architecture
- Perception Layer: This layer represents the interface between the physical world and the digital system. It comprises sensors, wearables, and other data acquisition devices. This layer collects data from various sensors (health monitors) and preprocesses raw sensor data to extract meaningful information. Data filtering filters out noise and irrelevant data to improve data quality.
- Network Layer: This layer focuses on data communication and management. It ensures seamless data transmission between the perception and gateway layers. This layer transmits preprocessed data from the perception layer to the gateway layer. It also utilizes network protocols for efficient data transmission.
- The challenge with network layer is to ensure medical device safety against cyber-attacks or external interferences. Designing a communication architecture in a server like Thing Speak to ensure medical device safety against cyber-attacks or external interference is crucial for healthcare applications. For our proposed system, we used Thing Speak to store IoT data. Thing Speak follows specific design aspects to enhance medical device safety.
- Gateway Layer: This layer acts as an intermediary between the edge devices and the cloud server. This server has strict access controls and user authentication mechanisms. Only authorized users have access to IoT device data. The HTTPS secure protocol, which resists any interception or intrusion of data during transmission from IoT devices, is used. API keys are used to secure data and to control access [38]. This ensures device authentication and thus authorizes and secures data effectively. The system on which we are accessing data is firewalled, and intrusion detection that does not allow any intrusion is used. Data stored on Thing Speak can be protected. Other protection measures can be applied, but we are not using them currently for our data protection.
- Gateway layer processes and filters the incoming data before forwarding it to the cloud. It aggregates and organizes data received from multiple devices for efficient processing. This layer conducts preliminary analytics and data preprocessing to reduce the data load on the cloud. Here, we have applied a smart algorithm to prioritize the emergency data of those patients whose sensor readings are abnormal such that they require urgent healthcare service. This layer converts data to a format compatible with cloud-based processing.
- ML Layer+ (AI) Layer: In this layer, collected data are loaded and, after this, data preprocessing and anomaly handling is performed. As there may be inadequate values, for instance, temperature values, which cannot be 0, 3, or 7, anomalies are removed in this layer. After preprocessing, understanding and feature extraction of the data is performed, and classes of data in different ranges are made. These classes are used as an input to the AI layer and fuzzy logic decision support for making rules and crisp decisions is applied. After decision support from the fuzzy logic, the layer trains ML models on real-time data to learn patterns and identifies unusual patterns or outliers in the data that may indicate potential health issues. It also predicts the likelihood of certain diseases or health conditions based on input data.
- Fuzzy logic is well-suited for situations where data are uncertain and vague. It allows for a clearer understanding of data and can handle cases where traditional binary logic might fail. Fuzzy logic enables a finer level of granularity in decision making. Instead of “yes” or “no” decisions, it allows for more options along a spectrum. This is particularly useful in healthcare, where patients’ health parameters can have varying degrees of severity.
- Fuzzy logic uses linguistic terms and rules that are more intuitive and human-centric. This makes it easier for healthcare professionals and patients to understand and trust the decision-making process. Fuzzy logic-based systems can adapt and learn from data over time. This is important in healthcare, as patient conditions and responses to treatments can change.
- Prediction Layer: This layer is responsible for making predictions and generating actionable insights based on the results obtained from the ML layer. It also provides predictions regarding a patient’s health condition, potential risks, and unhealthy conditions. This layer offers treatment suggestions and personalized information on a patient’s current condition which a doctor can use to take further measures and recommendations based on the ML model outputs. It also generates alerts for healthcare professionals or patients based on critical health indicators or predicted events.
- Cloud Layer: The cloud layer is the centralized computing and storage infrastructure where data are stored, processed, and analyzed. This layer stores vast amounts of historical and real-time data securely. The continuous monitoring of diabetic patients requires continuous uploading of data, for which a storage and access layer is required. Planning for rollback or reverting to a previous state is helpful in managing updates and the security of data. User education regarding updates and security patches means that users can be informed regarding any changes and updates [39]. Regular backups can be performed by downloading data and uploading them to a cloud for their recovery in case of any vulnerability or security issue.
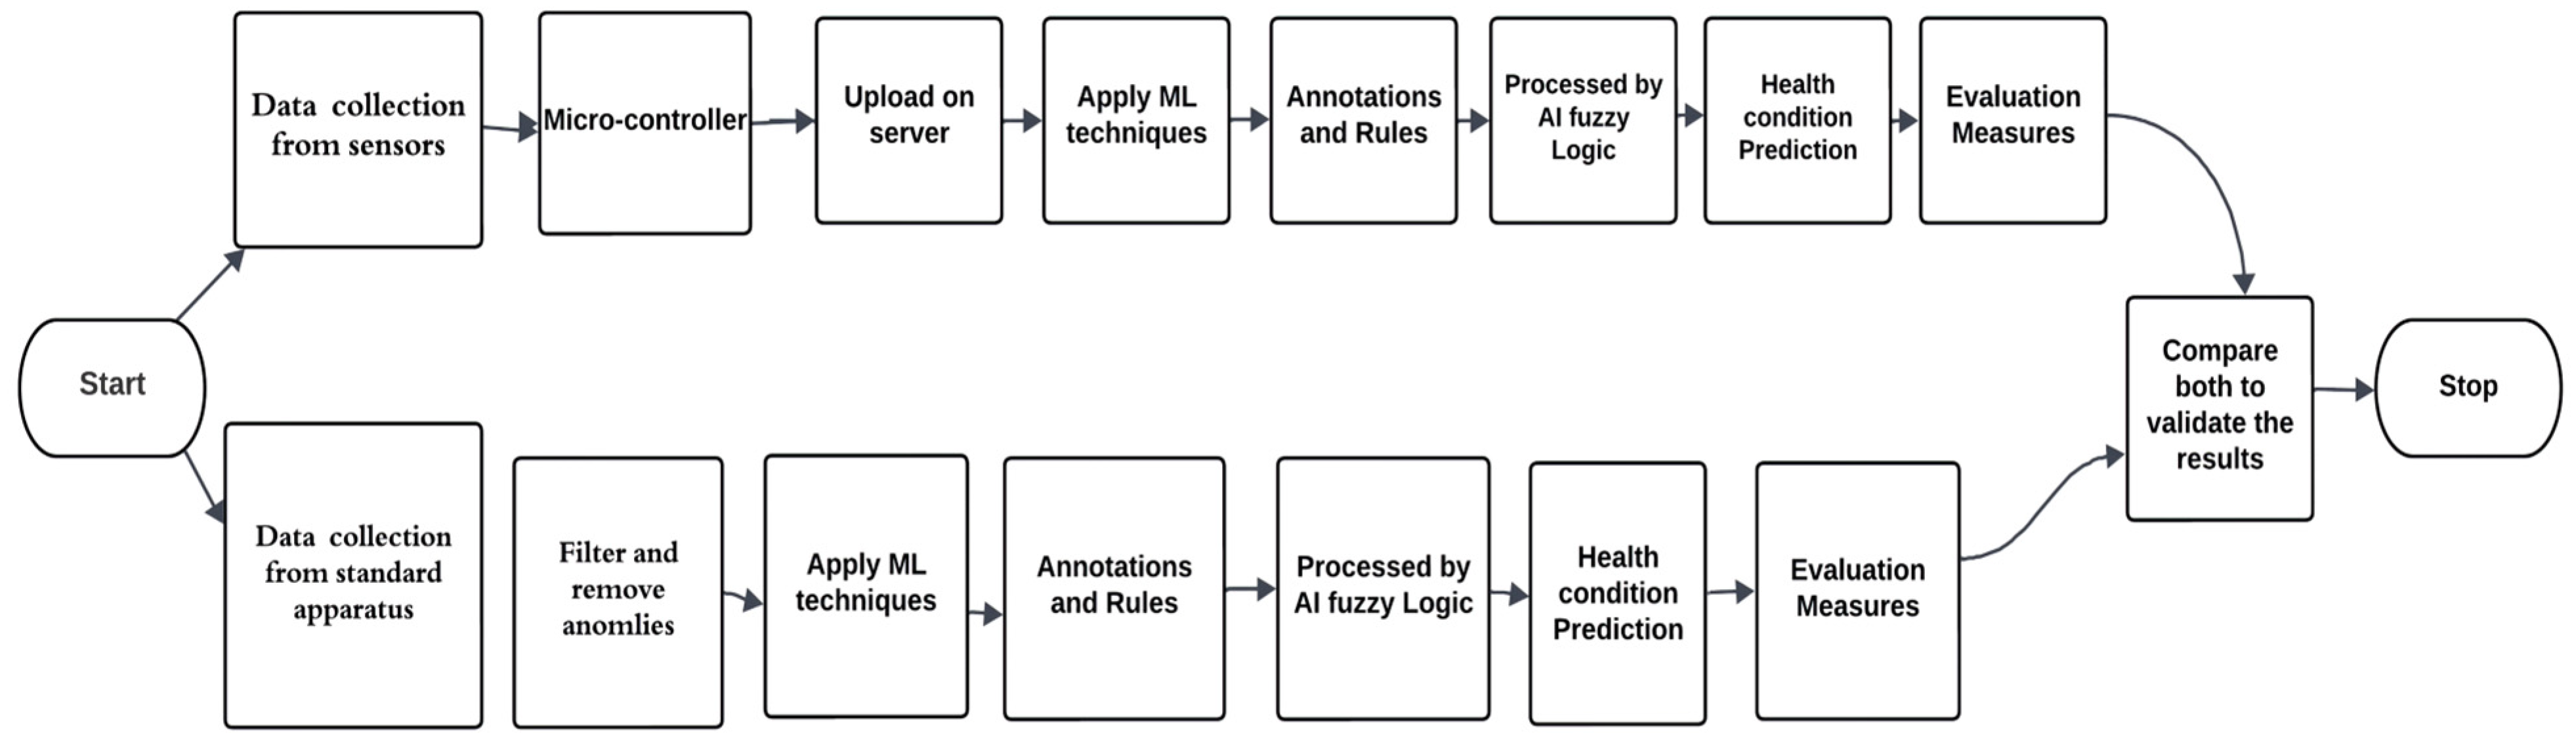
3.2. Proposed Architecture of the Smart Decision Support System
- Data collection from sensors attached to the diabetic patient’s human body. Temporal changes in health condition can be overlooked by continuous monitoring of data and data variation patterns. The doctor can view patterns and graphs on the server that indicate gradual changes in health and previous health statuses predicted by the system. This can minimize the effect of temporal changes and support decisions regarding medication and dosage changes.
- The Arduino Nano is used as a microcontroller that receives the sensed data.
- A smart priority algorithm is applied to sensed data to give priority to emergency data of a patient so that emergency and critical patients can receive doctor’s recommendations effectively.
- Data are uploaded to the IoT server, as the data for continuous monitoring exist in large amounts.
- Data preprocessing and removal of inconsistent and missing data from stored data are performed to mitigate issues.
- For diabetic patient health condition predictions, we applied 5 ML algorithms for current health condition prediction.
- In designing a correct rule base and prepositions, we applied AI using fuzzy logic.
- The patient’s condition is predicted, and the prediction is sent to the relevant practitioner for further suggestions.
3.3. Fuzzy Logic-Based Decision-Support Smart Healthcare System
3.3.1. Fuzzification
- Linguistic variables for temperature: (low, normal, high)
- Linguistic variables for glucose level: (low, normal, elevated, high)
- Linguistic variables for heart rate: (low, normal, high)
- Linguistic variables for oxygen saturation (critical, worrisome, normal)
- Blood pressure
- Low blood pressure: function parameters: (a = 0, b = 0, c = 60, d = 90)
- Normal blood pressure: function parameters: (a = 80, b = 90, c = 100, d = 120)
- Elevated blood pressure: function parameters: (a = 110, b = 120, c = 130, d = 140)
- High blood pressure: function parameters: (a = 130, b = 140, c = 200, d = 200)
- In this case, the membership functions will be trapezoidal, which allows for a plateau in the middle of each category, representing a gradual transition in blood pressure levels.
- b.
- Temperature
- Low temperature: function parameters: a = 0, b = 0, c = 17
- Normal temperature: function parameters: a = 15, b = 20, c = 25
- High temperature: function parameters: a = 23, b = 30, c = 40
- c.
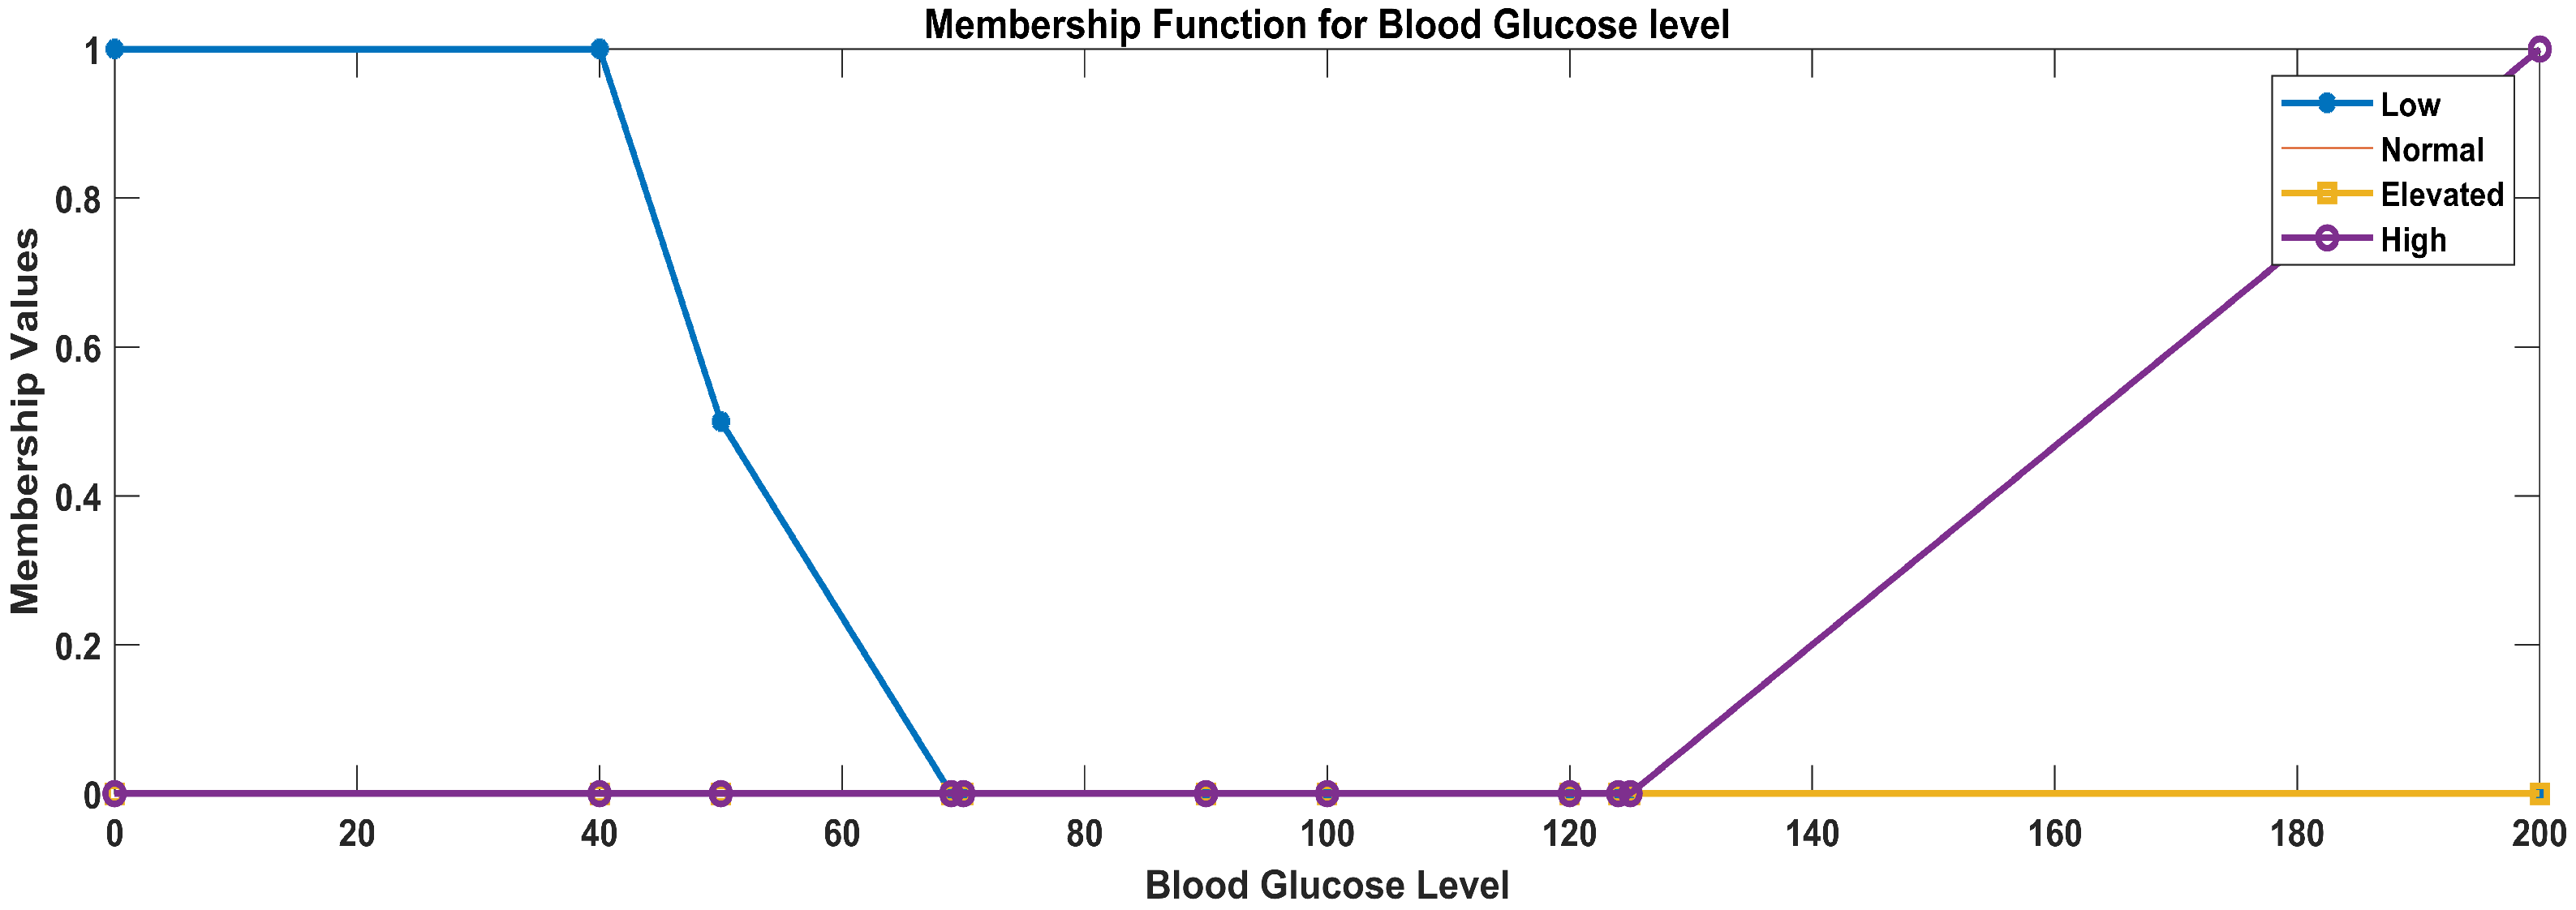
- Glucose level
- Low glucose level: function parameters: a = 0, b = 0, c = 40, d = 70
- Normal glucose level: function parameters: a = 50, b = 70, c = 90, d = 100
- Elevated glucose level: function parameters: a = 90, b = 100, c = 120, d = 125
- High glucose level: function parameters: a = 120, b = 125, c = 200, d = 200
- d.
- Heart rate
- Low heart rate: trapezoidal membership function parameters: a = 0, b = 0, c = 90, d = 109
- Normal heart rate: trapezoidal membership function parameters: a = 100, b = 110, c = 145, d = 155
- High heart rate: trapezoidal membership function parameters: a = 150, b = 156, c = 200, d = 200
- e.
- Oxygen saturation
- Critical oxygen saturation: function parameters: a = 0, b = 0, c = 80, d = 89
- Worrisome oxygen saturation: function parameters: a = 85, b = 90, c = 95, d = 93
- Normal oxygen saturation: function parameters: a = 92, b = 94, c = 100, d = 100
3.3.2. Fuzzy Rule Base
3.3.3. Inference Engine
3.3.4. Rule Evaluation
3.3.5. Defuzzification
3.3.6. Output
3.4. Implementation Details
Glucose Measuring Sensor for Diabetic Patients
- -
- Adjusted the wavelength to the optimal range: 700 nm to 2500 nm;
- -
- Compared the data with standard and actual readings for validation;
- -
- User education.
3.5. Dataset Details
| Algorithm 1 To filter and prioritize sensor data over the network |
| 1 Input: 1. Initialize constants and data structures: Set Normal_Sensor1_Min = Vmin Set Normal_ Sensor1_Max = Vmax Set Normal_Sensor2_Min = Vmin Set Normal_ Sensor2_Max = Vmax (for all sensors) 2 Input 2: Initialize sensor data array:
Read data from each sensor and update sensor queue For each sensor: Read sensor data Update sensor queue with the new data (sensor ID, value, priority) 4 Check for out-of-range sensor data: If sensor data are out of range: Set higher priority for the data packet Update sensor queue priority for the respective sensor 5 Process the priority queue: For each sensor in sensor queue: If priority is high: Trigger alert and send data packet Alerting mechanism (sound) Send the data packet with higher priority 6 Repeat the loop (periodically to continuously monitor the sensors and handle alerts) End algorithm |
4. Results
4.1. System Validation
4.2. Results Analysis for the ML and AI Layers
4.3. Results for the Implementation Details and Data Analysis
5. Conclusions
Author Contributions
Funding
Institutional Review Board Statement
Informed Consent Statement
Data Availability Statement
Conflicts of Interest
References
- Daarani, P.; Kavithamani, A. blood glucose level monitoring by noninvasive method using near infra red sensor. Int. J. Latest Trends Eng. Technol. 2017, 106, 141–147. [Google Scholar] [CrossRef]
- Boursianis, A.D.; Papadopoulou, M.S.; Gotsis, A.; Wan, S.; Sarigiannidis, P.; Nikolaidis, S.; Goudos, S.K. Smart Irrigation System for Precision Agriculture—The AREThOU5A IoT Platform. IEEE Sens. J. 2020, 21, 17539–17547. [Google Scholar] [CrossRef]
- Tajane, A.; Zadode, R.; Kedar, A.; Pandey, P.; Sonawani, S. Tech-Care: Personal Health Monitoring and Prediction System. Int. J. Innov. Res. Sci. Eng. Technol. 2018, 7, 1–4. [Google Scholar]
- Al-Turjman, F.; Alturjman, S. Confidential smart-sensing framework in the IoT era. J. Supercomput. 2018, 74, 5187–5198. [Google Scholar] [CrossRef]
- Abrar, S.; Loo, C.K.; Kubota, N. A Multi-Agent Approach for Personalized Hypertension Risk Prediction. IEEE Access 2021, 9, 75090–75106. [Google Scholar] [CrossRef]
- Bloomgarden, Z.T. Diabetes and COVID-19. J. Diabetes 2020, 12, 347–348. [Google Scholar] [CrossRef]
- Istepanian, R.S.; Hu, S.; Philip, N.Y.; Sungoor, A. The potential of Internet of m-health Things “m-IoT” for non-invasive glucose level sensing. In Proceedings of the 2011 Annual International Conference of the IEEE Engineering in Medicine and Biology Society, Boston, MA, USA, 30 August–3 September 2011. [Google Scholar]
- Krishna, S.; Boren, S.A. Diabetes Self-Management Care via Cell Phone: A Systematic Review. J. Diabetes Sci. Technol. 2008, 2, 509–517. [Google Scholar] [CrossRef]
- Raza, A.; Ali, M.; Ehsan, M.K.; Sodhro, A.H. Spectrum Evaluation in CR-Based Smart Healthcare Systems Using Optimizable Tree Machine Learning Approach. Sensors 2023, 23, 7456. [Google Scholar] [CrossRef]
- Jara, A.J.; Zamora, M.A.; Skarmeta, A.F. HWSN6: Hospital Wireless Sensor Networks Based on 6LoWPAN Technology: Mobility and Fault Tolerance Management. In Proceedings of the International Conference on Computational Science and Engineering, Vancouver, BC, Canada, 29–31 August 2009. [Google Scholar]
- Chen, Y.; Yang, D.; Cheng, B.; Chen, J.; Peng, A.; Yang, C.; Liu, C.; Xiong, M.; Deng, A.; Huang, K.; et al. Clinical Characteristics and Outcomes of Patients with Diabetes and COVID-19 in Association with Glucose-Lowering Medication. Diabetes Care 2020, 43, 1399–1407. [Google Scholar] [CrossRef]
- Shafi, U.F.; Bajwa, I.S.; Anwar, W.; Sattar, H.; Ramzan, S.; Mahmood, A. Umar Farooq Shafi, Sensing Spontaneous Combustion in Agricultural Storage Using IoT and ML. Inventions 2023, 8, 122. [Google Scholar] [CrossRef]
- Xie, J.; Wang, Q. Benchmark Machine Learning Approaches with Classical Time Series Approaches on the Blood Glucose Level Prediction Challenge. In Proceedings of the KDH@IJCAI-ECAI 2018: The 3rd International Workshop on Knowledge Discovery in Healthcare Data, Stockholm, Schweden, 13 July 2018. [Google Scholar]
- Zhou, G.; He, T.; Stankovic, J.A.; Abdelzaher, T. RID: Radio interference detection in wireless sensor networks. In Proceedings of the IEEE 24th Annual Joint Conference of the IEEE Computer and Communications Societies, Miami, FL, USA, 13–17 March 2005. [Google Scholar]
- Sneha, N.; Gangil, T. Analysis of diabetes mellitus for early prediction using optimal features selection. J. Big Data 2019, 6, 13. [Google Scholar] [CrossRef]
- Challoner, A.; Popescu, G.H. Intelligent Sensing Technology, Smart Healthcare Services, and Internet of Medical Things-based Diagnosis. Am. J. Med. Res. 2019, 6, 13–18. [Google Scholar]
- Patel, A.; Raiyani, S.; Singh, A. Health Monitoring Using Wireless Sensors and GSM; Academia.edu: Mumbai, India, 2014–2015. [Google Scholar]
- Valenzuela, F.; García, A.; Ruiz, E.; Vazquez, M.; Cortez, J.; Espinoza, A. An IoT-Based Glucose Monitoring Algorithm to Prevent Diabetes Complications. Appl. Sci. 2020, 10, 921. [Google Scholar] [CrossRef]
- Bandyopadhyay, D.; Sen, J. Internet of Things: Applications and Challenges in Technology and Standardization. Wirel. Pers. Commun. 2011, 58, 49–69. [Google Scholar] [CrossRef]
- Ahmadi, H.; Arji, G.; Shahmoradi, L.; Safdari, R.; Nilashi, M.; Alizadeh, M. The application of internet of things in healthcare: A systematic literature review and classification. Univers. Access Inf. Soc. 2019, 18, 837–869. [Google Scholar] [CrossRef]
- Patil, S.; Modak, C.; Pambhar, B.; Panchal, V.; Shah, H. Wireless Family Health Care Monitoring System. Int. J. Eng. Technol. Res. (IJETR) 2015, 3, 90–92. [Google Scholar]
- Budida, D.A.M.; Mangrulkar, R.S. Design and Implementation of Smart HealthCare System Using IoT. In Proceedings of the 2017 International Conference on Innovations in Information, Embedded and Communication Systems (ICIIECS), Coimbatore, India, 17–18 March 2017. [Google Scholar]
- Rghioui, A.; Lloret, J.; Sendra, S.; Oumnad, A. A smart architecture for diabetic patient monitoring using machine learning algorithms. Healthcare 2020, 8, 348. [Google Scholar] [CrossRef] [PubMed]
- Koubaa, A.; Alves, M.; Tovar, E. A comprehensive simulation study of slotted CSMA/CA for IEEE 802.15.4 wireless sensor networks. In Proceedings of the 2006 IEEE International Workshop on Factory Communication Systems, Torino, Italy, 27–30 June 2006. [Google Scholar]
- Alfian, G.; Syafrudin, M.; Ijaz, M.F.; Syaekhoni, M.A.; Fitriyani, N.L.; Rhee, J. A Personalized Healthcare Monitoring System for Diabetic Patients by Utilizing BLE-Based Sensors and Real-Time Data Processing. Sensors 2018, 18, 2183. [Google Scholar] [CrossRef]
- Islam, M.M.; Rahaman, A.; Islam, M.R. Development of Smart Healthcare Monitoring System in IoT Environment. SN Comput. Sci. 2020, 1, 185. [Google Scholar] [CrossRef]
- Sarwar, B.; Bajwa, I.S.; Jamil, N.; Ramzan, S.; Sarwar, N. An Intelligent Fire Warning Application Using IoT and an Adaptive Neuro-Fuzzy Inference System. Sensors 2019, 19, 3150. [Google Scholar] [CrossRef]
- Chatrati, S.P.; Hossain, G.; Goyal, A.; Bhan, A.; Bhattacharya, S.; Gaurav, D.; Tiwari, S.M. Smart home health monitoring system for predicting type 2 diabetes and hypertension. J. King Saud Univ. Comput. Inf. Sci. 2022, 34, 862–870. [Google Scholar] [CrossRef]
- Qureshi, K.N.; Din, S.; Jeon, G.; Piccialli, F. An accurate and dynamic predictive model for a smart M-Health system using machine learning. Inf. Sci. 2020, 538, 486–502. [Google Scholar] [CrossRef]
- Wan, J.; AAH Al-awlaqi, M.; Li, M.; O’Grady, M.; Gu, X.; Wang, J.; Cao, N. Wearable IoT enabled real-time health monitoring system. EURASIP J. Wirel. Commun. Netw. 2018, 2018, 298. [Google Scholar] [CrossRef]
- Munir, M.S.; Bajwa, I.S.; Cheema, S.M. An intelligent and secure smart watering system using fuzzy logic and blockchain. Comput. Electr. Eng. 2019, 77, 109–119. [Google Scholar] [CrossRef]
- Hameed, K.; Bajwa, I.S.; Ramzan, S.; Anwar, W.; Khan, A. An Intelligent IoT Based Healthcare System Using Fuzzy Neural Network. Sci. Program. 2020, 2020, 8836927. [Google Scholar] [CrossRef]
- Afreen, H.; Bajwa, I.S. An IoT-Based Real-Time Intelligent Monitoring and Notification System of Cold Storage. IEEE Access 2021, 9, 38236–38253. [Google Scholar] [CrossRef]
- Saifullah, M.; Bajwa, I.S.; Ibrahim, M.; Asghar, M. IoT-Enabled Intelligent System for the Radiation Monitoring and Warning Approach. Mob. Inf. Syst. 2022, 2022, 2769958. [Google Scholar] [CrossRef]
- Kakria, P.; Tripathi, N.K.; Kitipawang, P. A Real-Time Health Monitoring System for Remote Cardiac Patients Using Smartphone and Wearable Sensors. Int. J. Telemed. Appl. 2015, 2015, 8. [Google Scholar] [CrossRef]
- Rahman, R.A.; Aziz, N.S.A.; Kassim, M.; Yusof, M.I. IoT-based personal health care monitoring device for diabetic patients. In Proceedings of the 2017 IEEE Symposium on Computer Applications & Industrial Electronics (ISCAIE), Langkawi, Malaysia, 24–25 April 2017. [Google Scholar]
- Raykar, S.S.; Shet, V.N. Design of healthcare system using IoT enabled application. Mater. Today Proc. 2020, 23, 62–67. [Google Scholar] [CrossRef]
- Durga, S.; Nag, R.; Daniel, E. Survey on Machine Learning and Deep Learning Algorithms used in Internet of Things (IoT) Heathcare. In Proceedings of the 2019 3rd International Conference on Computing Methodologies and Communication (ICCMC), Erode, India, 27–29 March 2019. [Google Scholar]
- Chen, C.; Liu, L.; Wan, S.; Hui, X.; Pei, Q. Data Dissemination for Industry 4.0 Applications in Internet of Vehicles Based on Short-term Traffic Prediction. ACM Trans. Internet Technol. (TOIT) 2021, 22, 1–18. [Google Scholar] [CrossRef]
- Venkatasubramanian, K.K.; Gupta, S.K.S.; Jetley, R.P.; Jones, P.L. Interoperable Medical Devices. IEEE Pulse 2010, 1, 16–27. [Google Scholar] [CrossRef]
- Radoglou-Grammatikis, P.; Rompolos, K.; Sarigiannidis, P.; Argyriou, V.; Lagkas, T.; Sarigiannidis, A.; Wan, S. Modeling, Detecting, and Mitigating Threats Against Industrial Healthcare Systems: A Combined Software Defined Networking and Reinforcement Learning Approach. IEEE Trans. Ind. Inform. 2021, 18, 2041–2052. [Google Scholar] [CrossRef]
- Krishnan, S.H.; Vinupritha, P.; Kathirvelu, D. Non-Invasive Glucose Monitoring using Machine Learning. In Proceedings of the 2020 International Conference on Communication and Signal Processing (ICCSP), Chennai, India, 28–30 July 2020. [Google Scholar]


| Smart Health Application Pillars | Simple Health Applications Pillars |
|---|---|
| Patient-centered care | Basic health information |
| Interoperability | Health and fitness tracking |
| Data integration | Medication reminders |
| Telehealth and telemedicine | Simplified user interface |
| Wearable and sensor technologies | Health records |
| Data analytics and machine learning | Accessibility and inclusivity |
| Telemonitoring | Privacy and data protection |
| Health information exchange | - |
| Smart Health Applications | Simple Health Applications | |
|---|---|---|
| Complexity | Smart health applications are more complex and comprehensive, covering a wide range of healthcare aspects. | Simple health applications are more focused and user-friendly. |
| Data integration | Smart health apps emphasize the integration of various healthcare data sources. | Simple health apps typically handle user-generated data only. |
| Advanced technologies | Smart health applications incorporate advanced technologies like AI, ML, and sensor data. | These technologies are less common in simple health applications. |
| Remote care | Remote monitoring, telehealth, and telemedicine are core components of smart health applications, enabling more advanced care delivery. | These systems enable less advanced care delivery. |
| Target audience | Smart health applications may target healthcare professionals and patients with specific health needs. | Simple health applications are designed for a broader consumer audience. |
| Feature | Comparative | Study Analysis | Proposed Work | |
|---|---|---|---|---|
| Focus of study | Remote patient monitoring and diagnostics [22,26] | Chronic disease management [20] | Telemedicine and consultation [32] | Smart sensing and remote monitoring of diabetic patients |
| ML algorithms used | SVM, random forest, KNN | Deep learning (CNN, LSTM) | Decision trees, Naïve Bayes | Support vector algorithm, Gaussian NB, decision tree, random forest, Bernoulli NB |
| Data collection approach | Wearable devices, health sensors | IoT sensors, electronic health records | Remote monitoring devices, health wearables | Wearable health sensors (5 sensors, including a specially designed glucose sensor for diabetic patients) |
| Personalization level | High | Medium | High | High |
| Real-time alerts | Yes | Yes | Yes | Yes |
| Patient engagement strategy | Personalized recommendations, gamification | Health tracking, goal setting | Educational content, interactive interfaces | Beep alerts, graph readings are available |
| Scalability and accessibility | Scalable, cloud-based | Scalable, no cloud access | Scalable | Scalable, cloud access |
| Decision support system | No | No | No | Yes |
| Smart data processing | No | No | No | Yes (give priority to emergency data) |
| ID | Temperature | Heart Rate | Oxygen Level | Blood Pressure | Glucose | Crisp Value of Condition |
|---|---|---|---|---|---|---|
| 1 | Normal | Normal | Critical | Elevated | Normal | 0 |
| 2 | Low | Normal | Worrisome | Elevated | Low | 1 |
| 3 | Low | Low | Worrisome | Normal | Elevated | 3 |
| 4 | Low | Normal | Worrisome | Normal | Low | 0 |
| 5 | Low | Low | Normal | Normal | Elevated | 3 |
| Size | Age | Gender | Ethnicity | Medical Condition | Physiological Data |
|---|---|---|---|---|---|
| 150 | 22–60 | 45% female, 55% male | Punjab, Pakistan | Diabetes | Heart rate, oxygen level, blood glucose level, temperature, and blood pressure |
| Sensor | Ranges | Label |
|---|---|---|
| Temperature | 0–34 | Low |
| Temperature | 35–38 | Normal |
| Temperature | 39 and above | High |
| Blood pressure | 0–90 | Low |
| Blood pressure | 91–119 | Normal |
| Blood pressure | 120–129 | Elevated |
| Blood pressure | 130 and above | High |
| Heart rate | 0–109 | Low |
| Heart rate | 110–155 | Normal |
| Heart rate | 156 and above | High |
| Glucose level | 0–69 | Low |
| Glucose level | 70–100 | Normal |
| Glucose level | 101–124 | Elevated |
| Glucose level | 125 and above | High |
| Oxygen saturation | 0–89 | Critical |
| Oxygen saturation | 90–93 | Worrisome |
| Oxygen saturation | 94 | Normal |
| Temperature | Heart Rate | Oxygen Level | Blood Pressure | Blood Glucose Level | Condition |
|---|---|---|---|---|---|
| Normal | Normal | Critical | Elevated | Normal | Critical |
| Low | Normal | Worrisome | Elevated | Normal | Critical |
| Low | Low | Worrisome | Normal | Normal | Unhealthy |
| Normal | Low | Normal | Low | High | Very critical |
| Low | Low | Critical | Normal | Low | Very critical |
| Low | Low | Worrisome | Low | Normal | Very unhealthy |
| High | Normal | Worrisome | Normal | Normal | Moderate |
| Parameters | Standard Apparatus Measurement (Mean ± SD) | Proposed Apparatus Measurement (Mean ± SD) | MAE (Mean Absolute Error) |
|---|---|---|---|
| Blood glucose level | (104 ± 74.58) mg/d | (99.72 ± 78) mg/d | 3.85 mg/dL |
| Blood pressure | (83.47 ± 31.69) mmHg | (83.36 ± 31.59) mmHg | 0.21 mmHg |
| Heart rate | (87.12 ± 40.2) bpm | (86.73 ± 39.75) bpm | 0.84 bpm |
| Oxygen level | (83.96 ± 18.24) % | (84.17 ± 18.36) % | 0.33% |
| Temperature | (33.24 ± 6.55) F | (33.28 ± 5.92) F | 0.67 F |
| ML Algorithms | Accuracy | F1 Score | Precision | Recall |
|---|---|---|---|---|
| Support Vector Algorithm | 0.70 | 0.30 | 0.27 | 0.36 |
| Gaussian NB | 0.55 | 0.38 | 0.37 | 0.48 |
| Decision Tree | 0.80 | 0.53 | 0.50 | 0.60 |
| Random Forest | 0.85 | 0.75 | 0.72 | 0.80 |
| Bernoulli NB | 0.55 | 0.20 | 0.31 | 0.24 |
| ML Algorithms | Accuracy | F1 | Precision | Recall |
|---|---|---|---|---|
| Support Vector Algorithm | 0.70 | 0.30 | 0.27 | 0.36 |
| Gaussian NB | 0.40 | 0.36 | 0.40 | 0.46 |
| Decision Tree | 0.80 | 0.65 | 0.65 | 0.66 |
| Random Forest | 0.90 | 0.77 | 0.74 | 0.80 |
| Bernoulli NB | 0.55 | 0.20 | 0.21 | 0.24 |
| ML Algorithms | IoT Accuracy | Std. Accuracy |
|---|---|---|
| Support Vector Algorithm | 0.75 | 0.70 |
| Gaussian NB | 0.42 | 0.40 |
| Decision Tree Classifier | 0.81 | 0.80 |
| Random Forest Classifier | 0.93 | 0.90 |
| Bernoulli NB | 0.55 | 0.55 |
Disclaimer/Publisher’s Note: The statements, opinions and data contained in all publications are solely those of the individual author(s) and contributor(s) and not of MDPI and/or the editor(s). MDPI and/or the editor(s) disclaim responsibility for any injury to people or property resulting from any ideas, methods, instructions or products referred to in the content. |
© 2023 by the authors. Licensee MDPI, Basel, Switzerland. This article is an open access article distributed under the terms and conditions of the Creative Commons Attribution (CC BY) license (https://creativecommons.org/licenses/by/4.0/).
Share and Cite
Maqbool, S.; Bajwa, I.S.; Maqbool, S.; Ramzan, S.; Chishty, M.J. A Smart Sensing Technologies-Based Intelligent Healthcare System for Diabetes Patients. Sensors 2023, 23, 9558. https://doi.org/10.3390/s23239558
Maqbool S, Bajwa IS, Maqbool S, Ramzan S, Chishty MJ. A Smart Sensing Technologies-Based Intelligent Healthcare System for Diabetes Patients. Sensors. 2023; 23(23):9558. https://doi.org/10.3390/s23239558
Chicago/Turabian StyleMaqbool, Sana, Imran Sarwar Bajwa, Saba Maqbool, Shabana Ramzan, and Muhammad Junaid Chishty. 2023. "A Smart Sensing Technologies-Based Intelligent Healthcare System for Diabetes Patients" Sensors 23, no. 23: 9558. https://doi.org/10.3390/s23239558
APA StyleMaqbool, S., Bajwa, I. S., Maqbool, S., Ramzan, S., & Chishty, M. J. (2023). A Smart Sensing Technologies-Based Intelligent Healthcare System for Diabetes Patients. Sensors, 23(23), 9558. https://doi.org/10.3390/s23239558