Article

Machine Learning-Based Diabetic Neuropathy and Previous Foot Ulceration Patients Detection Using Electromyography and Ground Reaction Forces during Gait

by
Fahmida Haque
1,
Mamun Bin Ibne Reaz
1,*,
Muhammad Enamul Hoque Chowdhury
2,*,
Maymouna Ezeddin
2,
Serkan Kiranyaz
2,
Mohammed Alhatou
3,4,
Sawal Hamid Md Ali
1,
Ahmad Ashrif A Bakar
1 and
Geetika Srivastava
5
1
Department of Electrical, Electronic and System Engineering, Universiti Kebangsaan Malaysia, Bangi 43600, Malaysia
2
Department of Electrical Engineering, Qatar University, Doha 2713, Qatar
3
Neuromuscular Division, Hamad General Hospital, Doha 3050, Qatar
4
Department of Neurology, Al khor Hospital, Doha 3050, Qatar
5
Department of Physics and Electronics, Dr. Ram Manohar Lohia Avadh University, Faizabad, Uttar Pradesh 224001, India
*
Authors to whom correspondence should be addressed.
Sensors 2022, 22(9), 3507; https://doi.org/10.3390/s22093507
Submission received: 8 March 2022 / Revised: 31 March 2022 / Accepted: 2 April 2022 / Published: 5 May 2022
(This article belongs to the Section Intelligent Sensors)

Abstract

:
Diabetic neuropathy (DN) is one of the prevalent forms of neuropathy that involves alterations in biomechanical changes in the human gait. Diabetic foot ulceration (DFU) is one of the pervasive types of complications that arise due to DN. In the literature, for the last 50 years, researchers have been trying to observe the biomechanical changes due to DN and DFU by studying muscle electromyography (EMG) and ground reaction forces (GRF). However, the literature is contradictory. In such a scenario, we propose using Machine learning techniques to identify DN and DFU patients by using EMG and GRF data. We collected a dataset from the literature which involves three patient groups: Control (n = 6), DN (n = 6), and previous history of DFU (n = 9) and collected three lower limb muscles EMG (tibialis anterior (TA), vastus lateralis (VL), gastrocnemius lateralis (GL)), and three GRF components (GRFx, GRFy, and GRFz). Raw EMG and GRF signals were preprocessed, and different feature extraction techniques were applied to extract the best features from the signals. The extracted feature list was ranked using four different feature ranking techniques, and highly correlated features were removed. In this study, we considered different combinations of muscles and GRF components to find the best performing feature list for the identification of DN and DFU. We trained eight different conventional ML models: Discriminant analysis classifier (DAC), Ensemble classification model (ECM), Kernel classification model (KCM), k-nearest neighbor model (KNN), Linear classification model (LCM), Naive Bayes classifier (NBC), Support vector machine classifier (SVM), and Binary decision classification tree (BDC), to find the best-performing algorithm and optimized that model. We trained the optimized the ML algorithm for different combinations of muscles and GRF component features, and the performance matrix was evaluated. Our study found the KNN algorithm performed well in identifying DN and DFU, and we optimized it before training. We found the best accuracy of 96.18% for EMG analysis using the top 22 features from the chi-square feature ranking technique for features from GL and VL muscles combined. In the GRF analysis, the model showed 98.68% accuracy using the top 7 features from the Feature selection using neighborhood component analysis for the feature combinations from the GRFx-GRFz signal. In conclusion, our study has shown a potential solution for ML application in DN and DFU patient identification using EMG and GRF parameters. With careful signal preprocessing with strategic feature extraction from the biomechanical parameters, optimization of the ML model can provide a potential solution in the diagnosis and stratification of DN and DFU patients from the EMG and GRF signals.

1. Introduction

Diabetic neuropathy (DN) is one of the prevalent forms of neuropathy observed in diabetic patients. It exhibits a deleterious effect on the biomechanical system of the patients, especially showing disorder in the walking cycle, known as the gait cycle [1,2,3,4]. Diabetic neuropathy intensifies the sensitivity loss in somatosensory nerves and dysfunctionality in distal muscles, especially in the lower limbs, which are the prominent reason for the alteration in the electrophysiological and biomechanical system during gait [5,6,7,8,9,10]. Due to the changes in biomechanics during gait, a patient suffers from alteration to plantar pressure, kinematic patterns, ground reaction forces, and muscle activities. Long-term alteration to the biomechanics leads to foot ulceration and, in worsening cases, amputation of the lower limb [5,6,7,11,12,13,14,15,16]. Foot ulceration is one of the pervasive types of long-term chronic complications in DN patients, which indicates worsening DN [17,18].
From the literature, it can be found that due to DN, patients exhibited delayed muscle activation peak of the tibialis anterior (TA), vastus lateralis (VL), gastrocnemius lateralis (GL), and gastrocnemius medialis (GM) muscles in different phases of the gait cycle [4,5,8,9,11,12,14,19,20,21]. The changes in lower limb muscle activities during gait of DN patients are also related to other alterations, such as higher plantar pressure distribution, greater stance phase, modified ground reaction forces (GRF), and moments of force [6,12,13,22,23,24] In Akashi et al.’s study [5], they showed that DN patients with and without a history of plantar ulceration had a delayed activation peak and a decrease in the second peak of vertical ground reaction force comparing with the control group in VL and GL muscles during gait. Another study by Sacco et al. [6] and Abboud et al. [22] showed delayed muscle activation and decreased muscle amplitude of TA muscle for DN patients. Sawacha et al. [15] found an alteration in gait in DN patients and suggested that this can be a predictive indicator for the risk of ulceration.
Although these studies claim the relationship between the alteration of lower limb muscles and DN, few studies reported prolonged activity in VL, GL, GM, and rectus femoris muscles and GRF in patients without DN [5,14,20,22,24]. With these controversies in studies regarding the biomechanical changes in lower limb muscles for patients with and without DN, such claims are not reliable just by analyzing EMG and GRF signals. Depending on the variability of the population recruited for these studies, the biomechanical changes in muscle EMG and GRF during gait can be varied among the same experimental groups, depending on the patient’s ability to adapt to the changes in gait. Patients did not exhibit any patterned delay in the muscle activation functions, which can cause unreliable diagnosis [6,12]. With the help of Machine Learning (ML), EMG and GRF signal analysis can be made more robust and overcome the variability in the research regarding the patient’s identification.
Foot ulceration is the main precursor to lower limb amputation in patients with diabetes worldwide [24]. Most foot ulcers are triggered by diabetes-associated peripheral neuropathy (DPN) [25,26]. A study by Allen et al. [27] showed that 23% of those with a diabetic foot ulcer had DPN, compared to only 6% of those without a foot ulcer. It can be hypothesized that due to DPN, patients with active plantar DFUs would continue to demonstrate similar abnormal lower limb biomechanical characteristics as displayed before the DFU formation [17,28]. A nonhealing diabetic foot pressure ulcer could eventually lead to amputation of the foot [29].
For the past 50 years, researchers have been using EMG signals to identify neuromuscular diseases by collecting the signals from the diagnosed region of interest in the human body and analyzing them manually [30]. However, manual analysis of bio-signals such as EMG can be challenging. As previously discussed, EMG signals in DN patients might not always follow any specific pattern. In such cases, the raw signal analysis does not provide much information from the EMG signals. In such cases, from the EMG and GRF signals, with the help of machine learning, many important features can be extracted using feature extraction techniques [31]. In addition, the classification of different disease classes with the help of ML by using EMG is becoming popular.
In recent literature, the use of EMG-based pattern recognition systems [32,33], human-machine interaction [34,35], and myoelectric controller [36] with ML is becoming popular. However, its application in disease identification is very limited, especially in DN diagnosis. Fahmida et al. [9] proposed an adaptive neuro-fuzzy inference system-based classifier for diabetic sensorimotor polyneuropathy (DSPN) severity classification by using features from three lower limb muscles’ (TA, VL, GM) EMGs during gait. Their study used only two EMG features based on the current literature time for activation peak and peak magnitude during gait with the progression of DSPN severity. They trained two different models; in one model, they used only the peak magnitudes from three different lower limb muscles, and in another model, they considered both the features of all three muscles. They reported 96% and 80% accuracy for both models, respectively.
Taking this into account, the objective of this work is to contribute to the state-of-the-art focus on the ML-based classification technique of DN and diabetic foot ulceration (DFU) patients by using EMG and GRF. As per our knowledge, this is the first ML-based work to classify DN and DUF patients using EMG and GRF data during gait. In this study, we collected data from the Akashi et al. [5] study, where they took three patients’ classes, control, DN, and DFU, and observed the EMG and GRF characteristics during gait. After the raw data preprocessing, we used the feature extraction technique on the EMG and GRF data. For EMG data, we used the feature extraction technique previously proposed by our team [37], where two novel time–domain features with another 17 existing time–domain features were combined. For GRF data, we extracted 195-time, frequency, and time–frequency domain features. For both EMG and GRA, extracted features were ranked using different ML-based feature ranking techniques, and highly correlated data were removed. We trained different conventional machine learning algorithms to find the best performing algorithm. After finding the best-performing algorithm, we tuned the hyperparameters of the ML algorithm and trained them for different cases, and their performance was evaluated. Our main objective was to find the best performing feature combination from EMG and GRF with the best performing ML model to accurately classify DN and DFU patients.
This research helps to find the best performing optimized ML model with best performing EMG and GRF features for identifying DN and DFU patients. As per our knowledge, this is the first ML-based work to classify DN and DUF patients using EMG and GRF data during gait. This study helps to work as a secondary decision system to analyze EMG and GRF data and accurately identify DN and DFU patients.

2. Materials and Methods

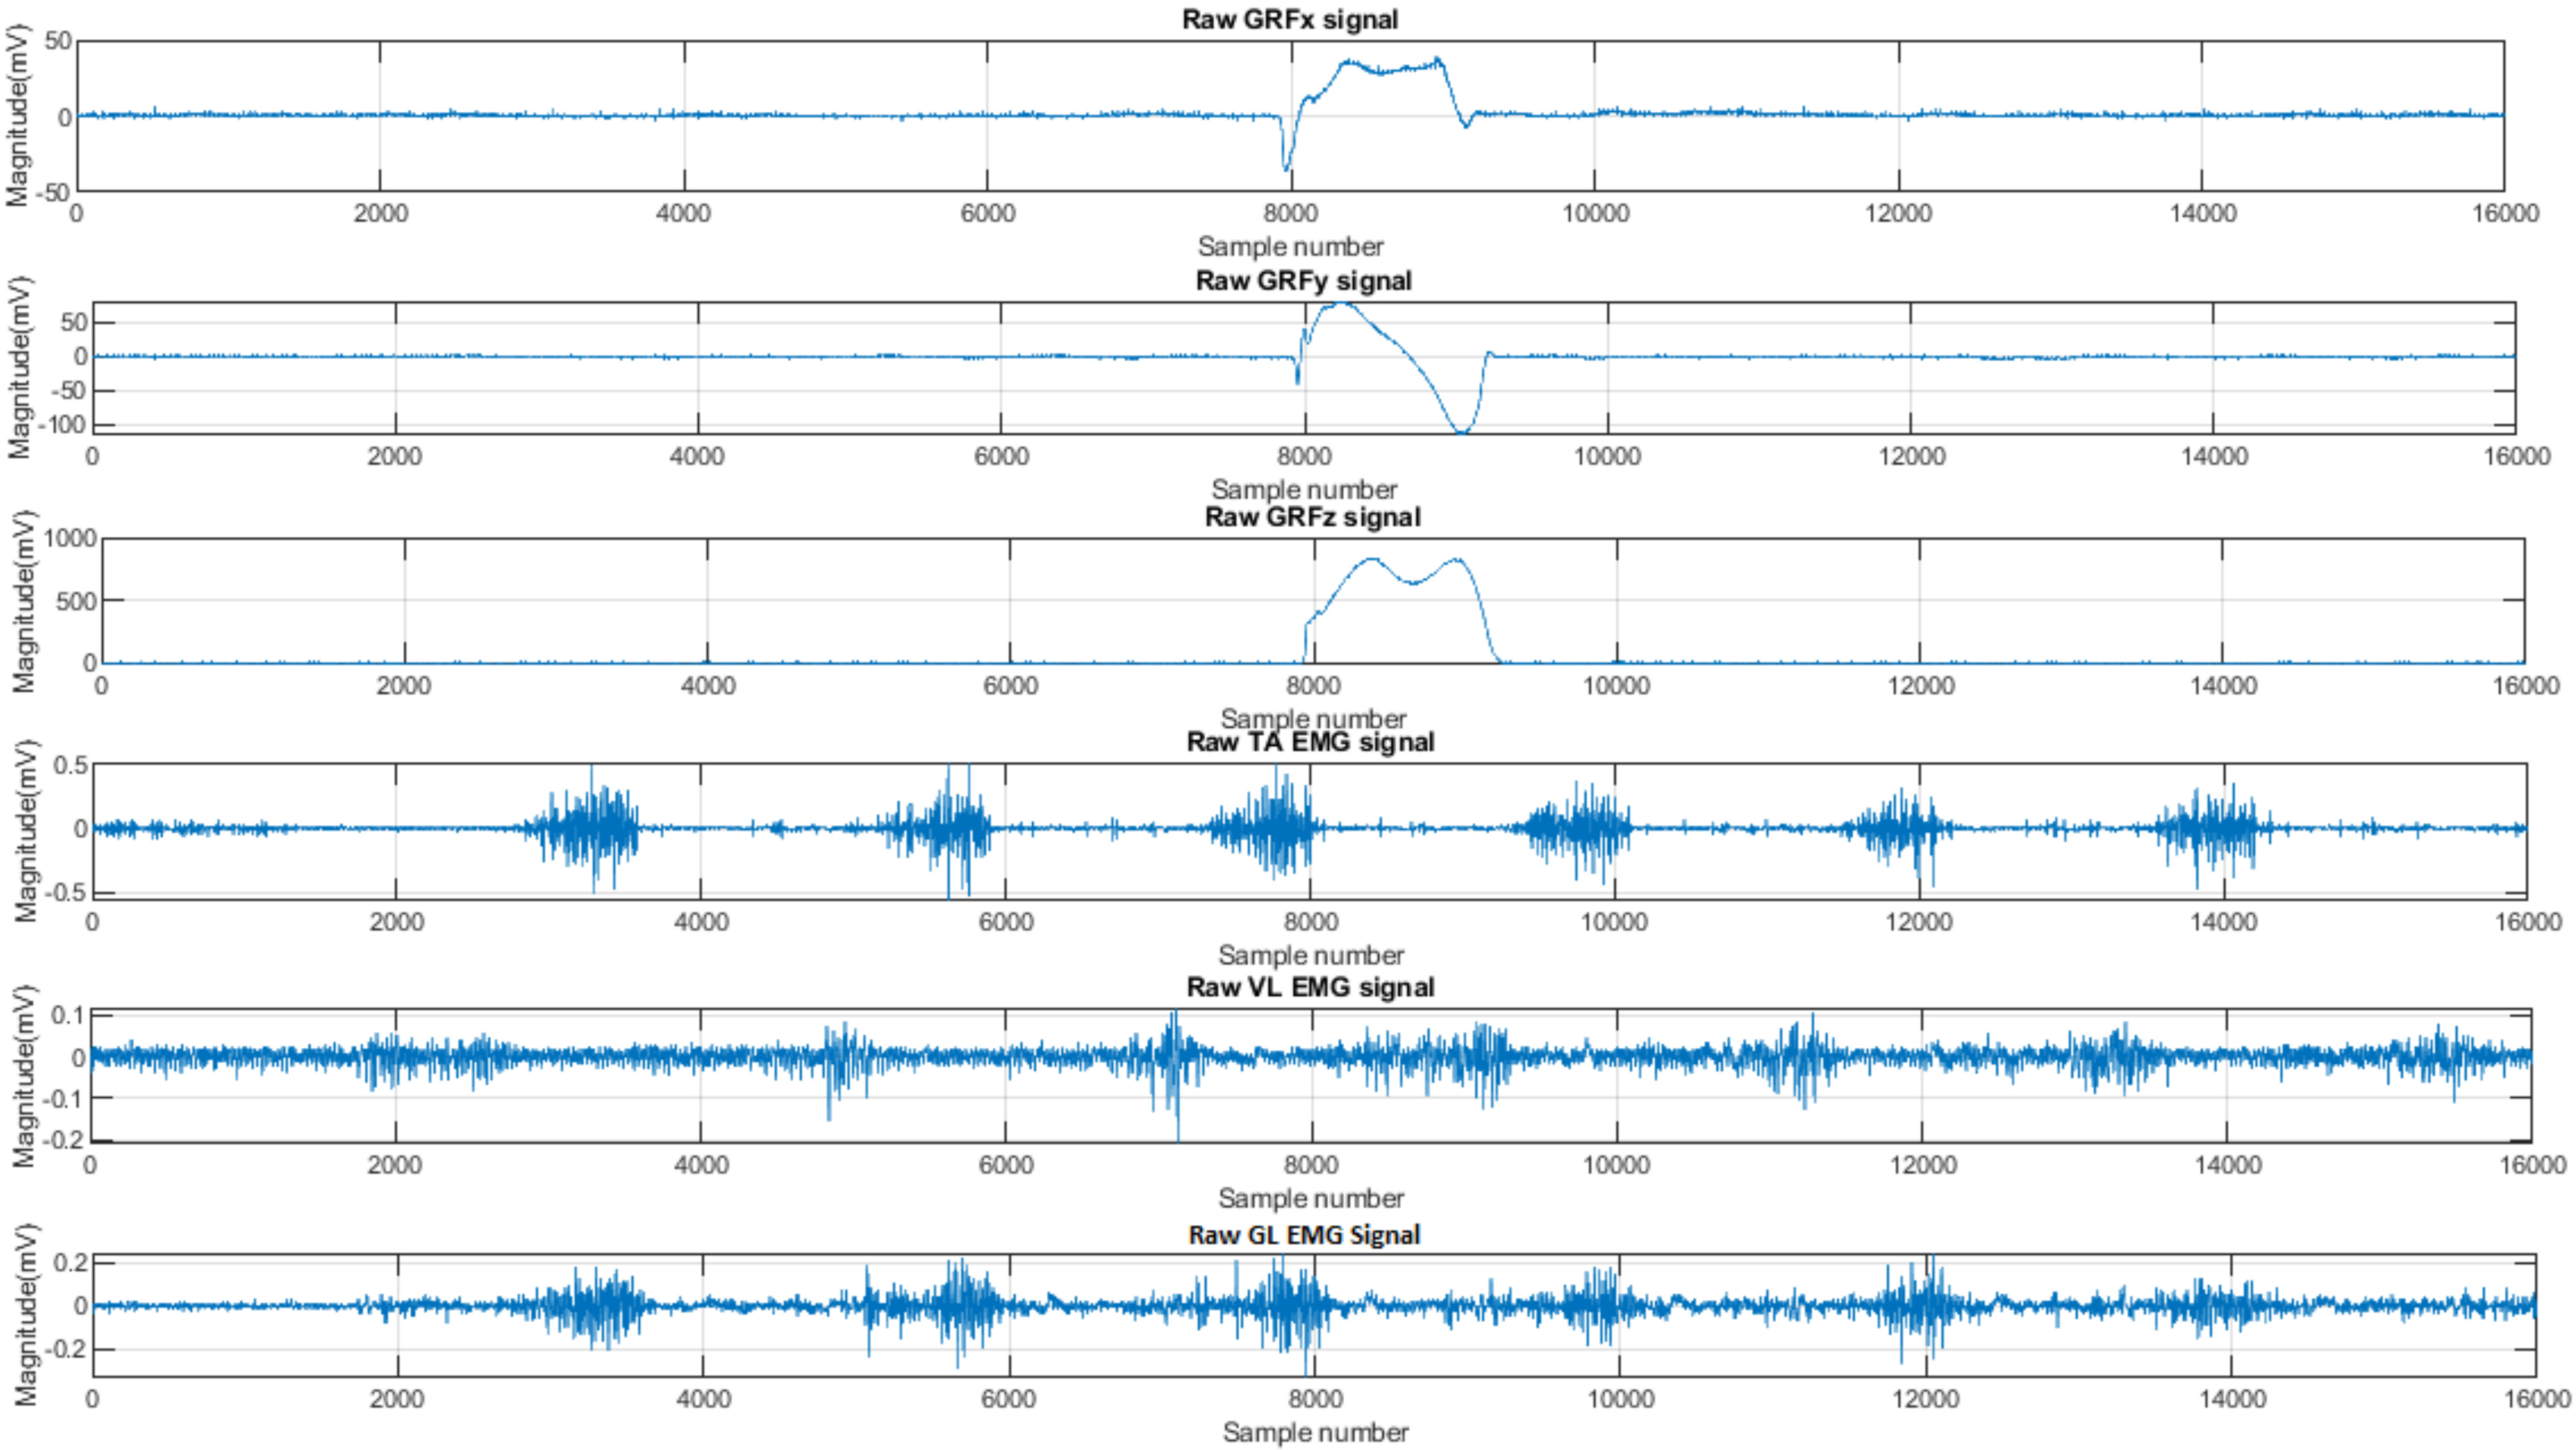
2.1. Dataset Description

The database of EMG and corresponding GRF data was collected from the Akashi et al. [5] study. The study involved 45 adults with at least 5 years post-onset of Type 2 diabetes, divided into three groups: A control group (n = 16), a diabetic neuropathic group (n = 19), and a diabetic neuropathic group with a previous history of plantar ulceration (n = 10). However, the available dataset consisted of a total of 21 subjects from three different groups: control (n = 6), diabetic neuropathy (n = 6), and diabetic neuropathy with ulceration (n = 9). The data consisted of EMG of the right vastus lateralis (VL), gastrocnemius lateral (GL), and tibialis anterior (TA), and the 3-dimensional components of ground reaction force (GRFx, GRFy, GRFz) raw signals. In Figure 1, a sample of these EMG and GRF signals collected from the study [5] is shown. The data were sampled at 1000 Hz and collected according to the experimental procedure in [5]. The patients were examined for neuropathy using the Michigan neuropathy screening instrument (MNSI). The detailed protocol of the study has been explained by the Akashi et al. [5] study. Supplementary Table S1 summarizes the total data samples after segmentation and quality evaluation, where some examples refer to the segmented signals.

2.2. Signal Processing

The raw data were segmented using the Vertical ground reaction force (vGRF) and evaluated semi-manually at the preprocessing stage. The EMG signals were passed through a full-wave rectifier and band-pass Butterworth fourth-order Infinite Impulse Response (IIR) Zero-Phase filter. To meet the Nyquist certation, the filter cutoff frequency was selected between 25 and 499 Hz [38]. After that, the signal was passed through a digital notch filter to remove 60 Hz noise and its harmonics. The filters were designed using MATLAB R2020a software (MathWorks, Natick, MA, USA). After filtration, the EMG signals were segmented using vGRF to obtain the signal during the gait cycle and normalized by the mean of the EMG signal. The GRF signals had high-frequency noises, which could hamper the feature extraction process. Therefore, the GRF signals were filtered using a low pass Butterworth fourth-order Infinite Impulse Response (IIR) Zero-Phase Filter, implemented in MATLAB. The filter cutoff frequency was chosen to be 100 Hz. Unfitted data were removed from the 3 dimensions of the GRF signals after segmentation and normalized by signal mean.

2.3. Feature Extraction

2.3.1. EMG Feature Extraction

Preprocessed EMG signals were used for feature extraction. In our previous study, we proposed two new time–domain features [37]: the log of the mean absolute value (LMAV) and the nonlinear scaled value (NSV). The details regarding these two features can be found in [37]. In this work, we showed that these time–domain features incorporated with another 17-time domain features from the existing literature exhibited better performance in the pattern recognition problem. So, we have used the proposed feature extraction scheme to identify diabetic neuropathic patients with and without a previous history of foot ulceration from EMG and GRF signals. In this research, we have used nineteen time–domain features previously reported by Islam et al. [37]. The extracted time–domain features were the log of the mean absolute value (LMAV), nonlinear scaled value (NSV), waveform length (WL), Wilson amplitude (WAMP), slope sign changes (SSC), number of zero crossings (ZC), mobility (MOB), complexity (COM), and skewness (SKW), and four autoregressive coefficients (AR1, AR2, AR3, and AR4), Moment (0th, 2nd, 4th, and 6th order) (m0-m6), Amplitude Change (1 and 2) (AC1, AC2).

2.3.2. GRF Feature Extraction

A detailed investigation was done for extracting features from GRF signals. We extracted time (TD) [39], frequency (FD) [40,41], time–frequency (TFD) domain [42] features from the three GRF component signals. In this study, we extracted TFD features using discreet wavelet decomposition (DWT) [43,44] techniques. The DWT coefficient (detailed D1-D8, and their composed cD, Approximation A6-A8, and cA8) was then used to obtain band different TFD features. In this study, we extracted 50 TA, 24 FD, and 121 TFD features. In total, 195 features were calculated. The details of these features are indexed in Supplementary Table S2.

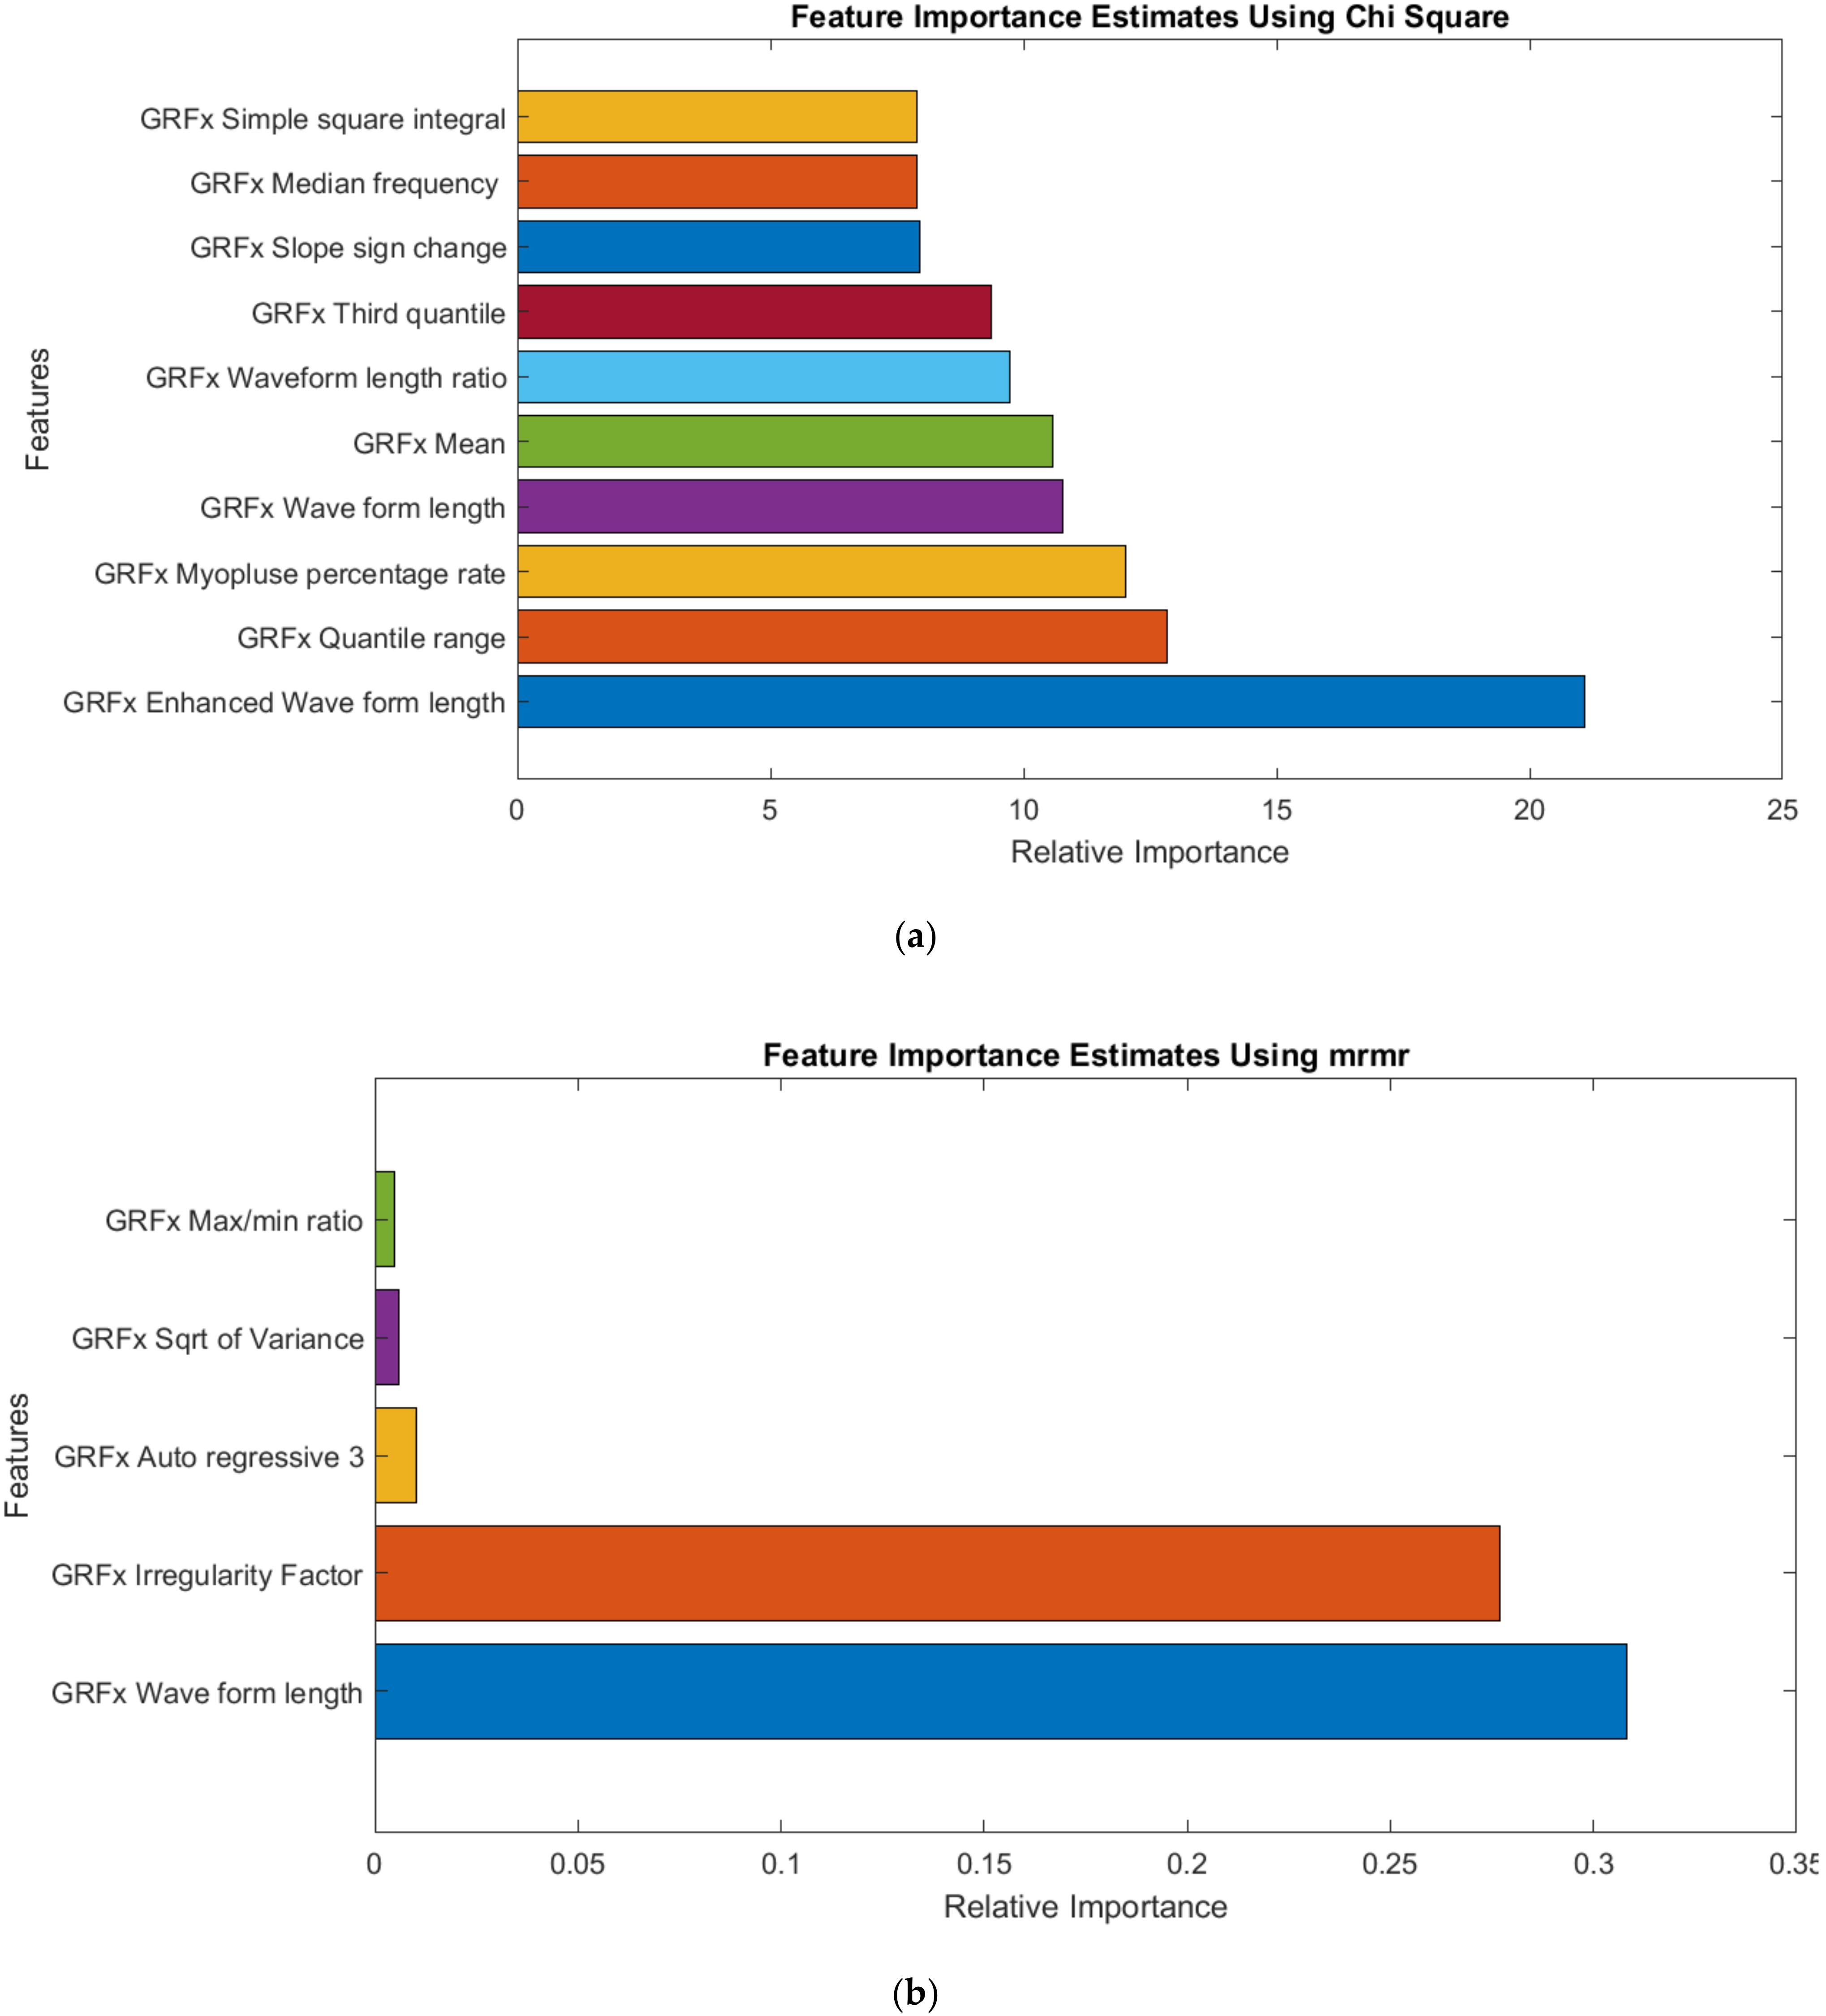
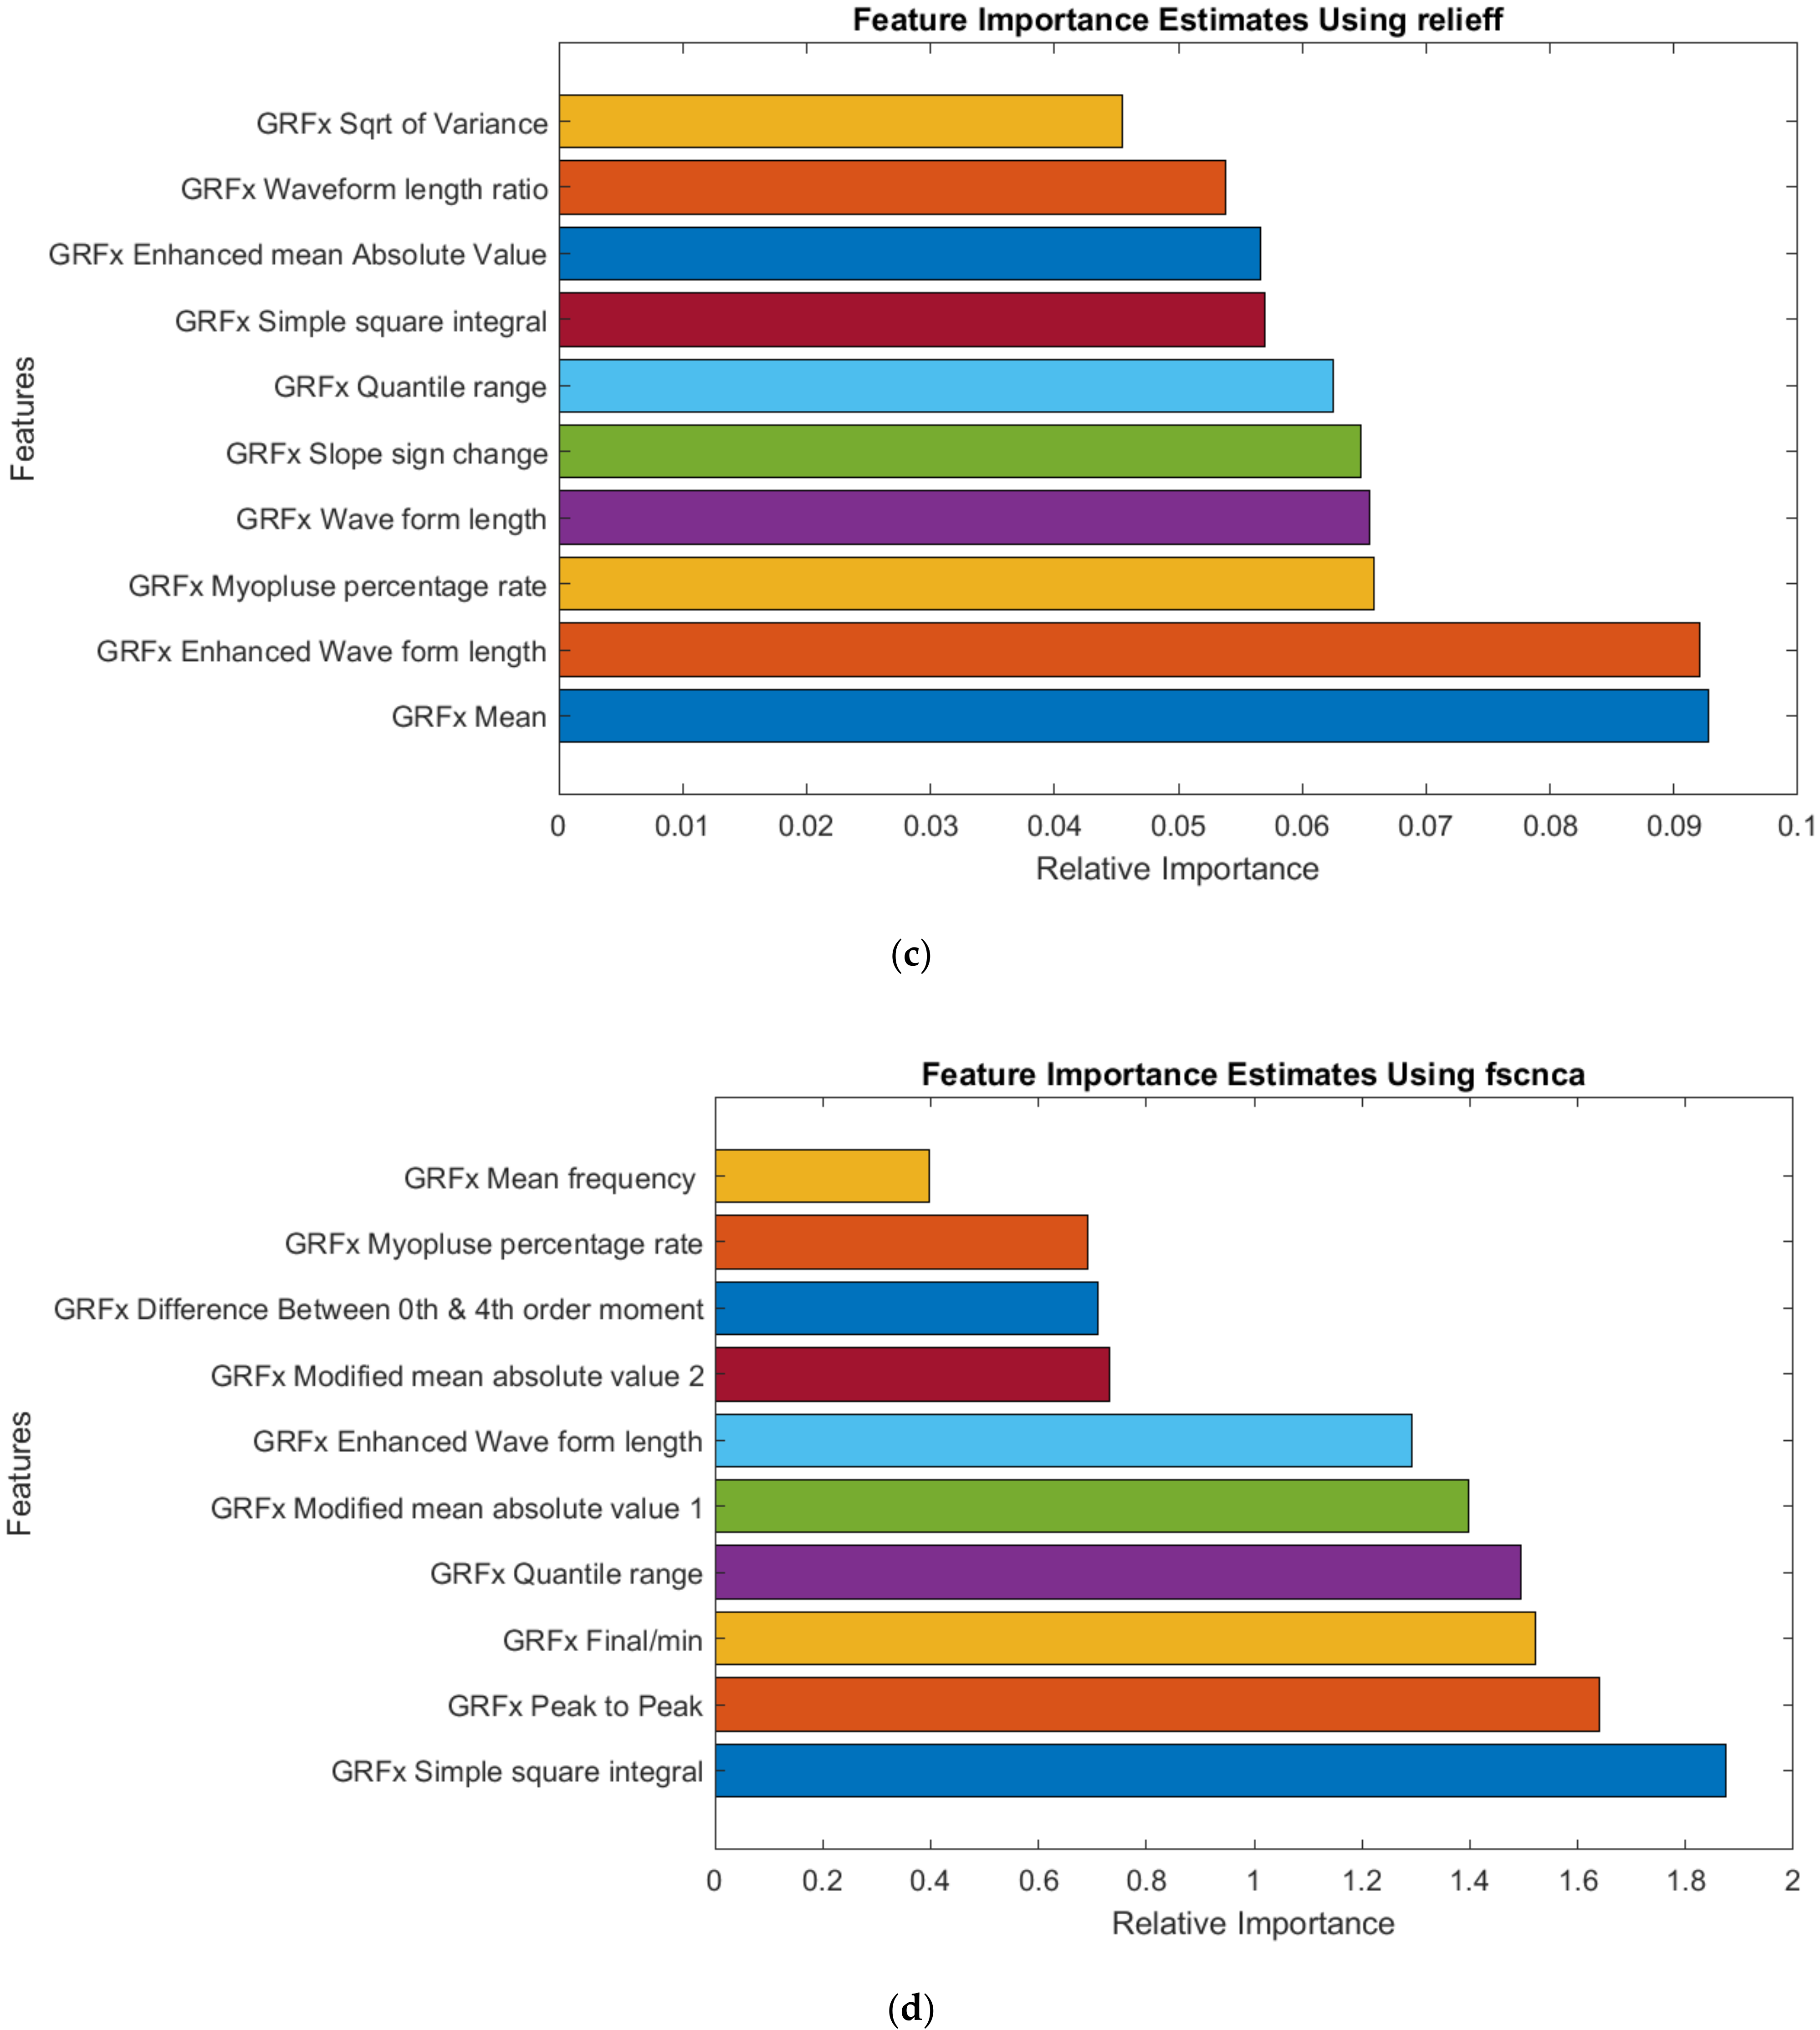
2.4. Feature Selection

A large number of attributes may confuse the model. Feature selections allow further dimensionality reduction. In this study, the forward feature selection approach was followed by adding one feature at a time and then checking the performance. To ensure using the best feature, the feature matrix was reordered according to feature importance. In this study, we mainly used filter type feature selection algorithms provided by MATLAB, which were Chi-square [45], minimum redundant maximum relevant (mrmr) [46], neighborhood component analysis (fscnca) [47], and Relieff [45] algorithms.
The Chi-square feature ranking method was first introduced to measure the goodness of fit by British statistician Karl Pearson. This algorithm is generally used in statistics to check the independence between two events [45]. For feature selection/feature ranking applications, we used it to test whether the occurrence of a specific term and the occurrence of a specific class were independent or not.
Minimum redundant maximum relevant (mrmr) is a method for feature selection [46]. The algorithm consists of two components: minimal redundancy and maximum relevance. The minimum redundancy selects the feature which has the least redundancy in the residual of features, while the maximal relevance selects the feature which has the strongest relevance to the target class.
Feature selection using neighborhood component analysis (fscnca) [47] learns feature weights with regularization to measure the average leave-one-out classification loss over training data. Based on the classification loss, the features’ importance was identified.
The Relieff feature ranking method uses a filter-based method, sensitive to feature interaction [45]. It calculates the score for each feature which is used to rank the features based on the score in ascending order. Relieff uses feature value difference between two nearest neighbors to generate those scores. If the difference is higher for the two-neighbor pair of the same class, the feature score decreases, indicating a less important feature.

2.5. Dimensionality Reduction

Higher feature dimensions can add computational complexity and time to the ML models. Dimension reduction is the process of finding independent and relevant dimensions or degrees of freedom in data [31]. There are many dimensionality reductions, such as Principal component analysis and locally linear embedding [47]. In this study, high correlation feature elimination was performed before feature ranking not to impact the feature ranking algorithm. The correlation matrix between features was calculated using pairwise linear correlation. A threshold of 0.9 was considered a highly collated feature, and one of them was dropped from the feature vector. This helped to reduce the dimension of the features. After removing highly correlated features, a dataset was prepared for three individual lower limb muscles (GL, VL, and TA) and three-dimensional GRF (GRFx, GRFy, and GRFz).

2.6. Machine Learning Models and Hyperparameter Tuning

For classification of the control, diabetic neuropathic (DN), diabetic neuropathic patients with a previous history of ulceration (DFU), we aimed to use machine learning algorithms. To develop the ML models, extracted features from EMG and GRF signals were used as input for the model. The output of the models was three classes: control, DN, and DFU. To find the best performing algorithm, we trained 8 different algorithms: Discriminant analysis classifier (DAC), Ensemble classification model (ECM), Kernel classification model (KCM), k-nearest neighbor model (KNN), Linear classification model (LCM), Naive Bayes classifier (NBC), Support vector machine classifier (SVM), and Binary decision classification tree (BDC) using the EMG, and GRF features. After identifying the best-performing algorithm, we optimized the algorithm to tune the hyperparameters of the algorithm by using Bayesian optimization. In the Bayesian optimization technique, a prediction model was developed to calculate the classification error by selecting hyperparameters and continue updating the values of the hyperparameters based on the error values until the minimum loss was achieved. That minimum classification error point was considered the best-tuned hyperparameters for that feature set. However, hyperparameter tuning is computationally complex and time-consuming. As our objective was to analyze the performance of ML models in different feature combinations for both EMG and GRF features, all 8 ML algorithms were not optimized. Only the best-performing algorithm was optimized. ML model development and tuning of the hyperparameters of the ML algorithm was implemented in MATLAB version 2020b (MathWorks, Natick, MA, USA).

2.7. ML Model Development

After finding the best performing model, it was used to classify the patients into three classes, control, DN, and DFU, using the EMG and GRF features’ data. ML models were trained in three different ways. The detailed training process is described below:
  • Single Channel: Initially, the ML model was trained for individual muscle or GRF component data. So, we trained ML models for three individual muscle features (GL, VL, and TA) and three GRF component features (GRFx, GRFy, and GRFz) separately and observed the classification performance.
  • Two Channel: Second, the ML model was trained with features combined from two muscles (GL and VL; GL and TA; and TA and VL) or two GRF components (GRFx and GRFy; GRFx and GRFz; and GRFy and GRFz).
  • Three Channel: Last, we observed the performance of the ML models with all three muscles (GL, VL, and TA) or three GRF (GRFx, GRFy, and GRFz) components combined.
The ML model was trained and validated with 5-fold cross-validation. In subject-wise validation, all the records of each subject were randomly assigned as a group to either the training set or the test set. A previous study showed that splitting the data into training and test sets in a record-wise fashion can lead to a massive underestimation of prediction error achieved by the machine learning algorithm [48]. Neto et al. [49] conducted a study by training different ML models using the various clinical datasets and showed a high degree of identity confounding for classifiers using record-wise data splits (splitting data into train and test set) and suggested the subject-wise data splits (where all records of a given participant are assigned either to the training or to the test set, but not to both) should be used in machine learning diagnostic applications.
So based on this observation, we used subject-wise data splits to train our ML model for classification. As the dataset was imbalanced, the training dataset was augmented using the Synthetic Minority Oversampling Technique (SMOTE) [50] technique to balance the dataset. Figure 2 illustrates the flow chart of the data processing and ML model performance analysis.

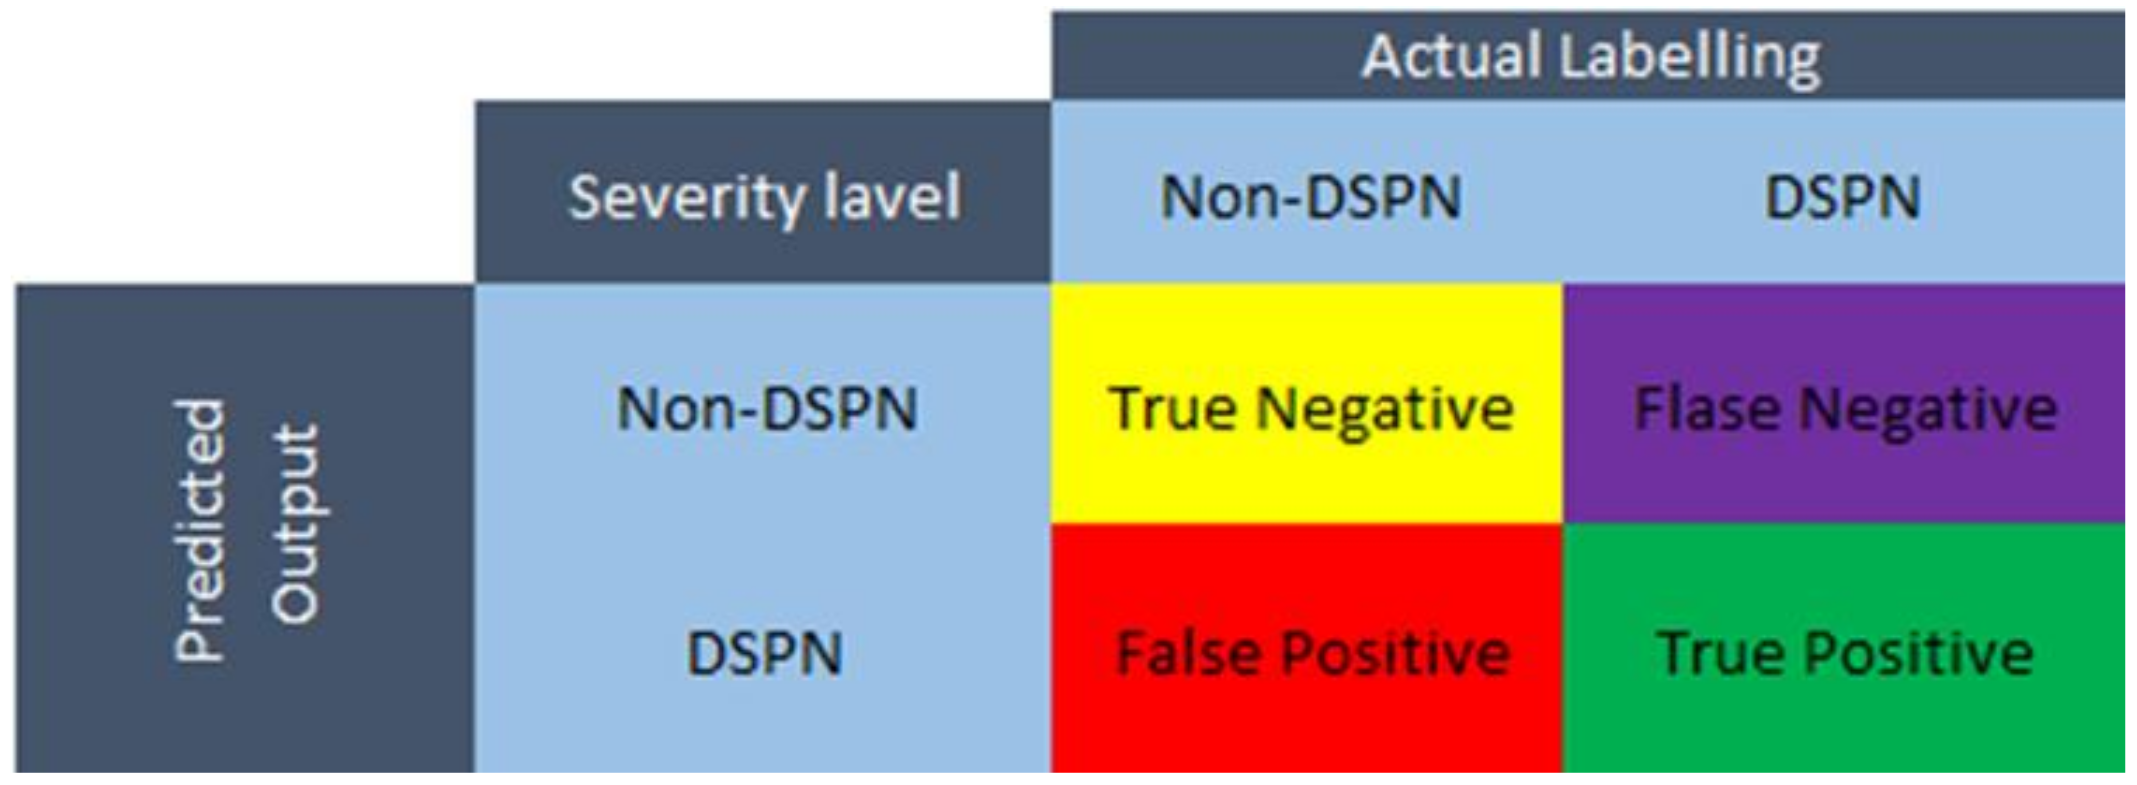
2.8. Performance Evaluation of ML Models

The performance of the ML algorithms was evaluated using different evaluation parameters, such as accuracy, sensitivity, specificity, precision, F score, Receiver operating characteristics curve (ROC), and Area under the curve (AUC). The model performance in classifying three experimental groups (control, DN, and DFU) was analyzed using the incremental feature search technique for all the ranked features in an ascending manner, starting from only the top 1 feature and then going on from the top 2 features and up. Here, we wanted to investigate the combined number of top-ranked features needed to obtain the best performance for respective cases. All processes were conducted for EMG and GRF data separately.
The target of this work was to find the best ML models for both EMG and GRF signals, respectively, based on the overall accuracy of the model. These parameters were calculated from a confusion matrix. A confusion matrix (CM) is one of the most used measures in classification problems since it offers a simple and intuitive visual representation of the performance of a given algorithm, in addition to being applicable to both binary and multi-class classification problems. It showcases the predicted class by a ML model versus the actual class of all the samples in the dataset and the number of accurately classified or misclassified samples. Figure 3 illustrates an example of a confusion matrix for a binary classification problem. Ideally, and in the case of 100% accuracy, all the off-diagonal elements must be zeros since diagonal blocks of the confusion matrix are considered true predictions. The confusion matrix has four matrices such as [51]:
  • True positive (TP): True DN patients
  • True negative (TN): True Non-DN
  • False-positive (FP): Non-DN patients, classified as DN patients.
  • False-negative (FN): DN patients, classified as non-DN patients.
Accuracy can be defined as the ratio between the correctly classified subjects to the total number of subjects, which provides an estimation of the overall performance of the model regardless of the class. This metric can be easily calculated using the previously described confusion matrix in Figure 3 by [51]:
Accuracy = Number   of   correct   prediction Total   number   of   predicted   data = TP + TN TP + TN + FP + FN
However, accuracy can be a misleading measure, especially when dealing with class-imbalanced datasets. For that reason, other performance metrics must be used to ensure reliability.
Sensitivity or recall is one of the most important measures, especially in these types of projects, since it describes the number of subjects that are correctly classified as positive among all the subjects that are labeled as positive. Typically, in multi-class classification problems, sensitivity is calculated for each class individually, and then they are combined either using macro- or micro-averaging techniques. For example, by referring to the previous confusion matrix, the sensitivity can be obtained as follows [51]:
Sensitivity = no   of   subject   accurately   classified   as   positive total   no   of   subject   labeled   as   positive = TP TP + FN
Furthermore, precision is another measure of performance used when evaluating the performance of a ML model, which is the ratio of patients who were correctly identified as positive to the total number of positive predicted patients. It can be maximized by an impractical classifier, where they never predict the DSPN severity level to avoid false alarms. For example, Equation (3) can be used to calculate the precision [51].
  Precision = no   of   subject   classified   correctly   as   Positive no   of   subject   classified   as   Postive   = TP TP + FP
Using the previous definitions of precision and recall, a new measure can be defined by combining both the values in one numeric metric called the F-measure, which is the harmonic mean of the sensitivity and precision. The F1 score considers both recall and precision as equally important measures. Usually, there is a trade-off between precision and recall; thus, the F1 score clarifies how balanced the model is between these two metrics. A higher score will show a balance between the two measures, while a significant difference between precision and recall will be penalized by the F-1 score. To calculate the F1 measure, the following formula is used [51]:
F 1   Score = 2   TP 2   TP + FP + FN  
For the three-class problem, all the performance metrics were evaluated for each class, and the final value was obtained using macro averaging of all classes.

3. Results

The sociodemographic variables of the recruited subjects have been tabulated in Table 1.

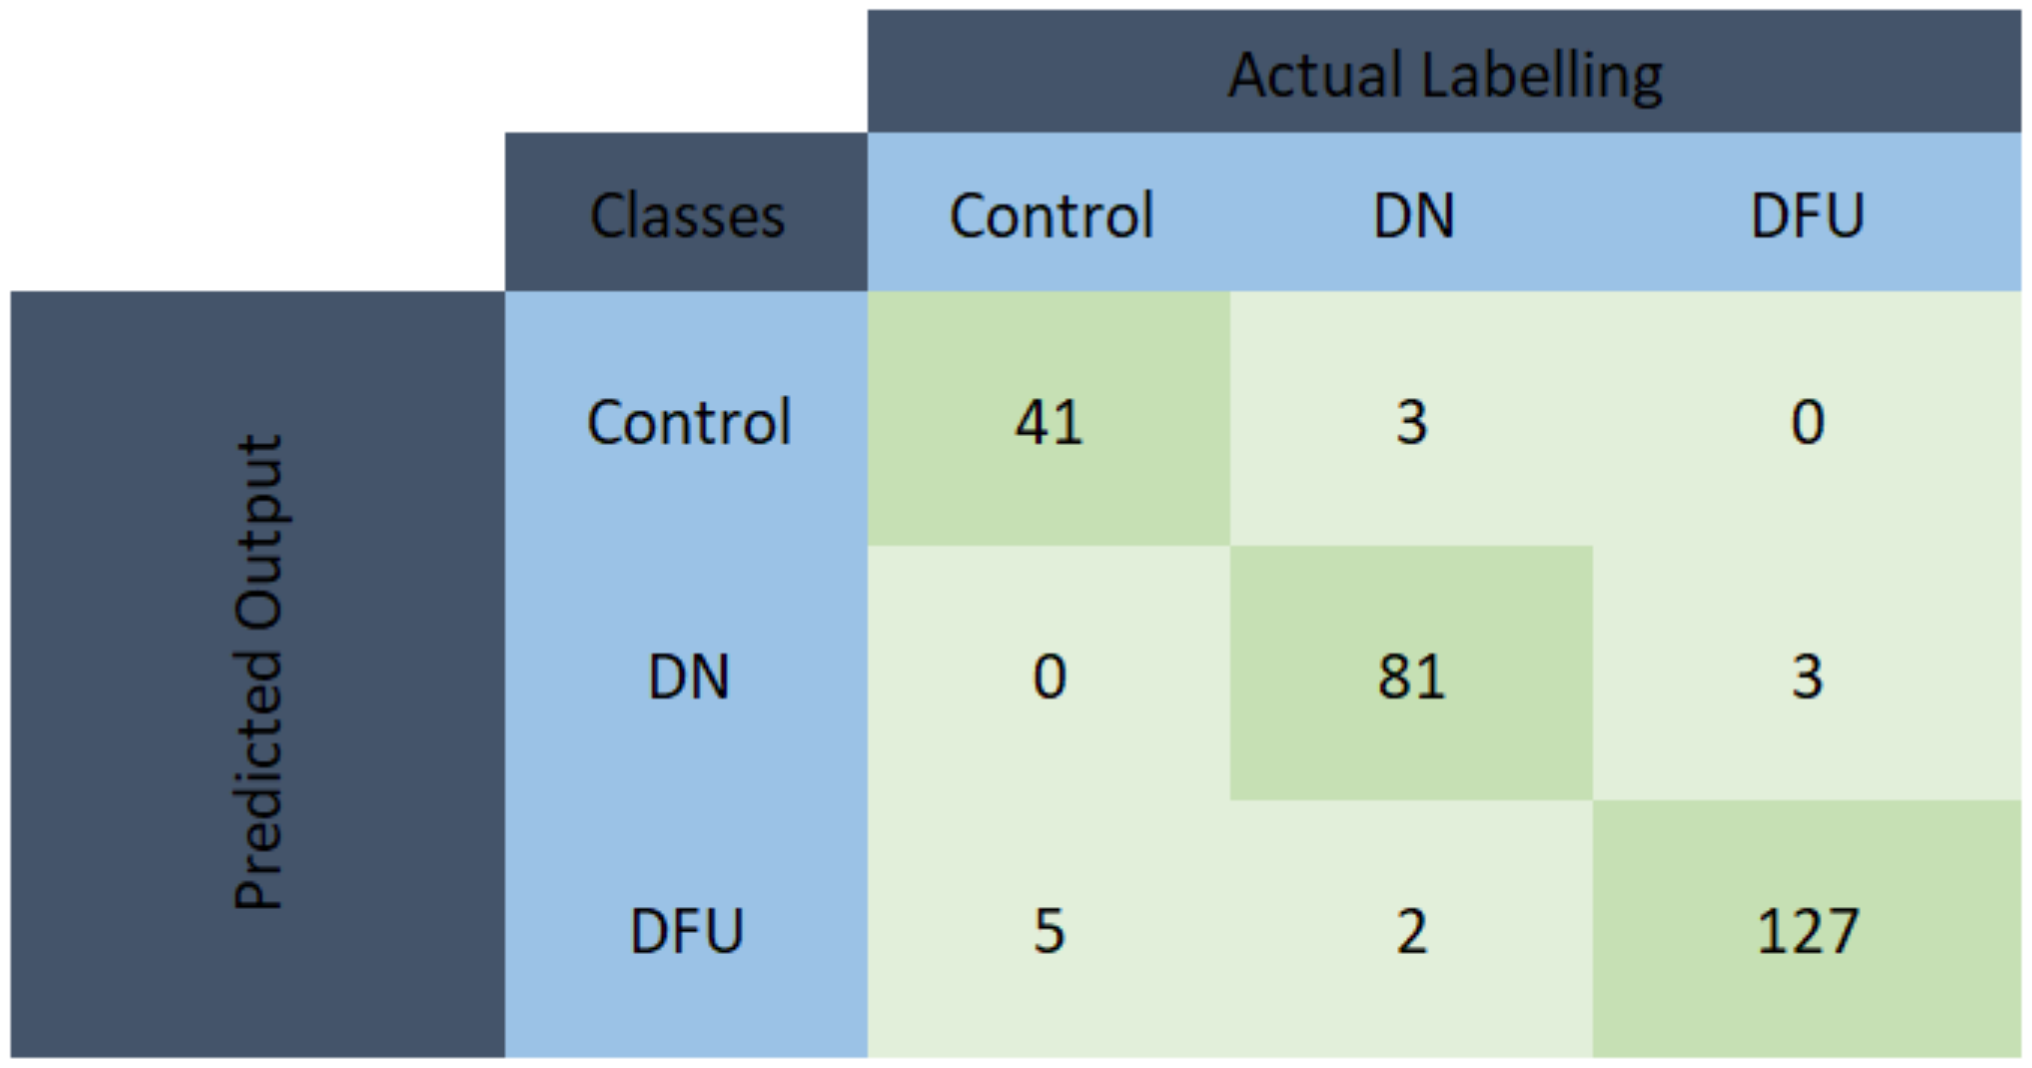
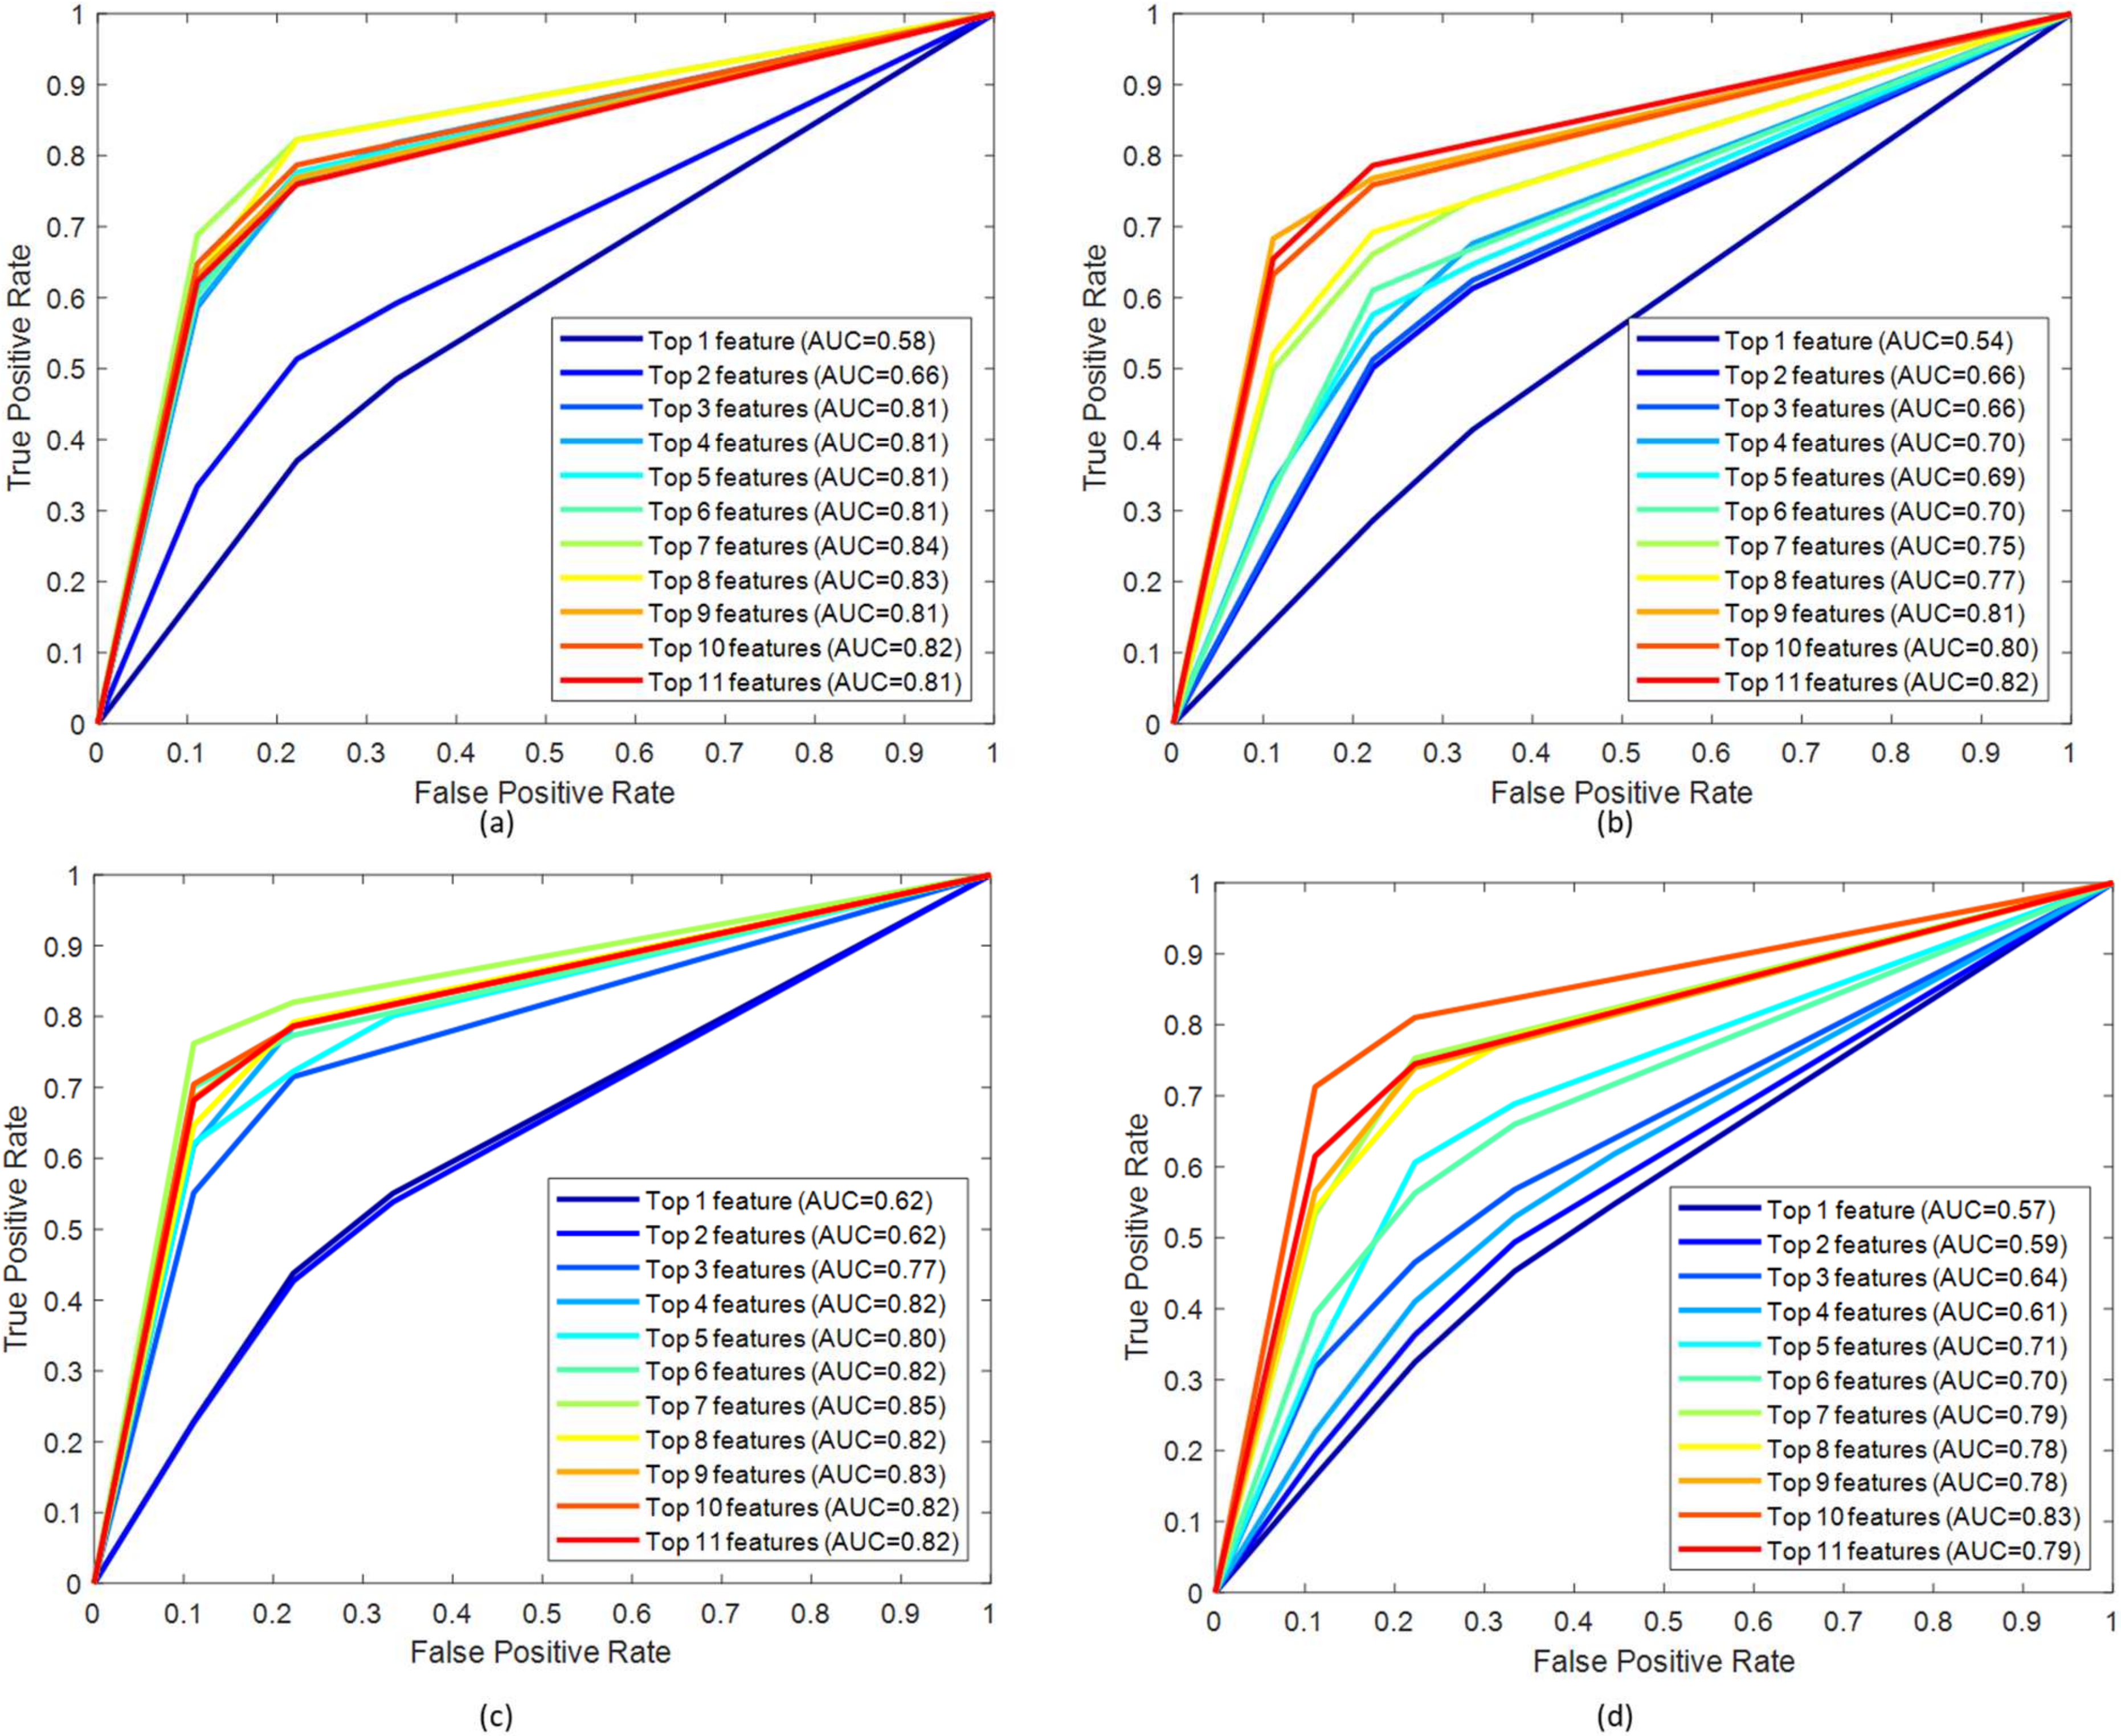
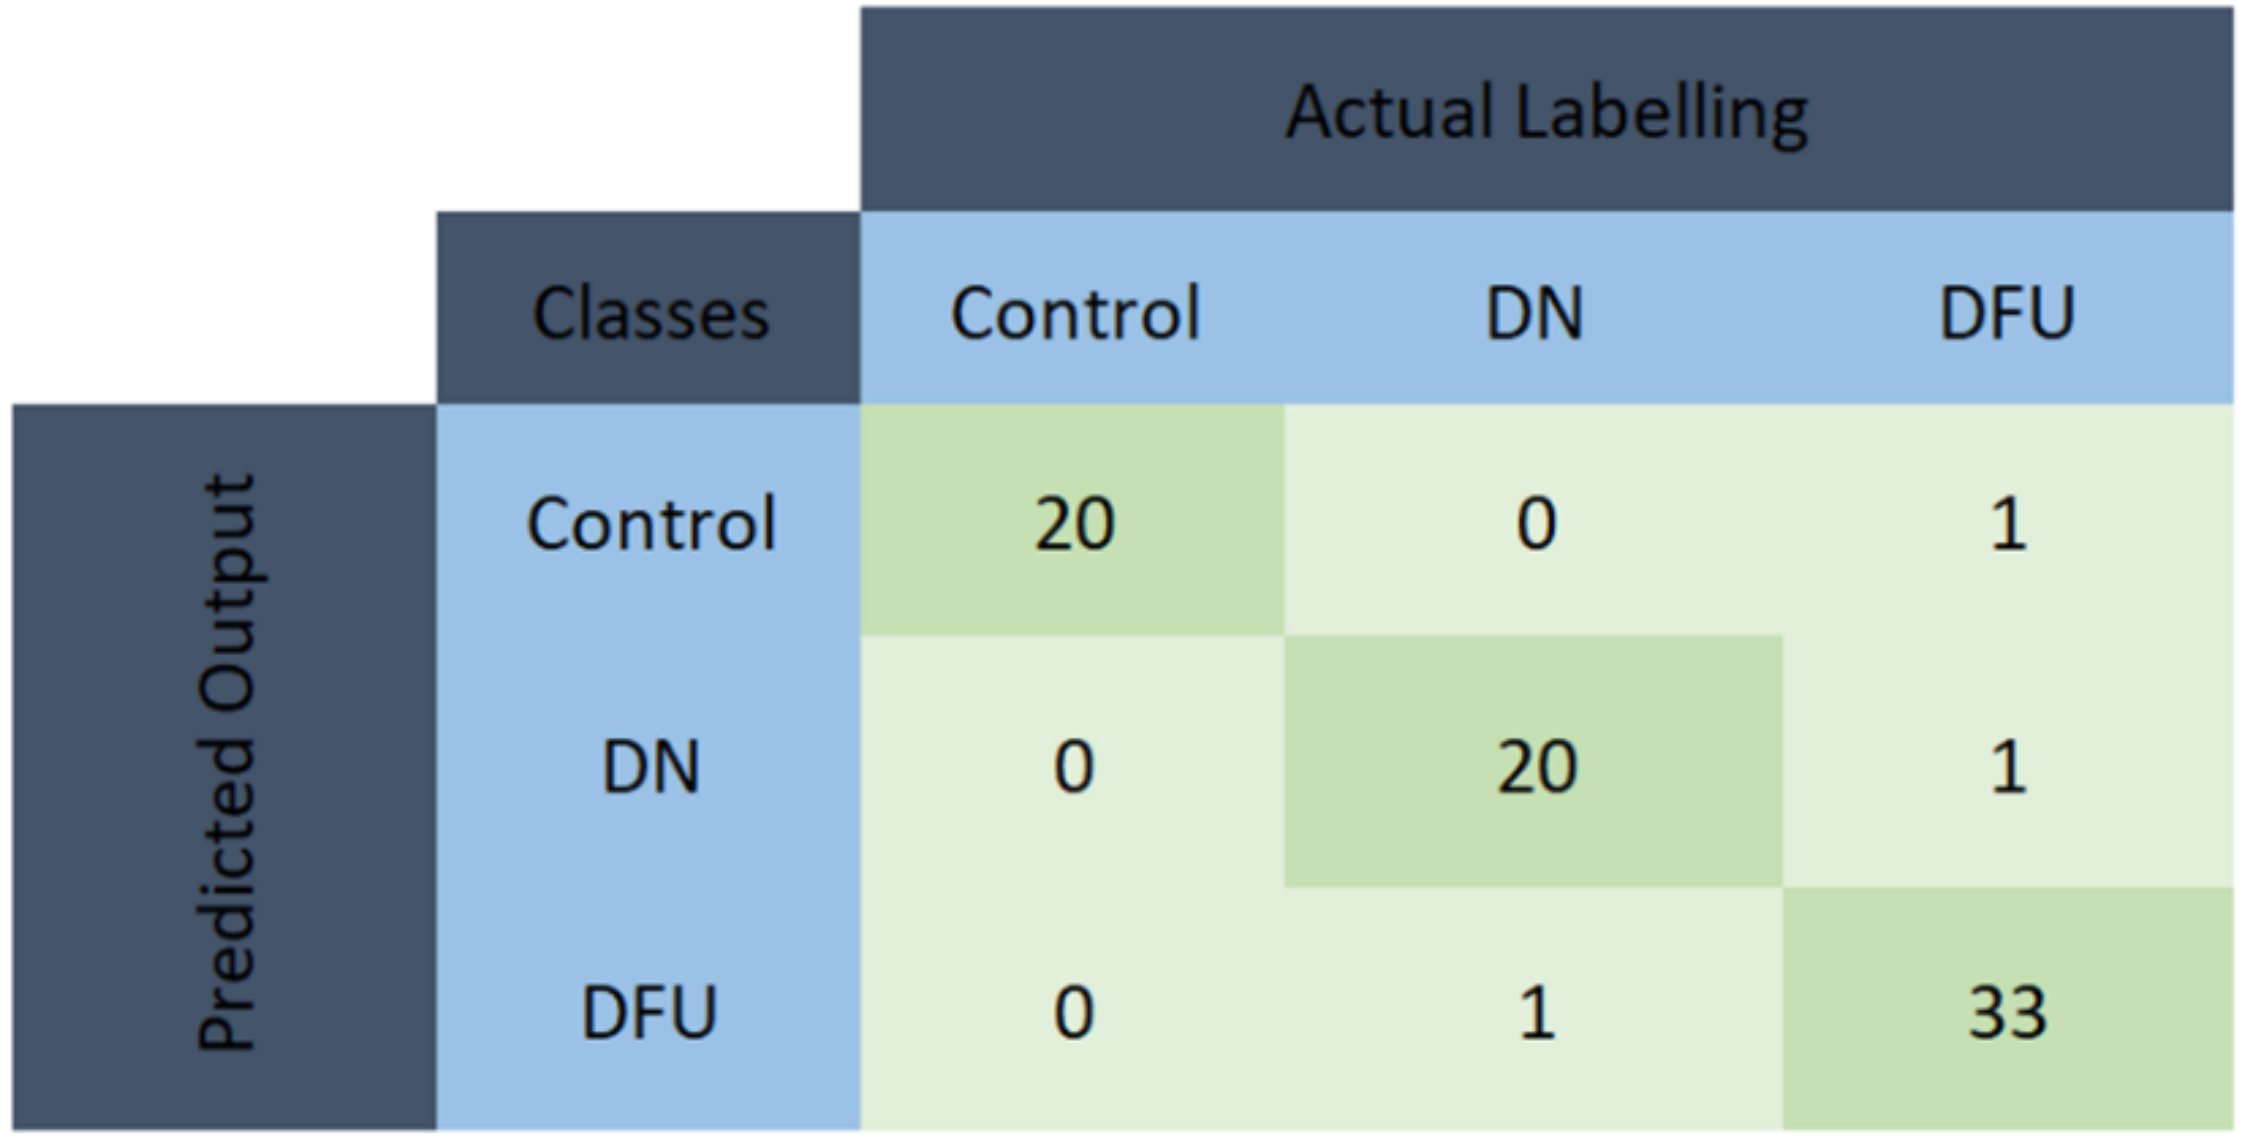
3.1. Performance Evaluation

After training eight different ML algorithms, we found that the KNN algorithm outperformed the other algorithms using EMG and GRF data. The hyperparameters of the KNN algorithm were tuned using the Bayesian optimization technique. The optimized KNN model had a set Euclidean distance, number of neighbors set to 1, distance weighting function set to ‘squaredinverse’, which means the weight is equal to 1 d i s t a n c e 2 . We trained this optimized KNN algorithm for using different feature section techniques for EMG and GRF data, respectively. In the next section, we will highlight the best-performing results by the EMG and GRF feature sets.

3.2. EMG Signal Analysis

The EMG dataset initially consisted of 19 TD features for each muscle. Here, we implemented the study channel-wise, assuming each signal feature as channel data. So, we considered three lower limb muscles, GL, VL, and TA, in one channel analysis, with 19 features proposed by our previous work [37] individually. In two-channel analysis, we took a combination of two muscles features at a time. For three muscles, we have six different combinations of features, each having 38 features in each case, and for three channels, we considered all three muscle features with 57 features. The details of each channel analysis are added in Table 2. The EMG feature dataset was ranked based on its importance in identifying DN and DFU. Four different feature selection techniques were studied. After the features were ranked, the highly correlated features were removed in all cases. After removing highly correlated features from each channel, we had 11, 22, and 32 features in one, two, and three-channel analyses. The feature list after feature ranking and highly correlated feature removal can be found in Supplementary Tables S3–S9 for all channel analyses. The number of features before and after removing highly correlated features are listed in Table 2. In Figure 4, the ranked features by four different feature ranking techniques for GL muscles are shown. The dataset consisted of top-ranked features after removing highly correlated features, which were used to train the ML models, and their performance was analyzed. The ROC curve, as well as other evaluation matrices, were generated using top feature combinations starting from top 1 features, and so on, incrementally, to observe the performance of the model. In Table 3, Table 4 and Table 5, we summarized the best performance by the KNN classifier model in identifying control, DN, and DFU patients using EMG for one, two, and three-channel analysis, respectively.
From Table 3, it can be observed that the top 7 features from GL muscle EMG using the Relieff feature ranking technique exhibited better performance with an accuracy of 84.73% in comparison with the other two muscles. For the two-channel, in Table 4, the top 12 features from the combination of GL and VL muscle EMG using the Chi-Square feature ranking technique showed a 96.18% accuracy, outperforming the results using features from the other two muscle combinations. However, in the three-channel, the best performing model had an accuracy of 95.8% accuracy using the top 22 feature combination from all three lower limb muscles (Table 5). Among this three-channel analysis, the best performance was 96.18% using the features extracted from GL and VL muscles EMG and features ranked using the chi-square feature ranking technique. The related confusion matrix for this best-performing model is shown in Figure 5. The detailed performance of the three channels using EMG data is listed in Supplementary Tables S10–S16. Figure 6 illustrates the ROC curves using features from different feature selection techniques for GL muscle.

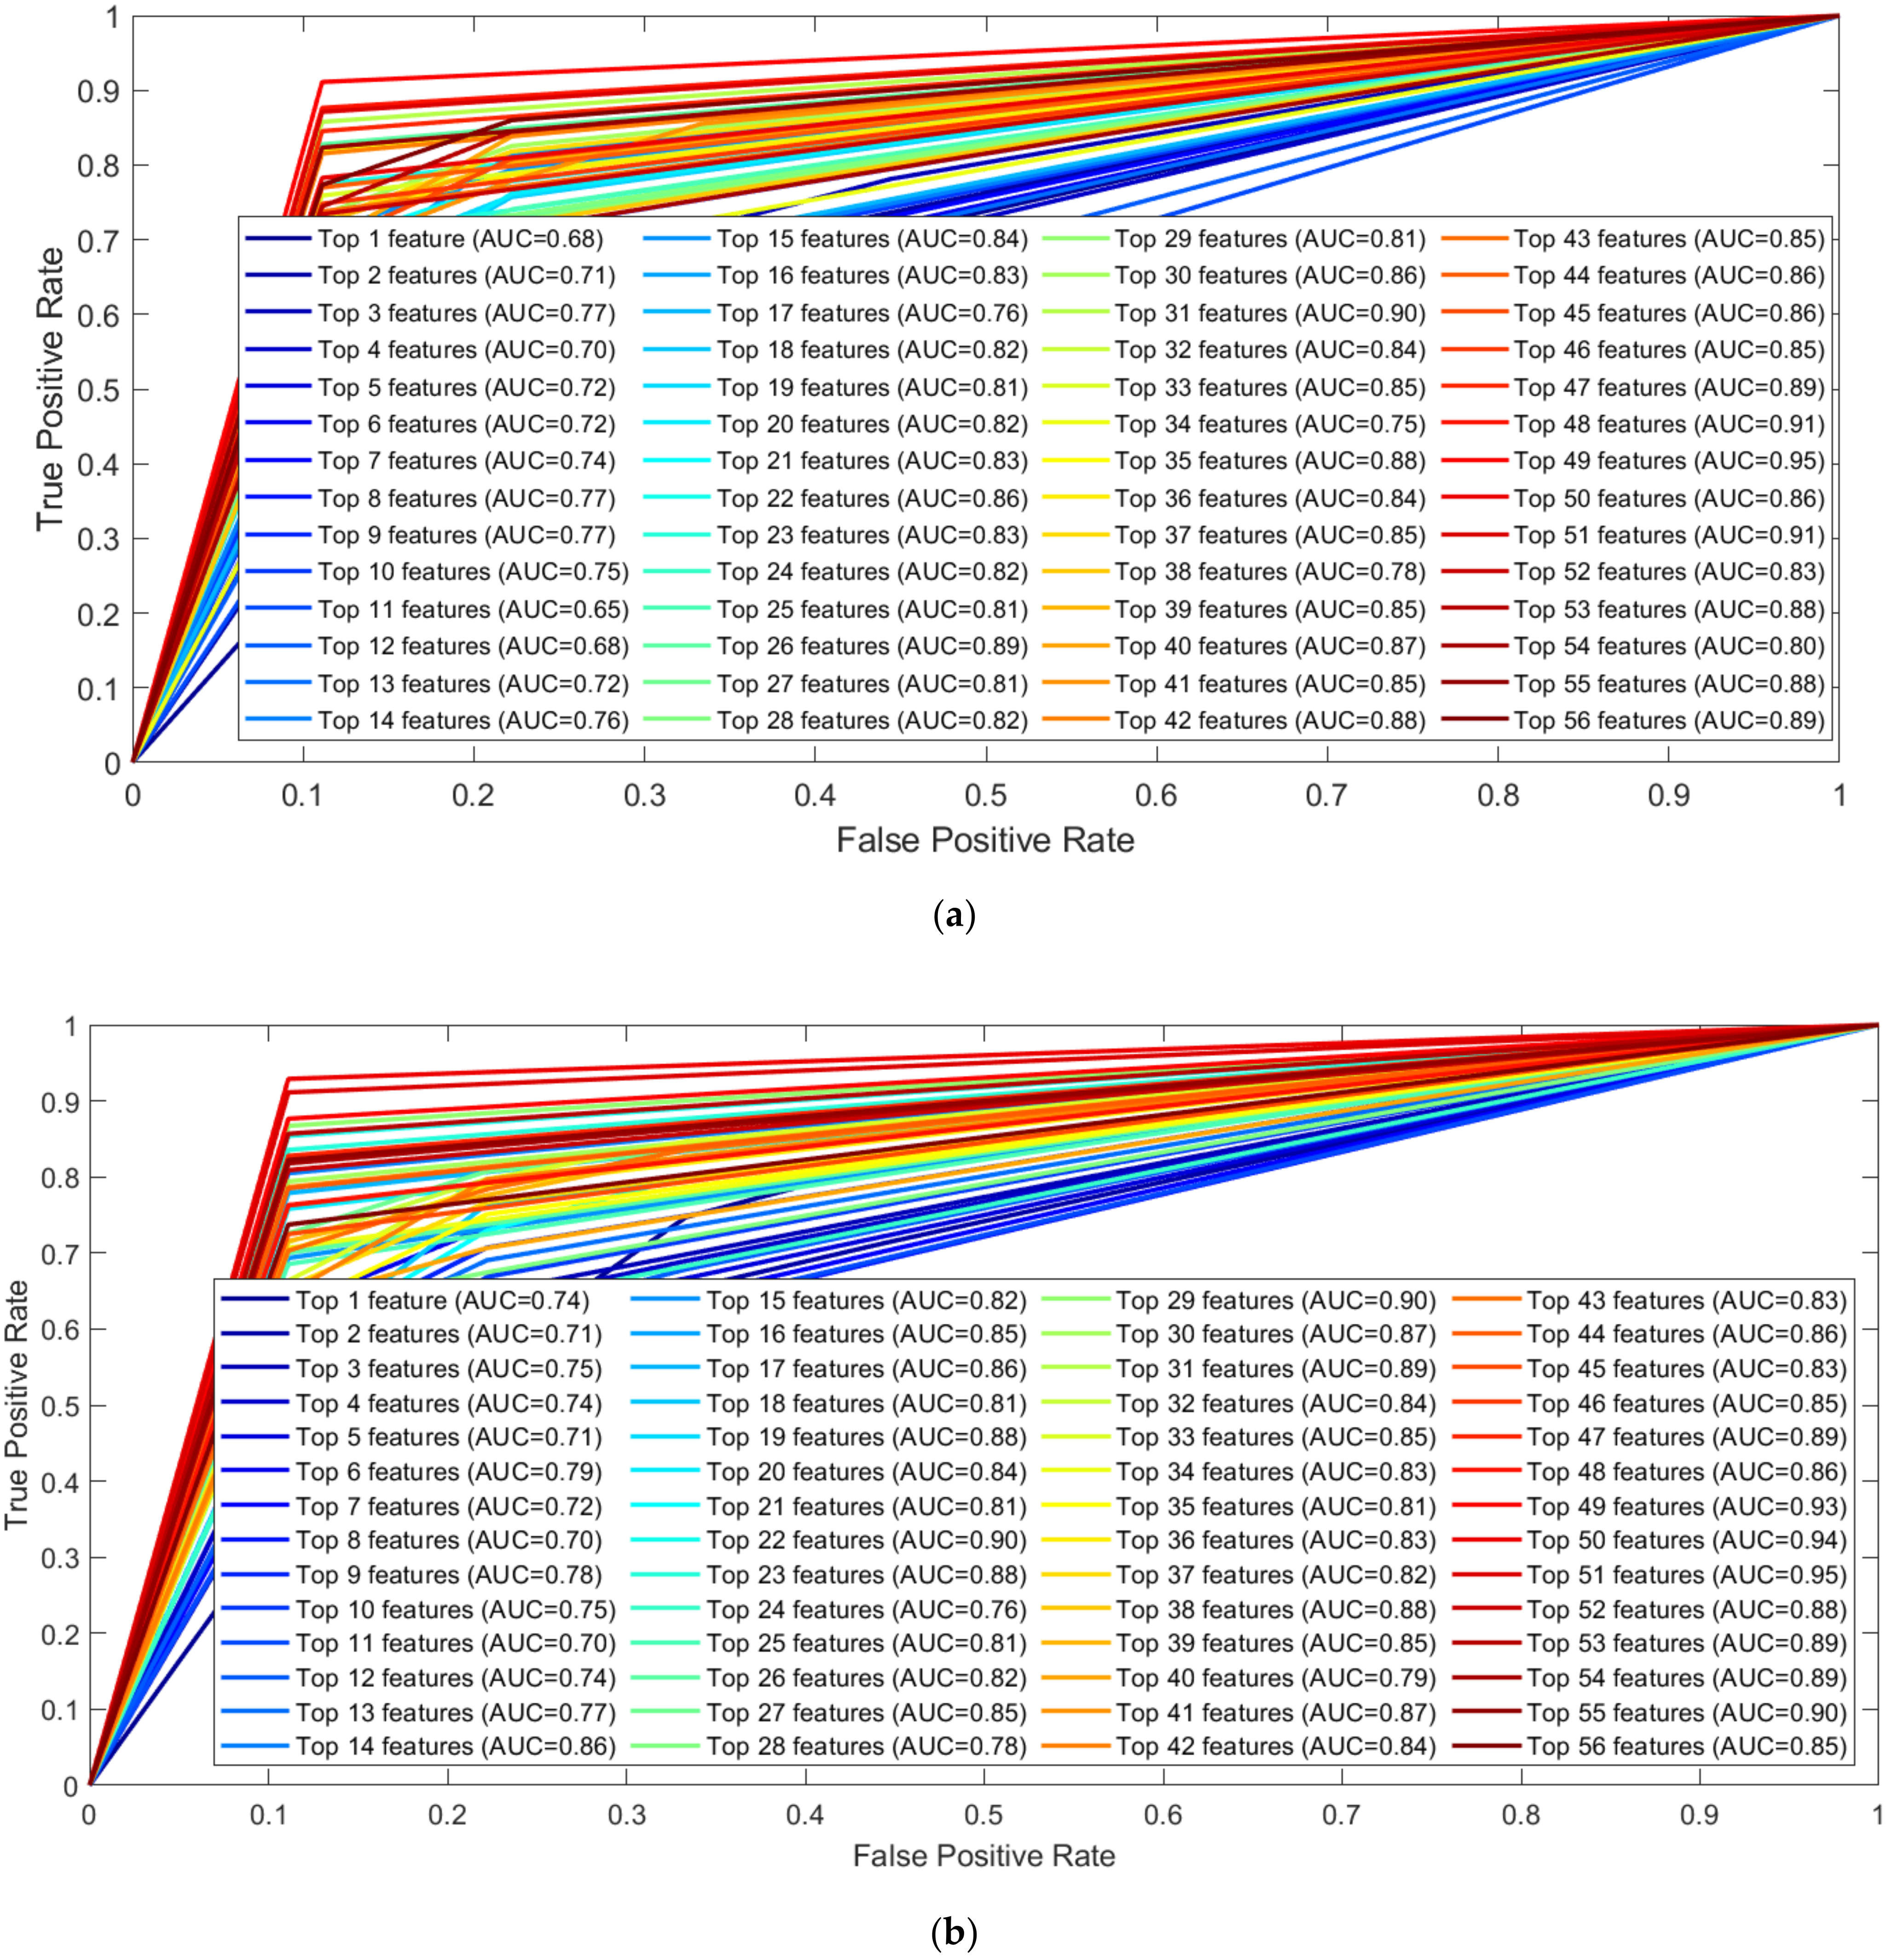
3.3. GRF Signal Analysis

From the GRF signal, 195 TD, FD, and TFD features were extracted for three-dimensional components. Similar to the EMG signal analysis, GRF signal analysis was also subdivided into three channels. In one-channel analysis, features for individual GRF components (GRFx, GRFy, and GRFz) were taken into consideration. For the two-channel, features from two GRF components were used. So, for three components, we had three combinations (GRFx-GRFy, GRFx-GRFz, GRFy-GRFz), and for the three-channel analysis, we considered features from all the GRF (GRFx-GRFy-GRFz) combined. The details of the channel analysis can be found in Table 6. The ranked features after removing highly correlated features for all channel analyses are being tabulated in Supplementary Tables S17–S23.
Similar to the analysis using EMG, four feature ranking techniques discussed above were also applied for GRF features for all channel analyses. After ranking the features, highly correlated features were removed, and the remaining features were used to train our optimized KNN model. In Table 6, the number of features before and after removing highly correlated features is shown.
Figure 7 illustrates the ranked features extracted from GRFx signals for the four different feature ranking techniques. The dataset consisted of top-ranked features after removing highly correlated features, which were used to train the ML models, and their performance was analyzed.
From Table 7, it can be observed that the top 19 features from GRFx using the fscnca feature ranking technique, exhibited better performance with an accuracy of 98.68% in comparison with the other two muscles. For the two-channel, in Table 8, the top 7 features from a combination of GRFx and GRFz signals, using the fscnca feature ranking technique showed a 98.68% accuracy, outperforming the results using features from the other two muscle combinations. However, in three-channel, the best performing model had an accuracy of 98.68% using the top 24 features combination from all three lower limb muscles using the fscnca feature ranking technique (Table 9). Among these three-channel analyses, the best performance was achieved with 98.68% accuracy by using the top 7 features from the fscnca feature ranking technique, extracted from the combination of the GRFx-GRFz signal. The related confusion matrix for this best performing model is shown in Figure 8. The detailed performance of all channels using GRF data is listed in Supplementary Tables S24–S30. Figure 9 illustrates the ROC curves using features from different feature selection techniques for GRFx.

4. Discussion

Diabetic neuropathy (DN) has received the attention of researchers as one of the major complications for DM patients [52]. It is a long-term chronic complication in diabetic patients, which involves disfunction of electrophysiological activities in the human body, starting from the lower limb. Literature showed that DN patients exhibited biomechanical changes in the gait cycle, effecting an alteration in plantar pressure, kinematic patterns, ground reaction forces, muscle activation, sensory loss, slower walking speed, changes in gait velocity, increased risk of falling, and many other lower limb and gait complications [6,13,17,21,22,53]. With long-term DN, other serious foot complications start to arise. Planter foot ulceration is one of the major complications of long-term DN, an indication of worsening DN [5,15,22,23,54], which is one of the major causes of lower limb amputations [54,55,56]. Thus, prediction and on-time treatment of diabetic foot ulcers (DFU) are of great importance for improving and maintaining patients’ quality of life and avoiding the consequent socioeconomic burden of amputation [57].
Akashi et al. [5] showed that DN patients with (DFU) and without a history of plantar ulceration had a delayed activation peak occurrence in VL and GL muscles and a decrease in the second peak of vertical ground reaction force compared with the control group during gait. However, they did not find any difference in TA muscle time for activation peak of magnitude. Sacco and Amadio [20] reported delayed muscle activation in VL muscles during treadmill gait in DN patients, in agreement with the Akashi et al. study [5], where they suggested that a delayed muscle activation peak can be an indicator of worsening DN, hence, DFU. However, another study by Sacco and Amadio [20] and Abboud et al. [22] reported that TA muscles also exhibited decreased muscle magnitude and delayed activation peak, which contradicts the results from Akashi et al. [5]. Similar to this, many studies have been conducted, which have reported contradictory results [5,6,7,9,11,12,13,14,15,16,22,23,25,57].
In such a scenario, only relying on EMG and GRF signal analysis to find biomechanical changes in DN patients cannot be reliable. Depending on the variability of the recruited population for these studies, the biomechanical changes in muscle EMG and GRF during gait can be varied among the same experimental groups, depending on the patient’s ability to adapt to the changes in gait [6]. Patients did not exhibit any patterned delay in the muscle activation functions, which can cause unreliable diagnoses. With the help of Machine Learning (ML), EMG and GRF signal analysis can be made more robust and overcome the variability in the research regarding the patient’s identification.
Even though many researchers reported finding a relationship in the biomechanical changes in DN and DFU during gait, the use of machine learning techniques in this domain is quite new. ML learning-based applications using EMG have received the attention of researchers for various applications, such as disease diagnosis, prosthetics design, myoelectric controllers, and security systems. Despite having so much potential, ML has not been widely studied in clinical biomechanics related to DN and DFU. In the literature, very few studies have been conducted to identify DN and DFU patients with the help of ML using biomechanics parameters, such as EMG and GRF. In Sawacha et al.’s [23] study, the researchers used a K-means clustering classification system to classify the subjects’ gait patterns among DN and Non-DN groups through the analysis of their ground reaction forces, joints, and segments (trunk, hip, knee, ankle) angles, and moments. However, as the K-means cluster technique is sensitive to the variation in the gait trails, the reproducibility of this study is questionable. Fahmida et al. [9] proposed an adaptive neuro-fuzzy inference system-based classifier for diabetic sensorimotor polyneuropathy (DSPN) severity classification by using features from three lower limb muscles (TA, VL, GM) EMG during gait. In their study, they used only two EMG features based on the existing literature time for activation peak and peak magnitude during gait, with the progression of DSPN severity. They trained two different models. In one model, they used only the peak magnitudes from three different lower limb muscles, and in another model, they considered both the features of all three muscles. They reported 96% and 80% accuracy for both models, respectively. From this aspect, we investigated a ML-based classification system for identifying DN and DFU patients by using biomechanical parameters from EMG and GRF during gait.
As per our knowledge, this is the first ML-based work to classify DN and DUF patients using EMG and GRF data during gait. In this study, we collected data from the Akashi et al. [5] study, where we had a total of 21 patients’ data from three experimental classes: control (n = 6), DN (n = 6), and DFU (n = 9), and observed the EMG and GRF characteristics during gait. This study discussed detailed preprocessing of the signals, extracting and identifying important features from EMG and GRF signals. Eight different conventional ML algorithms were trained and the KNN algorithm outperformed for identifying DN and DFU for both features from EMG and GRF signals. Hyperparameters of the KNN algorithm were optimized using the Bayesian Optimization technique.
This study was conducted for three sub-studies for EMG and GRF, respectively. In one-channel analysis, we considered the features from only one lower limb muscle or GRF component. In the two-channel, we considered the feature combinations of two muscles or GRF components, and in the three-channel, all the muscles or GRF component features were considered. Depending on the channel, the number of features varied, fed to the ML model for training. In this study, we trained our ML model in all possible ways to find the best-performing features.
This study dealt with a three-class problem, where we considered three classes: control, DN, and DFU. The evaluation matrixes were calculated depending on the accurate identification of the correct class. For EMG analysis, we found the best accuracy of 96.18% using the top 22 features from the chi-square feature ranking technique in the two-channel analysis of GL-VL. In the GRF analysis, the model showed 98.68% accuracy by using the top 7 features from the fscnca feature ranking technique from the combination of the GRFx-GRFz signal. In this study, before training our ML models, we preprocessed the dataset in a very detailed way involving removing noise and proper filtration, normalization, and segmentation of the signals, which created this dataset without bias or overfitting issues. Because of our proper data preprocessing, our work obtained very good performance with EMG and GRF data analysis in identifying DN and DFU. This indicates that analysis for sensitive biomechanical data required very detailed preprocessing before being used for training ML models. With the help of proper preprocessing, higher accuracy can be achieved. This is one of the major contributions of this study. Another major contribution of this study is that using the new feature extraction scheme for EMG signals, it helped us extract important features.
In this research, our goal was to find the best-performing ML models using features from EMG and GRF signals individually during gate. In this research, we tried to identify DN and DFU patients from the biomechanical signals such as EMG and GRF with the help of ML. As per our knowledge, this is the first study where ML application has been studied for DN and DFU identification from biomechanical signals during gait. This study demonstrated that both EMG and GRF signals can be used to identify the patient’s class with higher accuracy, with the help of proper preprocessing of the signals, extracting and identifying important features, and optimizing the ML algorithm. However, a few limitations need to be mentioned. One is the small sample size of the study. As the data were collected from the Akashi et al. study [5], there were only 21 patients’ data. Even though we used the subject-wise data split technique and SMOTE data augmentation technique to overcome the imbalance and small dataset for ML model training, there is still a chance of variability in the results when a large number of variations are being exposed. Another limitation of this study is that we only considered the control, DN, and DFU patient groups as available in the study [5]. We had no diabetes patients without DN in this study. In the future, the effect on diabetes patients without DN should be included in our analysis.
Apart from the mentioned limitation, this study showed a potential use of ML in the biomechanical domain for DN and DFU identification. If proper preprocessing with strategic techniques is applied to extract important features from biomechanics parameters such as EMG and GRF, these can be a potential diagnostic tool for DN and DFU. With valid data, an early indication of DFU can be made from the EMG and GRF with the help of machine learning. This is a very initial study in this domain. For years researchers have had contradictory results with biomechanical changes related to DN. Our work highlights the potential of ML for DN-related complications by using biomechanical parameters such as EMG and GRF. In the future, we can add a prediction system in ML-based DFU prediction from EMG and GRF data which will be able to predict patients’ future conditions based on their biomechanical changes and will help health professionals enhance the healthcare of diabetic patients in relation to identifying high-risk individuals and provide the proper treatment and rehabilitation.

5. Conclusions

In this paper, we applied ML models for identifying DN and DFU using EMG and GRF signals, which is the first work, as per our knowledge, in this domain. In this work, we discussed detailed signal processing, feature extraction, feature ranking, and feature dimension reduction techniques to identify the most important features for DN and DFU identification. This research considered EMG signals from three different lower limb muscles and corresponding 3-dimensional GRF signals. Previously in the literature, all the biomechanical changes due to DN and DFU have been analyzed manually. This is the first work where the authors have shown that, with the help of ML, DN and DFU patients can be identified with higher accuracy using features from the EMG and GRF signals individually. This research proposed the two best models for EMG and GRF, respectively. For EMG analysis, we found the best accuracy of 96.18% using the top 22 features from the chi-square feature ranking technique in the two-channel analysis of GL-VL. In the GRF analysis, the model showed 98.68% accuracy by using the top 7 features from the fscnca feature ranking technique from the combination of the GRFx-GRFz signal. In conclusion, our study has shown a potential solution for ML application in DN and DFU patient identification using EMG and GRF parameters. With careful signal preprocessing with strategic feature extraction from the biomechanical parameters, optimization of the ML model can be a potential solution in the diagnosis and stratification of DN and DFU patients from the EMG and GRF signals.

Supplementary Materials

The following supporting information can be downloaded at: https://www.mdpi.com/article/10.3390/s22093507/s1, Table S1: Dataset summary after segmentation; Table S2: Feature vectors summary for GRF; Table S3: Feature list from different selection techniques from GL muscle EMG; Table S4: Feature list from different selection techniques from VL muscle EMG; Table S5: Feature list from different selection techniques from TA muscle EMG; Table S6: Feature list from different selection techniques from GL-VL muscles EMG; Table S7: Feature list from different selection techniques from GL-TA muscles EMG; Table S8: Feature list from different selection techniques from TA-VL muscles EMG; Table S9: Feature list from different selection techniques from GL-VL-TA muscles EMG; Table S10: Performance evaluation matrix using features from GL muscle EMG for different feature selection techniques; Table S11: Performance evaluation matrix using features from VL muscle EMG for different feature selection techniques; Table S12: Performance evaluation matrix using features from TA muscle EMG for different feature selection techniques; Table S13: Performance evaluation matrix using features from GL and TA muscles EMG for different feature selection techniques; Table S14: Performance evaluation matrix using features from GL and VL muscles EMG for different feature selection techniques; Table S15: Performance evaluation matrix using features from TA and VL muscles EMG for different feature selection techniques; Table S16: Performance evaluation matrix using features from GL, VL, and TA muscles EMG for different feature selection techniques; Table S17: Feature list from different selection techniques from GRFx; Table S18: Feature list from different selection techniques from GRFy; Table S19: Feature list from different selection techniques from GRFz; Table S20: Feature list from different selection techniques from GRFx-GRFy; Table S21: Feature list from different selection techniques from GRFx-GRFz; Table S22: Feature list from different Selection Techniques from GRFy-GRFz; Table S23: Feature list from different selection techniques from GRFx-GRFy-GRFz; Table S24: Performance evaluation matrix using features from GRFx for different feature selection techniques; Table S25: Performance evaluation matrix using features from GRFy muscle EMG for different feature selection techniques; Table S26: Performance evaluation matrix using features from GRFz muscle EMG for different feature selection techniques; Table S27: Performance evaluation matrix using features from GRFx and GRFy muscles EMG for different feature selection techniques; Table S28: Performance evaluation matrix using features from GRFx and GRFz muscles EMG for different feature selection techniques; Table S29: Performance evaluation matrix using features from GRFy and GRFz muscles EMG for different feature selection techniques; Table S30: Performance evaluation matrix using features from GRFx, GRFy and GRFz muscles EMG for different feature selection techniques.

Author Contributions

Conceptualization, M.B.I.R. and M.E.H.C.; Data curation, S.K., M.A., S.H.M.A., A.A.A.B. and G.S.; Formal analysis, F.H.; Funding acquisition, M.B.I.R., M.E.H.C., S.K. and G.S.; Investigation, F.H. and M.E.; Methodology, F.H. and M.E.; Project administration, M.B.I.R., M.E.H.C. and S.H.M.A.; Resources, M.B.I.R. and M.E.H.C.; Software, M.B.I.R. and M.E.H.C.; Supervision, M.B.I.R. and M.E.H.C.; Validation, F.H. and M.E.H.C.; Visualization, S.K., M.A., S.H.M.A., A.A.A.B. and G.S.; Writing—original draft, F.H. and M.E.; Writing—review & editing, M.B.I.R. and M.E.H.C. All authors have read and agreed to the published version of the manuscript.

Funding

This research is financially supported by the Qatar National Research Foundation (QNRF) grant no. NPRP12s-0227-190164, International Research Collaboration Co-Fund (IRCC) grant: IRCC-2021-001, University Kebangsaan Malaysia (UKM), Grant Number GUP-2021-019, Grant Number DIP-2020-004, and ASEAN-India Collaborative Research Project, Department of Science and Technology—Science and Engineering Research Board (DST-SERB), Govt. of India, Grant No. CRD/2020/000220. Open Access publication of this article is supported by the Qatar National Library. The statements made herein are solely the responsibility of the authors.

Institutional Review Board Statement

Not applicable.

Informed Consent Statement

Not applicable.

Data Availability Statement

The dataset used in this study is not publicly available.

Acknowledgments

Authors would like to thank ‪Isabel C.N. Sacco, (Physical Therapy, Speech, and Occupational Therapy Department, School of Medicine) and Ricky Watari, Universidade de São Paulo for providing us with the dataset from their study.

Conflicts of Interest

The authors declare no conflict of interest.

References

  1. International Diabetes Federation. IDF Diabetes Atlas 10th ed. 2021. Available online: www.diabetesatlas.org (accessed on 7 March 2022).
  2. Tesfaye, S.; Boulton, A.J.M.; Dyck, P.J.; Freeman, R.; Horowitz, M.; Kempler, P.; Lauria, G.; Malik, R.A.; Spallone, V.; Vinik, A.; et al. Diabetic neuropathies: Update on definitions, diagnostic criteria, estimation of severity, and treatments. Diabetes Care 2010, 33, 2285–2293. [Google Scholar] [CrossRef] [PubMed] [Green Version]
  3. Pop-Busui, R.; Boulton, A.J.M.; Feldman, E.L.; Bril, V.; Freeman, R.; Malik, R.A.; Sosenko, J.M.; Ziegler, D. Diabetic neuropathy: A position statement by the American diabetes association. Diabetes Care 2017, 40, 136–154. [Google Scholar] [CrossRef] [PubMed] [Green Version]
  4. Haque, F.; Reaz, M.B.I.; Ali, S.H.; Arsad, N.; Enamul, M.; Chowdhury, H. Performance analysis of noninvasive electrophysiological methods for the assessment of diabetic sensorimotor polyneuropathy in clinical research: A systematic review and meta - analysis with trial sequential analysis. Sci. Rep. 2020, 1–16. [Google Scholar] [CrossRef]
  5. Akashi, P.M.H.; Sacco, I.C.N.; Watari, R.; Hennig, E. The effect of diabetic neuropathy and previous foot ulceration in EMG and ground reaction forces during gait. Clin. Biomech. 2008, 23, 584–592. [Google Scholar] [CrossRef] [PubMed]
  6. Sacco, I.C.N.; Amadio, A.C. A study of biomechanical parameters in gait analysis and sensitive cronaxie of diabetic neuropathic patients. Clin. Biomech. 2000, 15, 196–202. [Google Scholar] [CrossRef]
  7. Onodera, A.N.; Gomes, A.A.; Pripas, D.; Mezzarane, R.A.; Sacco, I.C.N. Lower limb electromygraphy and kinematics of neuropathic diabetic patients during real-life activities: Stair negotiation. Muscle and Nerve 2011, 44, 269–277. [Google Scholar] [CrossRef]
  8. Sacco, I.C.; Akashi, P.M.; Hennig, E.M. A comparison of lower limb EMG and ground reaction forces between barefoot and shod gait in participants with diabetic neuropathic and healthy controls. BMC Musculoskelet. Disord. 2010, 11. [Google Scholar] [CrossRef]
  9. Haque, F.; Reaz, M.B.I.; Chowdhury, M.E.H.; Hashim, F.H.; Arsad, N.; Ali, S.H.M. Diabetic Sensorimotor Polyneuropathy Severity Classification Using Adaptive Neuro Fuzzy Inference System. IEEE Access 2021, 9, 7618–7631. [Google Scholar] [CrossRef]
  10. Haque, F.; Reaz, M.B.I.; Chowdhury, M.E.H.; Srivastava, G.; Ali, S.H.M.; Bakar, A.A.A.; Bhuiyan, M.A.S. Performance analysis of conventional machine learning algorithms for diabetic sensorimotor polyneuropathy severity classification. Diagnostics 2021, 11, 801. [Google Scholar] [CrossRef]
  11. Gomes, A.A.; Onodera, A.N.; Otuzi, M.E.I.; Pripas, D.; Mezzarane, R.A.; Sacco, I.C.N. Electromyography and kinematic changes of gait cycle at different cadences in diabetic neuropathic individuals. Muscle and Nerve 2011, 44, 258–268. [Google Scholar] [CrossRef]
  12. Watari, R.; Sartor, C.D.; Picon, A.P.; Butugan, M.K.; Amorim, C.F.; Ortega, N.R.S.; Sacco, I.C.N. Effect of diabetic neuropathy severity classified by a fuzzy model in muscle dynamics during gait. J. Neuroeng. Rehabil. 2014, 11, 1–9. [Google Scholar] [CrossRef] [PubMed] [Green Version]
  13. Bacarin, T.A.; Sacco, I.C.N.; Hennig, E.M. Plantar pressure distribution patterns during gait in diabetic neuropathy patients with a history of foot ulcers. Clinics 2009, 64, 113–120. [Google Scholar] [CrossRef] [PubMed] [Green Version]
  14. Sawacha, Z.; Spolaor, F.; Guarneri, G.; Contessa, P.; Carraro, E.; Venturin, A.; Avogaro, A.; Cobelli, C. Abnormal muscle activation during gait in diabetes patients with and without neuropathy. Gait Posture 2012, 35, 101–105. [Google Scholar] [CrossRef] [PubMed]
  15. Sawacha, Z.; Gabriella, G.; Cristoferi, G.; Guiotto, A.; Avogaro, A.; Cobelli, C. Diabetic gait and posture abnormalities: A biomechanical investigation through three dimensional gait analysis. Clin. Biomech. 2009, 24, 722–728. [Google Scholar] [CrossRef] [PubMed]
  16. Spolaor, F.; Sawacha, Z.; Guarneri, G.; Del Din, S.; Avogaro, A.; Cobelli, C. Altered EMG patterns in diabetic neuropathic and not neuropathic patients during step ascending and descending. J. Electromyogr. Kinesiol. 2016, 31, 32–39. [Google Scholar] [CrossRef] [PubMed]
  17. Fernando, M.; Crowther, R.; Lazzarini, P.; Sangla, K.; Cunningham, M.; Buttner, P.; Golledge, J. Biomechanical characteristics of peripheral diabetic neuropathy: A systematic review and meta-analysis of findings from the gait cycle, muscle activity and dynamic barefoot plantar pressure. Clin. Biomech. 2013, 28, 831–845. [Google Scholar] [CrossRef]
  18. Petropoulos, I.N.; Alam, U.; Fadavi, H.; Marshall, A.; Asghar, O.; Dabbah, M.A.; Chen, X.; Graham, J.; Ponirakis, G.; Boulton, A.J.M.; et al. Rapid automated diagnosis of diabetic peripheral neuropathy with in vivo corneal confocal microscopy. Investig. Ophthalmol. Vis. Sci. 2014, 55, 2062–2070. [Google Scholar] [CrossRef]
  19. Gomes, A.A.; Ackermann, M.; Ferreira, J.P.; Orselli, M.I.V.; Sacco, I.C.N. Muscle force distribution of the lower limbs during walking in diabetic individuals with and without polyneuropathy. J. Neuroeng. Rehabil. 2017, 14, 1–13. [Google Scholar] [CrossRef] [Green Version]
  20. Sacco, I.C.N.; Amadio, A.C. Influence of the diabetic neuropathy on the behavior of electromyographic and sensorial responses in treadmill gait. Clin. Biomech. 2003, 18, 426–434. [Google Scholar] [CrossRef]
  21. Kwon, O.Y.; Minor, S.D.; Maluf, K.S.; Mueller, M.J. Comparison of muscle activity during walking in subjects with and without diabetic neuropathy. Gait Posture 2003, 18, 105–113. [Google Scholar] [CrossRef]
  22. Abboud, R.J.; Rowley, D.I.; Newton, R.W. Lower limb muscle dysfunction may contribute to foot ulceration in diabetic patients. Clin. Biomech. 2000, 15, 37–45. [Google Scholar] [CrossRef]
  23. Sawacha, Z.; Guarneri, G.; Avogaro, A.; Cobelli, C. A new classification of diabetic gait pattern based on cluster analysis of biomechanical data. J. Diabetes Sci. Technol. 2010, 4, 1127–1138. [Google Scholar] [CrossRef] [PubMed] [Green Version]
  24. Fernando, M.E.; Crowther, R.G.; Lazzarini, P.A.; Sangla, K.S.; Buttner, P.; Golledge, J. Gait parameters of people with diabetes-related neuropathic plantar foot ulcers. Clin. Biomech. 2016, 37, 98–107. [Google Scholar] [CrossRef] [PubMed]
  25. Mustapa, A.; Justine, M.; Mustafah, N.M.; Manaf, H. The Effect of Diabetic Peripheral Neuropathy on Ground Reaction Forces during Straight Walking in Stroke Survivors. Rehabil. Res. Pract. 2017, 2017, 1–9. [Google Scholar] [CrossRef]
  26. Savelberg, H.H.C.M.; Ilgin, D.; Angin, S.; Willems, P.J.B.; Schaper, N.C.; Meijer, K. Prolonged activity of knee extensors and dorsal flexors is associated with adaptations in gait in diabetes and diabetic polyneuropathy. Clin. Biomech. 2010, 25, 468–475. [Google Scholar] [CrossRef]
  27. Allen, L.; Powell-Cope, G.; Mbah, A.; Bulat, T.; Njoh, E. A Retrospective Review of Adverse Events Related to Diabetic Foot Ulcers e. Ostomy Wound Manag. 2017, 63, 30–33. [Google Scholar]
  28. Fernando, M.E.; Crowther, R.G.; Cunningham, M.; Lazzarini, P.A.; Sangla, K.S.; Golledge, J. Lower limb biomechanical characteristics of patients with neuropathic diabetic foot ulcers: The diabetes foot ulcer study protocol. BMC Endocr. Disord. 2015, 15, 1–11. [Google Scholar] [CrossRef] [Green Version]
  29. Weledji, E.P.; Fokam, P. Treatment of the diabetic foot - to amputate or not? BMC Surg. 2014, 14, 1–6. [Google Scholar] [CrossRef] [Green Version]
  30. Reaz, M.B.I.; Hussain, M.S.; Mohd-Yasin, F. Techniques of EMG signal analysis: Detection, processing, classification and applications. Biol. Proced. Online 2006, 8, 11–35. [Google Scholar] [CrossRef] [Green Version]
  31. Velliangiri, S.; Alagumuthukrishnan, S.; Thankumar Joseph, S.I. A Review of Dimensionality Reduction Techniques for Efficient Computation. Procedia Comput. Sci. 2019, 165, 104–111. [Google Scholar] [CrossRef]
  32. Islam, M.J.; Ahmad, S.; Haque, F.; Reaz, M.B.I.; Bhuiyan, M.A.S.; Islam, M.R. A Novel Signal Normalization Approach to Improve the Force Invariant Myoelectric Pattern Recognition of Transradial Amputees. IEEE Access 2021. [CrossRef]
  33. Islam, M.J.; Ahmad, S.; Haque, F.; Reaz, M.B.I.; Bhuiyan, M.A.S.; Islam, M.R. Force-invariant improved feature extraction method for upper-limb prostheses of transradial amputees. Diagnostics 2021, 11, 843. [Google Scholar] [CrossRef] [PubMed]
  34. Buongiorno, D.; Cascarano, G.D.; De Feudis, I.; Brunetti, A.; Carnimeo, L.; Dimauro, G.; Bevilacqua, V. Deep learning for processing electromyographic signals: A taxonomy-based survey. Neurocomputing 2021, 452, 549–565. [Google Scholar] [CrossRef]
  35. Xiong, D.; Zhang, D.; Zhao, X.; Zhao, Y. Deep Learning for EMG-based Human-Machine Interaction: A Review. IEEE/CAA J. Autom. Sin. 2021, 8, 512–533. [Google Scholar] [CrossRef]
  36. Shehata, A.W.; Williams, H.E.; Hebert, J.S.; Pillarski, P.M. Machine Learning for the Control of Prosthetic Arms: Using Electromyographic Signals for Improved Performance. IEEE Signal Process. Mag. 2021, 38, 46–53. [Google Scholar] [CrossRef]
  37. Islam, J.; Ahmad, S.; Haque, F.; Bin, M.; Reaz, I. Myoelectric Pattern Recognition Performance Enhancement Using Nonlinear Features. arXiv 2021, 1–19. [Google Scholar] [CrossRef]
  38. Sarker, P.; Mirka, G. Effects of Sampling Frequency and Sample Window Size on Median Frequency of Surface EMG. Proc. Hum. Factors Ergon. Soc. Annu. Meet. 2019, 63, 1369–1372. [Google Scholar] [CrossRef]
  39. Tkach, D.; Huang, H.; Kuiken, T.A. Study of stability of time-domain features for electromyographic pattern recognition. J. Neuroeng. Rehabil. 2010, 7, 1–13. [Google Scholar] [CrossRef] [Green Version]
  40. Altın, C.; Er, O. Comparison of Different Time and Frequency Domain Feature Extraction Methods on Elbow Gesture’s EMG. Eur. J. Interdiscip. Stud. 2016, 5, 35. [Google Scholar] [CrossRef]
  41. Stergiou, N.; Giakas, G.; Byrne, J.E.; Pomeroy, V. Frequency domain characteristics of ground reaction forces during walking of young and elderly females. Clin. Biomech. 2002, 17, 615–617. [Google Scholar] [CrossRef]
  42. Ramzi, H. Blind Source Separation of Single-sensor Recordings: Application to Ground Reaction Force Signals. Ph.D. Thesis, Université de Lyon, Lyon, France, 2018. [Google Scholar]
  43. Soubra, R.; Diab, M.O.; Moslem, B. A mother wavelet selection study for vertical ground reaction force signals. In Proceedings of the BioSMART 2017–2017 2nd International Conference on Bio-engineering for Smart Technologies, Paris, France, 30 August–1 September 2017; pp. 1–5. [Google Scholar]
  44. Doulah, A.B.M.S.U.; Fattah, S.A.; Zhum, W.-P.; Ahmad, M.O. Wavelet Domain Feature Extraction Scheme Based on Dominant Motor Unit Action Potential of EMG Signal for Neuromuscular Disease Classification. IEEE Trans. Biomed. Circuits Syst. 2014, 8, 155–163. [Google Scholar] [CrossRef] [PubMed]
  45. Spencer, R.; Thabtah, F.; Abdelhamid, N.; Thompson, M. Exploring feature selection and classification methods for predicting heart disease. Digit. Heal. 2020, 6, 1–10. [Google Scholar] [CrossRef] [PubMed] [Green Version]
  46. Radovic, M.; Ghalwash, M.; Filipovic, N.; Obradovic, Z. Minimum redundancy maximum relevance feature selection approach for temporal gene expression data. BMC Bioinformatics 2017, 18, 1–14. [Google Scholar] [CrossRef] [PubMed] [Green Version]
  47. Ward, J.L.; Lumsden, S.L. Locally linear embedding: Dimension reduction of massive protostellar spectra. Mon. Not. R. Astron. Soc. 2016, 461, 2250–2256. [Google Scholar] [CrossRef]
  48. Saeb, S.; Lonini, L.; Jayaraman, A.; Mohr, D.C.; Kording, K.P. The need to approximate the use-case in clinical machine learning. Gigascience 2017, 6, 1–9. [Google Scholar] [CrossRef] [Green Version]
  49. Chaibub Neto, E.; Pratap, A.; Perumal, T.M.; Tummalacherla, M.; Snyder, P.; Bot, B.M.; Trister, A.D.; Friend, S.H.; Mangravite, L.; Omberg, L. Detecting the impact of subject characteristics on machine learning-based diagnostic applications. npj Digit. Med. 2019, 2, 1–6. [Google Scholar] [CrossRef] [Green Version]
  50. Chawla, N.V.; Bowyer, K.W.; Lawrence, O.; Hall, W. Philip Kegelmeyer SMOTE: Synthetic Minority Over-sampling Technique. J. Artif. Intell. Res. 2002, 16, 321–357. [Google Scholar] [CrossRef]
  51. Kohavi, R.; Provost, F. Glossary of Terms. Mach. Learn. 1998, 30, 271–274. [Google Scholar] [CrossRef]
  52. Sinnreich, M.; Taylor, B.V.; Dyck, P.J.B. Diabetic neuropathies: Classification, clinical features, and pathophysiological basis. Neurologist 2005, 11, 63–79. [Google Scholar] [CrossRef]
  53. Hazari, A.; Maiya, A.G.; Shivashankara, K.N.; Agouris, I.; Monteiro, A.; Jadhav, R.; Kumar, S.; Shashi Kumar, C.G.; Mayya, S.S. Kinetics and kinematics of diabetic foot in type 2 diabetes mellitus with and without peripheral neuropathy: A systematic review and meta-analysis. Springerplus 2016, 5. [Google Scholar] [CrossRef] [Green Version]
  54. Alam, U.; Riley, D.R.; Jugdey, R.S.; Azmi, S.; Rajbhandari, S.; D’Août, K.; Malik, R.A. Diabetic Neuropathy and Gait: A Review. Diabetes Ther. 2017, 8, 1253–1264. [Google Scholar] [CrossRef] [PubMed] [Green Version]
  55. Boulton, A.J.M. The diabetic foot: From art to science. The 18th Camillo Golgi lecture. Diabetologia 2004, 47, 1343–1353. [Google Scholar] [CrossRef] [PubMed]
  56. Cruz-Vega, I.; Hernandez-Contreras, D.; Peregrina-Barreto, H.; Rangel-Magdaleno, J.D.J.; Ramirez-Cortes, J.M. Deep learning classification for diabetic foot thermograms. Sensors 2020, 20, 1762. [Google Scholar] [CrossRef] [PubMed] [Green Version]
  57. Schäfer, Z.; Mathisen, A.; Svendsen, K.; Engberg, S.; Rolighed Thomsen, T.; Kirketerp-Møller, K. Toward Machine-Learning-Based Decision Support in Diabetes Care: A Risk Stratification Study on Diabetic Foot Ulcer and Amputation. Front. Med. 2021, 7, 1–13. [Google Scholar] [CrossRef]
Figure 1. Sample of raw EMG signals from three lower limb muscles and 3-dimensional GRF signals Reprinted with permission from ref. [5]. Copyright Year 2022, Isabel C.N. Sacco, (Physical Therapy, Speech, and Occupational Therapy Department, School of Medicine).
Sensors 22 03507 g001
Figure 2. Flow chart of the data processing and ML model performance analysis for DN and DFU patients’ identification using EMG and GRF features.
Sensors 22 03507 g002
Figure 3. Confusion Matrix for two-class classification problem.
Sensors 22 03507 g003
Figure 4. Top-ranked features from the GL muscle EMG signal by (a) Chi-Square, (b) mrmr, (c) Relieff, (d) fscnca feature selection techniques.
Sensors 22 03507 g004
Figure 5. Confusion matrix for KNN model using the top 12 features extracted from GL and VL muscles EMG and feature ranked using the chi-square feature ranking technique.
Sensors 22 03507 g005
Figure 6. ROC curve for top-ranked features from the GL muscle EMG signal by (a) Chi-Square, (b) mrmr, (c) Relieff, (d) fscnca feature selection techniques.
Sensors 22 03507 g006
Figure 7. Top-ranked features from GRFx signal by (a) Chi-Square, (b) mrmr, (c) Relieff, (d) fscnca feature selection techniques.
Sensors 22 03507 g007aSensors 22 03507 g007b
Figure 8. Confusion matrix for KNN model using the top 12 features extracted from GRFx and GRFz signals and feature ranked using the fscnca feature ranking technique.
Sensors 22 03507 g008
Figure 9. ROC curve for top-ranked features from the GRFx signal by (a) Chi-Square, (b) mrmr, (c) Relieff, (d) fscnca feature selection techniques.
Sensors 22 03507 g009aSensors 22 03507 g009b
Table 1. Sociodemographic characteristics of the patients. Reprinted with permission from ref. [5]. Copyright Year 2022, ‪Isabel C.N. Sacco, (Physical Therapy, Speech, and Occupational Therapy Department, School of Medicine).
Control Group
(n = 6)
Diabetic Group
(n = 6)
Ulcer Diabetic Group (n = 9)p
Age(years)52.2 ± 6.956.0 ± 8.555.6 ± 6.00.7 a
Gender(male/female)3/32/41/8-
Weight (Kg)61.7 ± 5.366.7 ± 12.283.4 ± 10.5<0.001 a
Height (m)1.7 ± 0.091.6 ± 0.071.7 ± 0.070.008 a
BMI (kg/m2)22.1 ± 1.7 c25.1 ± 4.027.8 ± 3.40.029 a
Time of DM (years)-15.2 ± 6.814.3 ± 5.80.80 a
Glycemia(mg/dL)-142 ± 61.8188.6 ± 61.20.17 a
MNSI Questionnaire d-77.50.72 b
MNSI Clinical Examination d-2.540.12 b
a One-Way ANOVA; b Mann–Whitney test; c The significantly different group; d Median.
Table 2. Number of features extracted from lower limb muscle EMG for a different combination.
CombinationMusclesNo. of FeaturesAfter Removing Highly Correlated Features
One ChannelGL1911
VL
TA
Two ChannelGL-VL3824
GL-TA22
TA-VL22
Three ChannelGL-VL-Ta5734
Table 3. Evaluation matrix for one-channel analysis for EMG data using different feature selection techniques.
MuscleFeature Ranking TechniqueFeaturesAccuracy (%)Precision (%)Sensitivity (%)F1 Score (%)AUC
GLChi-SquareTop 881.3082.2281.3081.540.83
mrmrTop 1180.9281.5980.9281.110.82
RelieffTop 784.7384.8984.7384.760.85
fscncaTop 1081.3082.2781.3081.540.83
TAChi-SquareTop 880.5380.9180.5380.590.82
mrmrTop 984.3585.0684.3584.480.87
RelieffTop 981.3081.5881.3081.400.82
fscncaTop 1183.5983.9383.5983.670.86
VLChi-SquareTop 1074.8175.5574.8175.090.80
mrmrTop 1175.9576.7775.9576.240.82
RelieffTop 877.1077.9677.1077.390.83
fscncaTop 1176.7277.2576.7276.840.83
Table 4. Evaluation matrix for two-channel analysis for EMG data using different feature selection techniques.
MusclesFeature Ranking TechniqueFeaturesAccuracy (%)Precision (%)Sensitivity (%)F1 Score (%)AUC
GL-TAChi-SquareTop 1595.8096.0495.8095.840.96
mrmrTop 1794.2794.3894.2794.300.95
RelieffTop 1795.0495.1695.0495.050.96
fscncaTop 2293.5193.6793.5193.550.94
TA-VLChi-SquareTop 1892.3792.7192.3792.440.94
mrmrTop 1391.9892.0791.9892.010.91
RelieffTop 1792.7593.0392.7592.820.93
fscncaTop 2093.5193.8093.5193.580.94
GL-VLChi-SquareTop 1296.1896.2596.1896.200.97
mrmrTop 1493.5193.5993.5193.520.95
RelieffTop 1695.8095.8495.8095.810.97
fscncaTop 2192.7593.1292.7592.820.96
Table 5. Evaluation matrix for three-channel analysis for EMG data using different feature selection techniques.
MusclesFeature Ranking TechniqueFeaturesAccuracy (%)Precision (%)Sensitivity (%)F1 Score (%)AUC
GL-TA-VLChi-SquareTop 2795.8095.8695.8095.780.99
mrmrTop 3895.4295.6895.4295.410.98
RelieffTop 2395.8095.8695.8095.800.97
fscncaTop 3695.0495.0495.0495.030.98
Table 6. Number of features extracted from GRF for a different combination.
CombinationMusclesNo. of FeaturesAfter Removing Highly Correlated Features
One ChannelGRFx19556
GRFy50
GRFz37
Two ChannelGRFx-GRFy390102
GRFx-GRFz87
GRFy-GRFz86
Three ChannelGRFx-GRFy-GRFz585129
Table 7. Evaluation matrix for one-channel analysis for GRF data using different feature selection techniques.
GRF ComponentFeature Ranking TechniqueFeaturesAccuracy
(%)
Precision (%)Sensitivity (%)F1 Score (%)AUC
GRFxChi-SquareTop 3897.3797.4197.3797.360.98
mrmrTop 5096.0596.2896.0596.050.98
RelieffTop 1497.3797.4197.3797.360.98
fscncaTop 1998.6898.7298.6898.681.00
GRFyChi-SquareTop 1592.1192.2892.1192.110.95
mrmrTop 3486.8487.2686.8486.780.89
RelieffTop 3592.1192.2792.1192.120.95
fscncaTop 2193.4294.3293.4293.400.96
GRFzChi-SquareTop 2494.7494.7594.7494.720.95
mrmrTop 1893.4293.4793.4293.420.94
RelieffTop 3293.4293.7193.4293.410.93
fscncaTop 1393.4293.6593.4293.450.95
Table 8. Evaluation matrix for two-channel analysis for GRF data using different feature selection techniques.
GRF ComponentFeature Ranking TechniqueFeaturesAccuracy
(%)
Precision (%)Sensitivity (%)F1 Score (%)AUC
GRFy-GRFzChi-SquareTop 394.7494.8394.7494.670.92
mrmrTop 4296.0596.0596.0596.050.97
RelieffTop 4594.7494.8294.7494.750.96
fscncaTop 2098.6898.7298.6898.681.00
GRFx-GRFzChi-SquareTop 2494.7494.9394.7494.750.96
mrmrTop 1997.3797.4397.3797.370.99
RelieffTop 4198.6898.7298.6898.681.00
fscncaTop 798.6898.7298.6898.680.98
GRFx-GRFyChi-SquareTop 1796.0596.2496.0596.070.98
mrmrTop 8797.3797.4397.3797.370.97
RelieffTop 1796.0596.0796.0596.040.99
fscncaTop 2498.6898.7298.6898.681.00
Table 9. Evaluation matrix for three-channel analysis for GRF data using different feature selection techniques.
GRF ComponentFeature Ranking Technique Accuracy
(%)
Precision (%)Sensitivity (%)F1 Score (%)AUCAccuracy
(%)
GRFx-GRFy-GRFzChi-Square Top 11197.3797.4197.3797.361.00
mrmrTop 6498.6898.7298.6898.681.00
RelieffTop 10698.6898.7298.6898.681.00
fscncaTop 2198.6898.7298.6898.681.00
Publisher’s Note: MDPI stays neutral with regard to jurisdictional claims in published maps and institutional affiliations.

