
LoRa Based IoT Platform for Remote Monitoring of Large-Scale Agriculture Farms in Chile

 , , , and
Abstract
:1. Introduction
2. Related Work
- Propose an IoT-based platform for remote monitoring of large-scale agriculture farms. The proposed architecture consists of four layers: farm perception layer, sensors and actuators layer, communication network layer, and application layer.
- Develop a simulation model for the LoRa-based communication network of large-scale farms that enable remote monitoring of different sensor nodes and measurement devices in the field.
- Investigate the feasibility of using LoRa-based communication for large-scale farms concerning packet delivery ratio, number of collisions and throughput.
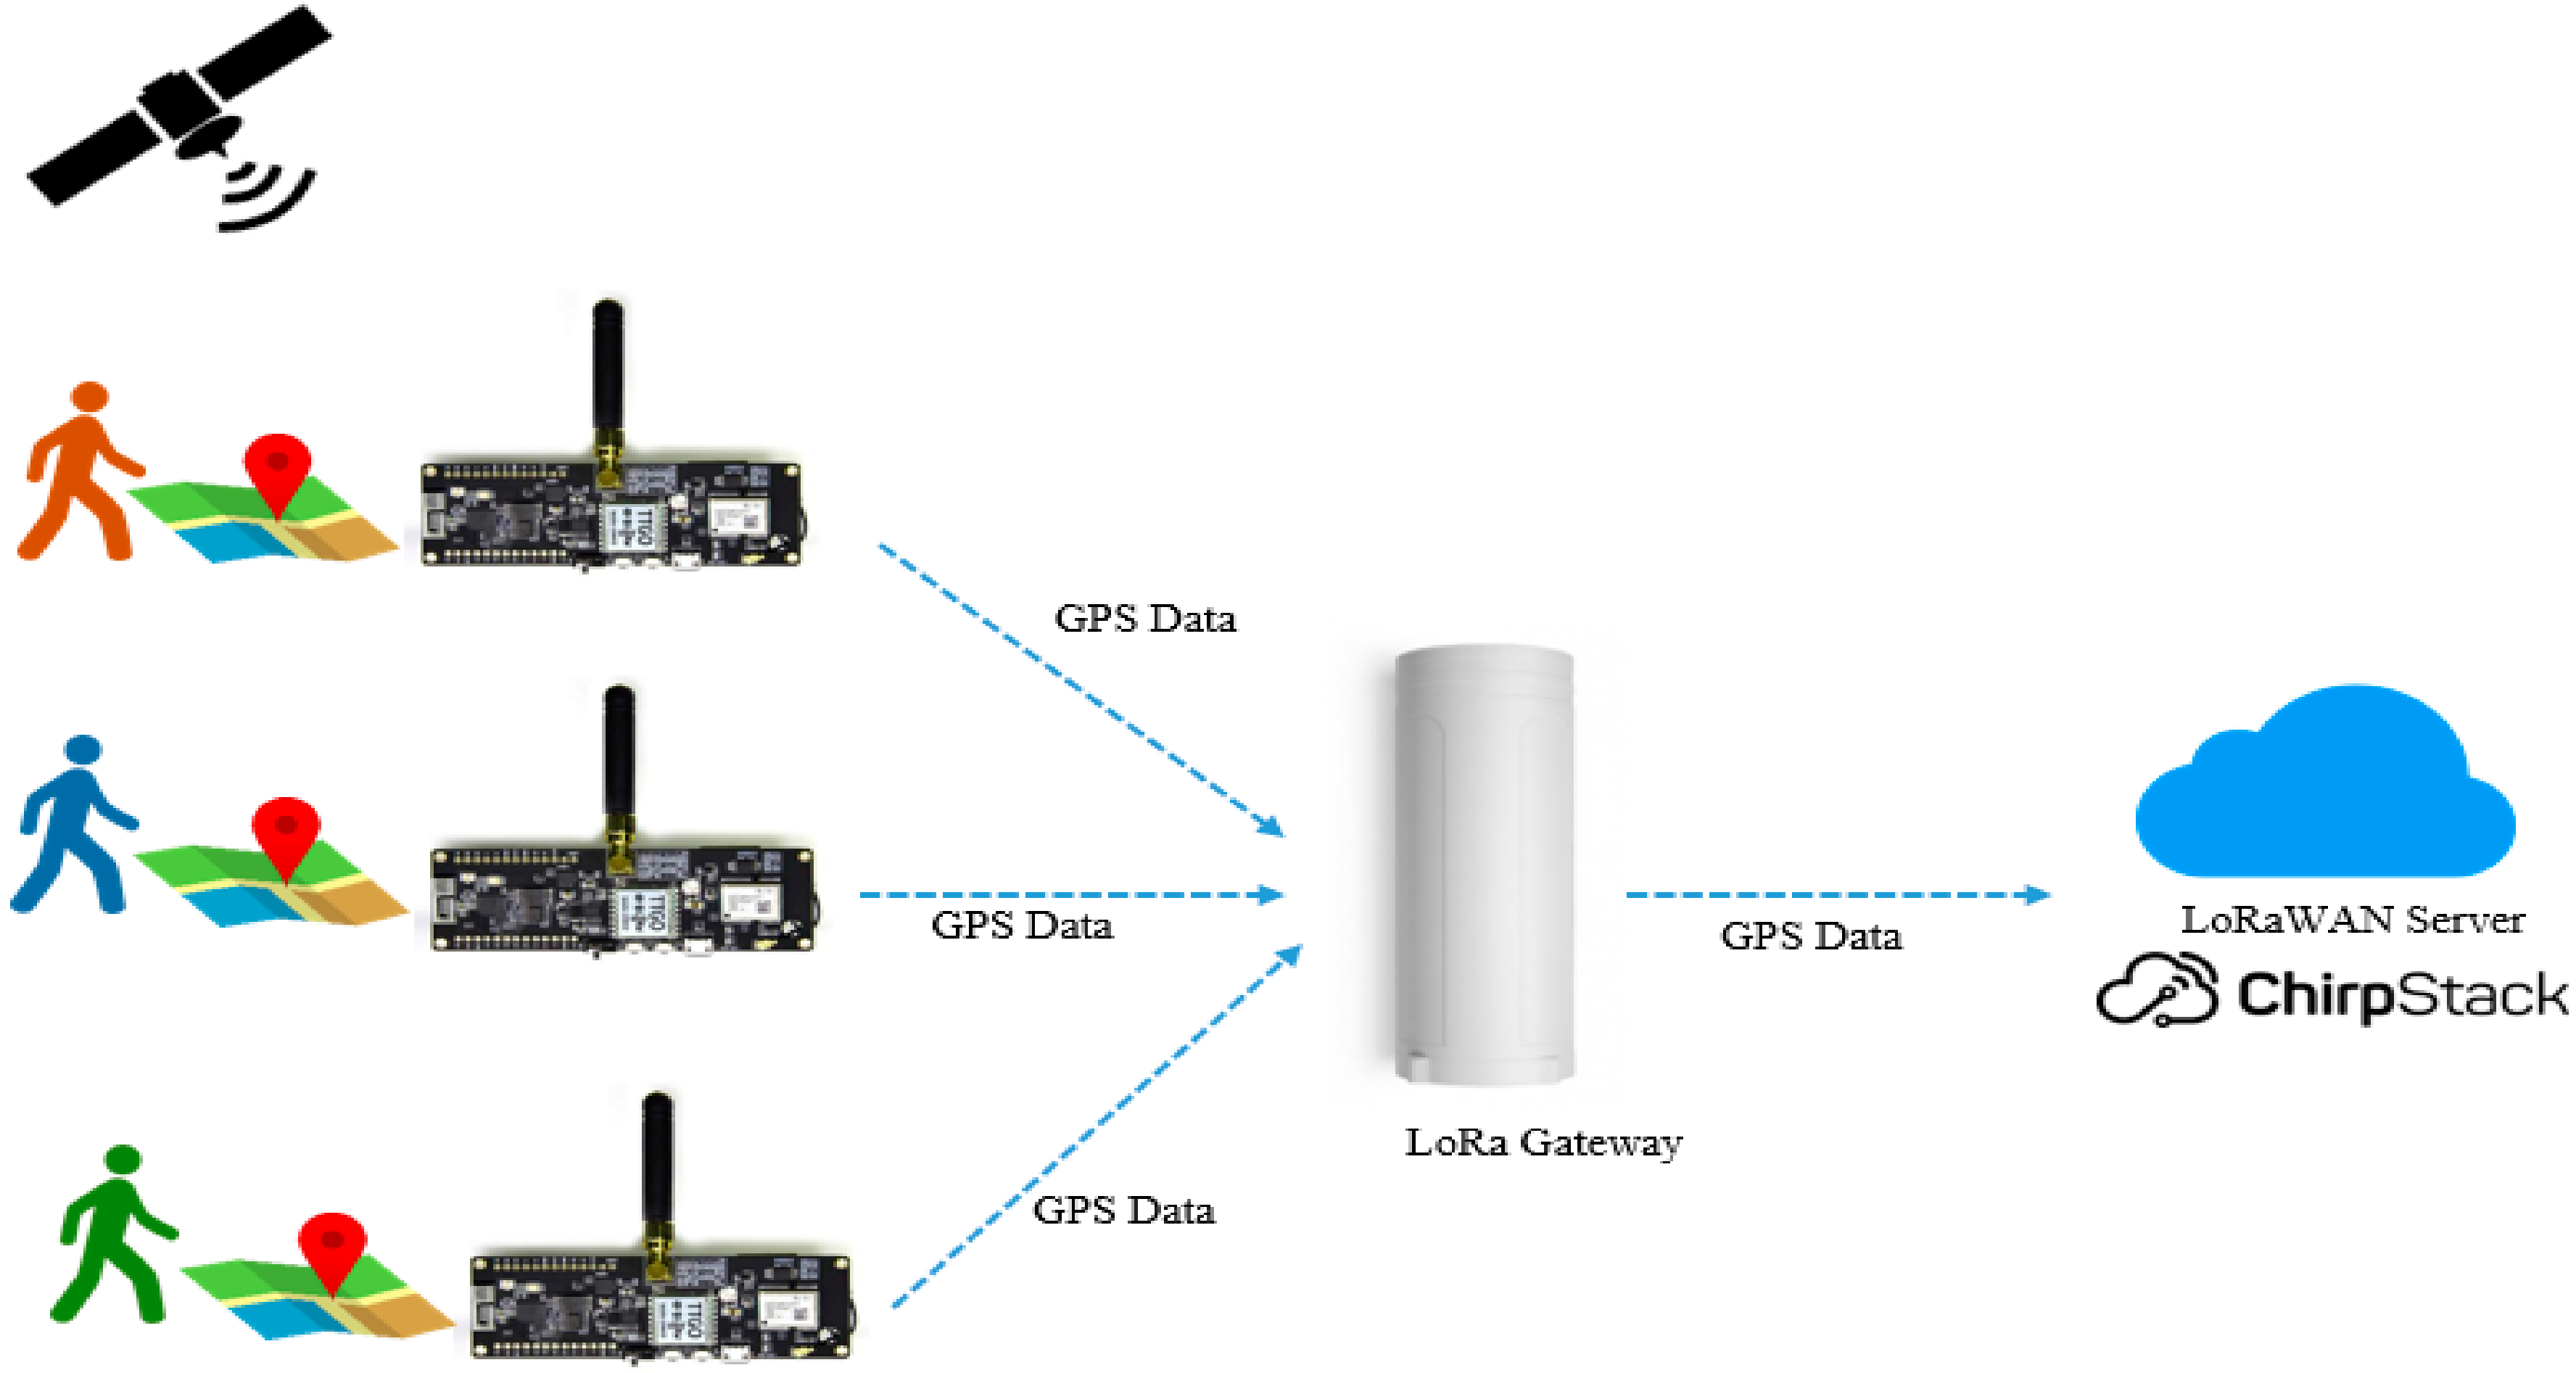
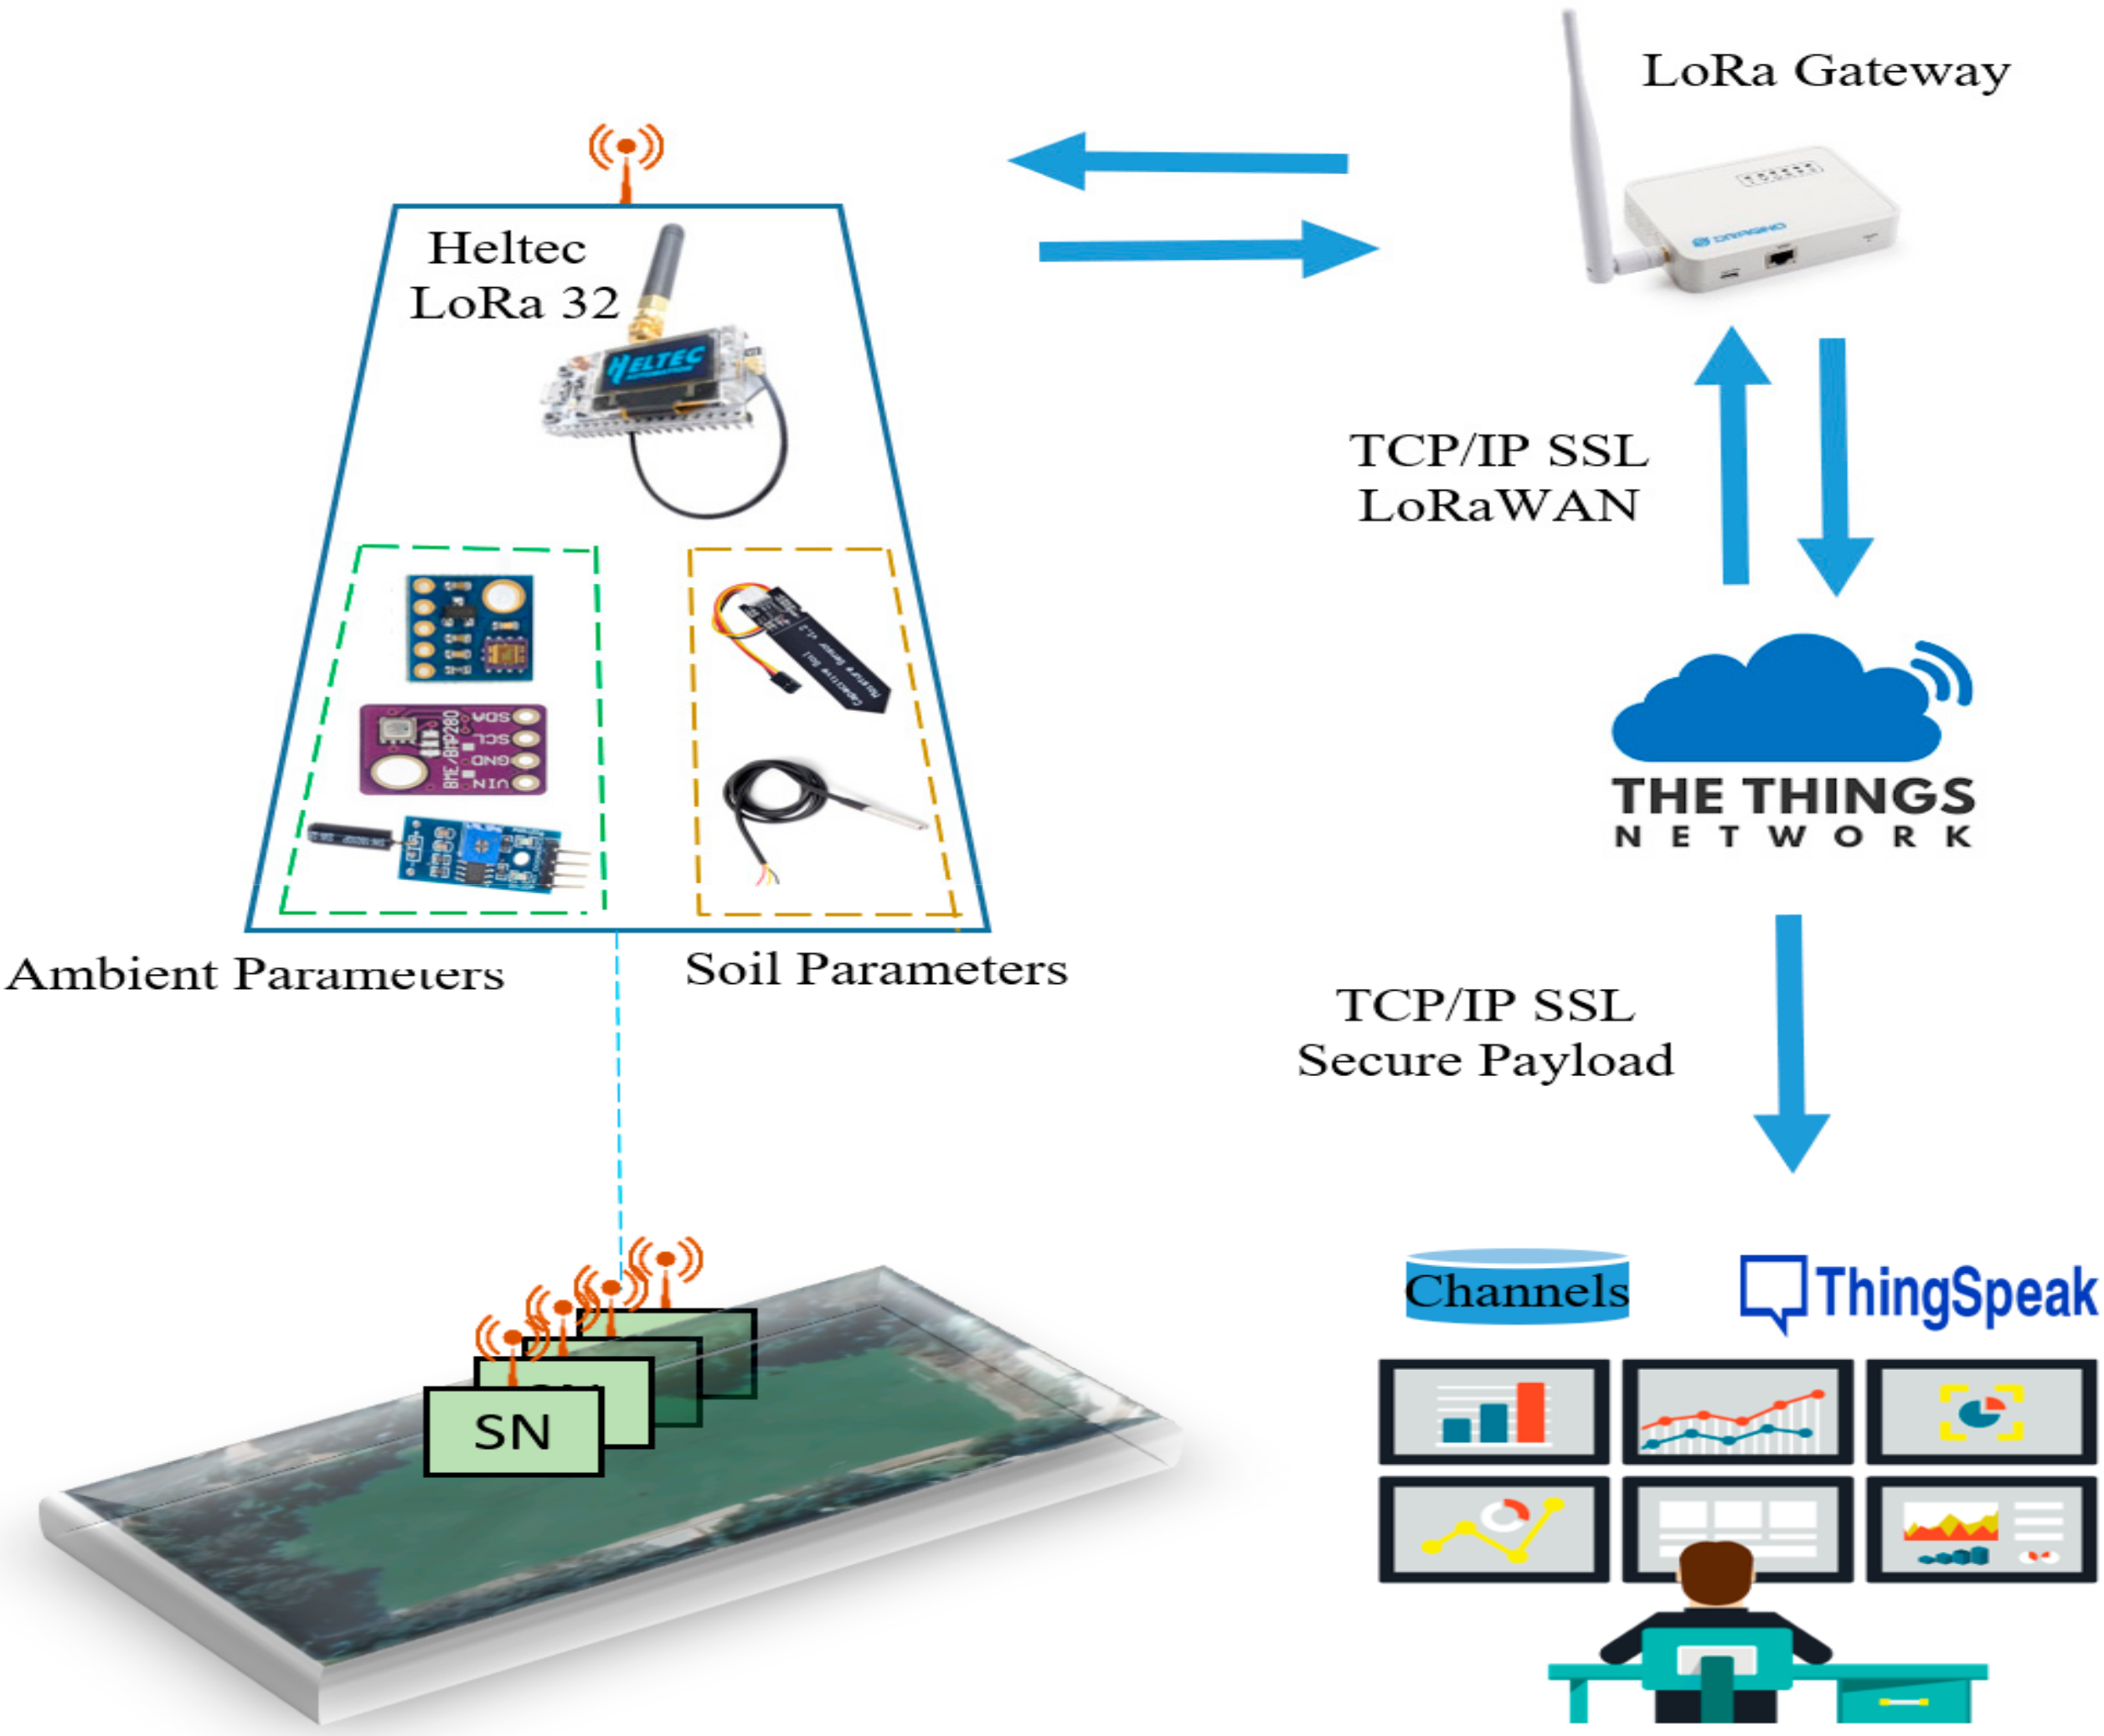
- Design, prototype, and implement a LoRa-based platform using low-cost devices that enable GPS LoRa tracking and real-time monitoring of ambient and soil conditions.
3. Materials and Methods
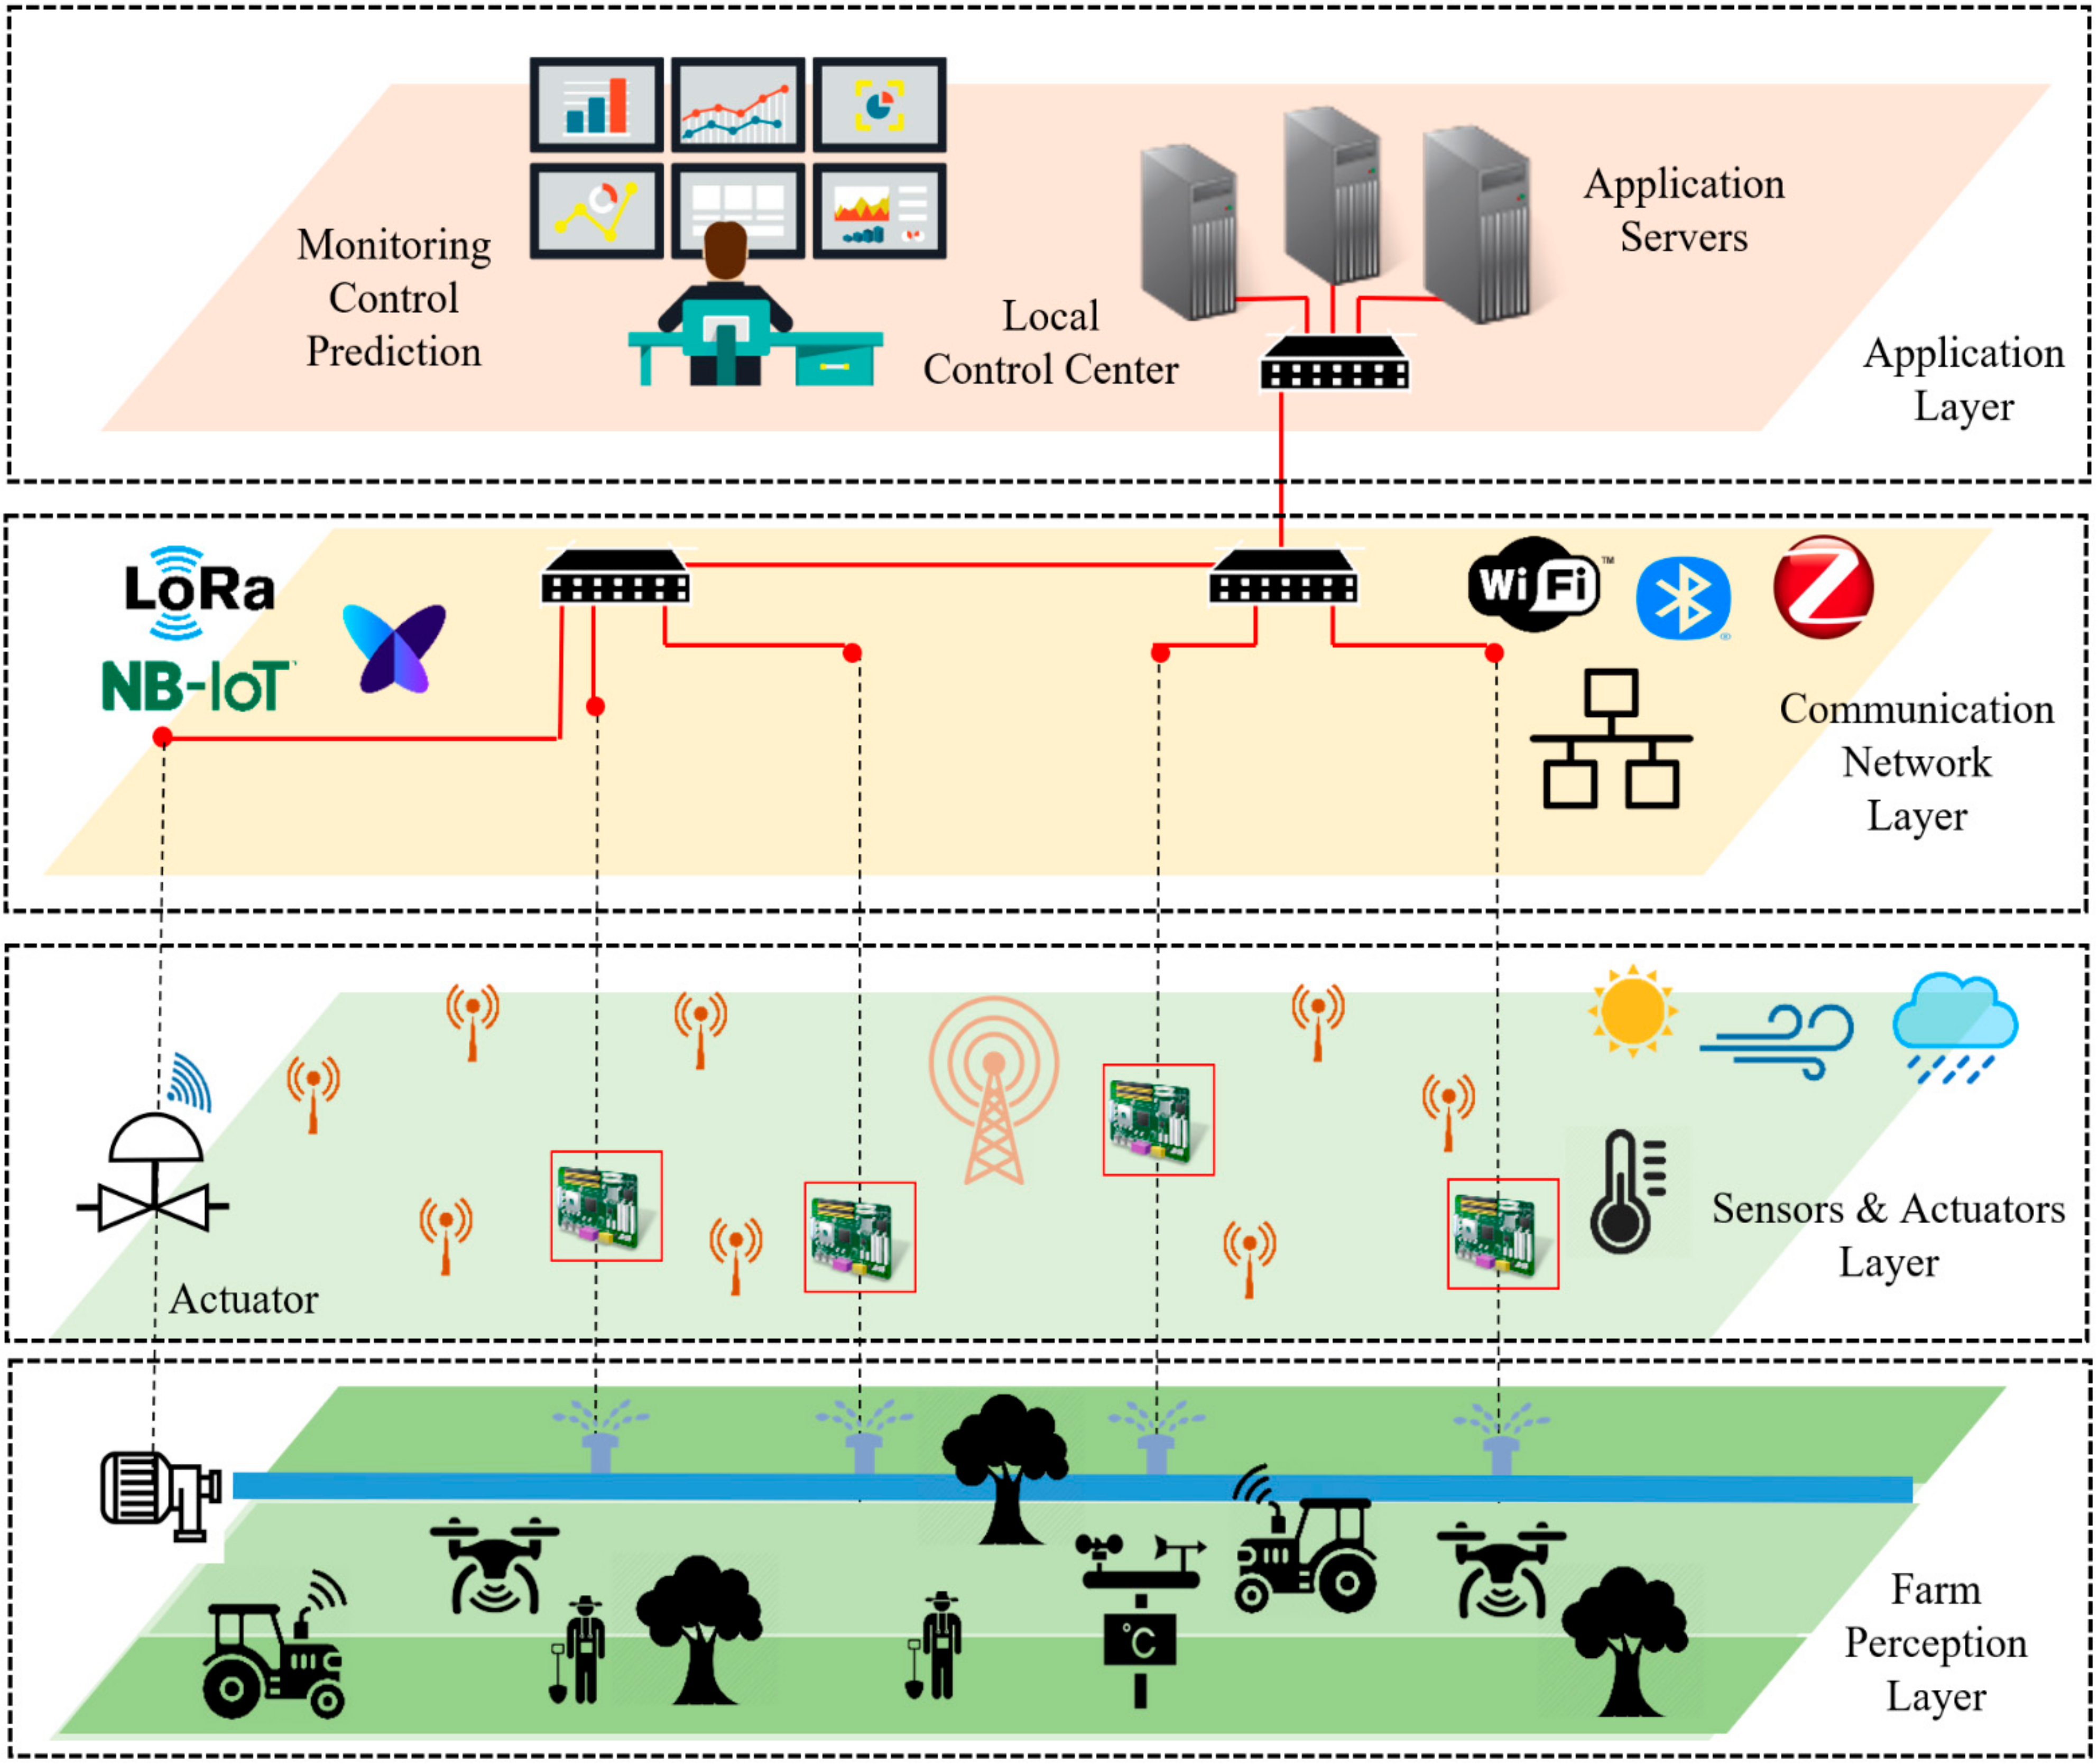
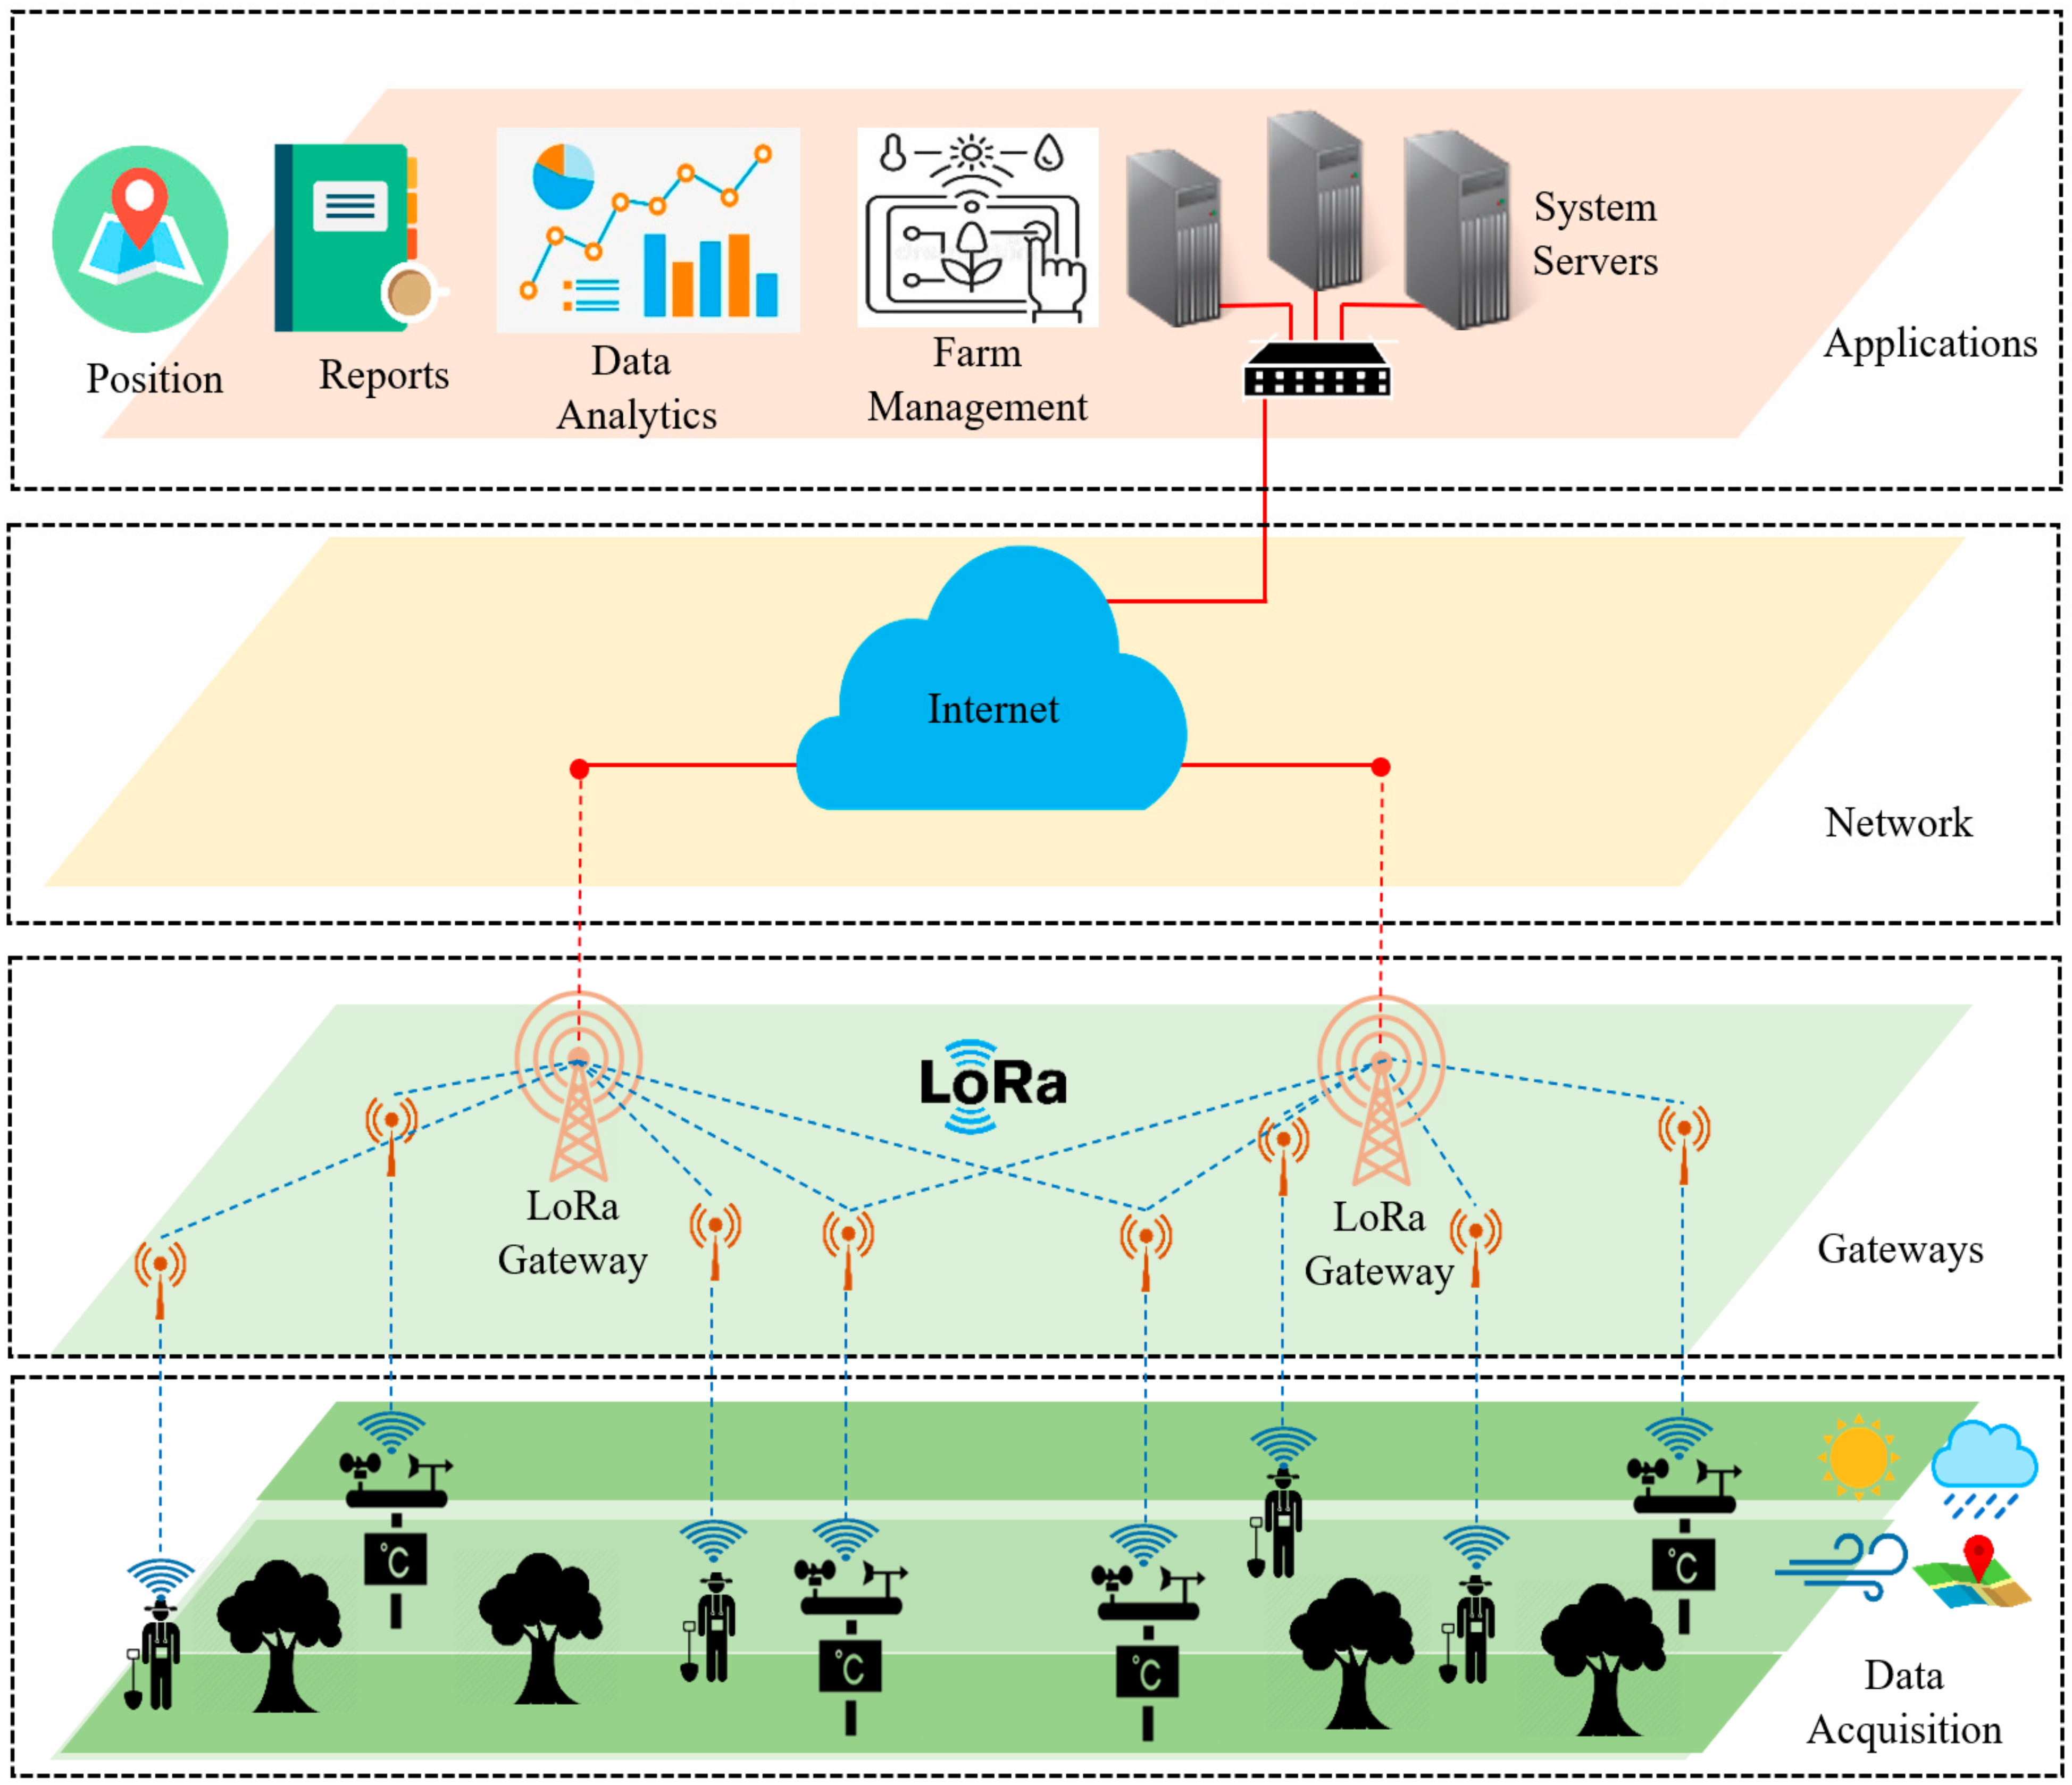
3.1. IoT-Based Architecture for Smart Farming
- Farm Perception Layer
- Sensors and Actuators Layer
- Communication Network Layer
- Application Layer
3.2. LoRa-Based Architecture for Large-Scale Agriculture Farms
3.2.1. LoRa Technology
- Spreading Factor (SF): The ratio between the data symbol rate and chirp rate. The configuration of SF affects the data rate and coverage distance. The high spreading factor supports low data rates and a long communication range.
- Code Rate (CR): Is the forward error correction rate that affects the airtime of packet transmission.
- Central Frequency: It depends on the industrial, scientific and medical (ISM) band used.
- Bandwidth: It affects the data rate of transmissions.
- Data Acquisition: LoRa sensor nodes are responsible for collecting sensing data or control actions (actuators) through communication with gateways.
- Gateways: LoRa gateways are internet-connected devices responsible for receiving/transmitting data packets from/to different LoRa sensor/actuator nodes.
- Network Server: The network server is responsible for managing the LoRa gateways and handling the duplication of the received packets. Additionally, it is responsible for sending/scheduling data and acknowledgment to be transmitted for specific nodes.
- Application Server: The application server is responsible for handling LoRaWAN application layer, such as downlink/uplink data encoding/decoding and encryption/decryption.
3.2.2. Design Requirements
- Hardware and energy efficiency requirements: All sensor nodes and measuring devices in the farm perception layer are exposed to harsh environmental conditions such as temperature, humidity, rain, and wind that may affect the electronic circuits. These challenges should be considered during hardware design and implementation.
- Cost requirements: The total cost of the IoT system includes the price of sensor nodes, measuring devices, gateways, and base stations.
- Scalability requirements: The system back-end and databases should be able to support receiving information from a large number of sensor nodes and measuring devices. Additionally, the system should be able to add new hardware and/or software.
- Network coverage requirements: Wireless communication offers many advantages compared with wired-based solutions. However, network reliability, interference, and data loss should be evaluated as many sensor nodes use an unlicensed spectrum such as ZigBee, Wi-Fi, LoRa, etc.
- Interoperability requirements: Smart Agriculture farms should be able to integrate heterogeneous IoT devices, different proprietary systems, and/or platforms at different levels (data acquisition, communication network, and applications).
4. Results
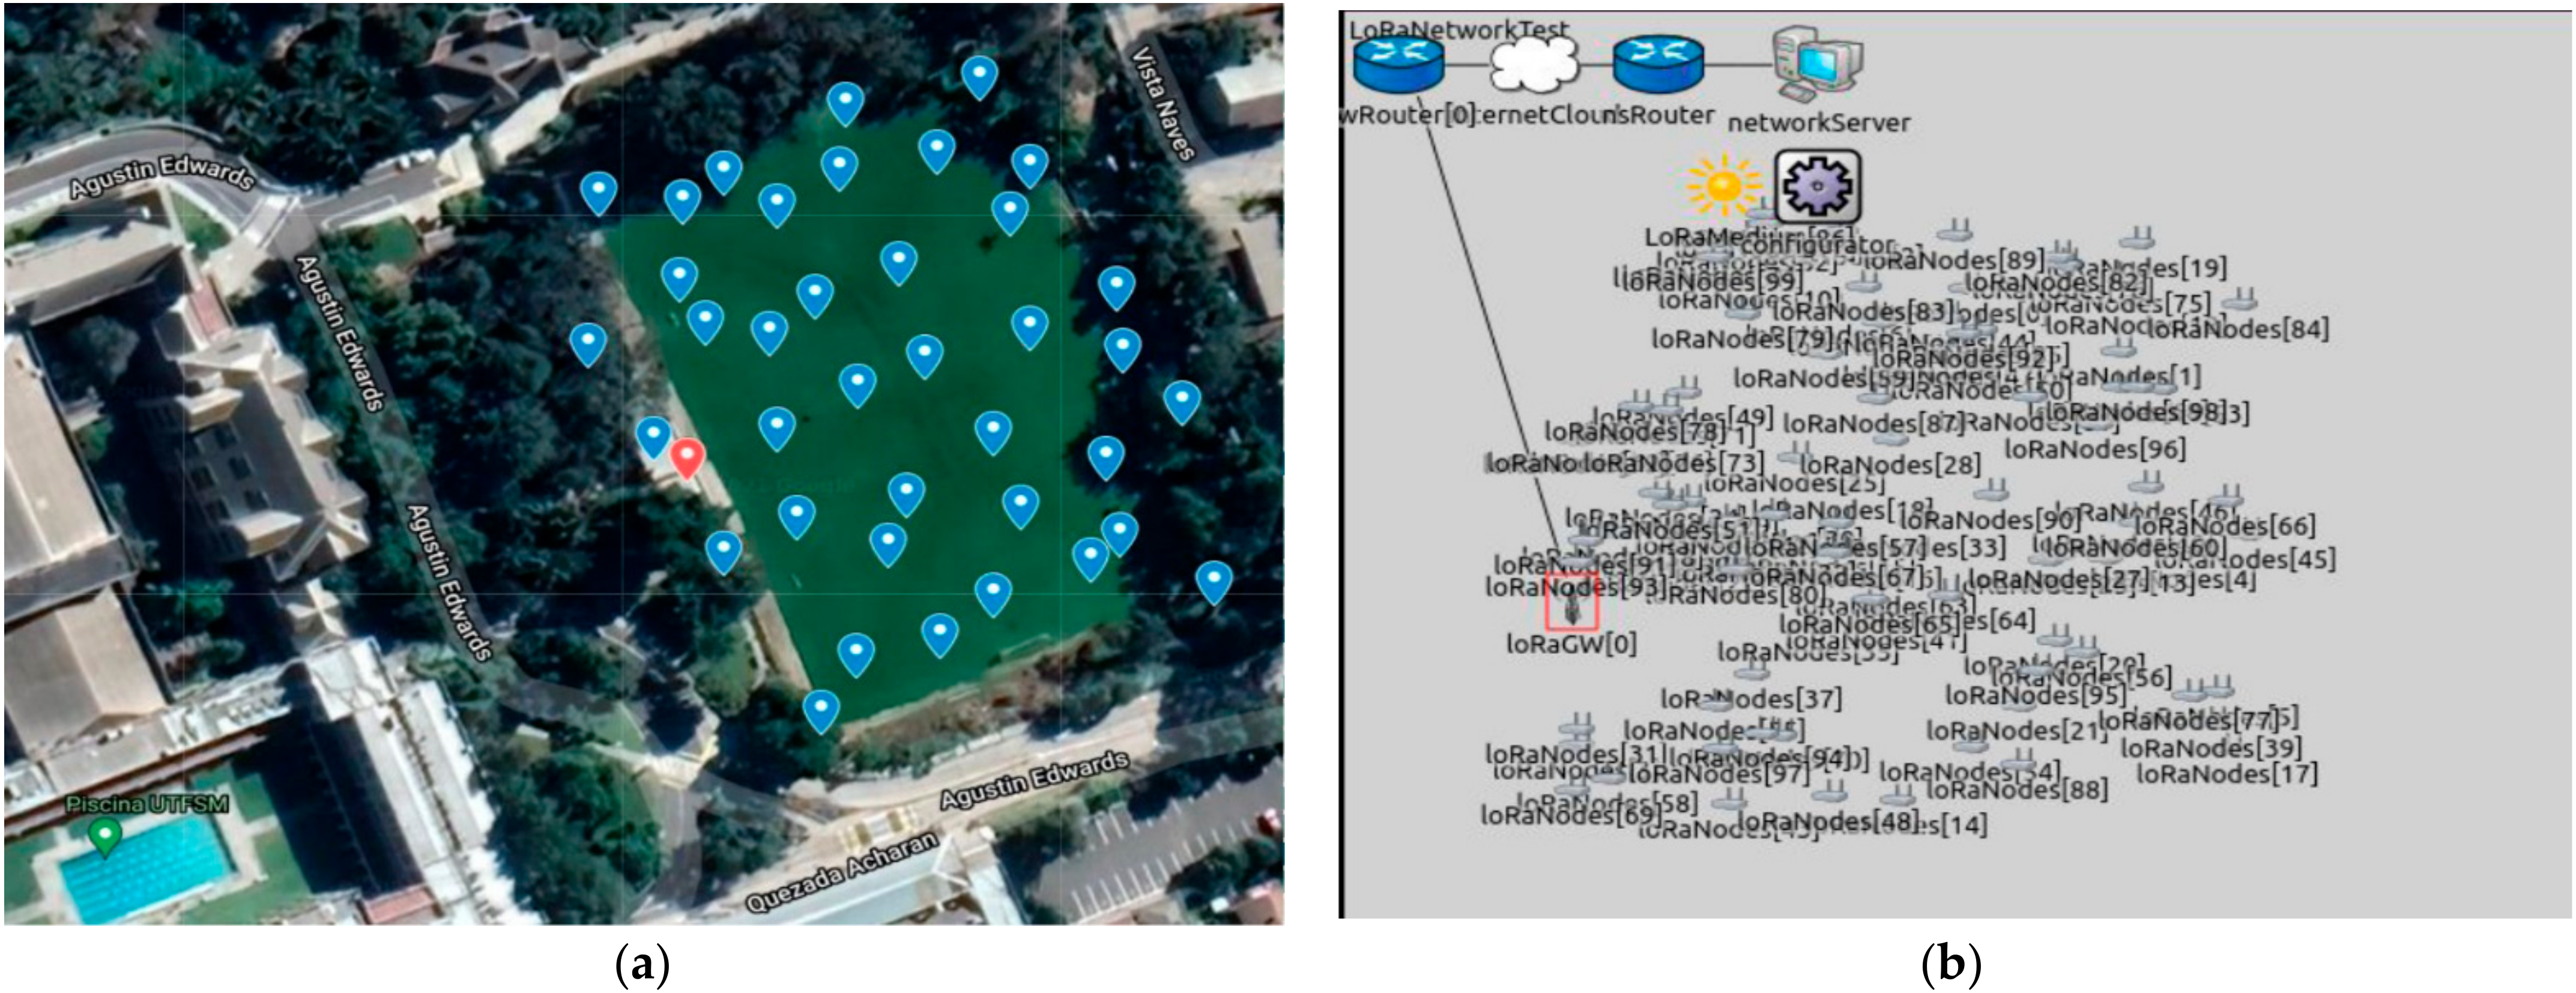
4.1. LoRa Network Model and Simulation Results
- LoRa Links: The LoRa transmission is successful if the received power is greater than the receiver sensitivity. The model is based on the log-distance path loss model and shadowing, where the path loss is based on the distance between the transmitter and receiver.
- Energy Consumer Modules: The three main states for the LoRa radio are transmit, receive, and sleep. The energy consumed is based on the amount of time spent by the LoRa radio in a particular state.
- Network Elements: The simulation model enables the network end-to-end simulation by modeling end-nodes, gateways, and network servers. The gateways and the network servers are communicating over IP such as Ethernet and Wi-Fi links.
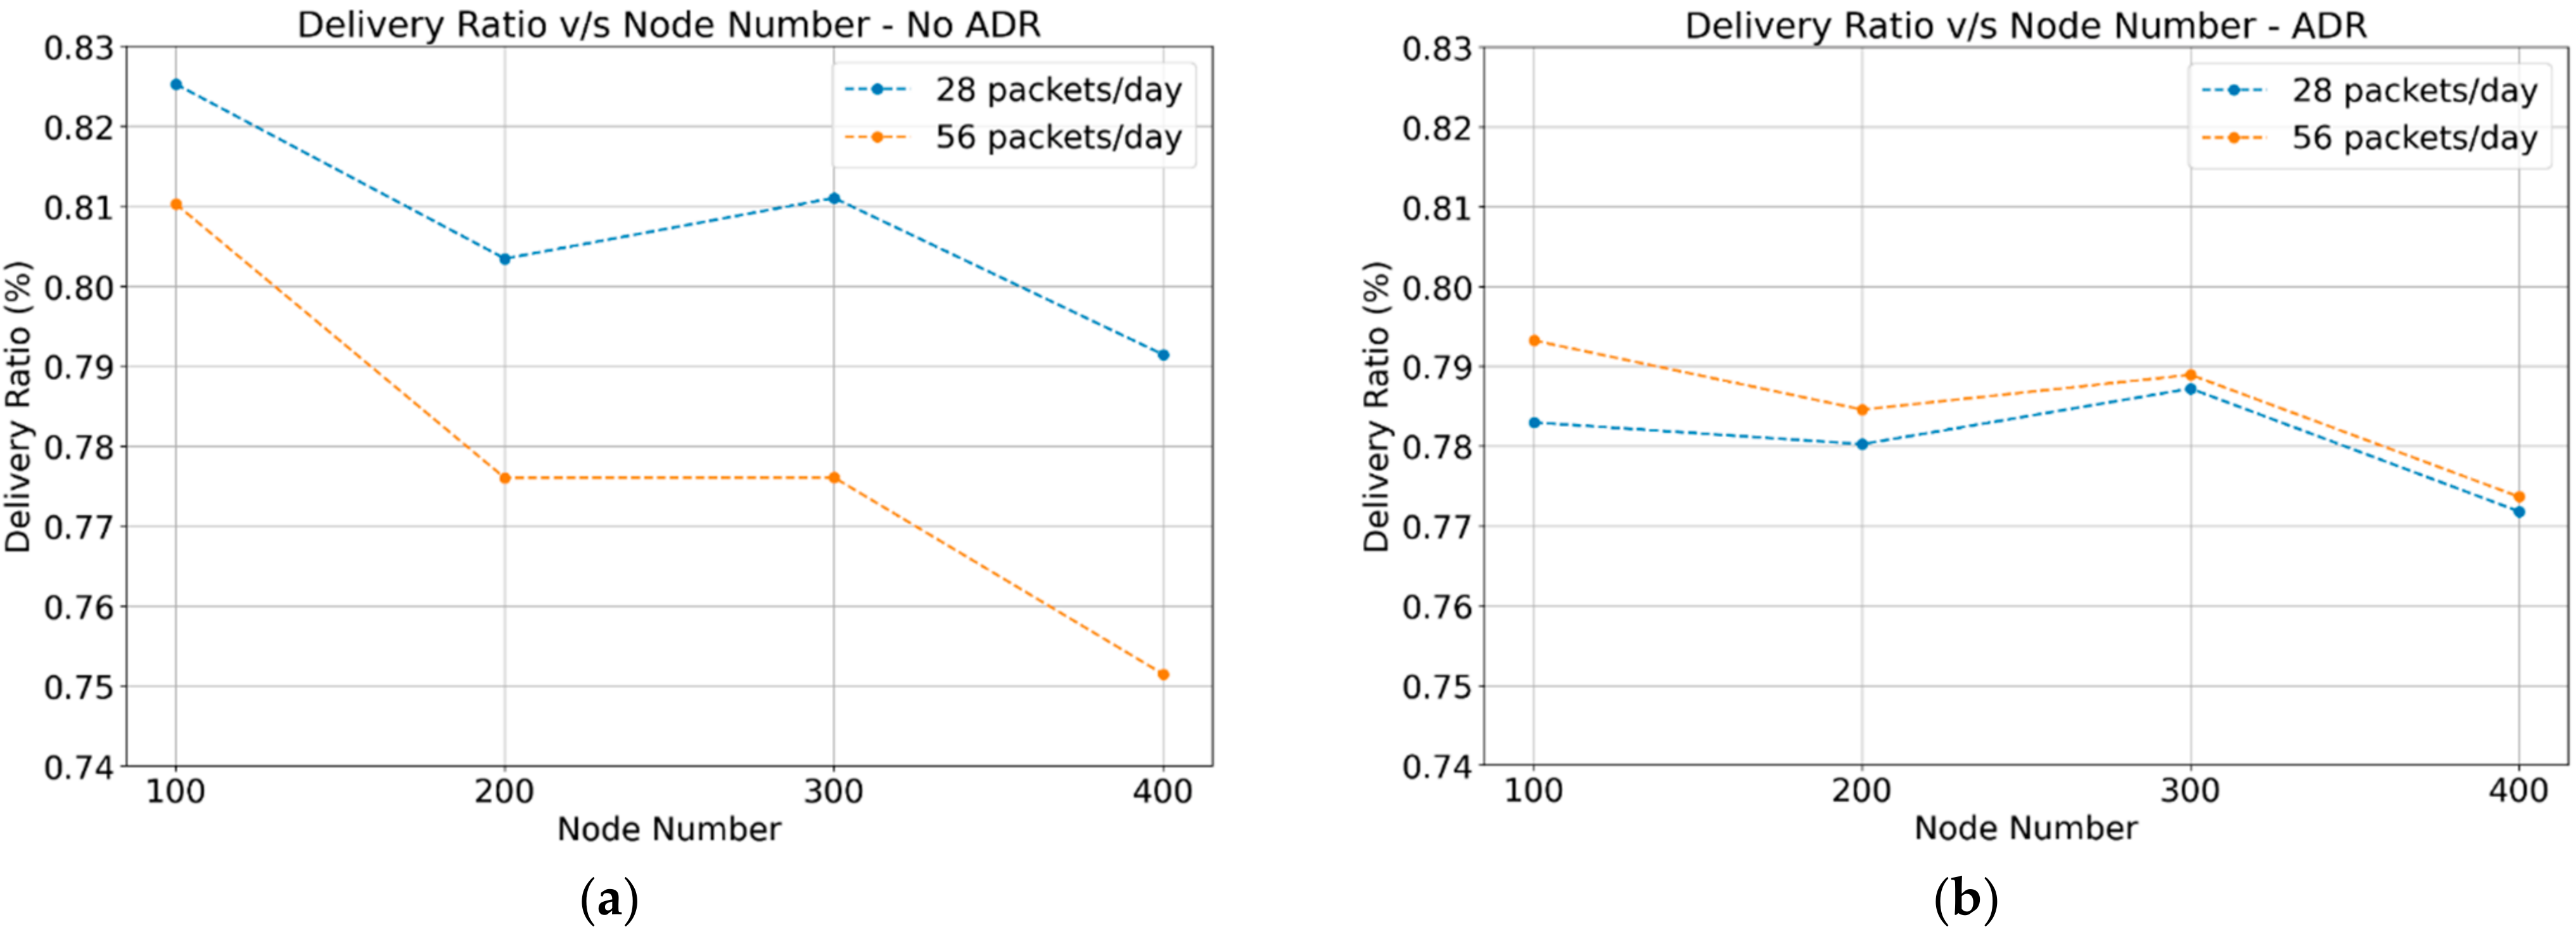
4.1.1. Delivery Ratio
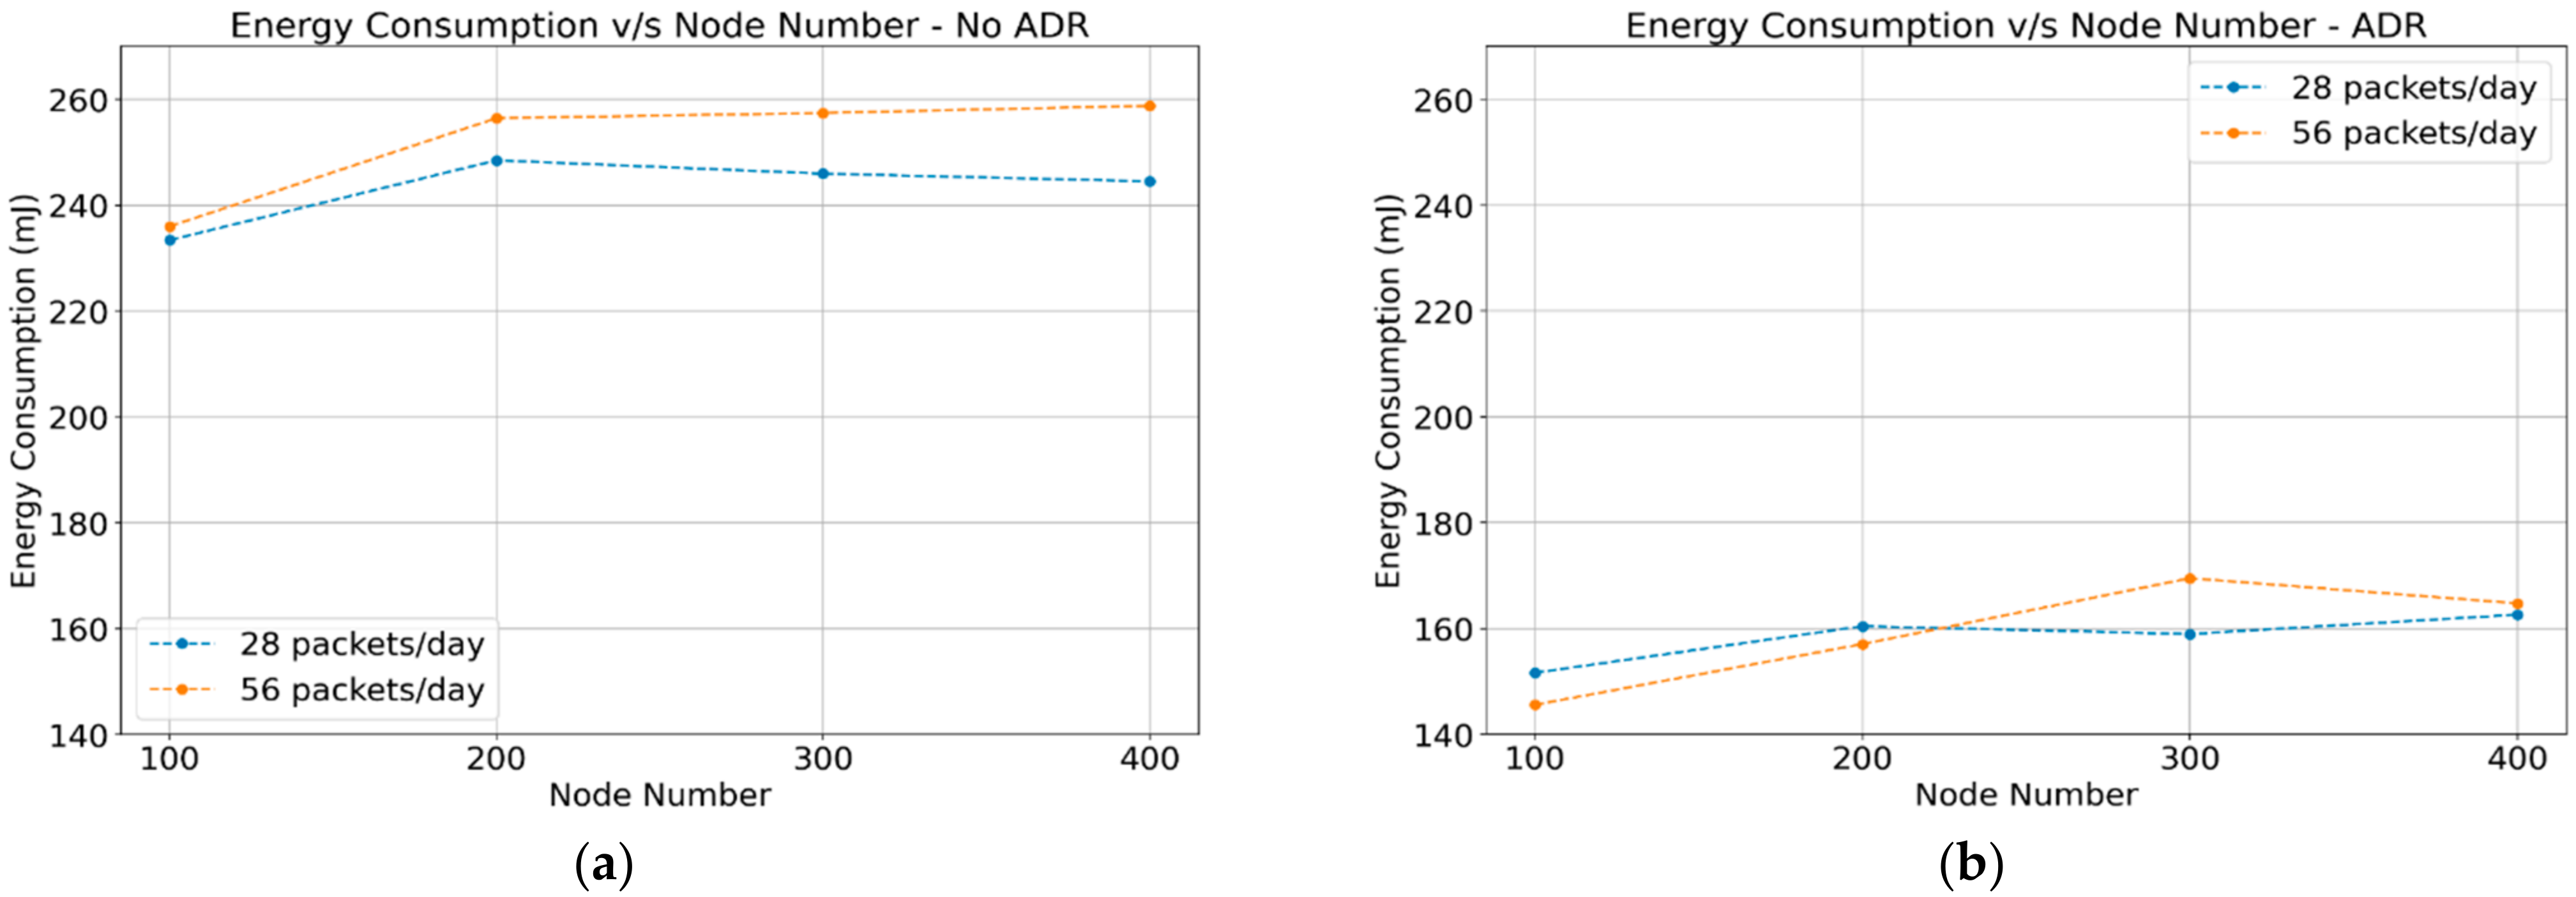
4.1.2. Energy Consumption
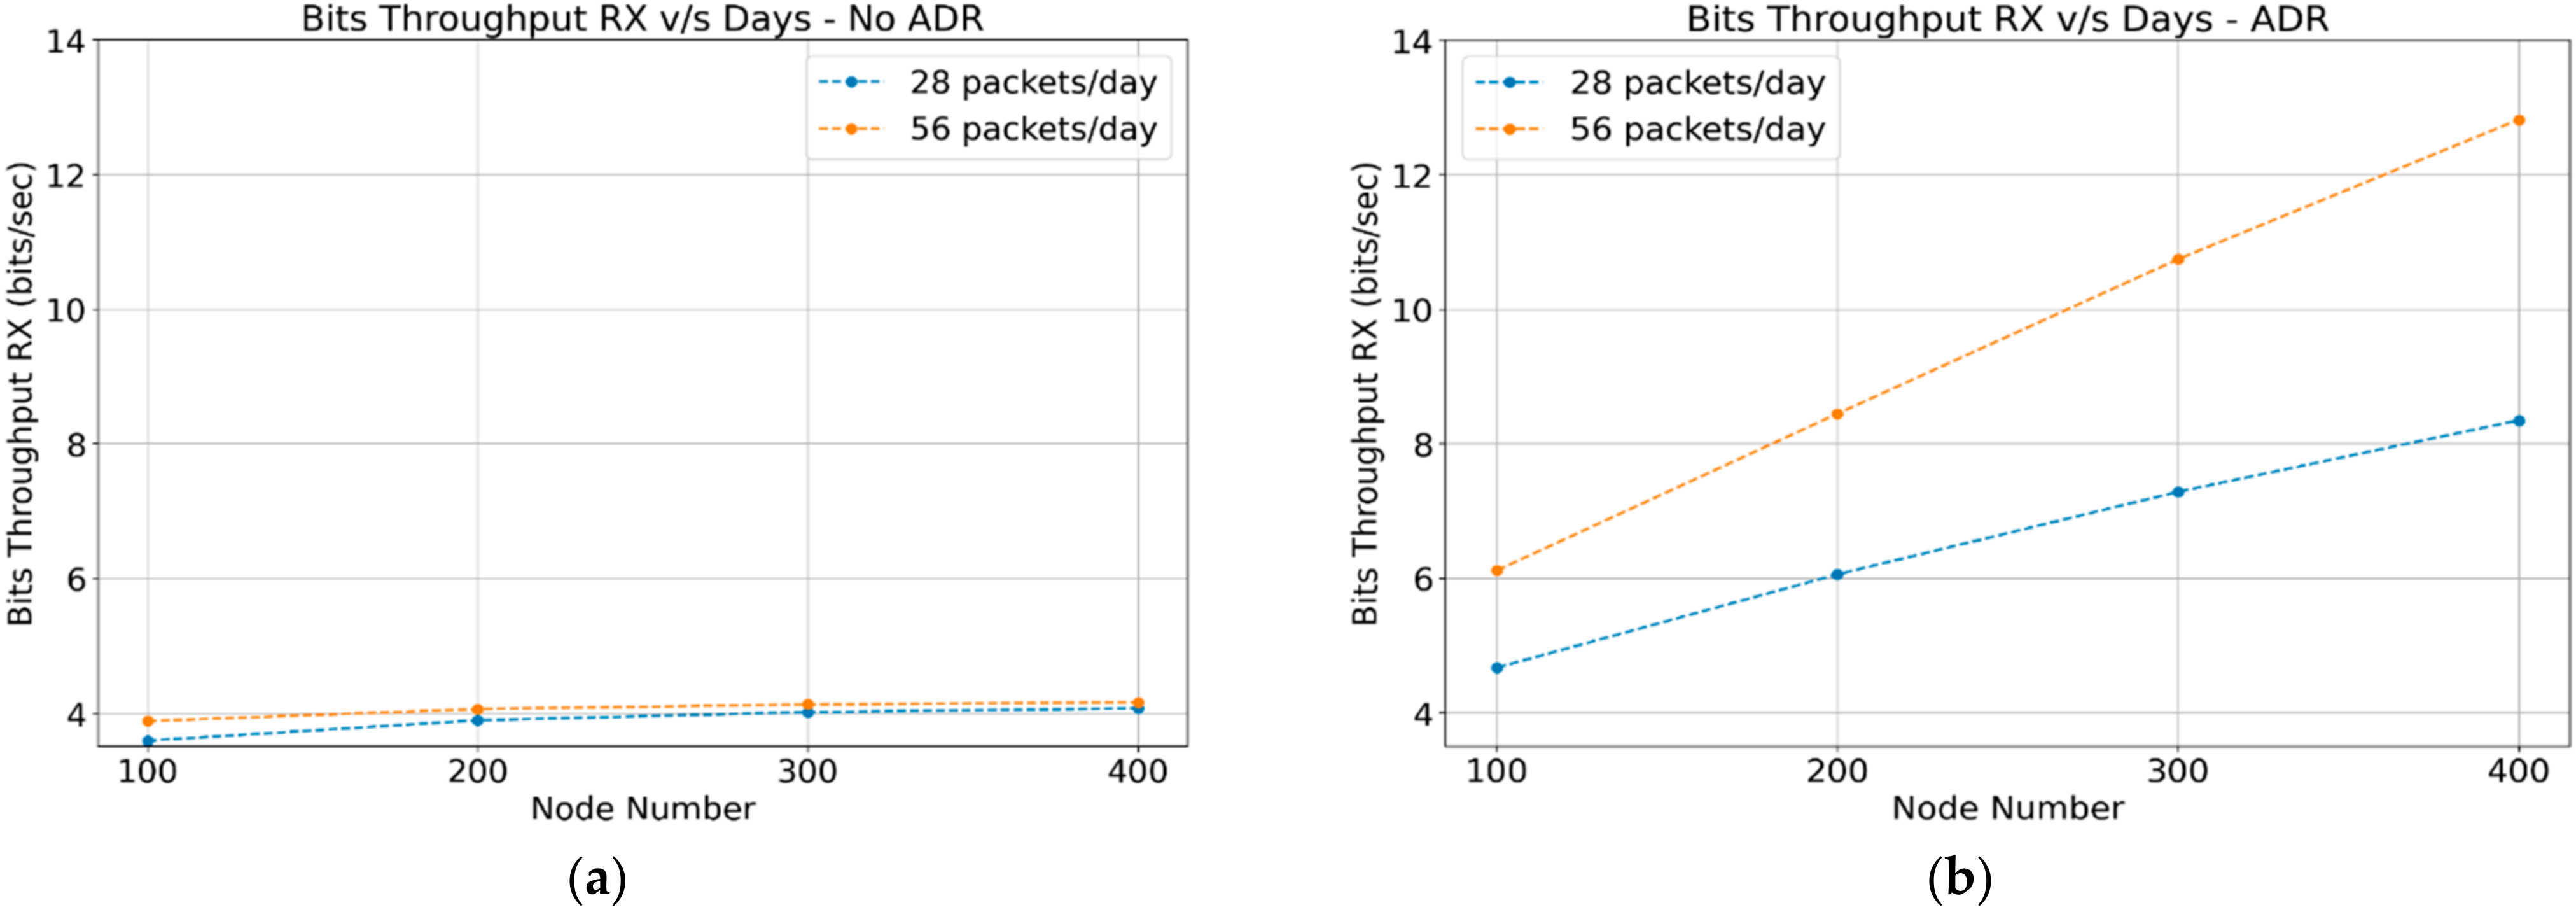
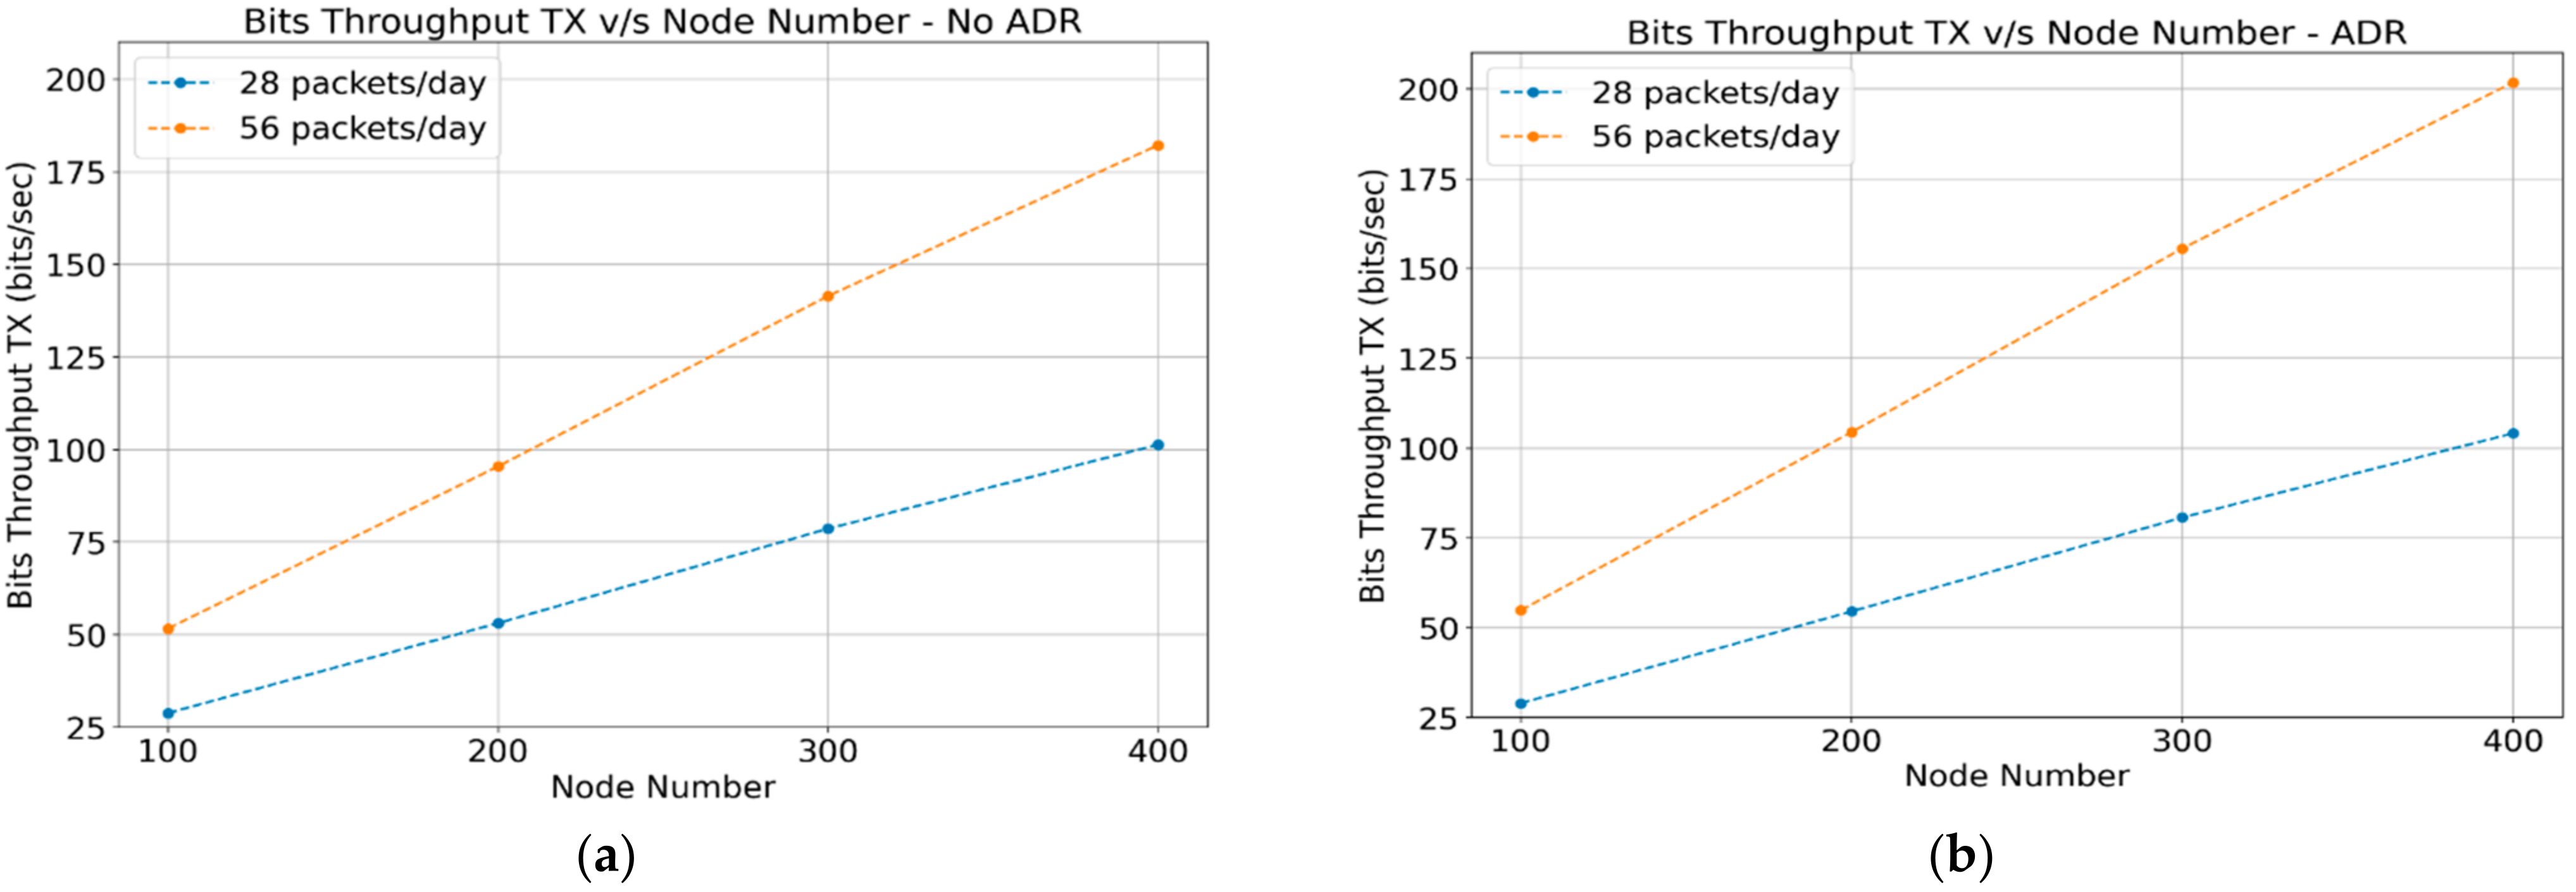
4.1.3. Throughput
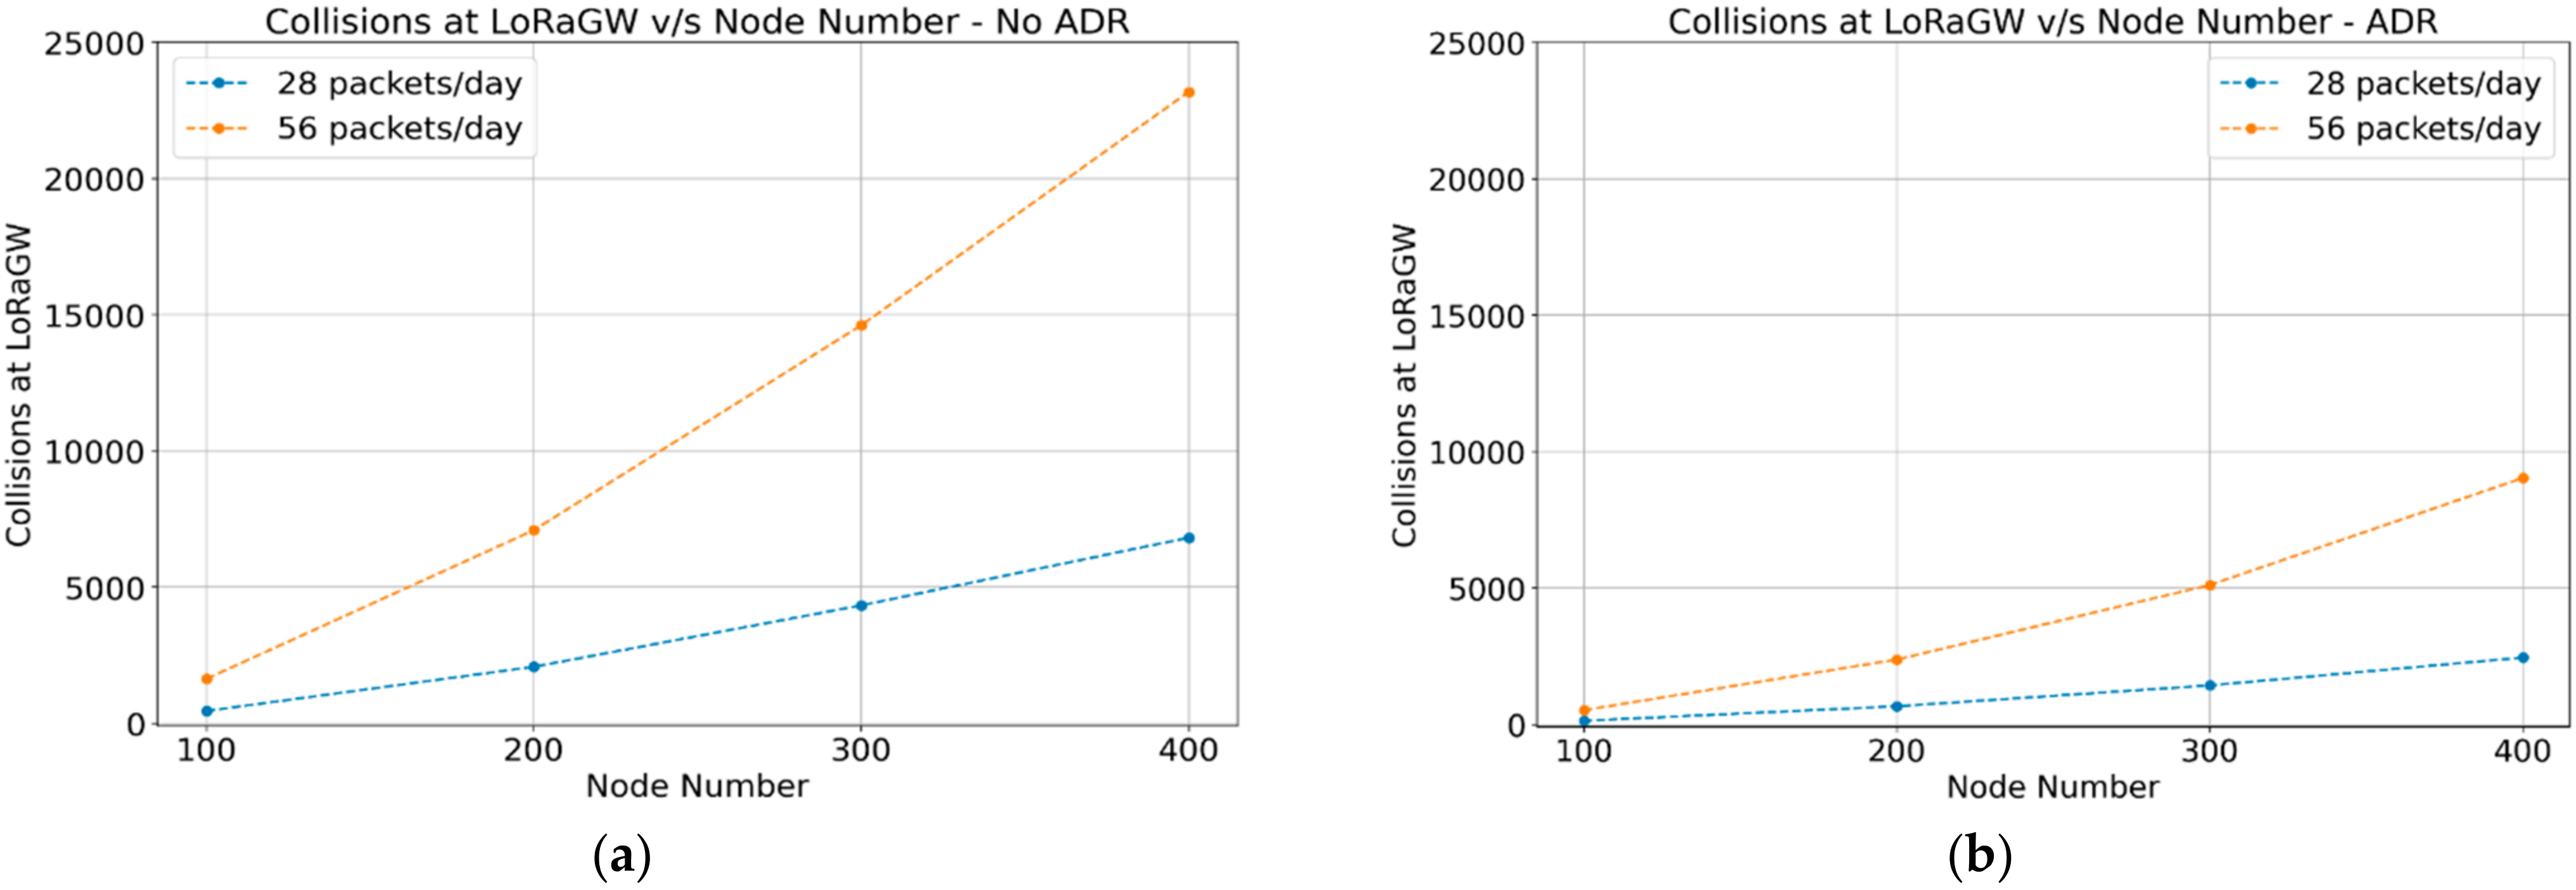
4.1.4. Collisions
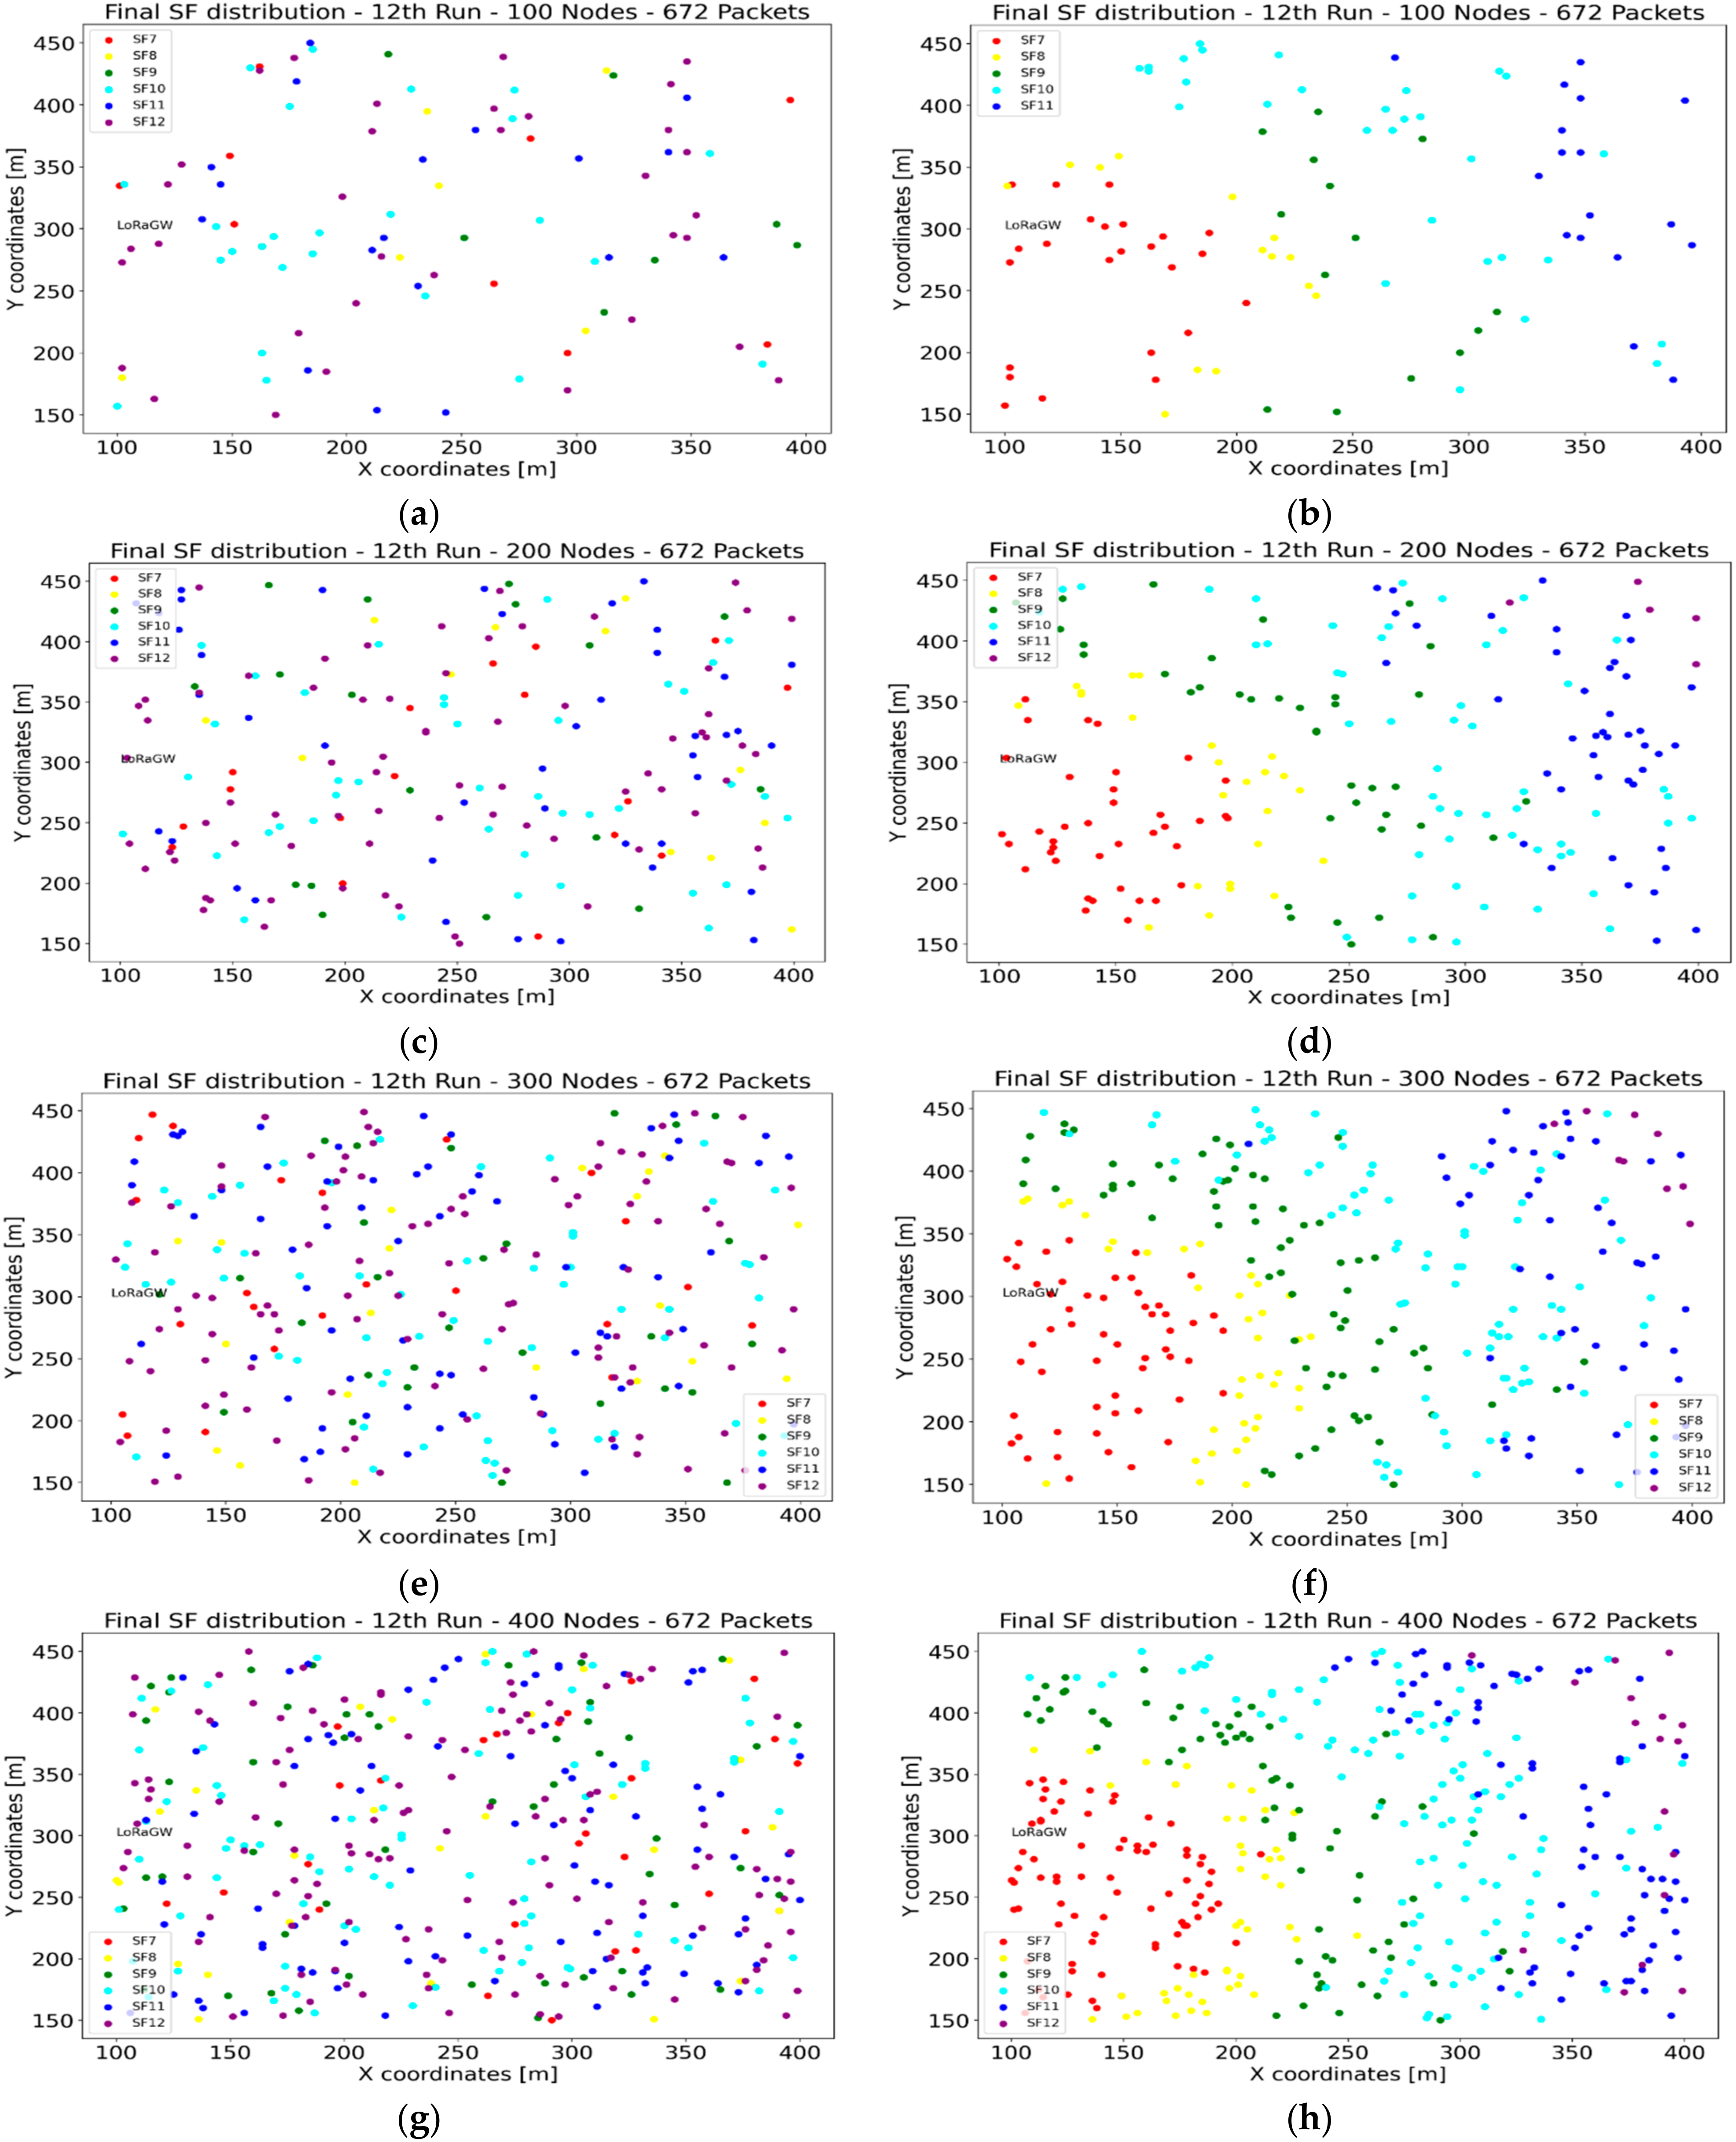
4.1.5. SF Distribution
4.1.6. Discussion
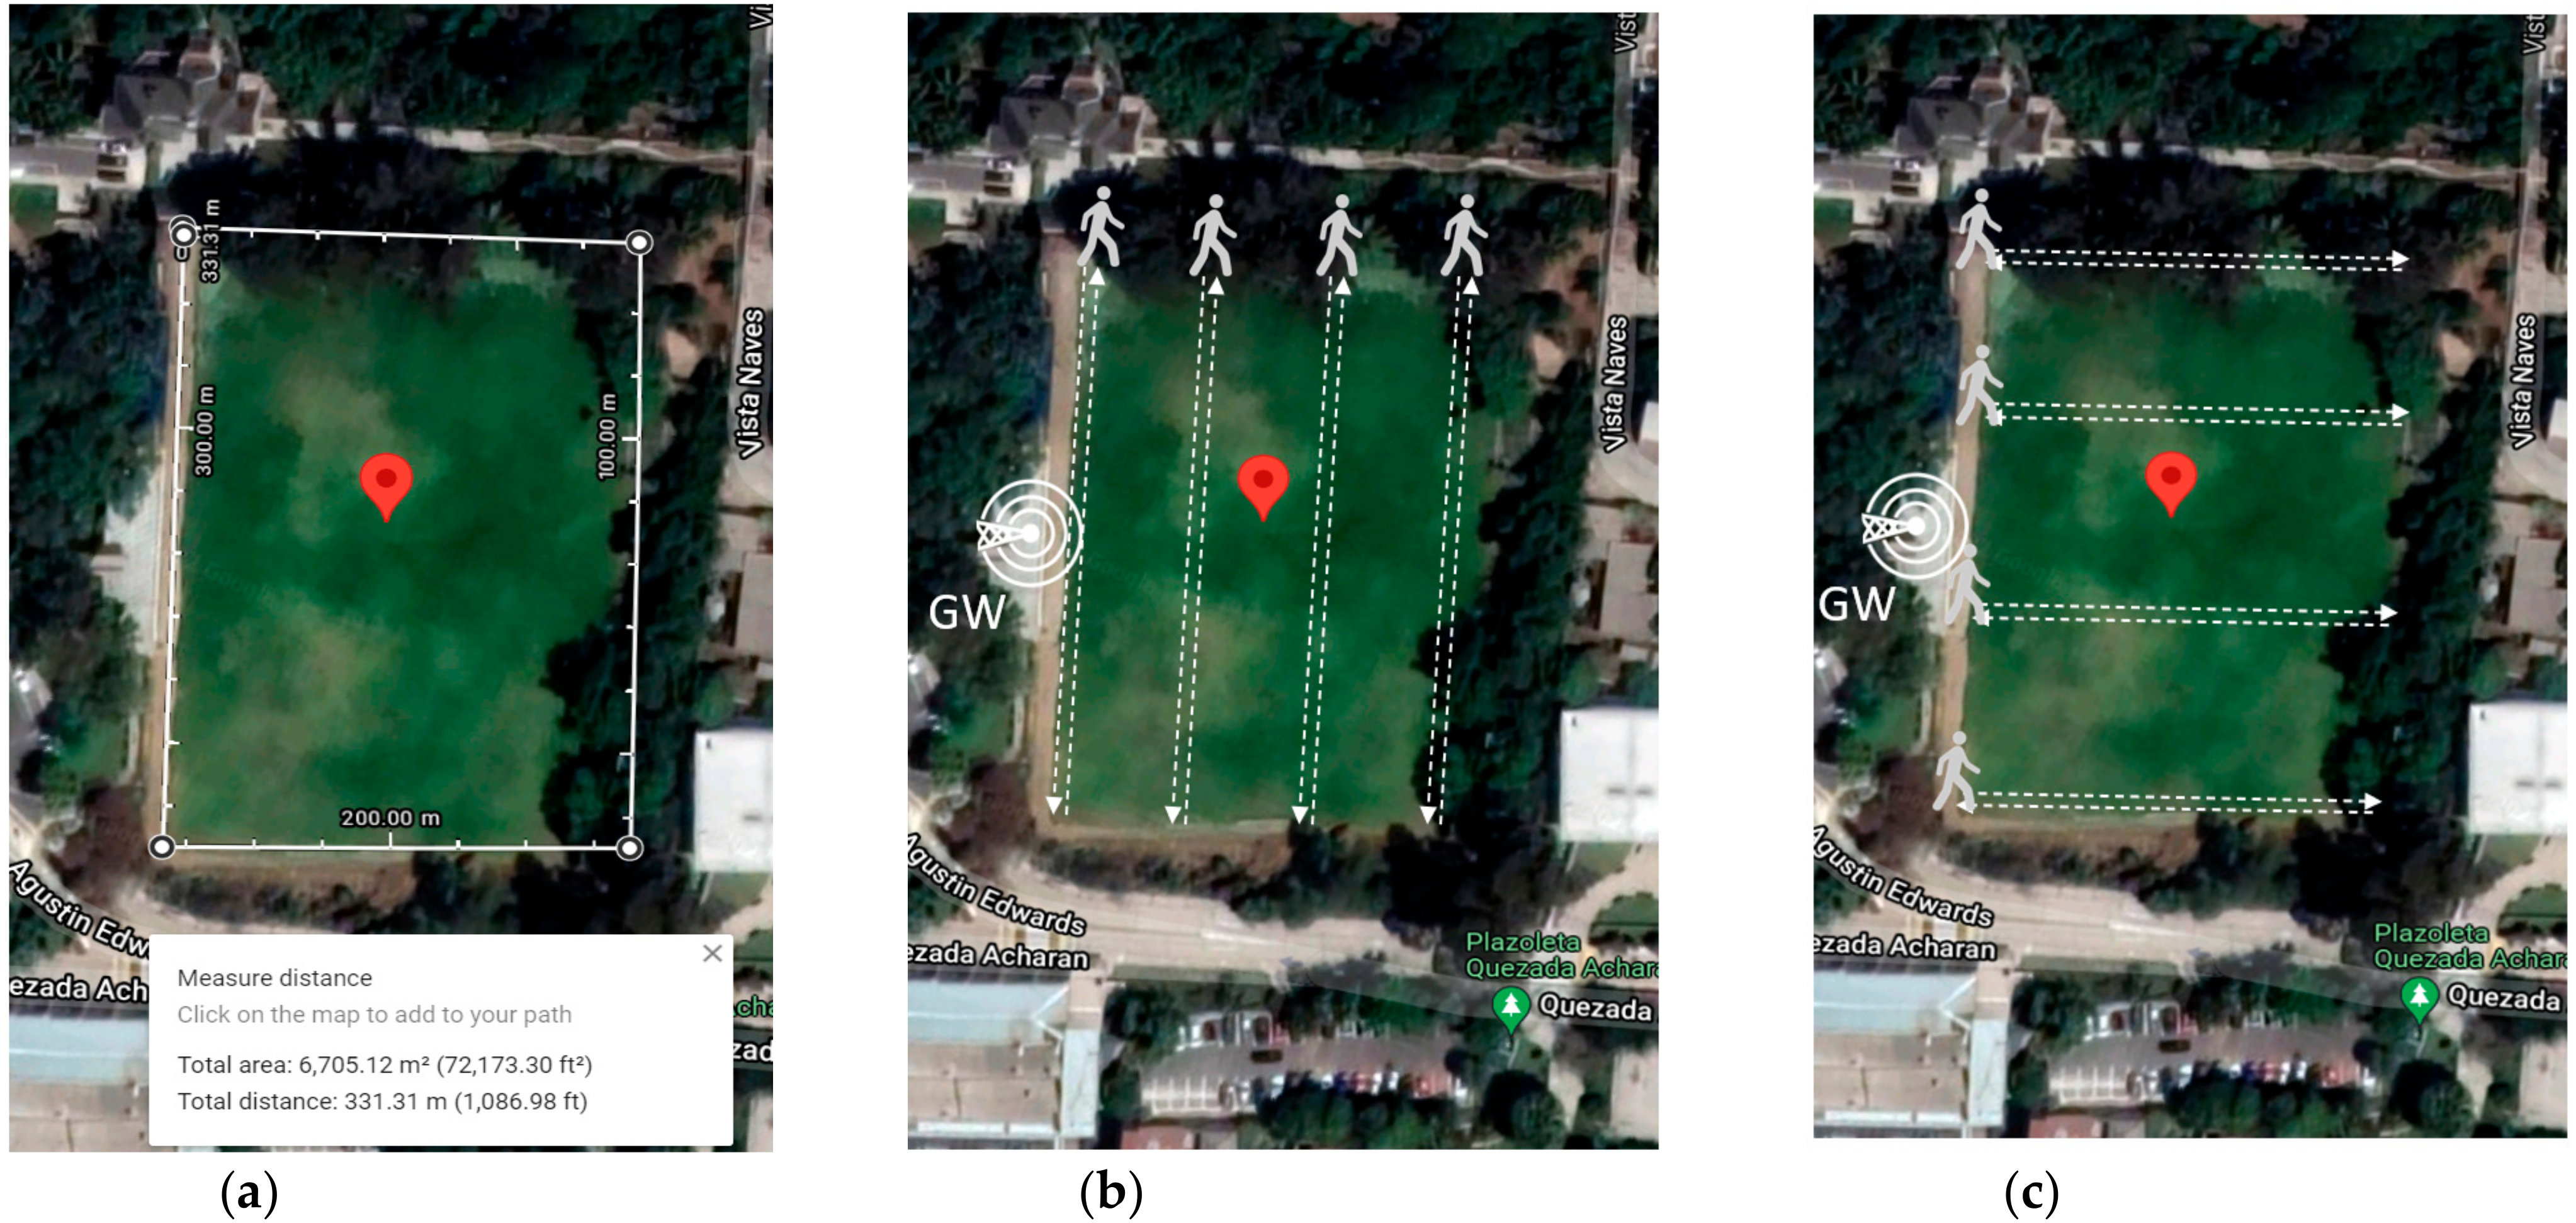
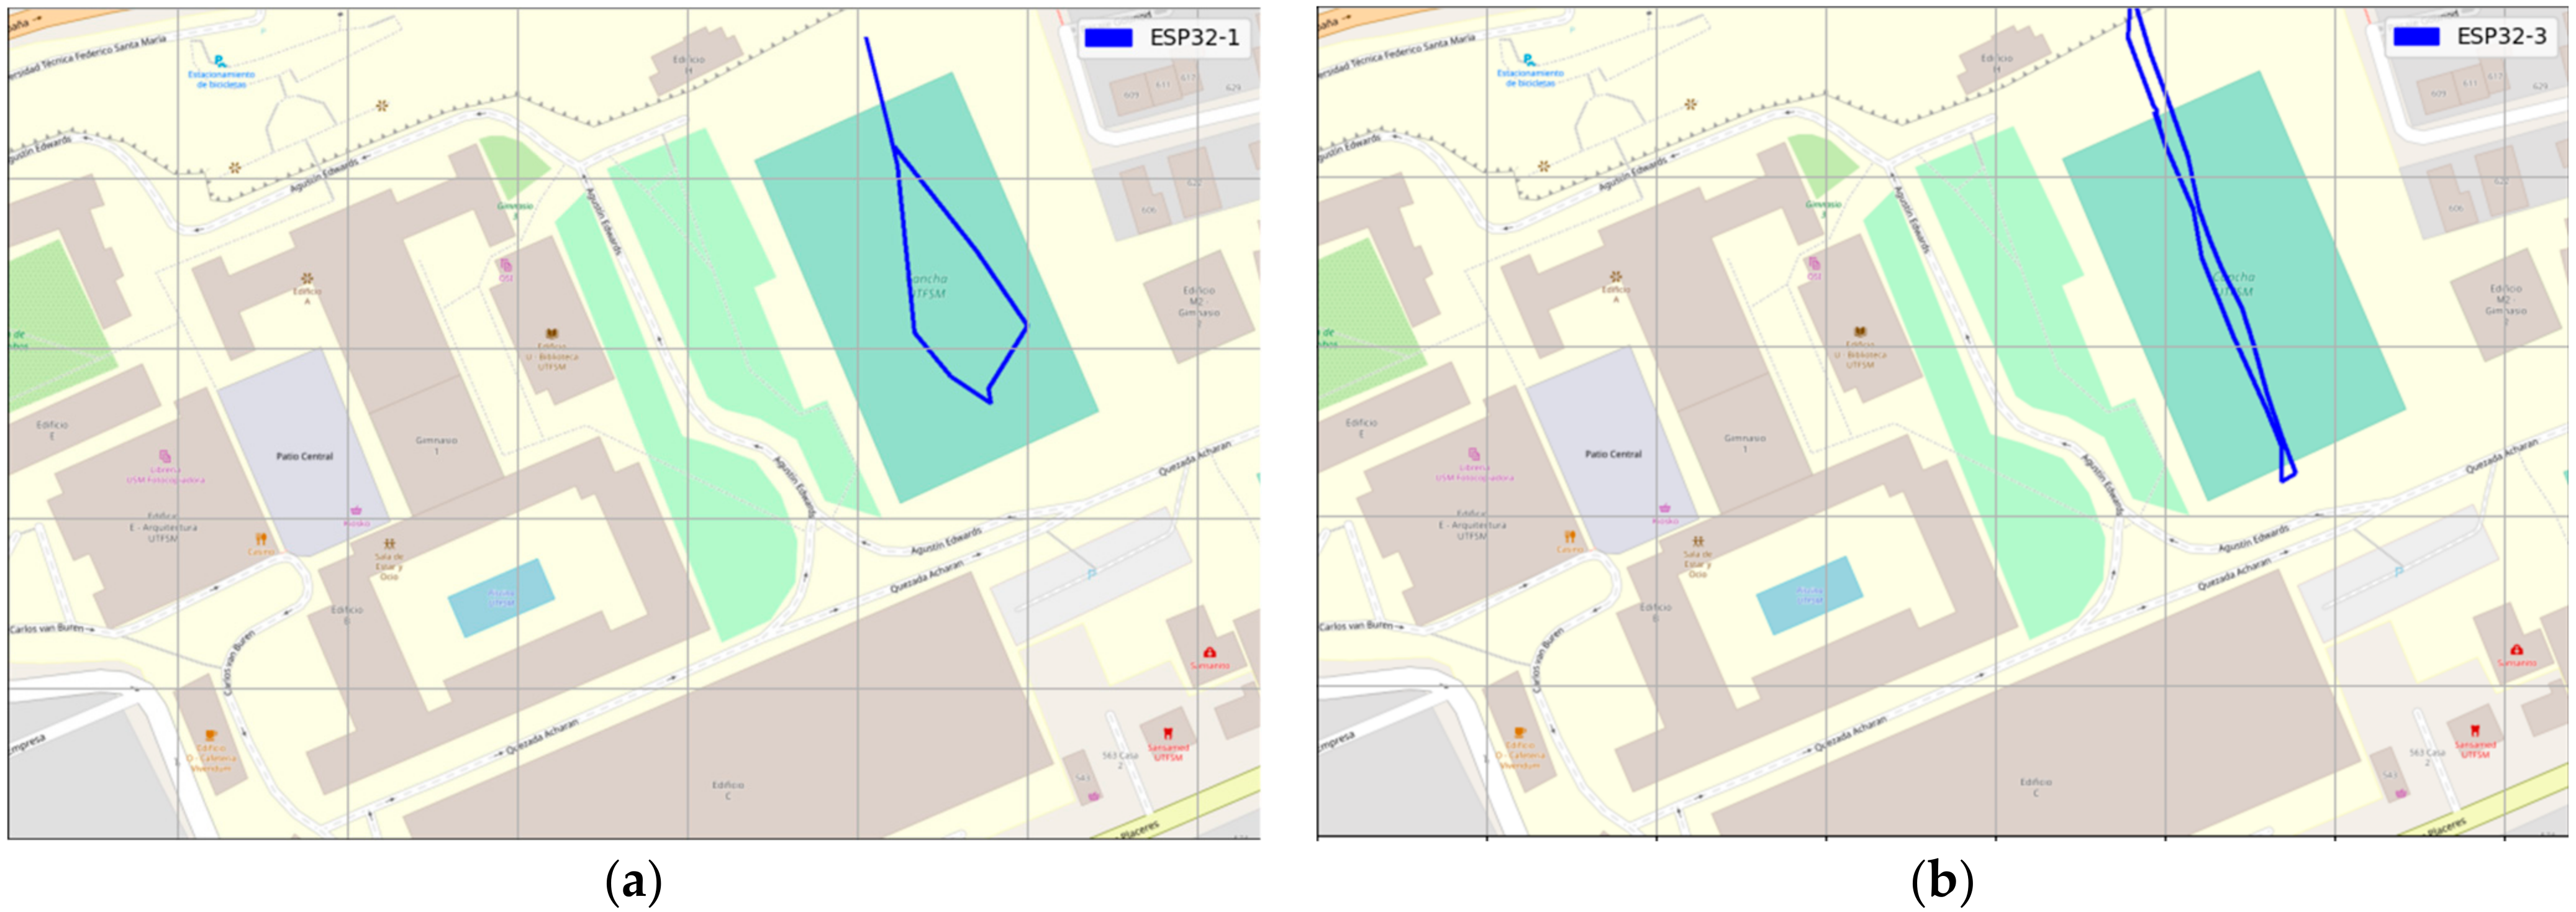
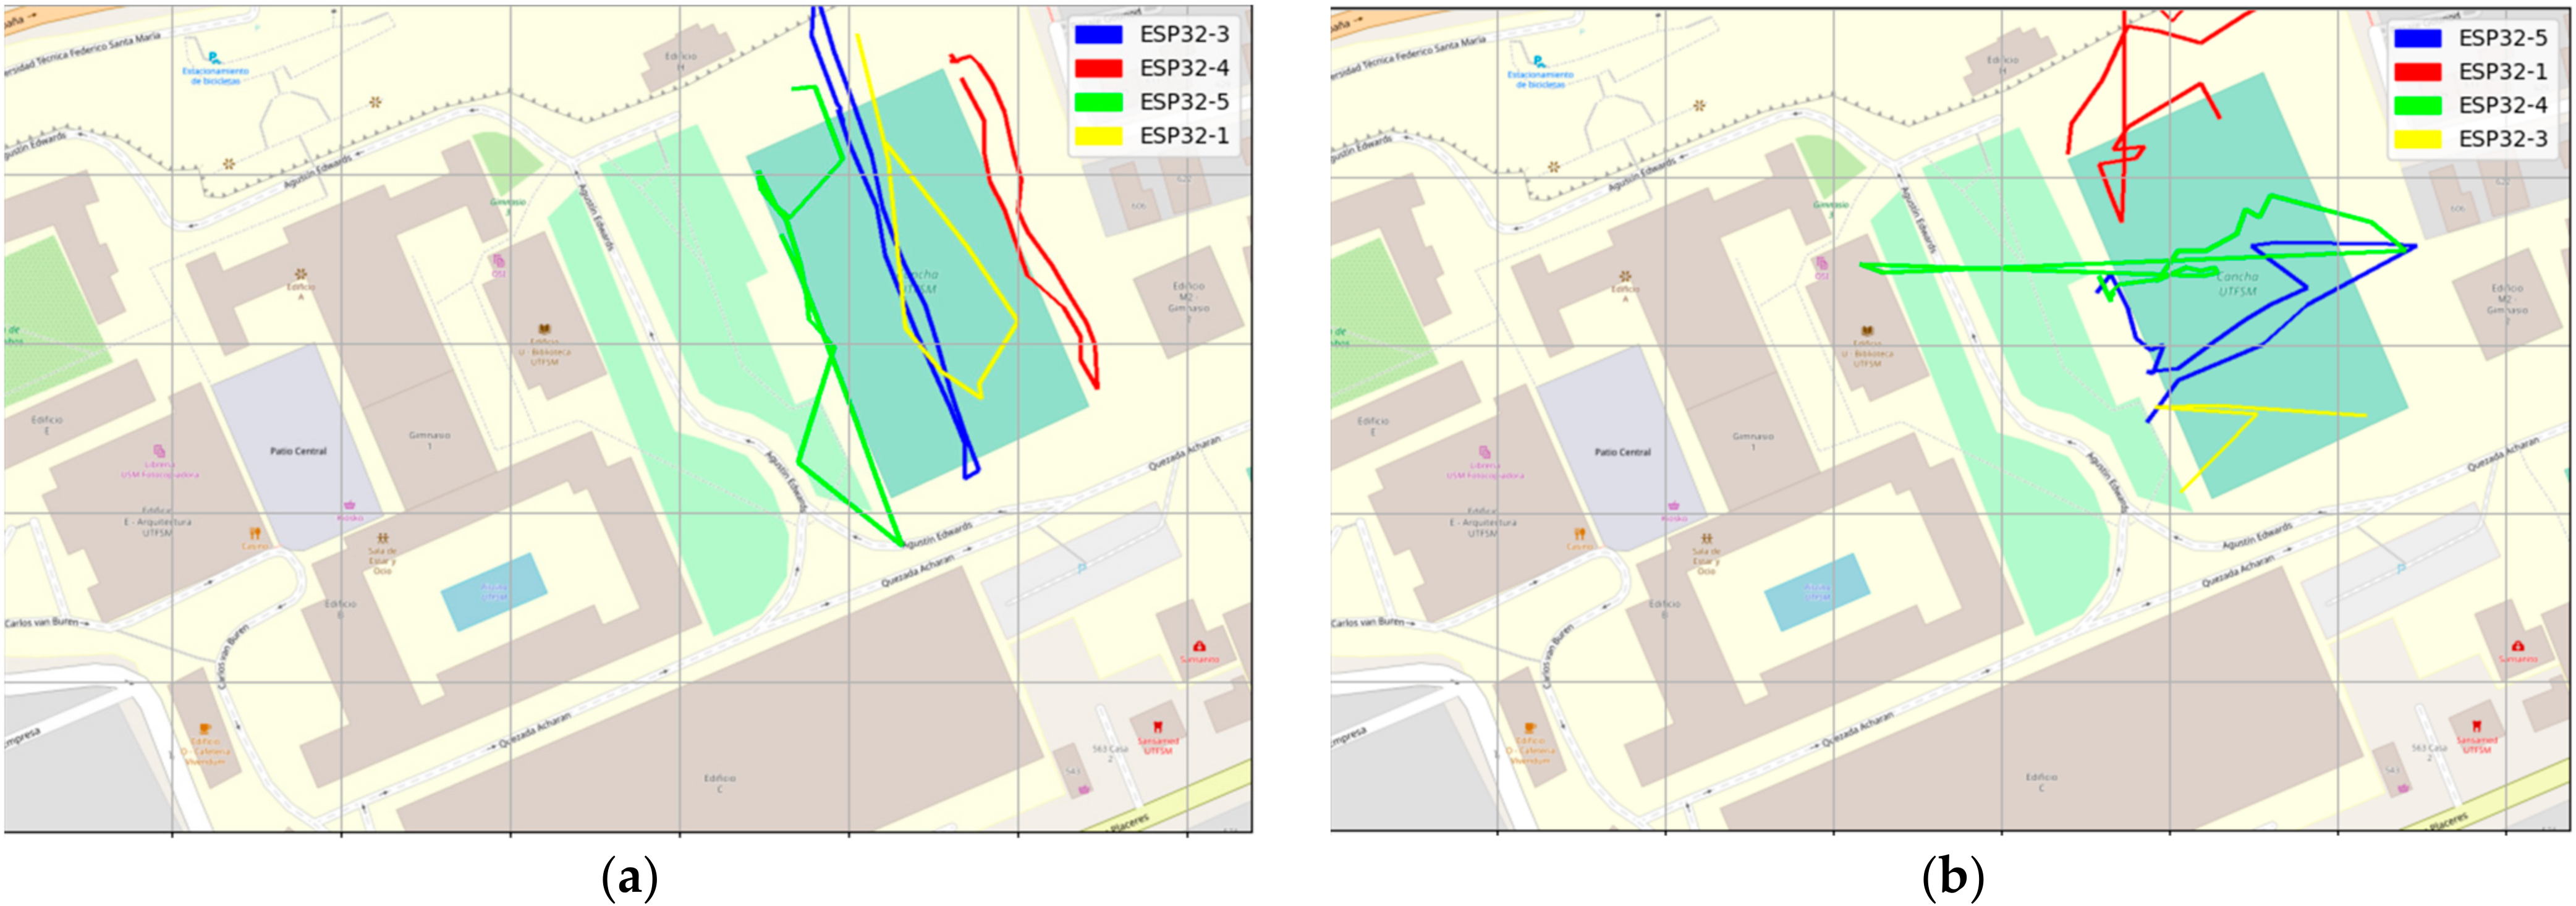
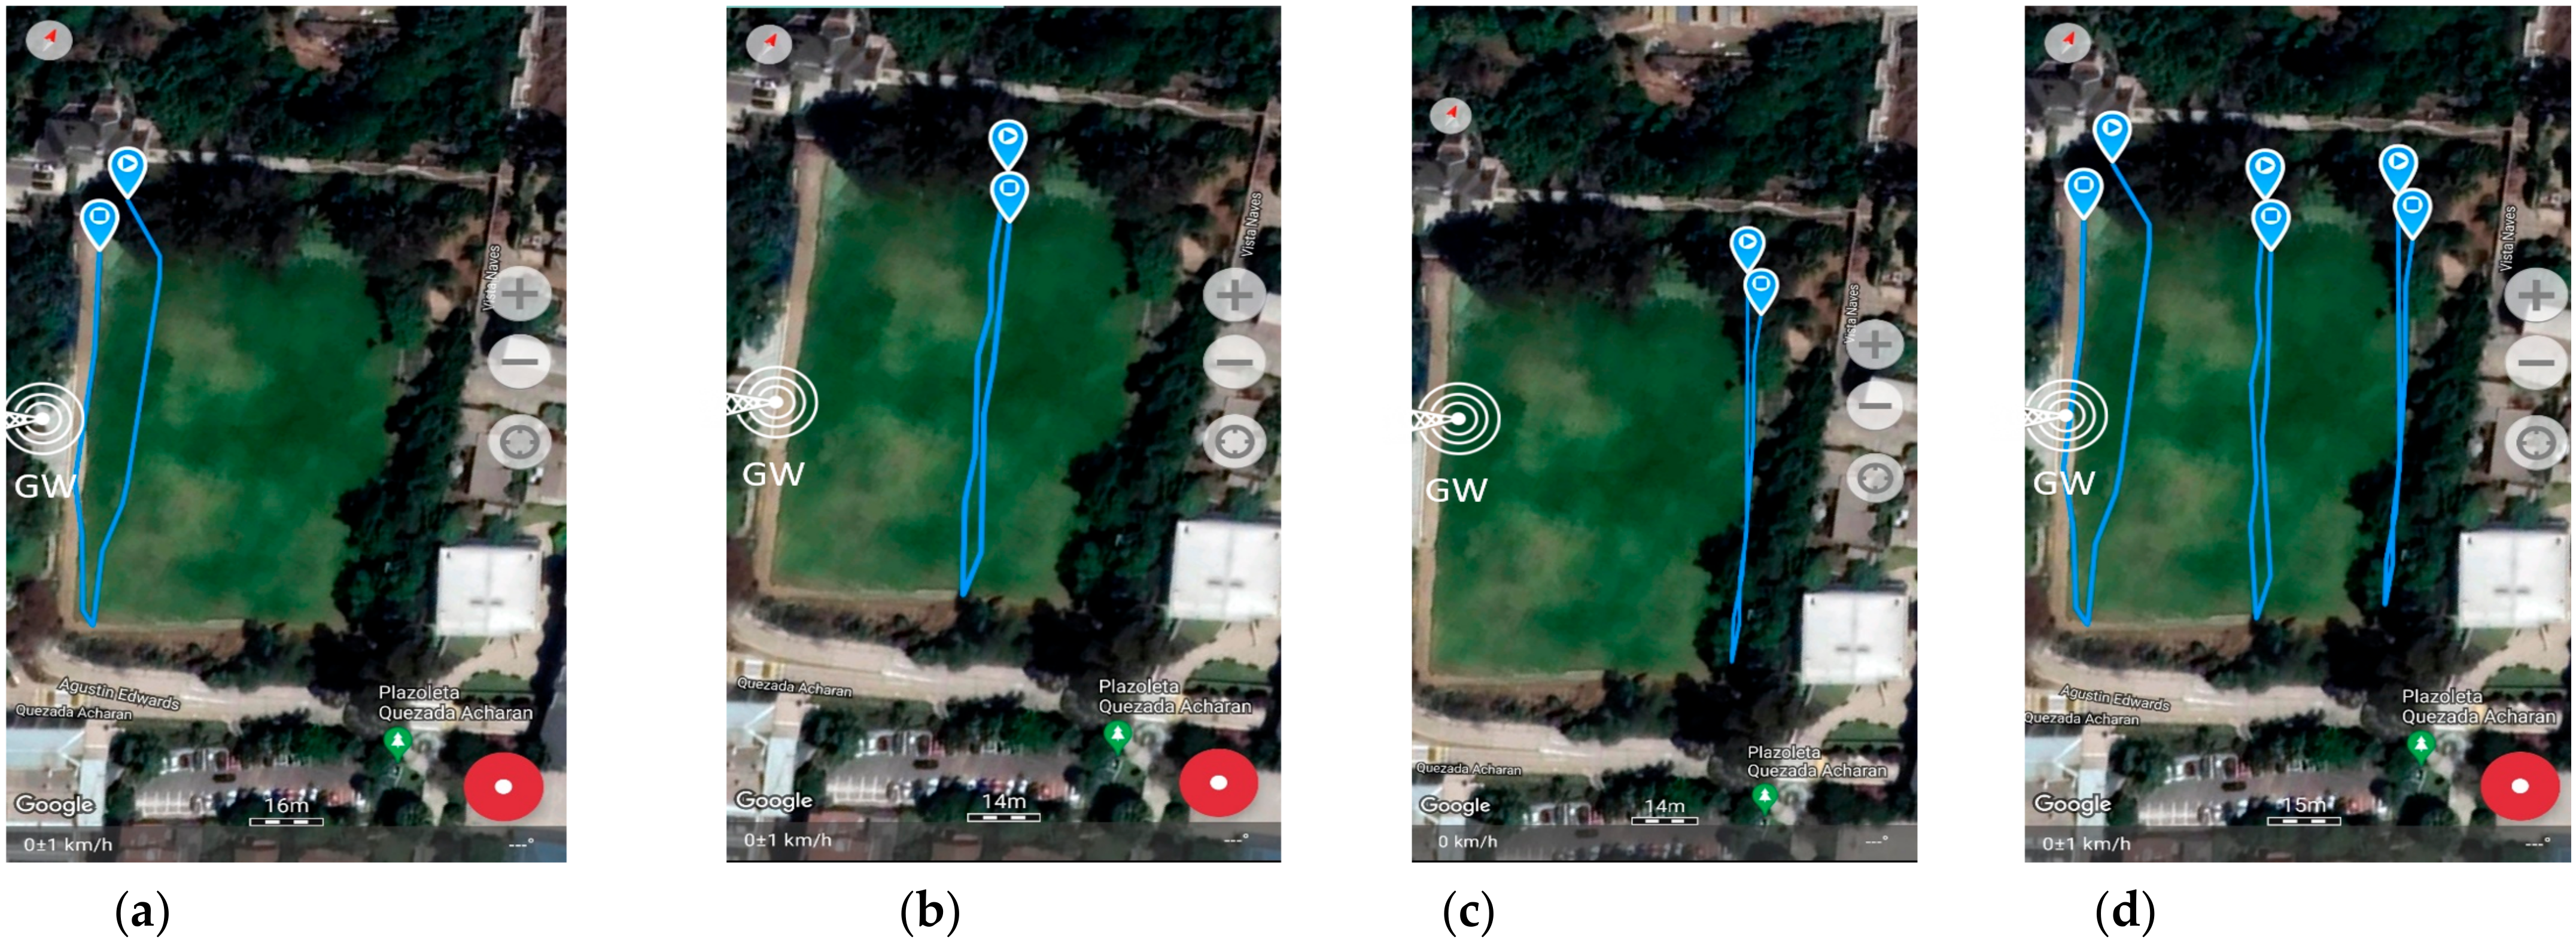
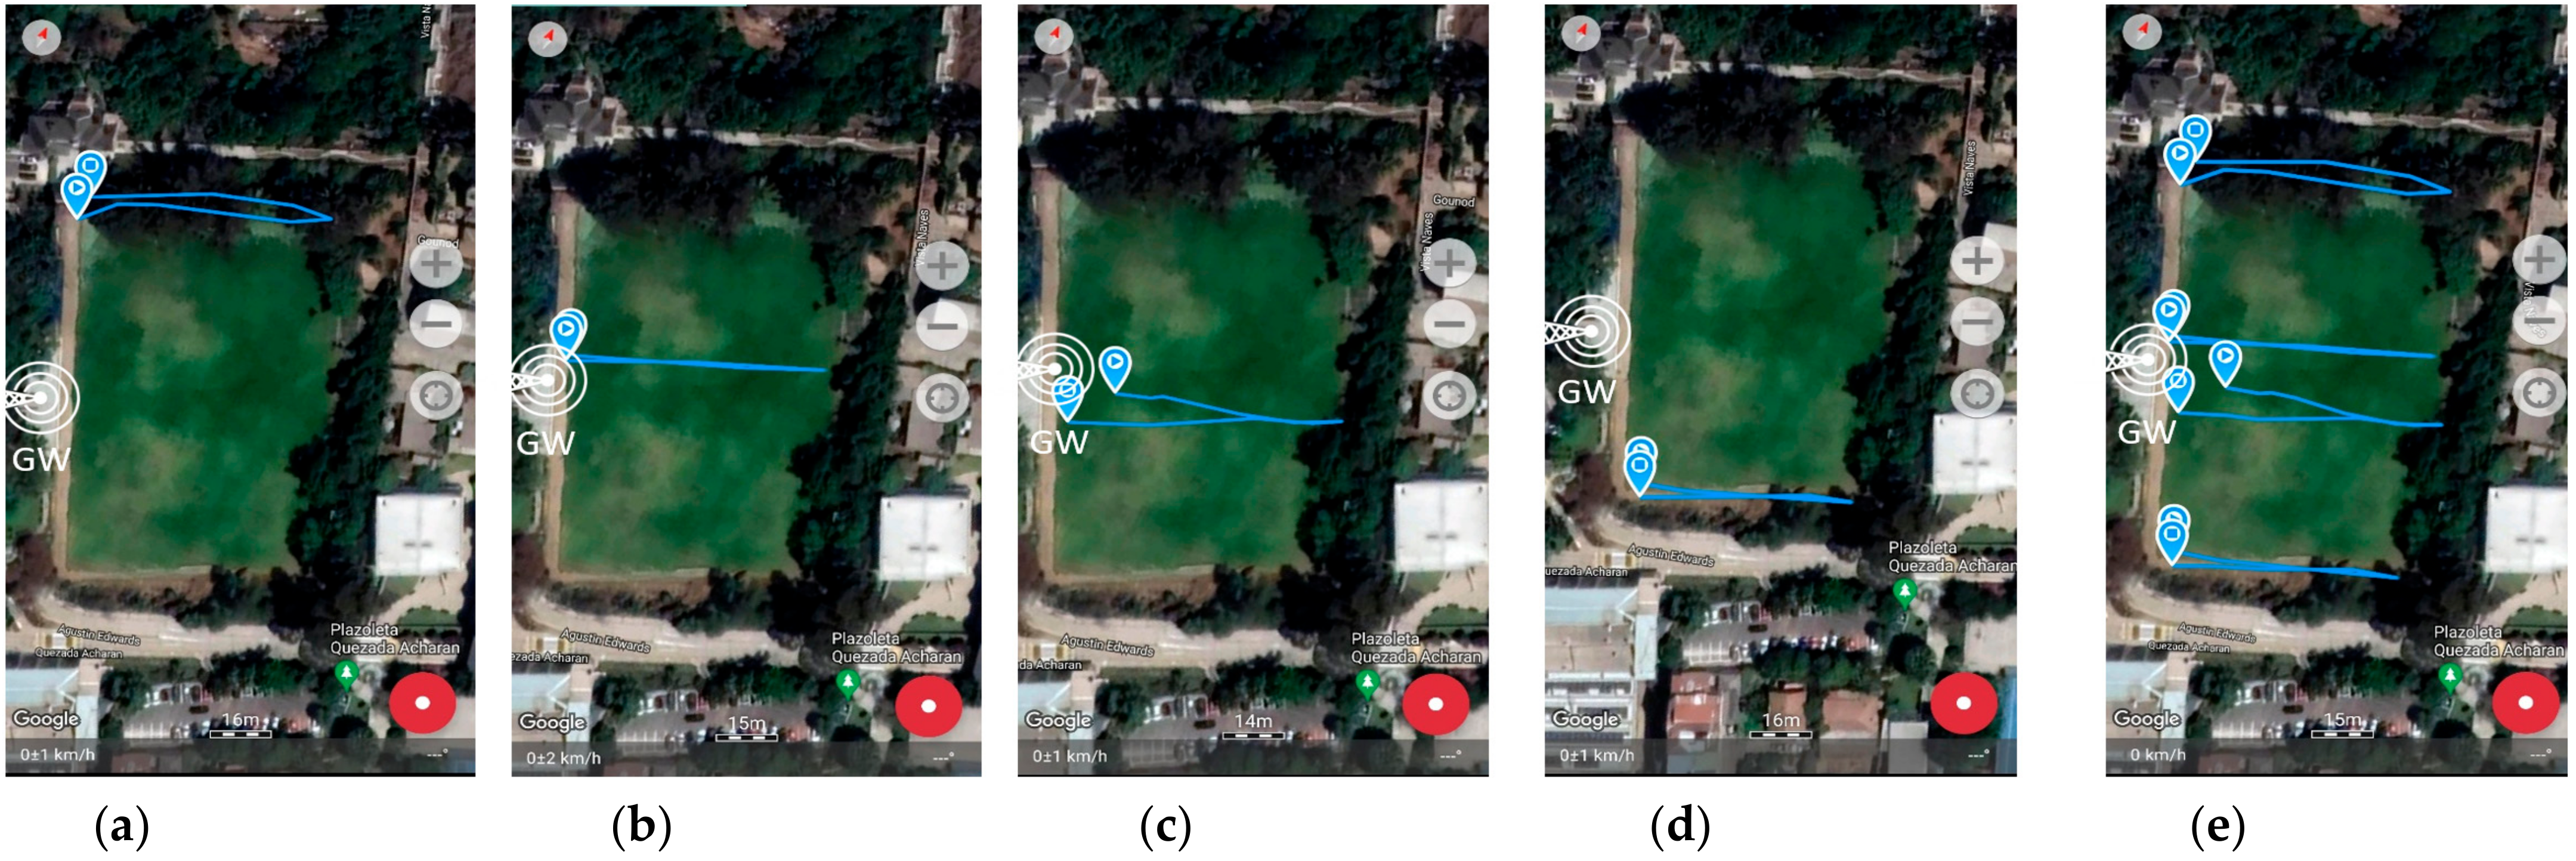
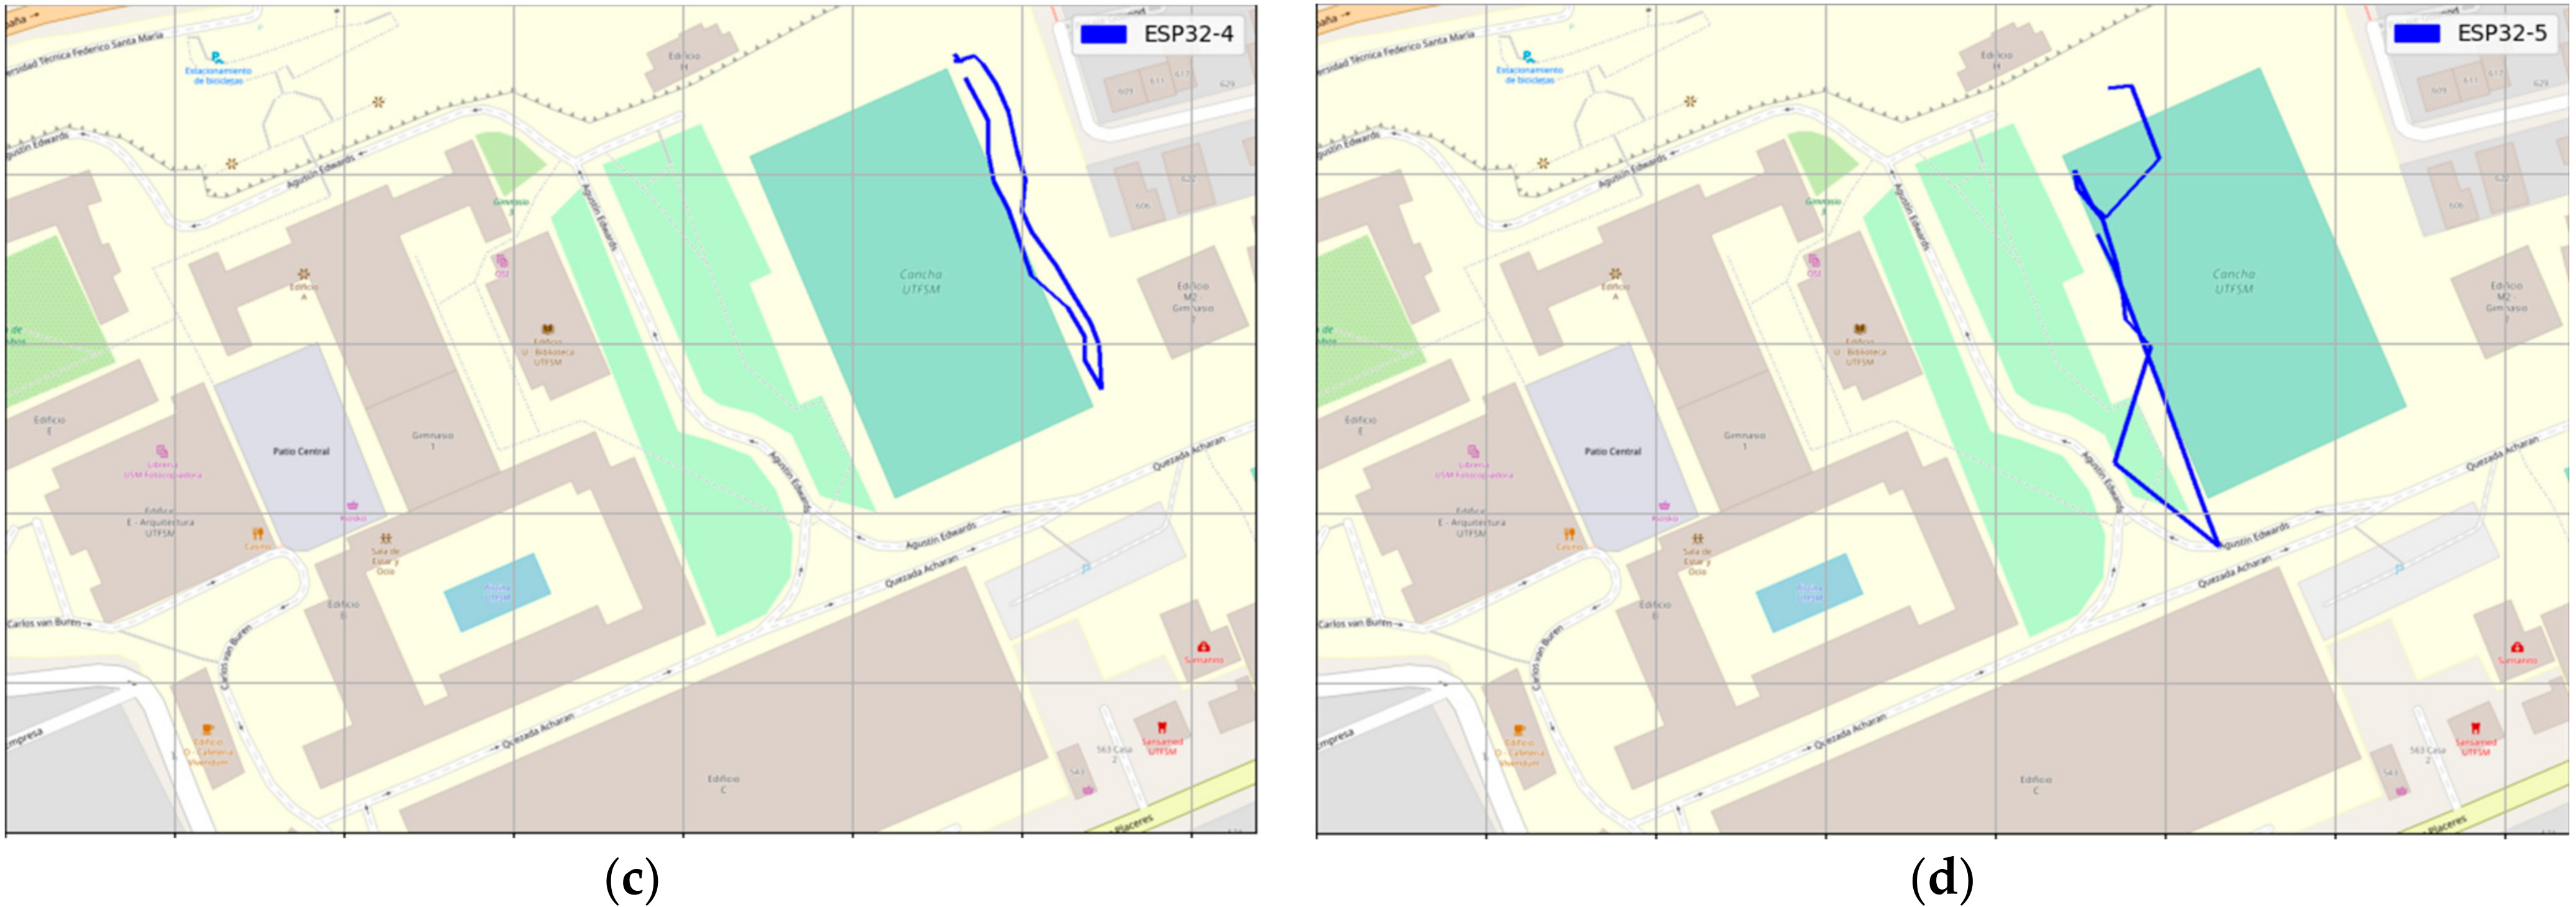
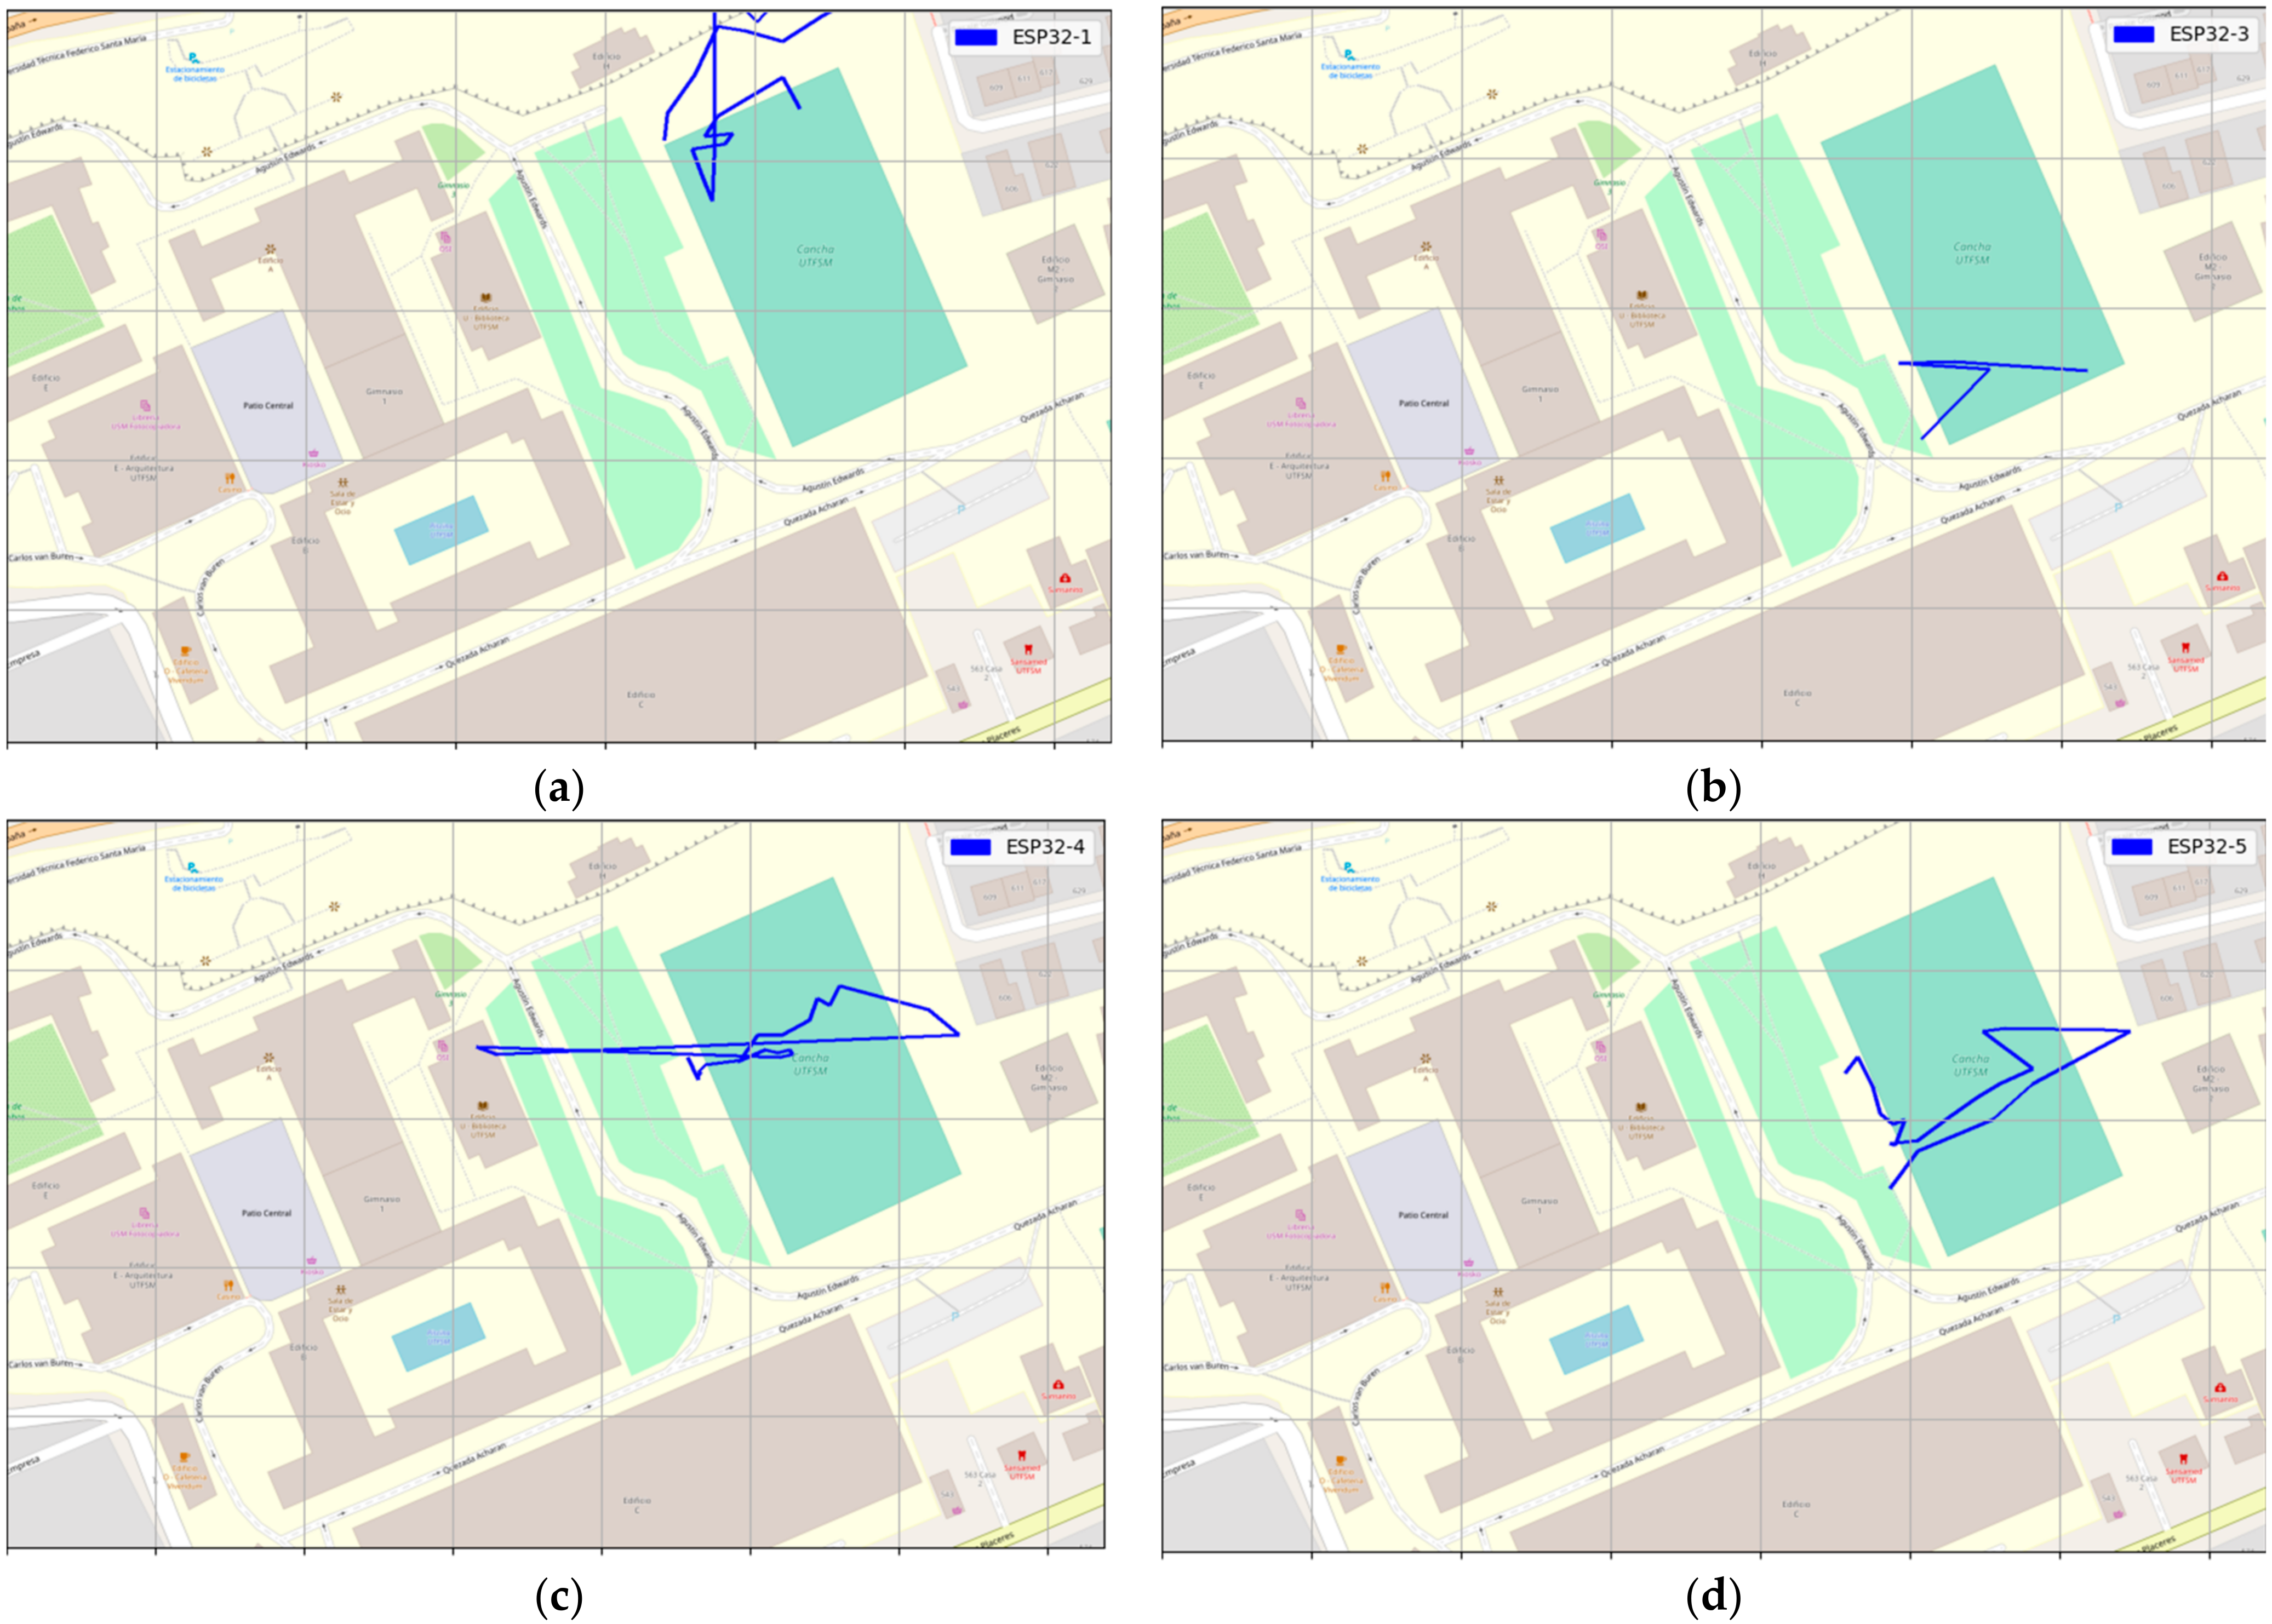
4.2. Localization Results
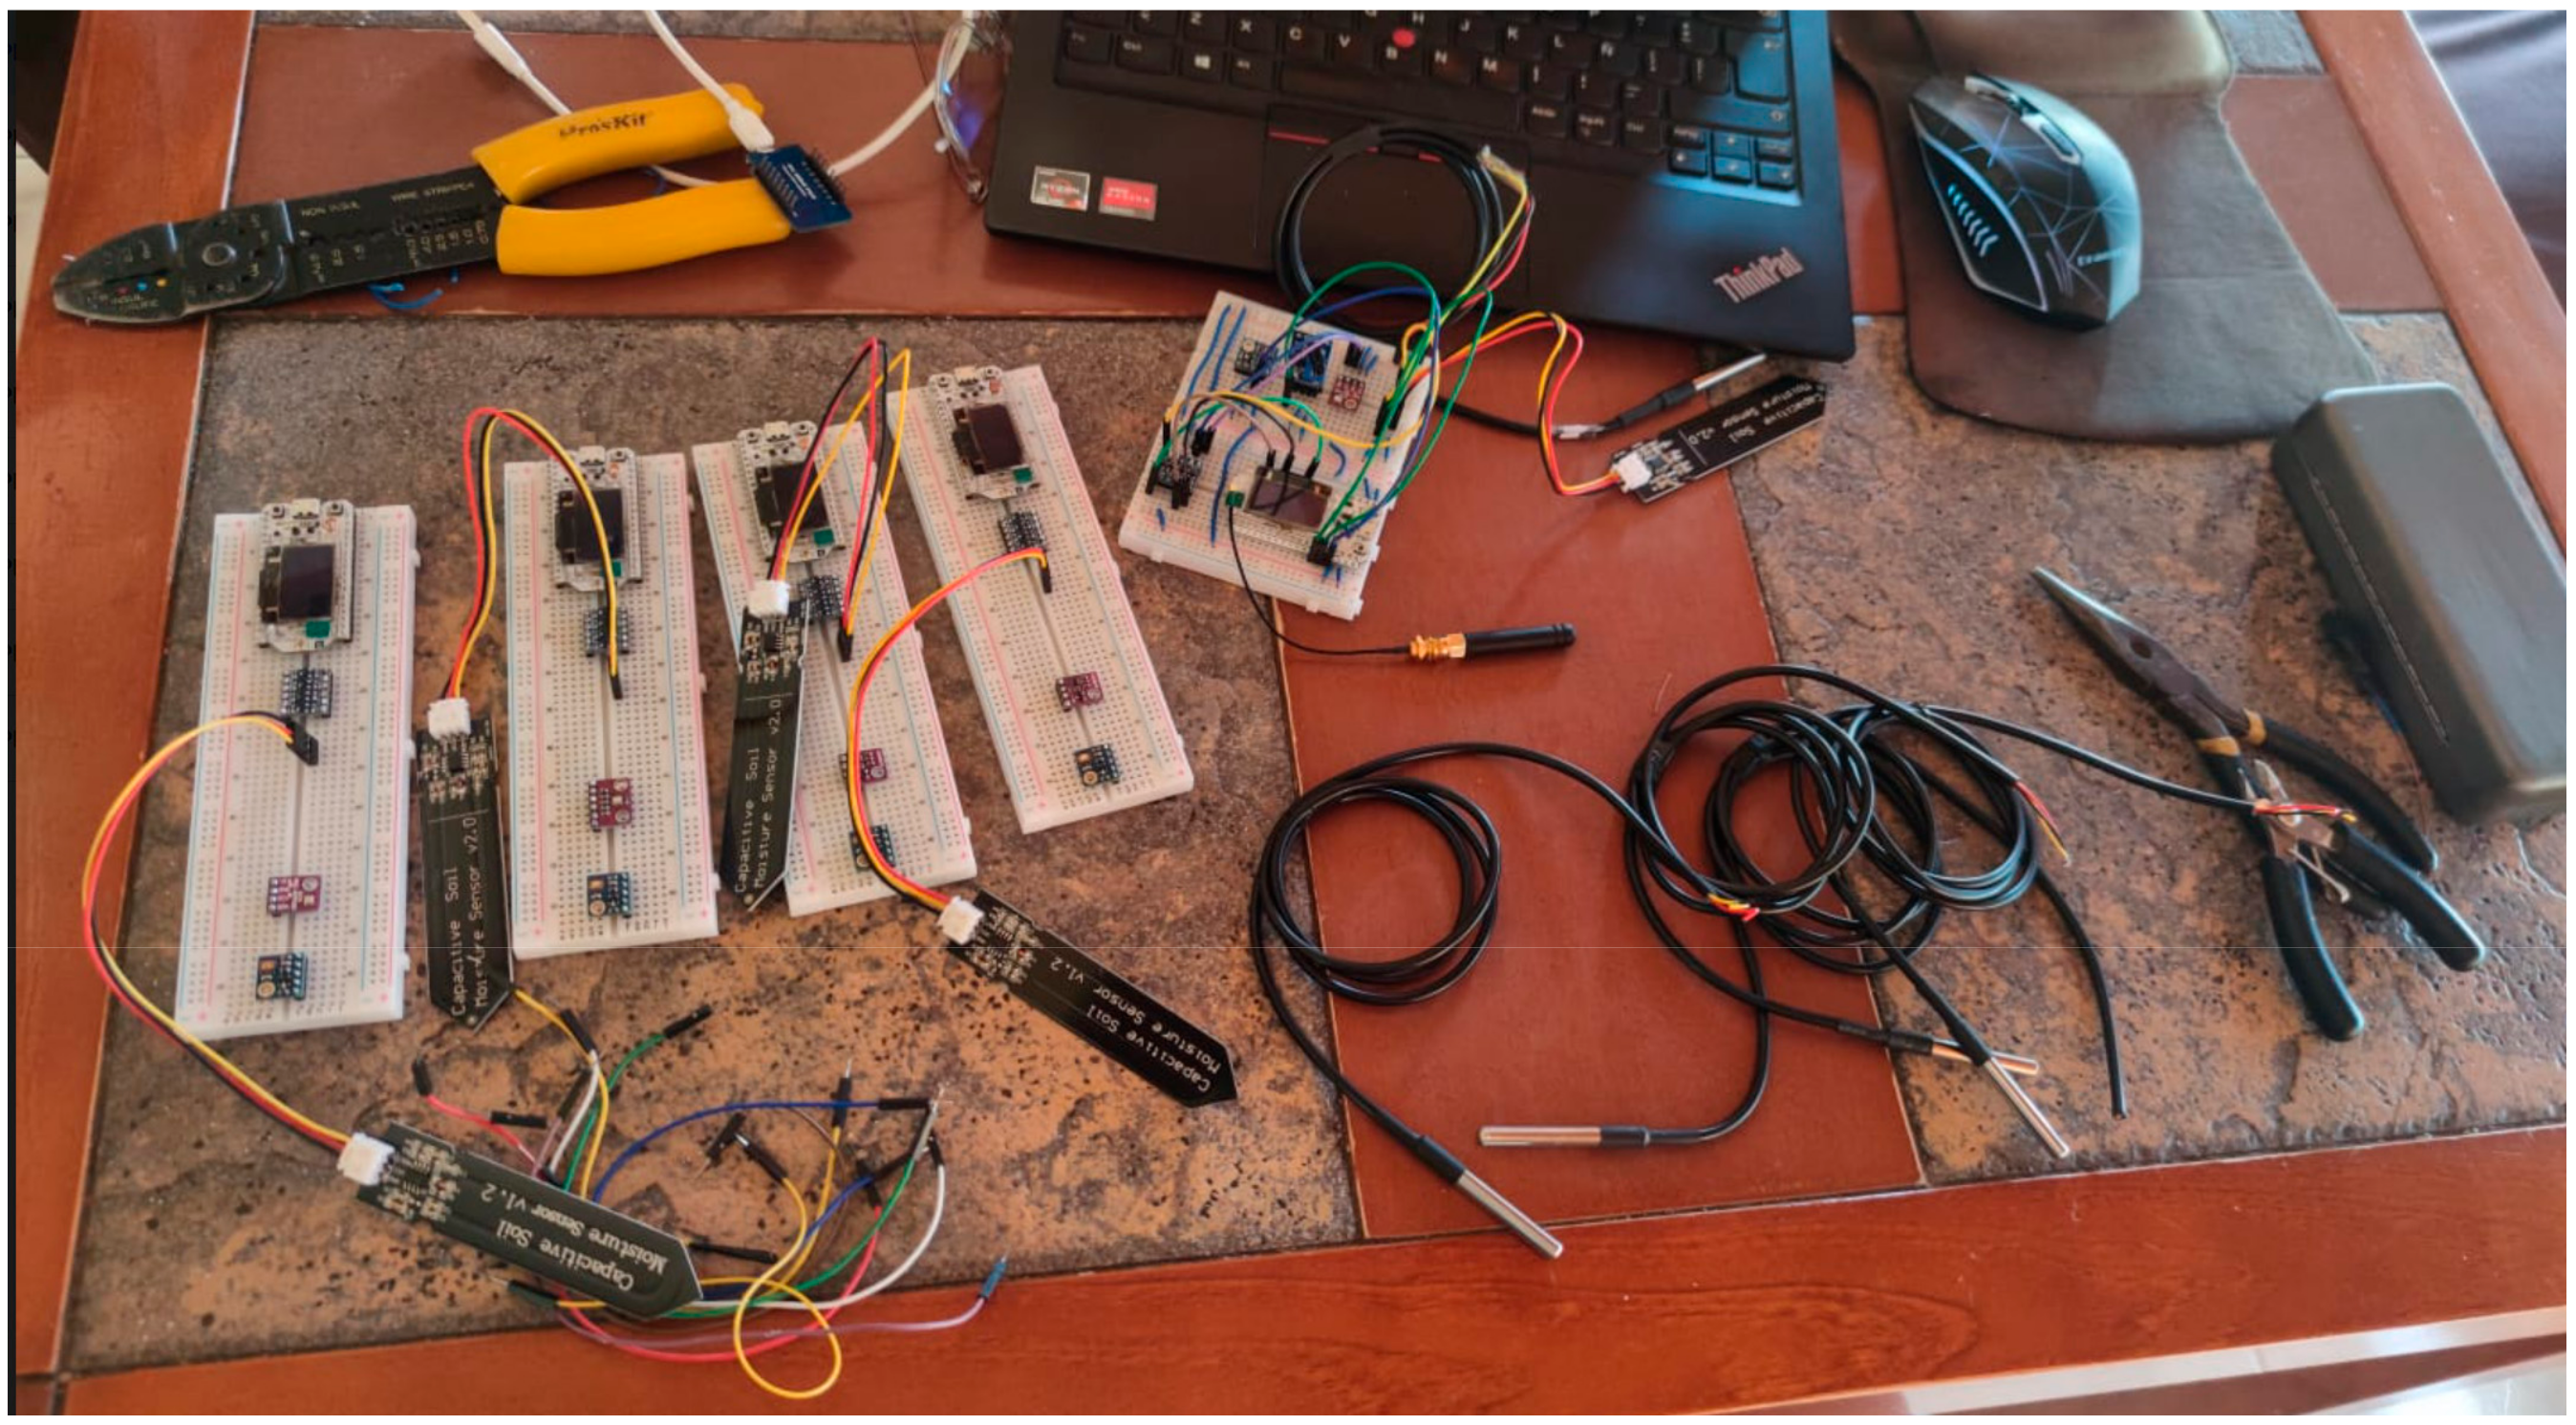
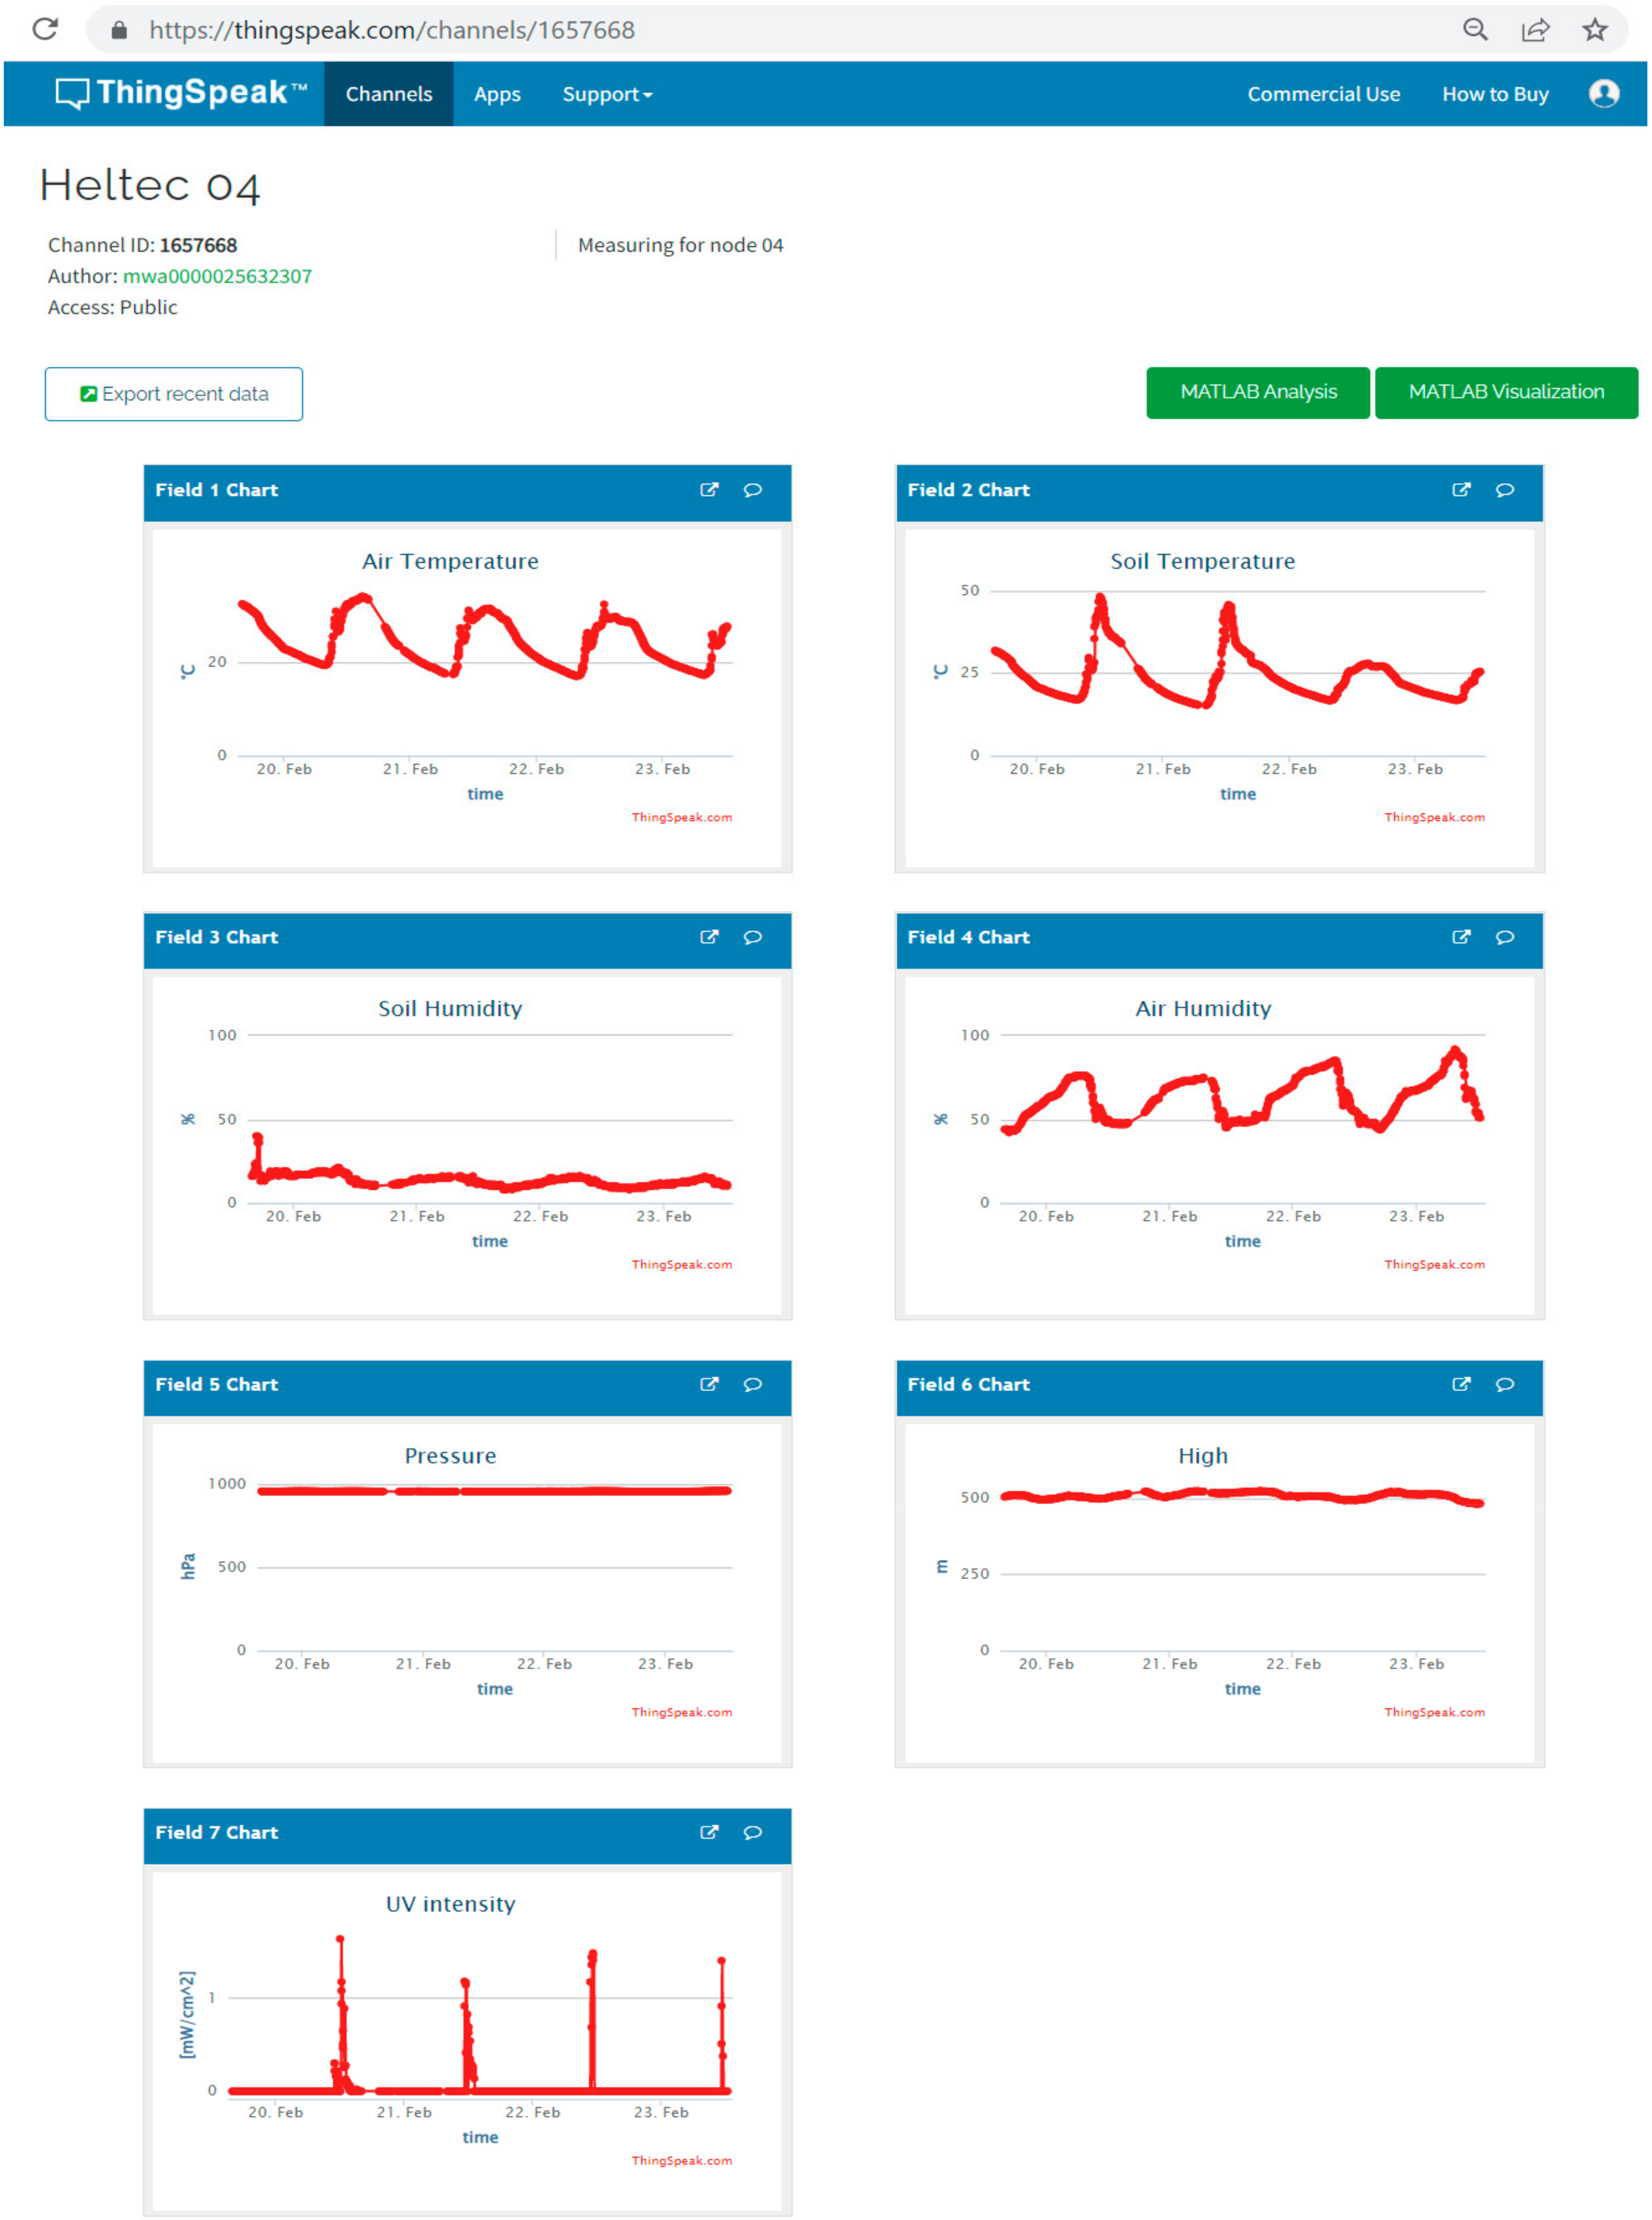
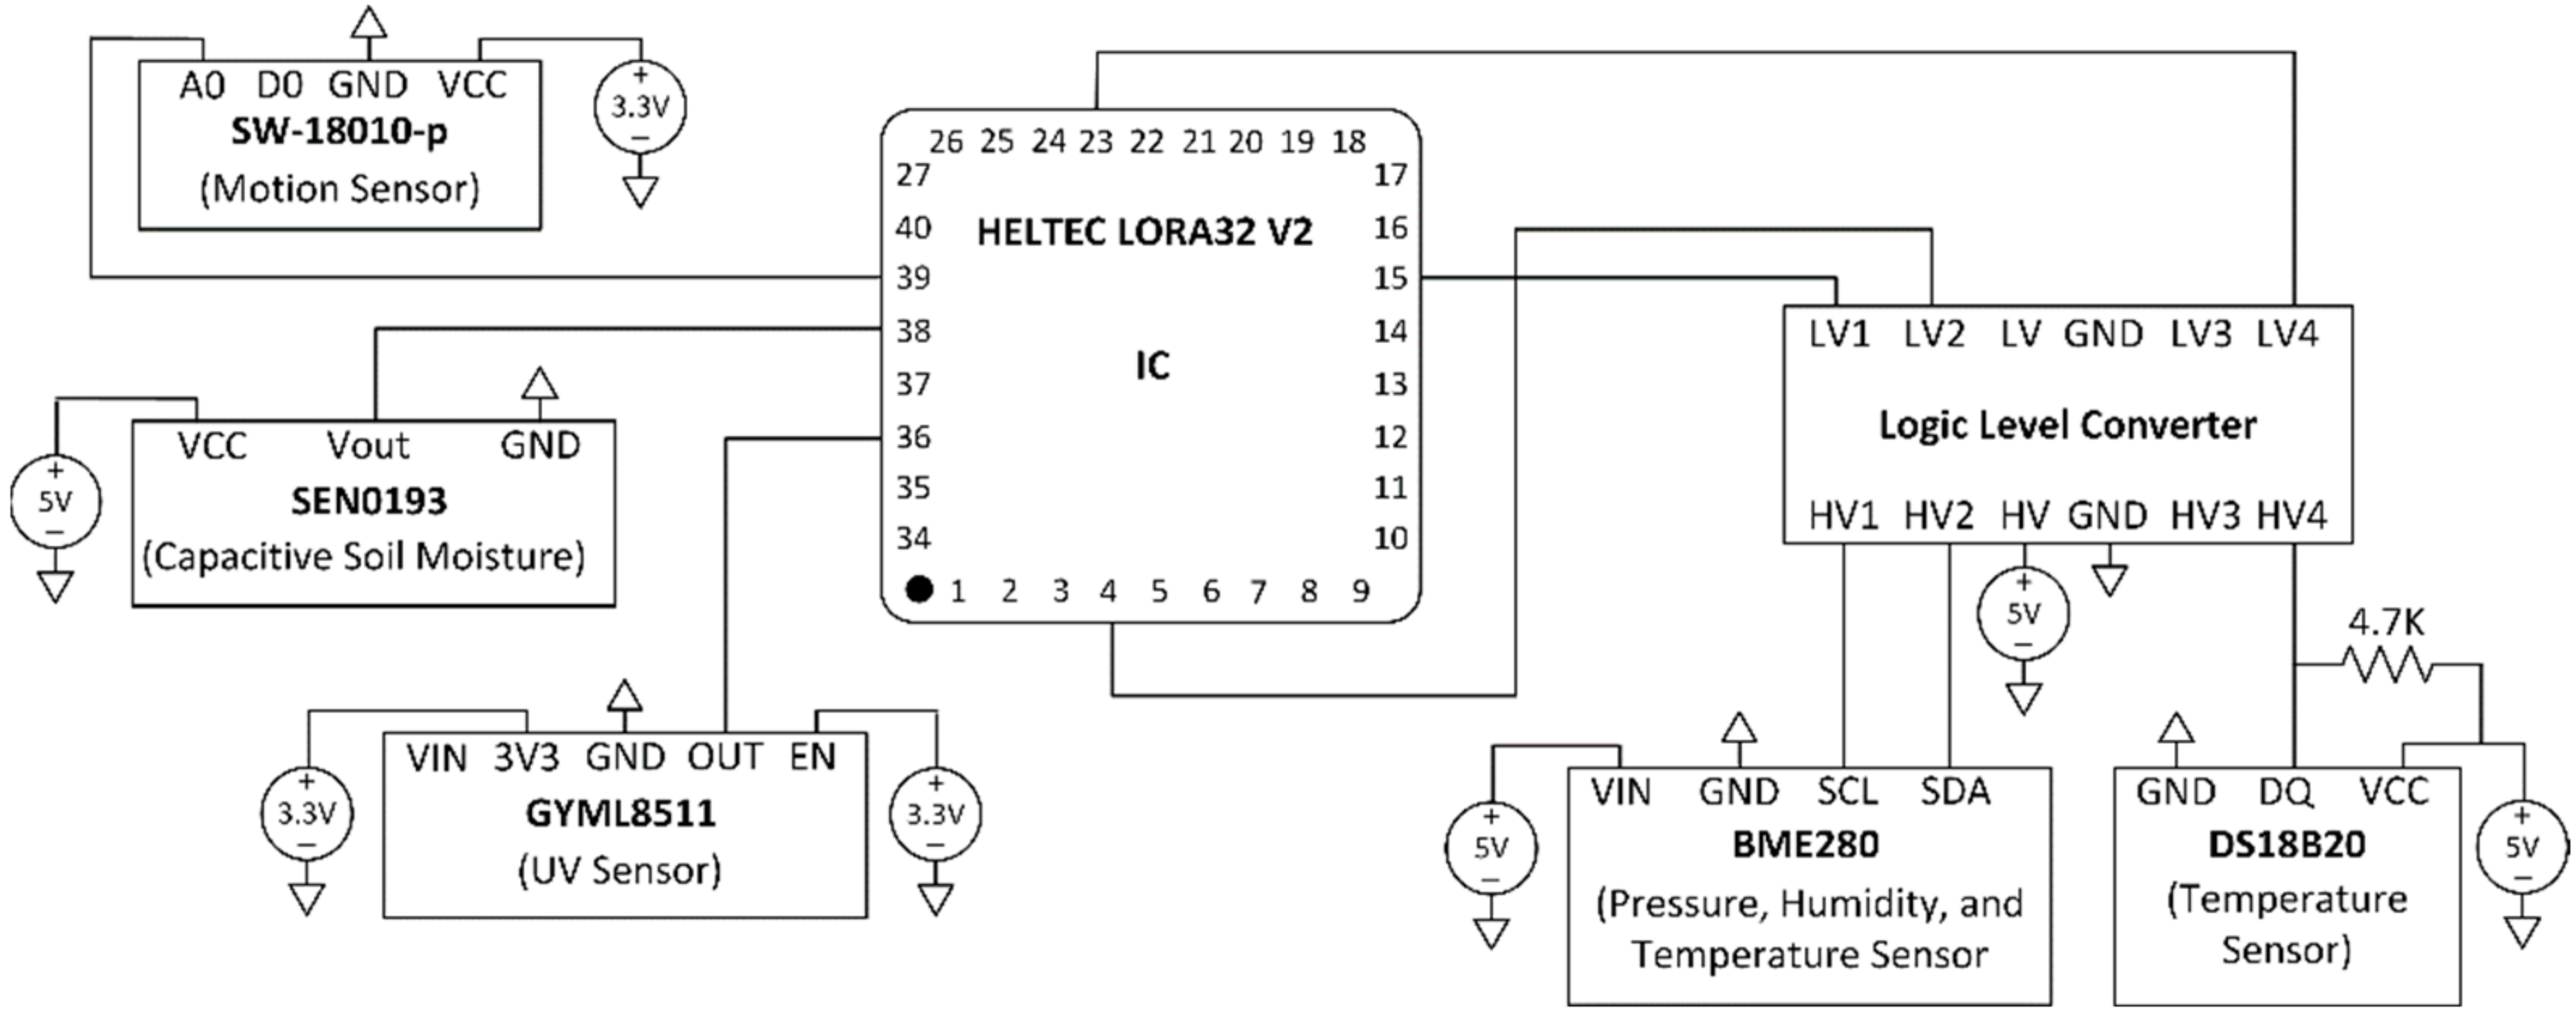
5. Implementation
6. Discussion
- Propose IoT-based architecture consisting of four layers: farm perception layer, sensors and actuators layer, communication network layer, and application layer.
- Present a complete system architecture, components, interconnections, and detailed implementation of the proposed solution.
- Design, prototype and implement LoRa-based platform using low-cost devices that enable GPS LoRa tracking (Farm Tracker) and remote real-time monitoring of ambient and soil conditions.
- All the components have been acquired and purchased from the Chilean market.
- The platform allows the integration of new sensor nodes as well as data visualization.
- The system could be adjusted to collect data locally in a local database without the need to access the internet.
- The current cost of the sensor node is 53,500 CLP.
- The ongoing research work aims to:
- Develop the energy harvest module using a small solar panel to support the autonomous operation of the developed sensor nodes for remote real-time monitoring of ambient and soil conditions.
- Add more low-cost sensors to the current prototype, such as wind speed and wind direction.
- Enable notification for critical situations and abnormal values (sudden change from the rated values) as well as advanced data processing techniques. Such information will help to improve farm operation and productivity.
- Integrate the monitoring data collected from moving nodes such as drones and unmanned ground vehicles (UGV).
7. Conclusions
Author Contributions
Funding
Institutional Review Board Statement
Informed Consent Statement
Data Availability Statement
Acknowledgments
Conflicts of Interest
Nomenclature
| IoT | Internet of Things |
| REST | Representational State Transfer |
| API | Application Programming Interface |
| TCP | Transmission Control Protocol |
| LoRaWAN | LoRa Wide Area Network |
| RSSI | Received Signal Strength Indicator |
| UAV | Unmanned Aerial Vehicle |
| LoRa | Long Range |
| LPWAN | Low Power Wide Area Network |
| NB-IoT | Narrowband-IoT |
| GPS | Global Position System |
| DR | Delivery Ratio |
| EC | Energy Consumption |
| SF | Spreading Factor |
| ADR | Adaptive Data Rate |
| CSS | Chirp Spread Spectrum |
| TTN | The Things Network |
| SNR | Signal to Noise Ratio |
References
- Chilean Agriculture Overview, Office of Agricultural Studies and Policies (ODEPA), Chilean Ministry of Agriculture. 2019. Available online: https://www.odepa.gob.cl/wp-content/uploads/2019/09/panorama2019Final.pdf (accessed on 10 January 2021).
- Lowder, S.K.; Skoet, J.; Raney, T. The Number, Size, and Distribution of Farms, Smallholder Farms, and Family Farms Worldwide. World Dev. 2016, 87, 16–29. [Google Scholar] [CrossRef] [Green Version]
- Grimblatt, V. IoT for Agribusiness: An overview. In Proceedings of the 2020 IEEE 11th Latin American Symposium on Circuits & Systems (LASCAS), San Jose, Costa Rica, 25–28 February 2020; pp. 1–4. [Google Scholar]
- Pylianidis, C.; Osinga, S.; Athanasiadis, I.N. Introducing digital twins to agriculture. Comput. Electron. Agric. 2021, 184, 105942. [Google Scholar] [CrossRef]
- Talavera, J.M.; Tobón, L.E.; Gómez, J.A.; Culman, M.A.; Aranda, J.M.; Parra, D.T.; Quiroz, L.A.; Hoyos, A.; Garreta, L.E. Review of IoT applications in agro-industrial and environmental fields. Comput. Electron. Agric. 2017, 142, 283–297. [Google Scholar] [CrossRef]
- Farooq, M.S.; Riaz, S.; Abid, A.; Abid, K.; Naeem, M.A. A Survey on the Role of IoT in Agriculture for the Implementation of Smart Farming. IEEE Access 2019, 7, 156237–156271. [Google Scholar] [CrossRef]
- Sengupta, A.; Debnath, B.; Das, A.; De, D. FarmFox: A Quad-Sensor based IoT box for Precision Agriculture. IEEE Consum. Electron. Mag. 2021, 10, 63–68. [Google Scholar] [CrossRef]
- Citoni, B.; Fioranelli, F.; Imran, M.A.; Abbasi, Q.H. Internet of Things and LoRaWAN-Enabled Future Smart Farming. IEEE Internet Things Mag. 2019, 2, 14–19. [Google Scholar] [CrossRef] [Green Version]
- Ray, P.P. Internet of things for smart agriculture: Technologies, practices and future direction. J. Ambient Intell. Smart Environ. 2017, 9, 395–420. [Google Scholar] [CrossRef]
- Yim, D.; Chung, J.; Cho, Y.; Song, H.; Jin, D.; Kim, S.; Ko, S.; Smith, A.; Riegsecker, A. An experimental LoRa performance evaluation in tree farm. In Proceedings of the 2018 IEEE Sensors Applications Symposium (SAS), Seoul, Korea, 12–14 March 2018; pp. 1–6. [Google Scholar]
- Perez-Exposito, J.P.; Fernandez-Carames, T.M.; Fraga-Lamas, P.; Castedo, L. An IoT Monitoring System for Precision Viticulture. In Proceedings of the 2017 IEEE International Conference on Internet of Things (iThings) and IEEE Green Computing and Communications (GreenCom) and IEEE Cyber, Physical and Social Computing (CPSCom) and IEEE Smart Data (SmartData), Exeter, UK, 21–23 June 2017; pp. 662–669. [Google Scholar]
- Ferrández-Pastor, F.; García-Chamizo, J.; Nieto-Hidalgo, M.; Mora-Martínez, J. Precision Agriculture Design Method Using a Distributed Computing Architecture on Internet of Things Context. Sensors 2018, 18, 1731. [Google Scholar] [CrossRef] [Green Version]
- Islam, N.; Rashid, M.M.; Pasandideh, F.; Ray, B.; Moore, S.; Kadel, R. A Review of Applications and Communication Technologies for Internet of Things (IoT) and Unmanned Aerial Vehicle (UAV) Based Sustainable Smart Farming. Sustainability 2021, 13, 1821. [Google Scholar] [CrossRef]
- Prakosa, S.W.; Faisal, M.; Adhitya, Y.; Leu, J.-S.; Köppen, M.; Avian, C. Design and Implementation of LoRa Based IoT Scheme for Indonesian Rural Area. Electronics 2021, 10, 77. [Google Scholar] [CrossRef]
- Mekki, K.; Bajic, E.; Chaxel, F.; Meyer, F. A comparative study of LPWAN technologies for large-scale IoT deployment. ICT Express 2019, 5, 1–7. [Google Scholar] [CrossRef]
- Fernández-Ahumada, L.M.; Ramírez-Faz, J.; Torres-Romero, M.; López-Luque, R. Proposal for the Design of Monitoring and Operating Irrigation Networks Based on IoT, Cloud Computing and Free Hardware Technologies. Sensors 2019, 19, 2318. [Google Scholar] [CrossRef] [PubMed] [Green Version]
- Castillejo, P.; Johansen, G.; Cürüklü, B.; Bilbao-Arechabala, S.; Fresco, R.; Martínez-Rodríguez, B.; Pomante, L.; Rusu, C.; Martínez-Ortega, J.-F.; Centofanti, C.; et al. Aggregate Farming in the Cloud: The AFarCloud ECSEL project. Microprocess. Microsyst. 2020, 78, 103218. [Google Scholar] [CrossRef]
- Popović, T.; Latinović, N.; Pešić, A.; Zečević, Ž.; Krstajić, B.; Djukanović, S. Architecting an IoT-enabled platform for precision agriculture and ecological monitoring: A case study. Comput. Electron. Agric. 2017, 140, 255–265. [Google Scholar] [CrossRef]
- Kalatzis, N.; Marianos, N.; Chatzipapadopoulos, F. IoT and data interoperability in agriculture: A case study on the gaiasense TM smart farming solution. In Proceedings of the 2019 Global IoT Summit (GIoTS), Aarhus, Denmark, 17–21 June 2019; pp. 1–6. [Google Scholar]
- Gupta, M.; Abdelsalam, M.; Khorsandroo, S.; Mittal, S. Security and Privacy in Smart Farming: Challenges and Opportunities. IEEE Access 2020, 8, 34564–34584. [Google Scholar] [CrossRef]
- Farooq, M.S.; Sohail, O.O.; Abid, A.; Rasheed, S. A Survey on the Role of IoT in Agriculture for the Implementation of Smart Livestock Environment. IEEE Access 2022, 10, 9483–9505. [Google Scholar] [CrossRef]
- Haxhibeqiri, J.; De Poorter, E.; Moerman, I.; Hoebeke, J. A Survey of LoRaWAN for IoT: From Technology to Application. Sensors 2018, 18, 3995. [Google Scholar] [CrossRef] [PubMed] [Green Version]
- Slabicki, M.; Premsankar, G.; Di Francesco, M. Adaptive configuration of lora networks for dense IoT deployments. In Proceedings of the NOMS 2018—2018 IEEE/IFIP Network Operations and Management Symposium, Taipei, Taiwan, 23–27 April 2018; pp. 1–9. [Google Scholar]
- Gallardo, J.L.; Ahmed, M.A.; Jara, N. LoRa IoT-Based Architecture for Advanced Metering Infrastructure in Residential Smart Grid. IEEE Access 2021, 9, 124295–124312. [Google Scholar] [CrossRef]
- FLoRa (Framework for LoRa). Available online: https://flora.aalto.fi/ (accessed on 1 July 2021).
- Ampatzidis, Y.; Tan, L.; Haley, R.; Whiting, M.D. Cloud-based harvest management information system for hand-harvested specialty crops. Comput. Electron. Agric. 2016, 122, 161–167. [Google Scholar] [CrossRef] [Green Version]
- Dragino, DLOS8 LoRa Gateway User Manuel. 2021. Available online: https://www.dragino.com/downloads/index.php?dir=LoRa_Gateway/DLOS8/ (accessed on 1 July 2021).
- Fargnoli, M.; Lombardi, M. Safety Vision of Agricultural Tractors: An Engineering Perspective Based on Recent Studies (2009–2019). Safety 2019, 6, 1. [Google Scholar] [CrossRef] [Green Version]


| Ref. | Type | Perception Layer | Network Layer | Application Layer | Contribution |
|---|---|---|---|---|---|
| [5] | Survey | Yes | Yes | Yes | The paper reviewed different IoT applications in agro-industrial and environmental fields, identifying the application areas (monitoring, control, prediction, and logistics), trends, architectures, and open challenges, covering the time period from 2006 to 2016. |
| [6] | Survey | Yes | Yes | Yes | The paper presented a comprehensive survey on the state-of-the-art for the role of IoT in agriculture, covering network architectures, technologies, and protocols. Furthermore, the work discussed the agriculture policies for the standardization of IoT-based agriculture and open research issues had been discussed. |
| [7] | Technical | Yes | Wi-Fi | Yes | The paper developed a device named “FarmFox” to monitor soil health. The device uses REST API and TCP protocol. Based on Wi-Fi technology, different monitoring parameters were collected for soil conditions such as pH, turbidity, soil moisture, and temperature. |
| [8] | Survey | Yes | LoRaWAN | Yes | The paper presented the applications of LoRaWAN for future smart farming. The paper covered the basic applications of LoRaWAN for smart farms and highlighted the technology limits. |
| [9] | Survey | Yes | Yes | Yes | The paper reviewed various potential applications and challenges associated with IoT in agriculture and farming applications. Various case studies were presented and explored regarding communication networks, cloud services, and hardware platforms. |
| [10] | Technical | Yes | LoRaWAN | Yes | The paper studied the impact of the physical layer parameters on the performance of the LoRa network with respect to range, reliability, and RSSI in a tree farm located in Indiana, USA. |
| [11] | Technical | Yes | Wi-Fi | Yes | The paper presented a hardware and software system for remote monitoring of vineyards. Two different nodes were developed and deployed to collect atmospheric data and soil parameters in Ribeira Sacra, Spain, based on Wi-Fi technology. |
| [12] | Technical | Yes | Wi-Fi | Yes | The paper proposed a user centered design model where each farmer decides their own installations. The experimental work considered a greenhouse with two levels of communication and processing nodes (edge and fog). |
| [13] | Survey | Yes | Yes | Yes | The paper presented the major applications of IoT and unmanned aerial vehicles (UAV) in smart farming, highlighting connectivity requirements, network functionalities, and communication technologies. |
| [14] | Technical | Yes | LoRaWAN | No | The paper presented an IoT scheme based on LoRa technology for long-range communication in the agriculture area. The monitoring parameters are humidity, temperature, soil pH, and soil moisture. |
| [15] | Survey | No | Sigfox LoRaWANNB-IoT | No | The paper presented a comparative study for LPWAN technologies such as Sigfox, LoRa, and NB-IoT with respect to range, coverage, deployment, cost, battery life, latency, and scalability. |
| [16] | Technical | Yes | LoRaWAN | Yes | The paper presented a low-cost solution for an automatic irrigation system. The system consists of a LoRaWAN network between sensor nodes and a local gateway with an internet connection through the Sigfox network. |
| [17] | Technical | Yes | LoRaWAN | Yes | The paper describes the AFarCloud project that aims to support the integration and cooperation of the agriculture system to offer better productivity, efficiency, food quality, and animal health. |
| [18] | Technical | Yes | 3G | Yes | The paper presented a case study for a private IoT-based architecture aimed at the use of research and development for precision agriculture and ecological domains. |
| Present Work | Technical | Yes | LoRaWAN | Yes | The paper developed a hardware and software platform for remote monitoring of large-scale agriculture farms based on LoRaWAN technology. Different nodes have been developed and deployed to collect atmospheric data, soil parameters and GPS locations in Universidad Técnica Federico Santa María, Valparaiso, Chile. |
| Parameter | Value |
|---|---|
| Carrier Frequency | 915 MHz |
| Bandwidth | 125 kHz |
| Coding Rate | 4/8 |
| Spreading Factor | 7 up to 12 |
| Transmission Power | 2 dBm up to 14 dBm |
| Path Loss | 3.57 dB |
| Path Loss Distance | 40 m |
| Path Loss Exponent | 2 |
| Number of Gateways | 1 |
| Number of Nodes | 100, 200, 300, 400 |
| Payload Size (end-devices) | 20 Bytes |
| Payload Size (control) | 15 Bytes |
| Packets sent | {28, 56} per day |
| Name | Specifications |
|---|---|
| Processor | 400 MHz AR9331, 64 MB RAM, 16 MB Flash |
| Interfaces | 10 M/100 M RJ45 Ports x 2 Wi-Fi 802.11 b,g,n LoRaWAN Wireless |
| LoRa Interface | 1 × SX1301 + 2 × 1257 |
| Power supply | 12 V DC |
| Device Number | Device Brand | Device Model | GNSS |
|---|---|---|---|
| Device 1 (D1) | SMARTWATCH | AMAZFIT PACE | GPS, GLONASS |
| Device 2 (D2) | LG | K41S | GPS, A-GPS, GLONASS, BeiDou |
| Device 3 (D3) | SAMSUNG | S20 | GPS, A-GPS, GLONASS, BeiDou, Galileo |
| Device 4 (D4) | XIAOMI | POCO F3 | A-GPS, GLONASS, BeiDou, Galileo, QZSS, NavIC |
| Parameter | Value | Parameter | Value |
|---|---|---|---|
| Carrier Frequency | 915 MHz | Spreading Factor | 7 |
| Bandwidth | 125 kHz | Number of Gateways | 1 |
| Coding Rate | 4/5 | Number of Nodes | 4 |
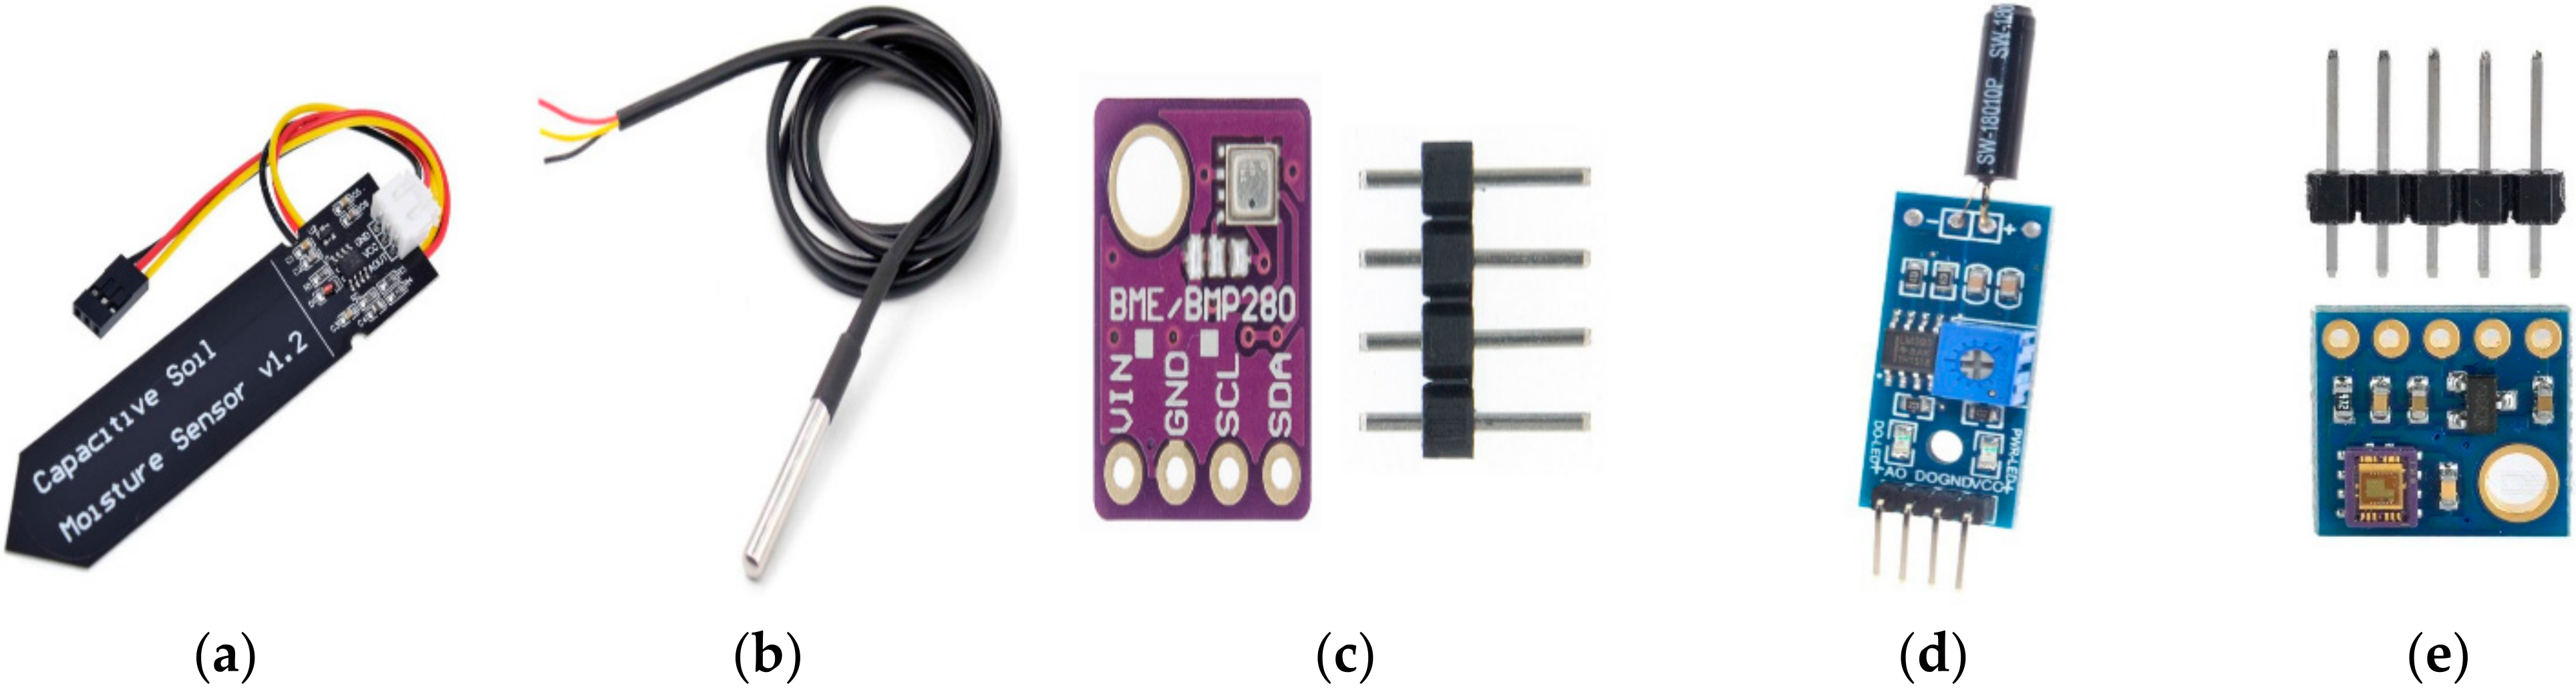
| Target | Sensor Name/Number | Sensor Type | Specifications |
|---|---|---|---|
| Soil Parameters | Capacitive Soil Moisture v1.2 * | Soil moisture | 3-Pin Sensor interface, Analog output, Operating voltage: 3.3–5.5 V |
| DS18B20 *** | Temperature | Range: −55 to 125 °C, Accuracy: ±0.5 °C from −10 °C to +85 °C, Operating voltage: 3.3–5.5 V | |
| Ambient Parameters | BME280 ** | Temperature Pressure Relative Humidity | Range: −40 °C to 85 °C, Resolution: 0.01 °C, Accuracy: 1 °C Range: 300 to 1100 hPa, Resolution: 0.16 Pa, Absolute Accuracy: 1 hPa Range: 0–100% RH, Accuracy: ±3% |
| SW-18010-P **** | Vibration | 4-Pin Sensor interface, Digital output, Operating voltage: 3.3–5 V | |
| GYML8511 ***** | Ultraviolet | Detection wavelength band 280 nm to 390 nm, Analog output, Operating voltage: 3–5 V |
Publisher’s Note: MDPI stays neutral with regard to jurisdictional claims in published maps and institutional affiliations. |
© 2022 by the authors. Licensee MDPI, Basel, Switzerland. This article is an open access article distributed under the terms and conditions of the Creative Commons Attribution (CC BY) license (https://creativecommons.org/licenses/by/4.0/).
Share and Cite
Ahmed, M.A.; Gallardo, J.L.; Zuniga, M.D.; Pedraza, M.A.; Carvajal, G.; Jara, N.; Carvajal, R. LoRa Based IoT Platform for Remote Monitoring of Large-Scale Agriculture Farms in Chile. Sensors 2022, 22, 2824. https://doi.org/10.3390/s22082824
Ahmed MA, Gallardo JL, Zuniga MD, Pedraza MA, Carvajal G, Jara N, Carvajal R. LoRa Based IoT Platform for Remote Monitoring of Large-Scale Agriculture Farms in Chile. Sensors. 2022; 22(8):2824. https://doi.org/10.3390/s22082824
Chicago/Turabian StyleAhmed, Mohamed A., Jose Luis Gallardo, Marcos D. Zuniga, Manuel A. Pedraza, Gonzalo Carvajal, Nicolás Jara, and Rodrigo Carvajal. 2022. "LoRa Based IoT Platform for Remote Monitoring of Large-Scale Agriculture Farms in Chile" Sensors 22, no. 8: 2824. https://doi.org/10.3390/s22082824
APA StyleAhmed, M. A., Gallardo, J. L., Zuniga, M. D., Pedraza, M. A., Carvajal, G., Jara, N., & Carvajal, R. (2022). LoRa Based IoT Platform for Remote Monitoring of Large-Scale Agriculture Farms in Chile. Sensors, 22(8), 2824. https://doi.org/10.3390/s22082824